


Features
- 4 Unique slides
- Fully editable and easy to edit in Microsoft Powerpoint, Keynote and Google Slides
- 16:9 widescreen layout
- Clean and professional designs
- Export to JPG, PDF or send by email


Do you have any questions?
Recommend


6 slides
Environmental Scanning with PESTEL Model Presentation
Spot risks and opportunities early with the Environmental Scanning with PESTEL Model Presentation. Visually break down Political, Economic, Social, Technological, Environmental, and Legal factors using a modern, tree-style layout. Ideal for business forecasting, competitive analysis, or market entry reports. Easily customizable in PowerPoint, Canva, and Google Slides.


8 slides
Financial Growth Planning Presentation
Plan and track financial success with this Financial Growth Planning template. This visually engaging slide features a stepwise roadmap with hexagonal icons, helping you outline budgeting, investments, and financial milestones in a clear and structured format. Perfect for financial analysts, business strategists, and executives, this slide is fully editable and compatible with PowerPoint, Keynote, and Google Slides.


24 slides
Djinn Brand Identity Presentation
Unleash the power of your brand with this sleek and modern presentation template! From brand identity components to target audience personas, this template covers everything you need to craft a cohesive and compelling brand strategy. Whether showcasing brand guidelines or success stories, it’s designed for maximum clarity and impact. Compatible with PowerPoint, Keynote, and Google Slides for effortless presentations.


10 slides
Project Management Stages
Master project management with our "Project Management Stages" template. This visually engaging presentation design effectively illustrates the project lifecycle across five key stages: Initiation, Planning, Execution, Monitoring, and Closure. Each stage is distinctively represented by a colored 3D block, visually stacked to highlight the progression and foundational importance of each phase. This clear, structured layout simplifies complex processes and emphasizes effective project management techniques. Ideal for project managers, team leaders, and educators, it serves as a vital tool for explaining workflows and responsibilities. Compatible with PowerPoint, Keynote, and Google Slides, this template is perfect for enhancing presentations on project planning and execution.


20 slides
Faelight Project Proposal Presentation
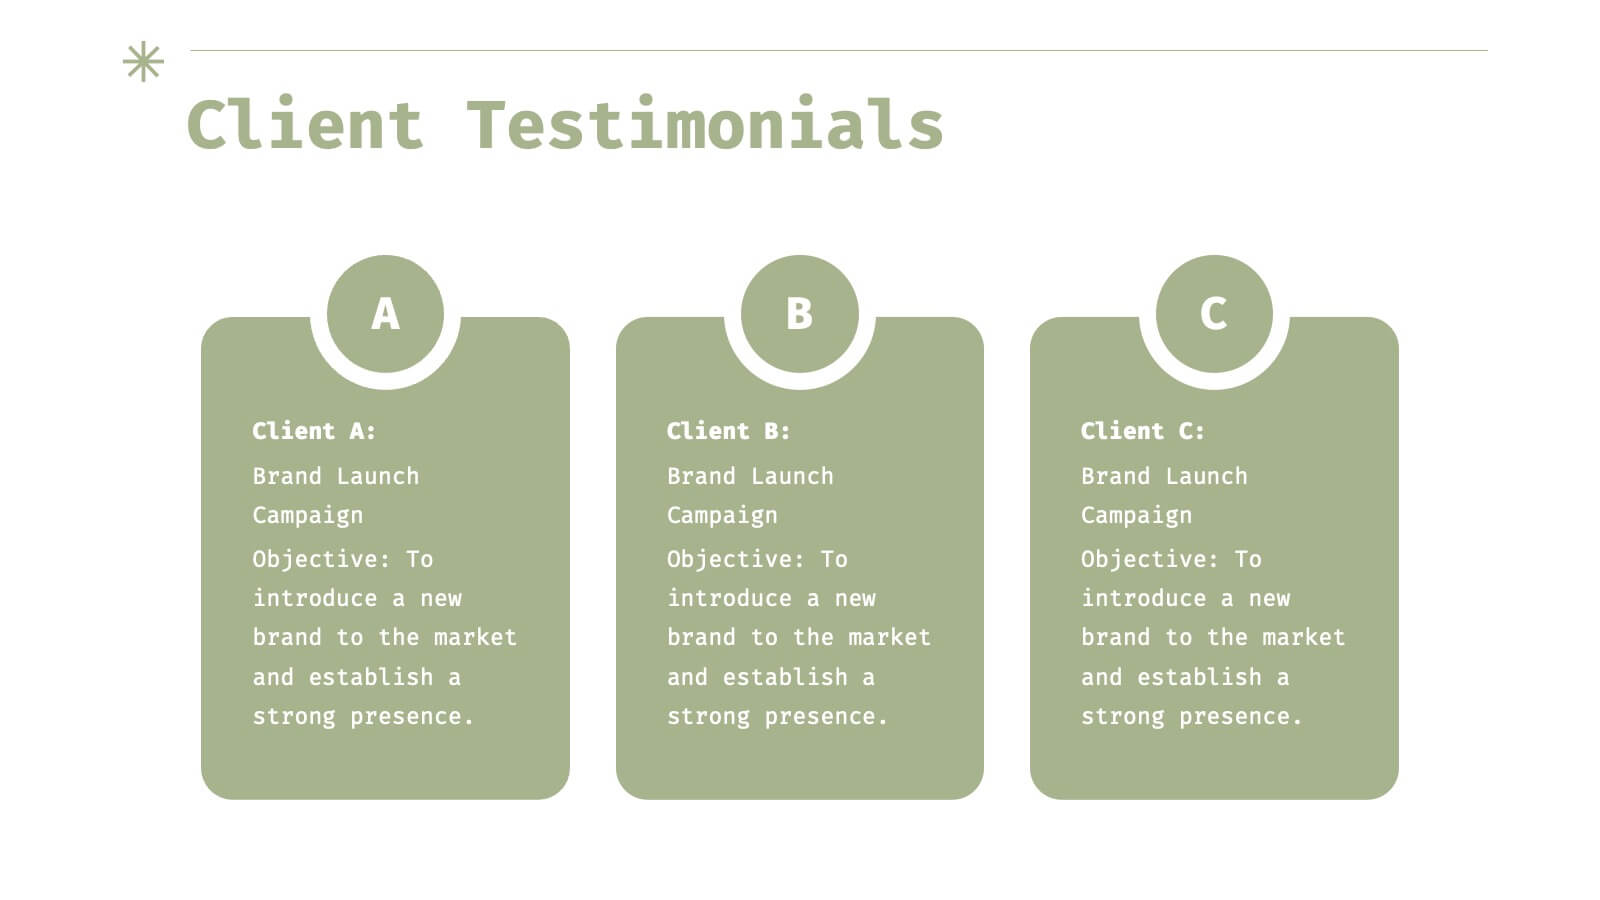
A professional project proposal template for showcasing company overview, objectives, scope of work, timelines, and budget breakdowns. Includes sections for client testimonials, pricing structures, and risk mitigation strategies. Fully customizable for various industries and ideal for pitching new projects. Compatible with PowerPoint, Keynote, and Google Slides for seamless presentations.


5 slides
Perspective of Economic Trends in Africa Map Presentation
Visualize key economic insights across Africa with this data-driven map layout. Use labeled progress bars and highlighted countries to present regional performance, sector growth, or market distribution. Fully editable in PowerPoint, Keynote, or Google Slides, this clean template is ideal for business reports, financial reviews, and investment-focused presentations.


7 slides
Market Research Data Insights
Present insights with impact using this Market Research Data Insights slide. Featuring six circular data points with icons and space for strategic commentary, it's ideal for showcasing key findings, trends, or survey results. Fully editable in PowerPoint, Keynote, and Google Slides for versatile use.


4 slides
Investment Analysis Finance Presentation
Target your financial insights with this Investment Analysis Finance Presentation. Designed with a bold bullseye diagram and four labeled pointers, this slide helps communicate core focus areas, ROI, risk zones, or asset distribution. Ideal for pitch decks, portfolio reviews, and financial reports. Fully editable in PowerPoint, Keynote, and Google Slides—perfect for analysts, investors, and finance professionals.


7 slides
Sports Illustrated Infographic Presentation
Sports are an important aspect of our lives that provide numerous physical, mental, social, and personal benefits. This sports infographic is designed to help you create an awesome visual content using all sorts of colorful images, charts and graphs that best describe your sports related project. This template is perfect if you need to share statistics and facts about sports. It contains 7 slides with colorful backgrounds, sport visualizations and an area for you to input your important data. This template is compatible with Powerpoint, keynote and google slides, perfect for your next project!


21 slides
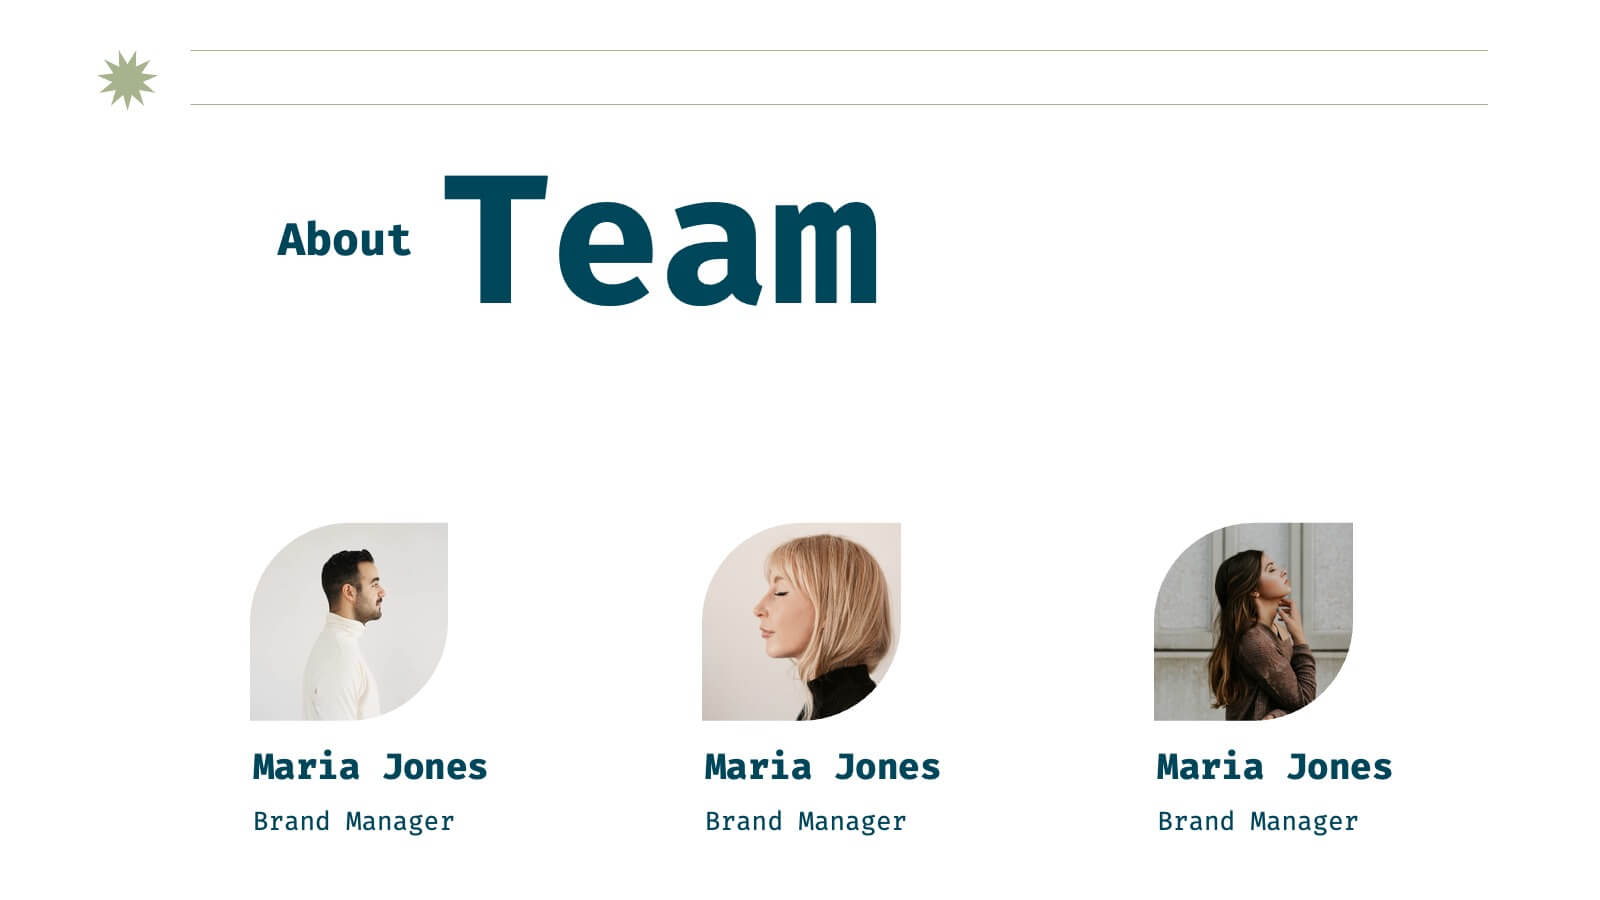
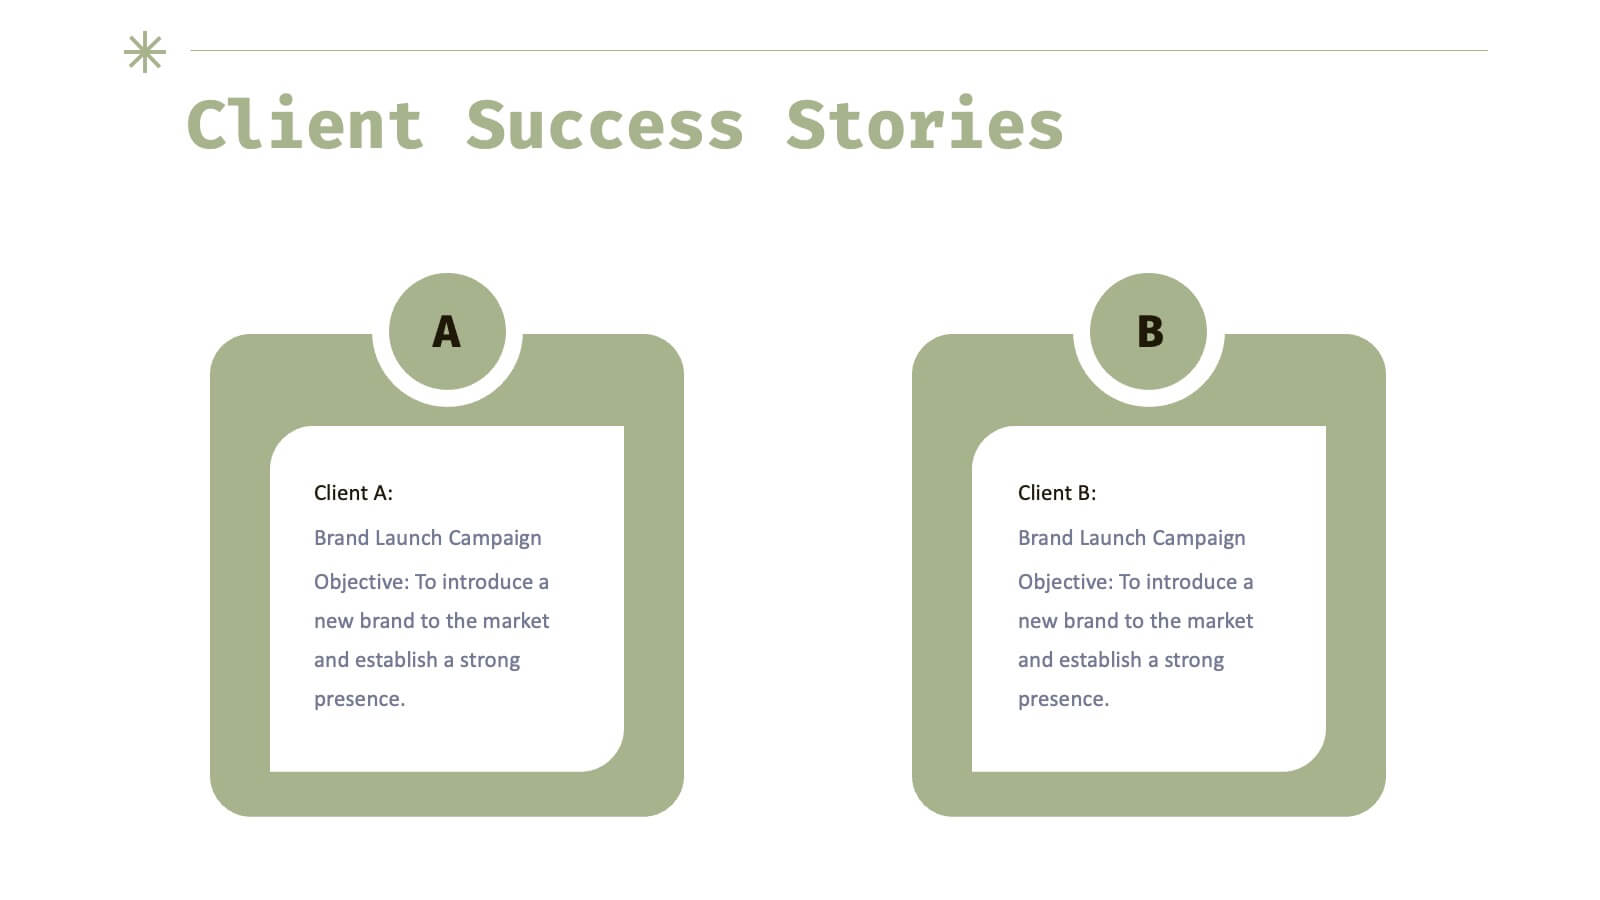
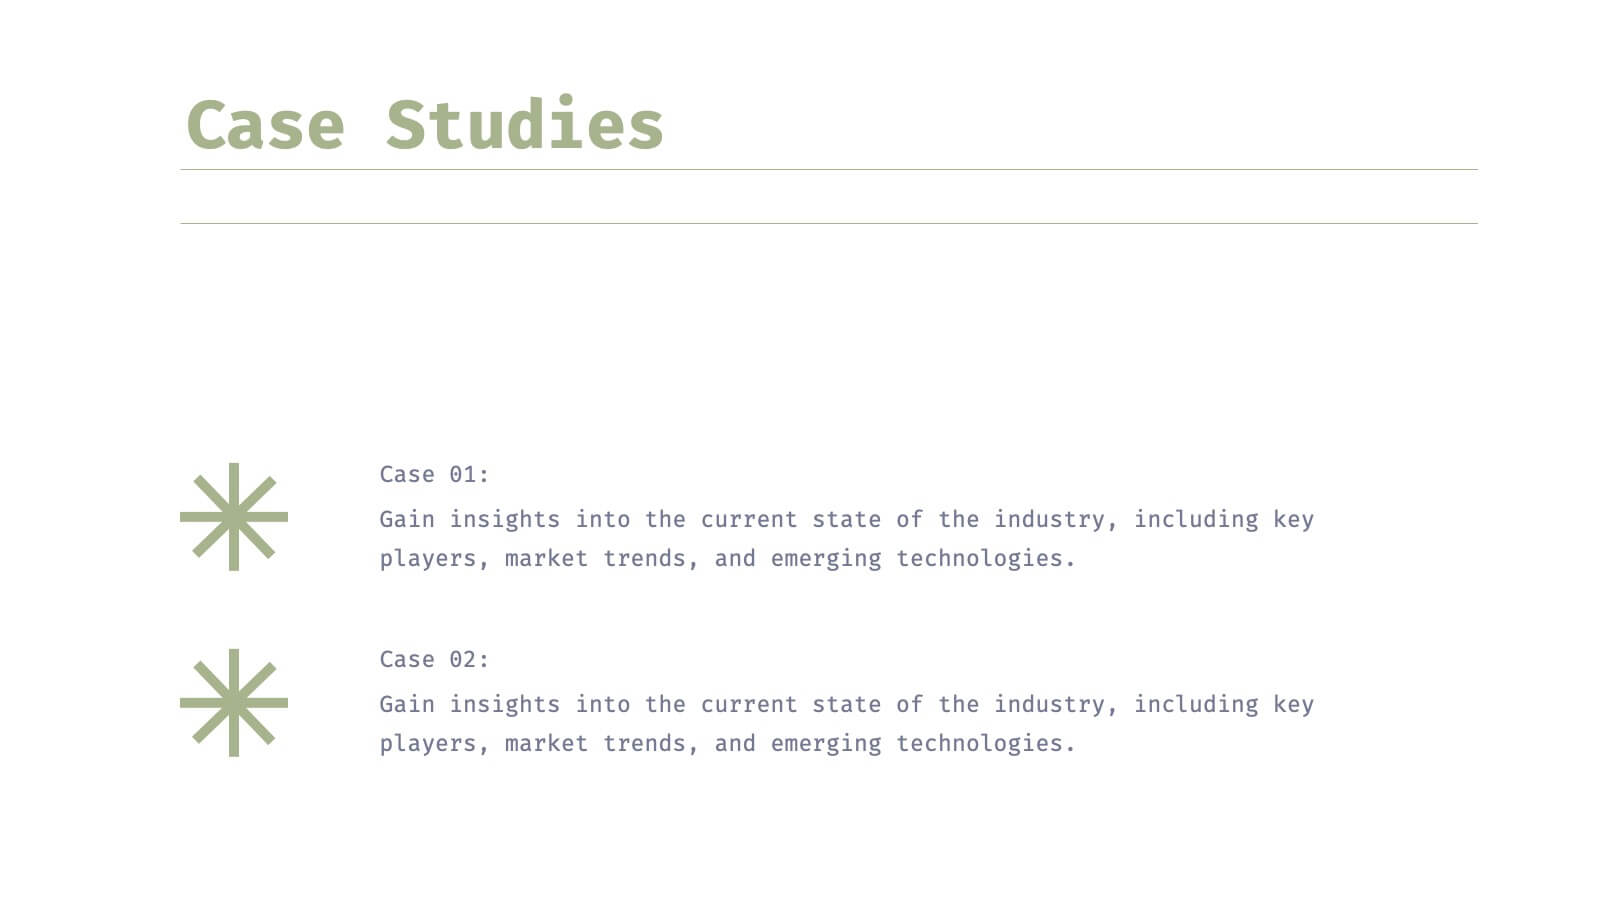
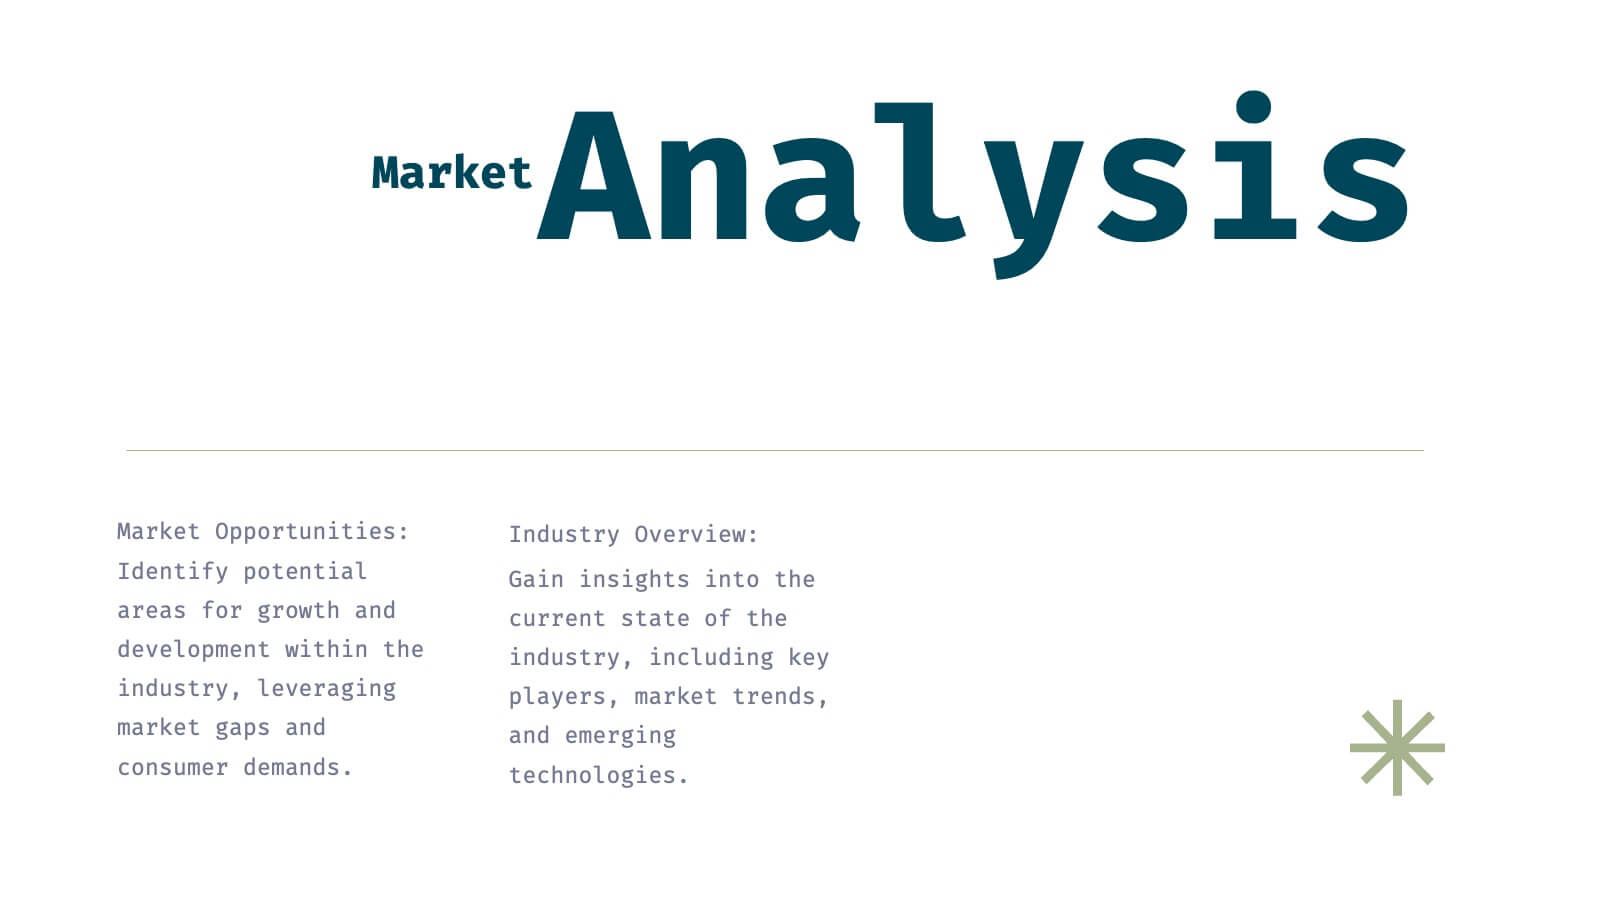
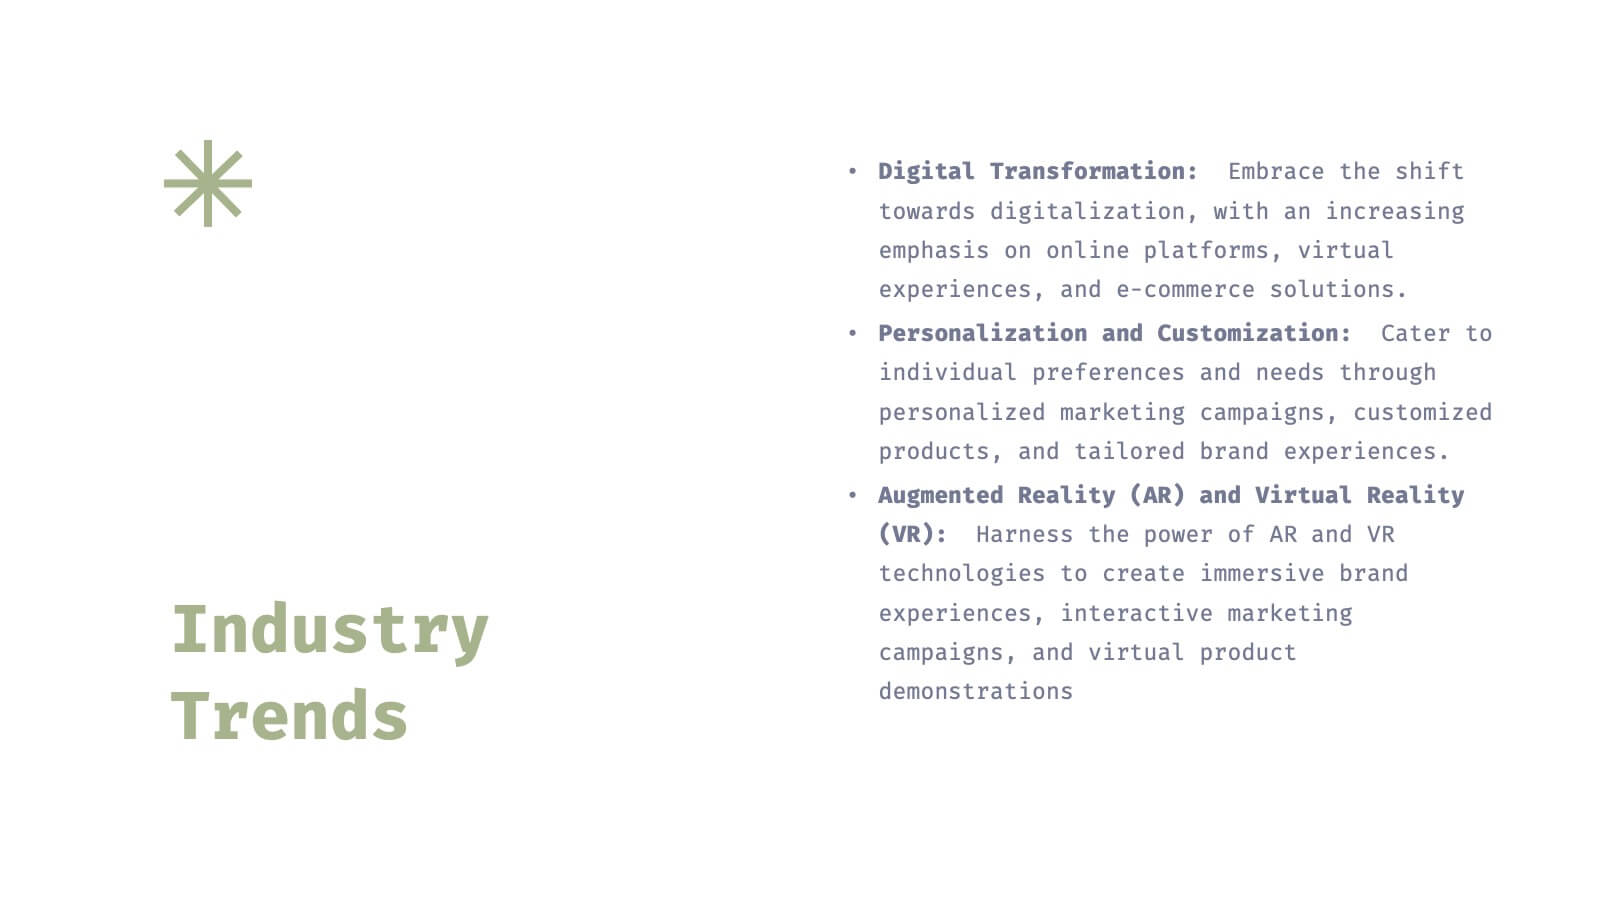
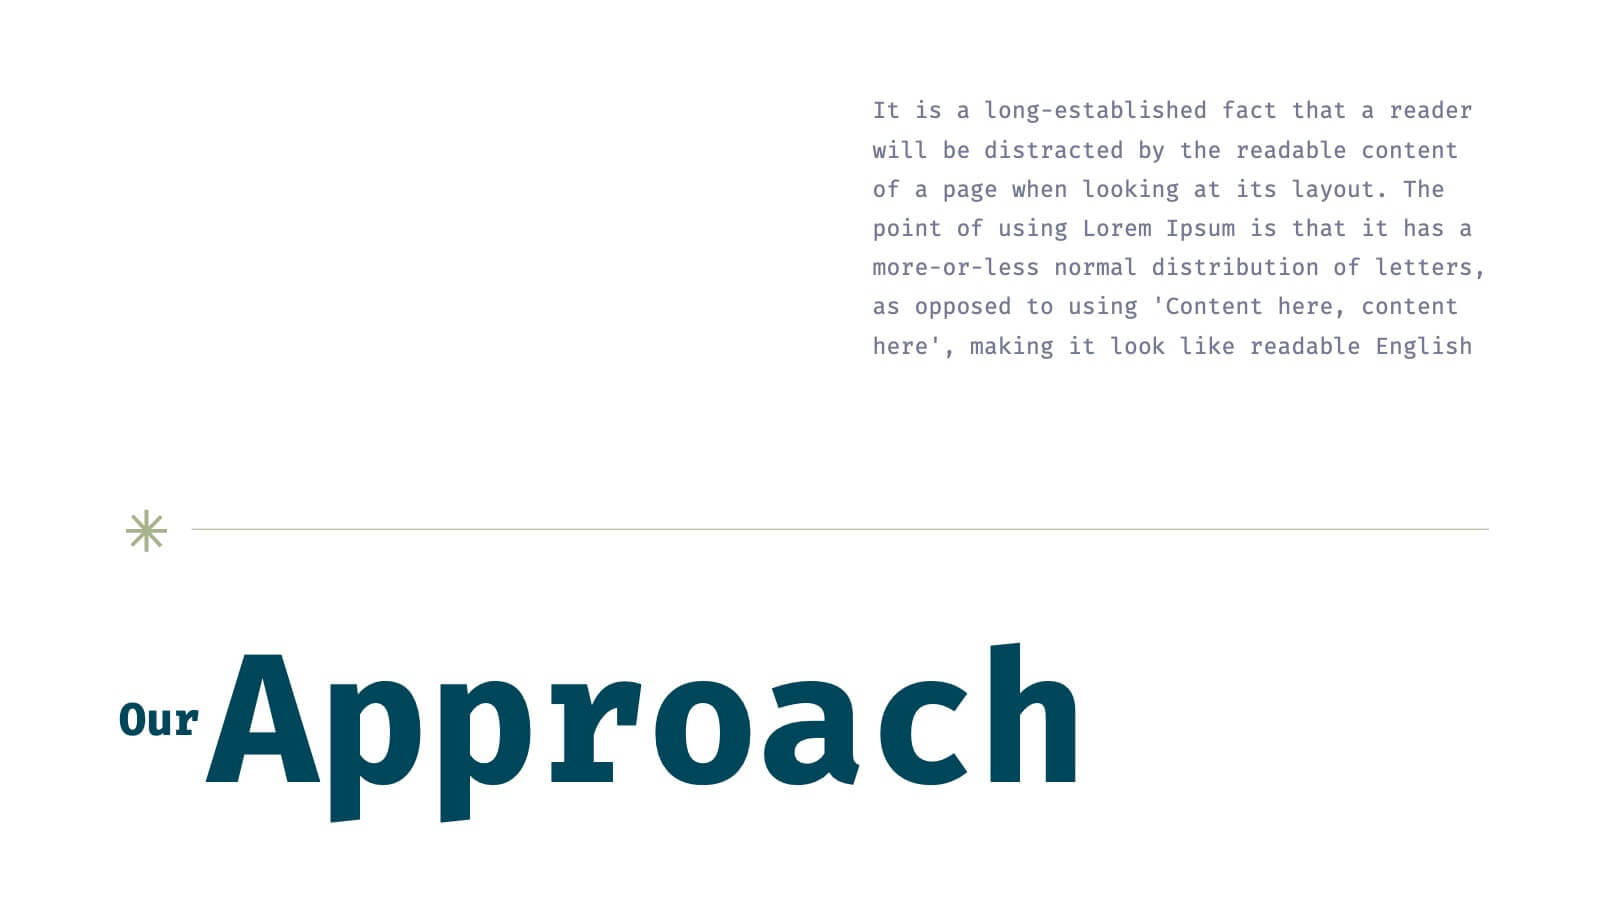
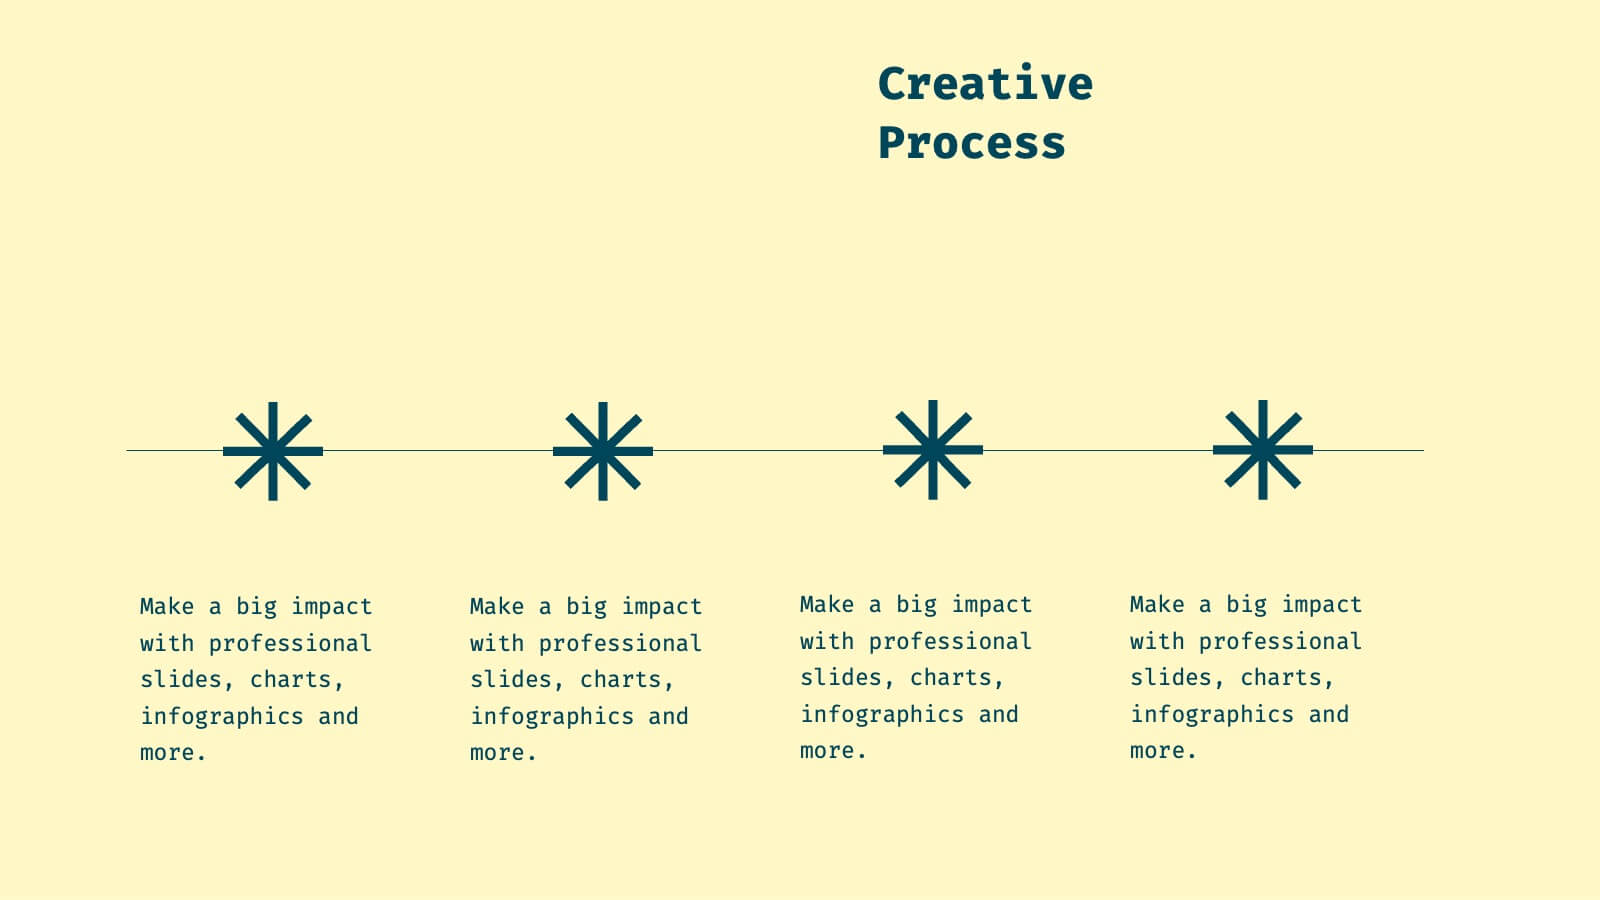
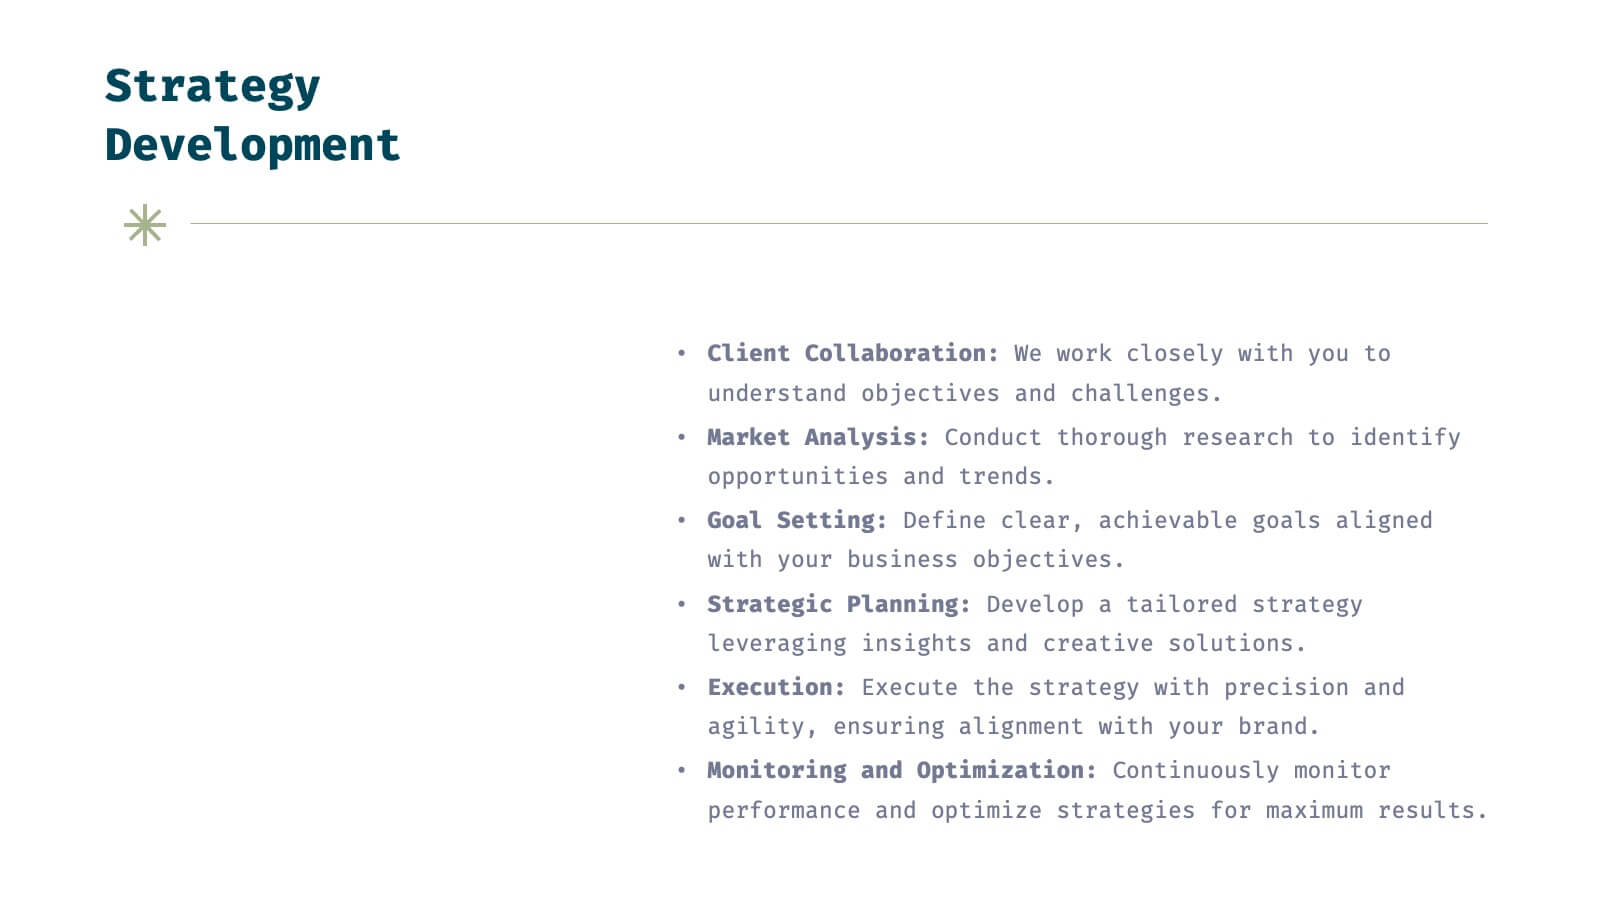
Helix Full-Service Agency Project Plan Presentation
Showcase your agency's expertise with this sophisticated, minimalistic presentation template. Designed to present comprehensive market analysis, strategy development, and client success stories, this template ensures your agency's capabilities are clearly communicated. Its clean design and professional layout make it perfect for building trust and credibility. Compatible with PowerPoint, Keynote, and Google Slides, it's versatile for any platform.


6 slides
Relationship Compatibility Infographic
Relationship compatibility refers to the degree to which two individuals are well-suited for each other in a relationship. This infographic can be a fun and informative way to explore the compatibility between individuals in a relationship. This template is designed to help individuals gain a better understanding of their relationships and make informed decisions about their interactions with others. Compatible with Powerpoint, Keynote, and Google Slides. The combination of visual elements and informative content can make this topic engaging and accessible. Making it easy for readers to navigate and understand the content.


6 slides
Industry Analysis with Porter's Forces Presentation
The Industry Analysis with Porter's Forces Presentation offers a clean and strategic layout for visualizing competitive dynamics. This deck illustrates the five forces—Buyers, Suppliers, Competitors, Substitutions, and New Entry—in a semi-circular flow that makes relationships easy to understand. Each force is paired with editable text and icons for clarity. Ideal for market research, business strategy, or consulting work. Fully compatible with PowerPoint, Keynote, and Google Slides.


6 slides
Demographic and Psychographic Segmentation Presentation
Bring your audience insights to life with a clear, data-driven design that highlights who your customers are and what drives their decisions. This presentation helps you analyze audiences by lifestyle, behavior, and demographics. Fully customizable and compatible with PowerPoint, Keynote, and Google Slides for effortless professional presentations.


5 slides
Venn Diagram Comparison Slide Presentation
Bring clarity to your ideas with a layered visual that makes comparing multiple concepts feel effortless and engaging. This presentation helps you highlight differences, similarities, and key insights using clean shapes and simple labels. Fully customizable and compatible with PowerPoint, Keynote, and Google Slides.


5 slides
Quality Control with Six Sigma Strategy Presentation
Showcase your quality control framework using the Quality Control with Six Sigma Strategy Presentation. This modern layout highlights each stage of the DMAIC process in a visually engaging format, ideal for Lean Six Sigma teams and continuous improvement professionals. Fully customizable in PowerPoint, Keynote, Canva, and Google Slides.


6 slides
Business Roadmap Strategy Presentation
Map your path to success with this Business Roadmap Strategy template. Designed for clarity and impact, it helps you outline goals, milestones, and timelines in a visual journey. Ideal for team planning, strategy meetings, and pitches. Compatible with PowerPoint, Keynote, and Google Slides for seamless editing.


6 slides
Stakeholder Analysis Chart Infographic
Stakeholder analysis is a process used by organizations to identify and assess the interests, concerns, expectations, and potential impact of various individuals, groups, or entities that have a stake in a particular project, decision, or initiative. The goal of this infographic is to better understand the perspectives and needs of different stakeholders and to use this information to inform decision-making and project planning. This template summarizes the importance of stakeholder analysis in project management or organizational decision-making. This compatible with Powerpoint, Keynote, and Google Slides.