


Features
- 8 Unique slides
- Fully editable and easy to edit in Microsoft Powerpoint, Keynote and Google Slides
- 16:9 widescreen layout
- Clean and professional designs
- Export to JPG, PDF or send by email


Do you have any questions?
Recommend


7 slides
Money Exchange Infographic Presentation
Money exchange is an important aspect of international trade and commerce, and it serves many important functions. Create a professional visual aid for your next presentation with this infographic on money exchange. The template includes customizable layouts, charts and 7 unique photo layouts. You can add or delete columns of information as desired, change fonts and sizes as well as fill text boxes with titles, descriptions and more. This colorful design is great for reporting on business growth, expenses and more. This presentation is designed in Powerpoint, Keynote and Google Slides.


4 slides
Pillar Strategy Framework Presentation
Turn complex strategies into clear, structured visuals with this elegant infographic design. Ideal for showcasing key principles, organizational foundations, or business frameworks, it helps communicate ideas with precision and balance. Fully customizable and compatible with PowerPoint, Keynote, and Google Slides for effortless editing and professional results.


24 slides
Silver Product Launch Presentation
Unleash the potential of your product launch with this vibrant and engaging presentation template! Designed to showcase your product's unique features, market positioning, and competitive edge, this template helps you tell a compelling story from start to finish. It’s perfect for grabbing attention and driving impact. Compatible with PowerPoint, Keynote, and Google Slides.


10 slides
Data-Driven Feedback Analysis Presentation
Gain deep insights into your business performance with the Data-Driven Feedback Analysis infographic. This dynamic visual presentation helps you track key metrics, analyze trends, and present findings with clarity. Fully customizable and compatible with PowerPoint, Keynote, and Google Slides.


7 slides
Pricing Comparison Table Infographic
Dive into the strategic world of pricing with our intricately designed pricing table infographic. Imbued with the trustworthiness of blue, the crisp clarity of white, the optimism of yellow, and the urgency of red, our template visualizes pricing strategies in an engaging manner. Furnished with detailed infographics, distinct icons, and adaptable image placeholders, it translates complex pricing data into an easy-to-grasp format. Seamlessly crafted for Powerpoint, Keynote, or Google Slides. A vital asset for business analysts, marketers, sales professionals, or any brand strategizing its pricing model. Engage your audience; let every slide be a value proposition.


3 slides
Medical Report Summary and Review Deck Presentation
Present health data clearly with this Medical Report Summary and Review Deck. Designed for healthcare professionals, this layout features checklist icons, charts, and clinical visuals to highlight reports or patient insights. Fully editable in PowerPoint, Keynote, and Google Slides, it ensures your medical updates remain professional, concise, and easy to follow.


26 slides
Tempo Brand Identity Presentation
Introduce and elevate your brand with this versatile presentation template designed to reflect your company's vision and values. Perfect for businesses looking to showcase their brand strategy, components, and touchpoints with clarity and professionalism. This presentation features thoughtfully designed slides covering brand identity components, visual guidelines, target audience insights, and future development plans. Use dedicated sections to outline your unique selling proposition, positioning, and strategy. With its clean layout and attention to detail, it's ideal for presenting a cohesive and impactful brand narrative. Compatible with PowerPoint, Google Slides, and Keynote, this template is fully customizable. Edit colors, text, and images to align with your brand aesthetics and messaging. Deliver your presentation with confidence, ensuring your audience is inspired by a polished and professional brand identity.


4 slides
Sports Metrics and Training Goals Presentation
Track, analyze, and present athletic performance with the Sports Metrics and Training Goals template. Featuring bar charts and a sports court graphic, this design is ideal for visualizing statistics, strategies, and progress. Fully customizable in Canva, PowerPoint, and Google Slides to align with your team’s branding and performance objectives.


8 slides
Marketing Campaign Performance Presentation
Showcase campaign metrics in style with this Marketing Campaign Performance layout. Featuring four icon-labeled data cards at the top and two integrated charts below (pie and bar), this slide offers a snapshot of performance insights—ideal for comparing reach, engagement, and conversion data across platforms. Fully editable and compatible with PowerPoint, Keynote, and Google Slides.


7 slides
Money Market Infographic
The money market is a sector of the financial market where short-term borrowing and lending occur, typically in the form of highly liquid and low-risk instruments. Navigate the financial landscape with our Money Market Infographic. This colorful and informative template is designed to help you understand the dynamics of the money market, empowering you to make sound financial decisions. Compatible with Powerpoint, Keynote, and Google Slides. This infographic demystifies the money market, offering valuable insights and knowledge to help you navigate the world of investments and financial growth.


23 slides
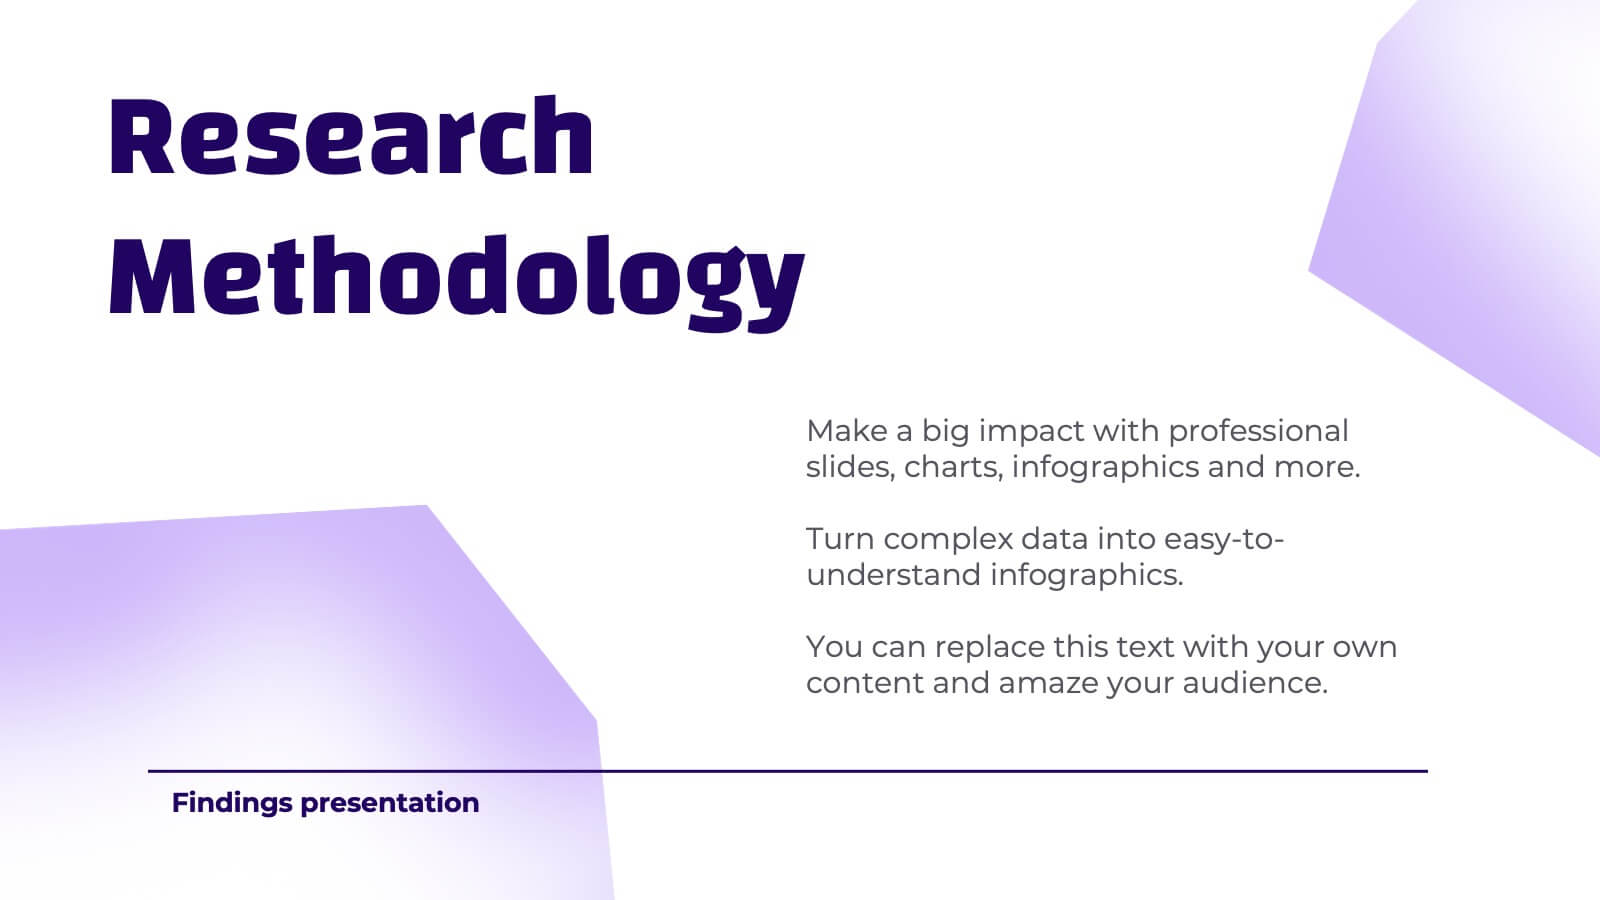
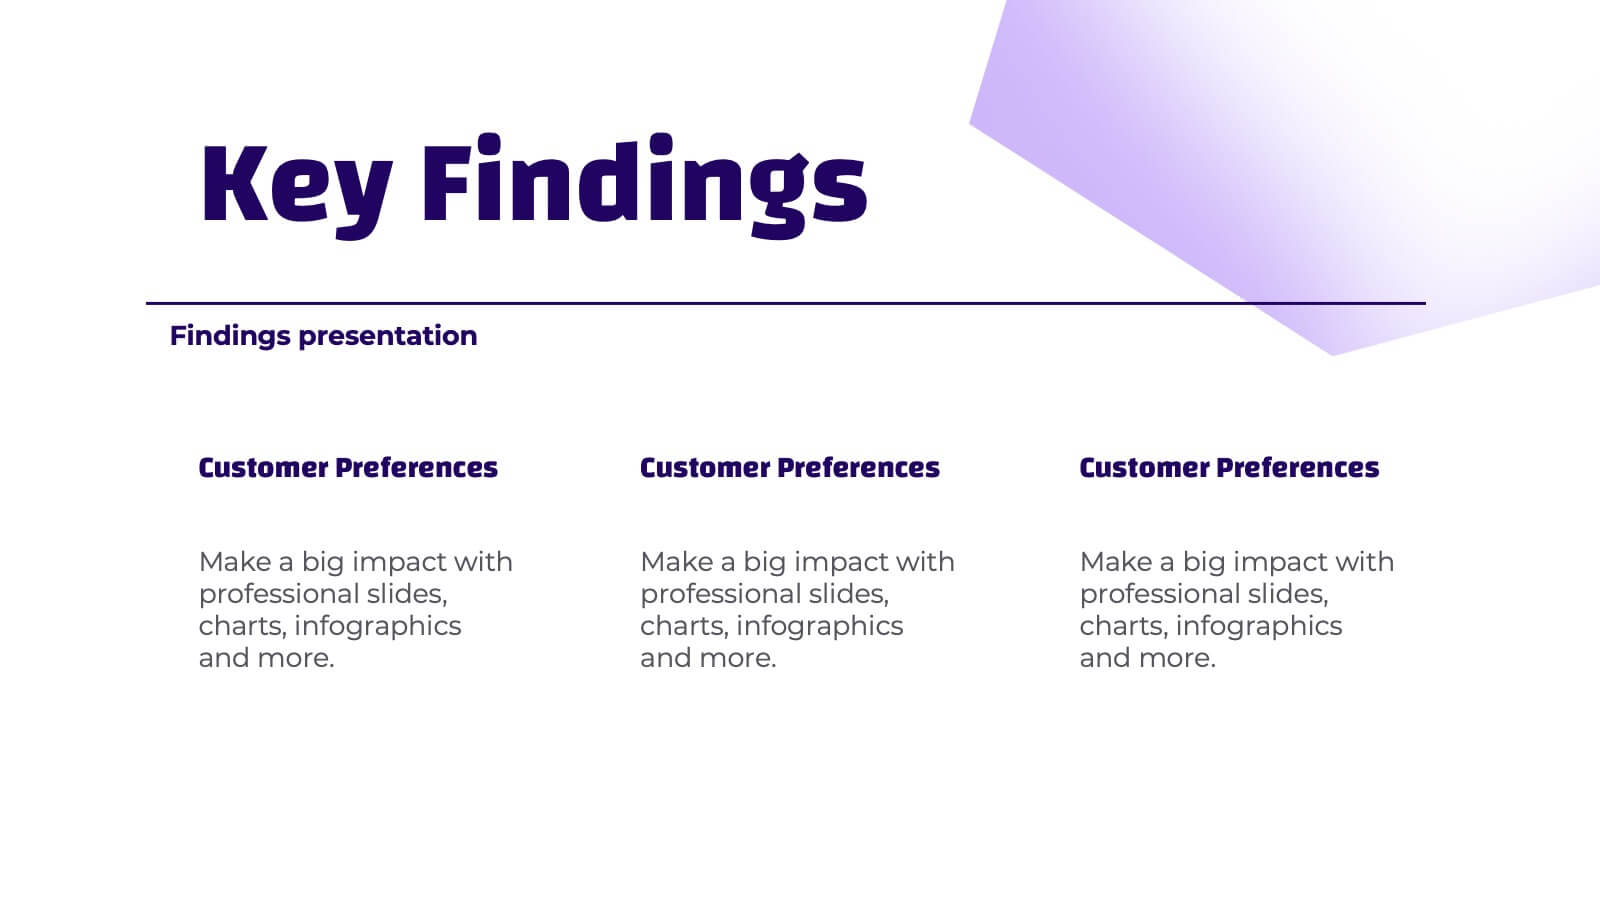
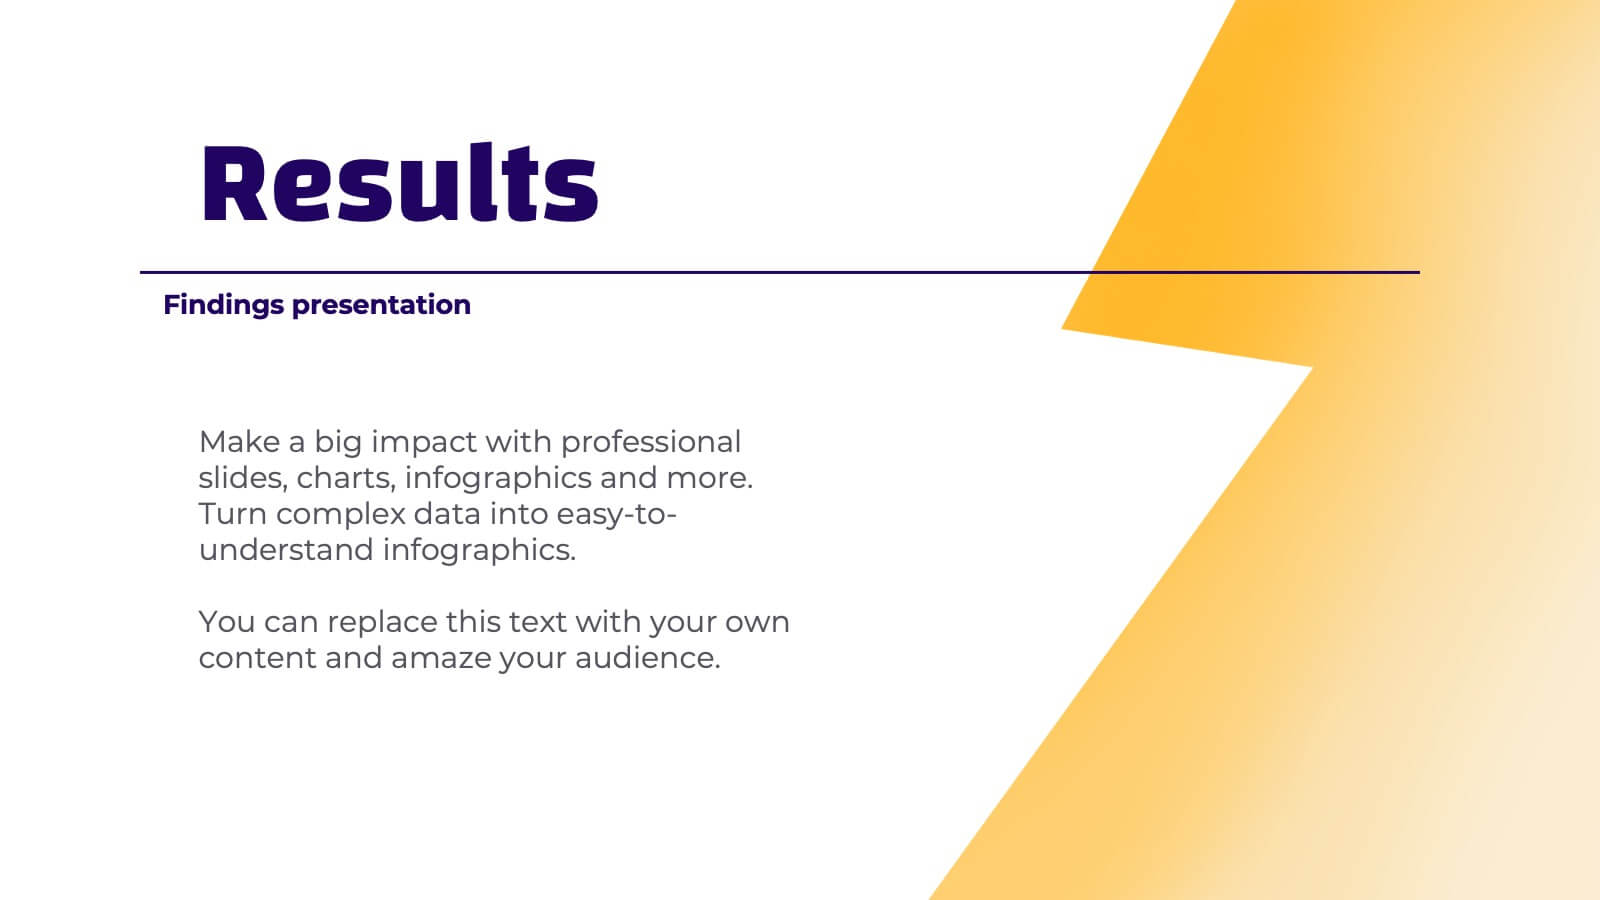
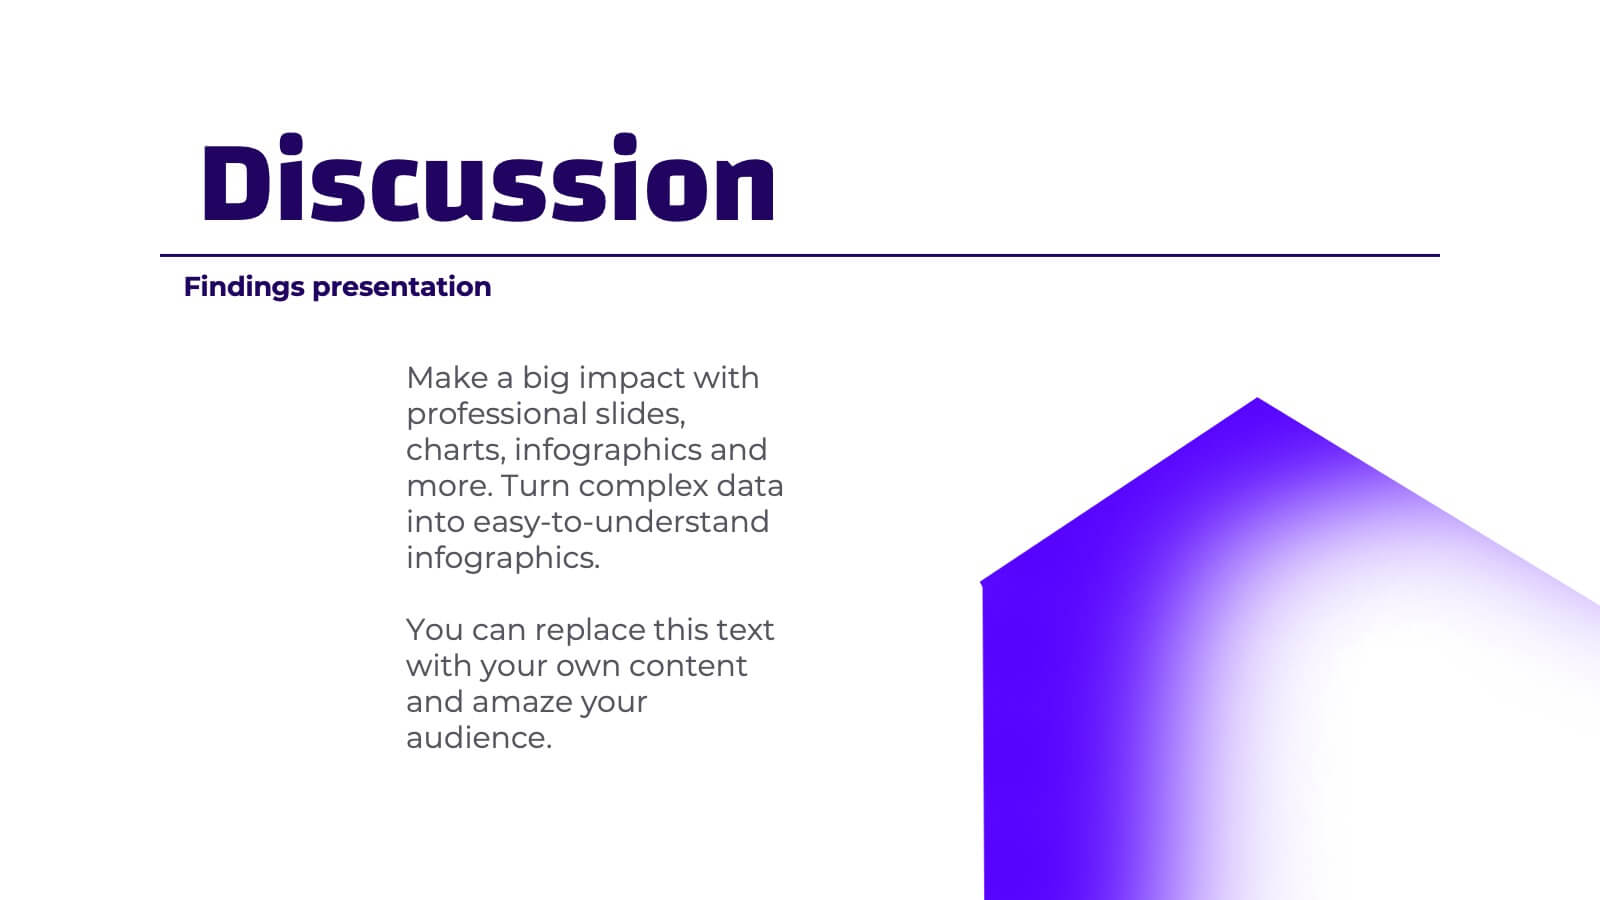
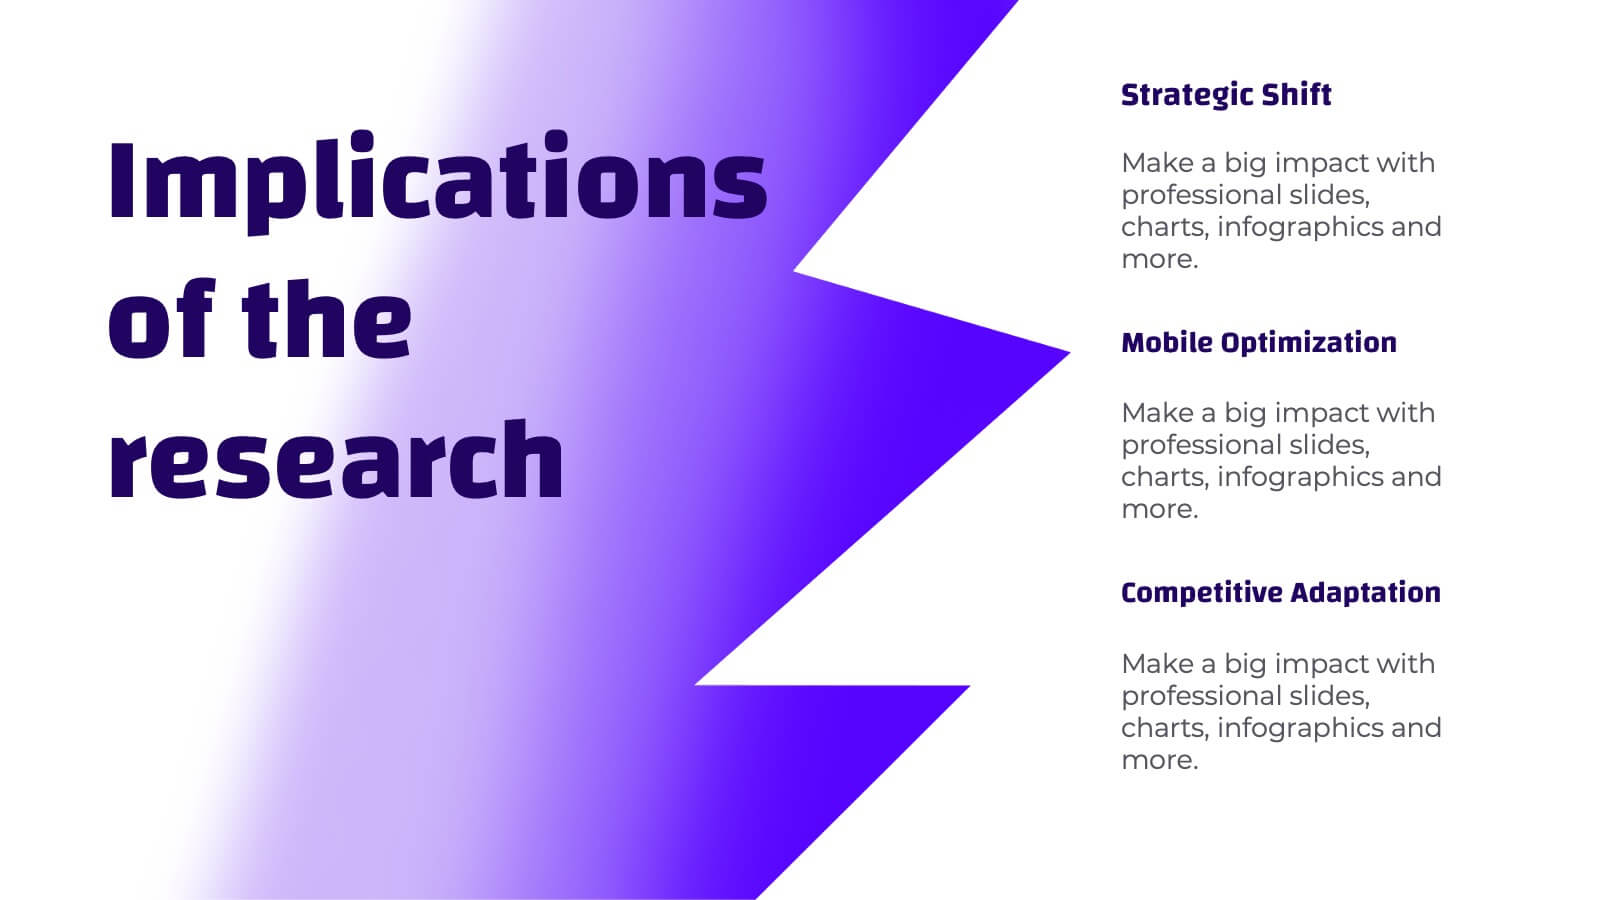
Naiad Qualitative Research Findings Presentation
Dive into your data with this refreshing, Naiad-inspired presentation template, perfect for sharing qualitative research findings! Designed to showcase insights, trends, and key conclusions with clarity, this visually appealing layout ensures your research captivates and informs. Make your data flow effortlessly. Compatible with PowerPoint, Keynote, and Google Slides for easy customization.


6 slides
Targeted Segment Analysis and Mapping Presentation
Highlight your market focus with the Targeted Segment Analysis and Mapping Presentation. This circular layout is perfect for breaking down five audience segments, using subtle icons and visual emphasis for clarity. Ideal for marketers, strategists, and business analysts presenting niche targeting. Fully editable in Canva, PowerPoint, Keynote, and Google Slides.


7 slides
Process Flow Chart Infographic
Flowcharts are the best way to get your point across—and this one is no exception. This infographic chart shows the steps that you need to take in order to create a high-energy flow chart. You start with the basic foundation of your chart, then add information about the different parts of it, and finally bring it all together by adding details to each part of the chart. This a great way to organize information, and it makes it easy for your audience to see how things fit together. Compatible with Powerpoint, Keynote, and Google Slides. This templates is fully customizable: you can change colors and fonts as needed, or add your own images to make them unique.


4 slides
Digital Marketing Strategy Presentation
Present your marketing insights with impact using this engaging digital marketing strategy slide. Featuring a modern bar chart with layered 3D blocks and icon-labeled highlights, this slide is perfect for showcasing strategy breakdowns, campaign priorities, or market performance data. Customize each section with concise titles and professional content. Ideal for marketers, agencies, and analysts. Fully editable in PowerPoint, Keynote, and Google Slides.


21 slides
Cineris Product Roadmap Presentation
Present your product vision and strategy with this professional and modern product roadmap presentation template. Covering key aspects such as product overview, features, competitive analysis, pricing strategy, and production process, this template helps you communicate your plan effectively. Designed for easy customization, it’s perfect for internal team alignment, stakeholder presentations, and strategic planning. Compatible with PowerPoint, Keynote, and Google Slides.


6 slides
Visual Resource Allocation Gantt
Easily map out team workload over time with the Visual Resource Allocation Gantt Presentation. This slide helps you assign tasks across monthly intervals, track resource distribution, and identify scheduling conflicts. Perfect for project managers, department heads, and HR planners aiming to balance capacity and timelines. Fully editable in PowerPoint, Keynote, and Google Slides.


5 slides
Role Assignment Matrix Framework Presentation
Simplify task delegation with the Role Assignment Matrix Framework Presentation. Ideal for defining roles and responsibilities in a clear, table-based layout, this matrix helps organize who does what across departments or project phases. Perfect for RACI charts or team alignment. Fully editable in PowerPoint, Google Slides, Keynote, and Canva.