


Features
- 5 Unique slides
- Fully editable and easy to edit in Microsoft Powerpoint, Keynote and Google Slides
- 16:9 widescreen layout
- Clean and professional designs
- Export to JPG, PDF or send by email


Do you have any questions?
Recommend


5 slides
Financial Overview and Money Flow Presentation
Showcase financial performance and money distribution with this clear, layered infographic. Each stack segment represents a key insight—ideal for budgets, cost analysis, or income flow presentations. Simple yet visually effective, it's perfect for helping stakeholders see the full picture. Fully compatible with PowerPoint, Keynote, and Google Slides.


5 slides
Mental Health Awareness Infographics
Mental Health Awareness is the recognition and understanding of the importance of mental well-being, as well as the recognition of mental health issues and the impact they have on individuals and society as a whole. These infographic templates are valuable tools designed to raise awareness, reduce stigma, and promote mental well-being. With its informative content, compelling visuals, it serves as an effective resource for presentations, educational campaigns, or any event focused on mental health awareness. It provides essential information, statistics, and tips to support mental well-being. This template is compatible with PowerPoint, Keynote, and Google Slides.


6 slides
Business Performance Pie Chart Presentation
Showcase key business insights with the Business Performance Pie Chart Presentation template. Designed for professionals, this fully editable slide deck allows you to present performance metrics, financial data, and strategic analysis using visually appealing pie charts. Ideal for business reports, investor meetings, and corporate presentations, it ensures clarity and engagement. Compatible with PowerPoint, Keynote, and Google Slides.


6 slides
Biological Structure and Function
Visualize anatomical frameworks with this dynamic skeletal structure infographic. Ideal for biology education, health science overviews, or anatomy lessons, this slide clearly marks major bones and allows for quick content customization. Fully editable in PowerPoint, Google Slides, and Keynote for seamless integration into any curriculum or report.


8 slides
Geographic South America Template Presentation
Explore your data through a clean, professional map that highlights key insights and regional details across South America. Ideal for presenting demographics, business distribution, or performance metrics, this design combines clarity with impact. Fully compatible with PowerPoint, Keynote, and Google Slides for easy editing and seamless presentation.


3 slides
Service and Product Benefits Overview Presentation
Clearly contrast key features with the Service and Product Benefits Overview Presentation. This modern split-layout design helps you showcase differences between service offerings and tangible products in a clean, side-by-side format. Use it to highlight value propositions, customer benefits, or decision-making factors. Fully editable and compatible with PowerPoint, Keynote, and Google Slides.


5 slides
Corporate Teamwork and People Focus
Show how every team member powers success with this people-centered visual designed to highlight collaboration, roles, and interconnected efforts. Ideal for HR briefings, corporate values, or teamwork strategies, this gear-inspired layout places individuals at the heart of progress. Fully compatible with PowerPoint, Keynote, and Google Slides.


4 slides
Segmented Metrics Pie Chart Overview Presentation
Present your performance data with precision using the Segmented Metrics Pie Chart Overview Presentation. This clean and modern slide design features a donut-style pie chart divided into clearly marked percentage segments, ideal for showcasing metric distribution, KPI breakdowns, or analytical summaries. Each slice is color-coded and paired with editable labels and icons, making complex data easy to digest at a glance. Perfect for business reviews, dashboards, or investor updates. Fully compatible with PowerPoint, Keynote, and Google Slides for effortless customization.


23 slides
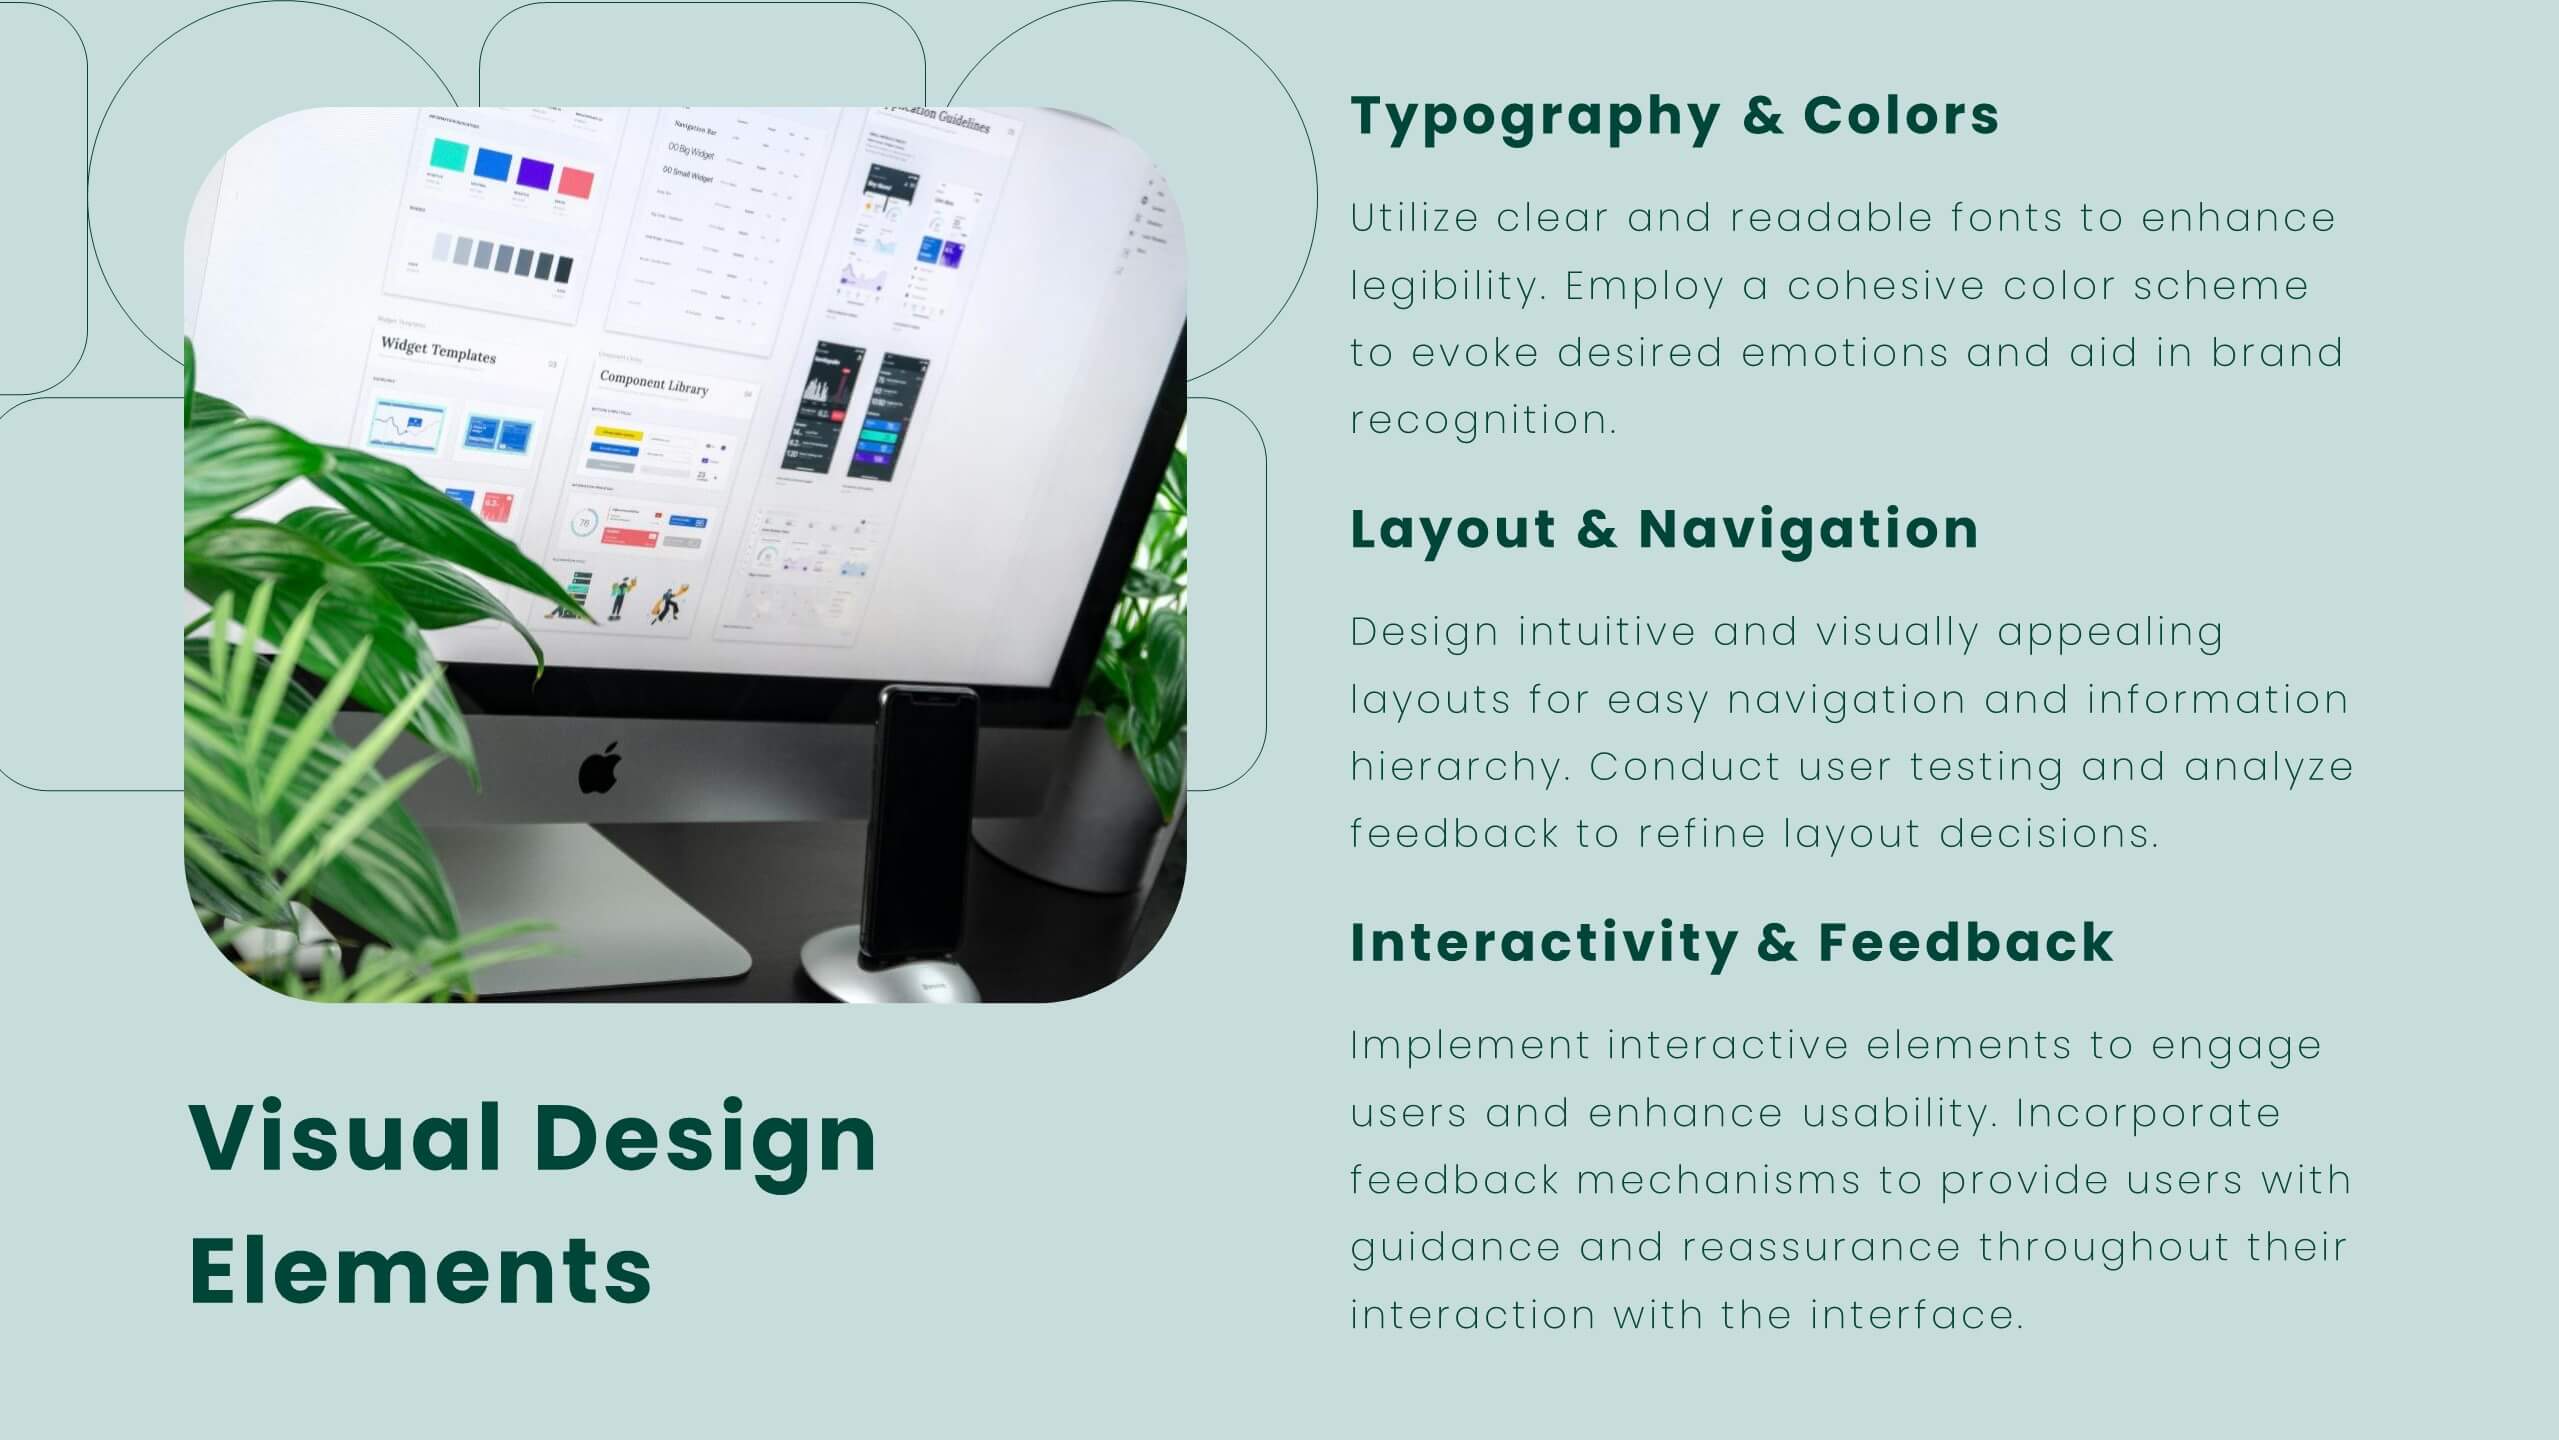
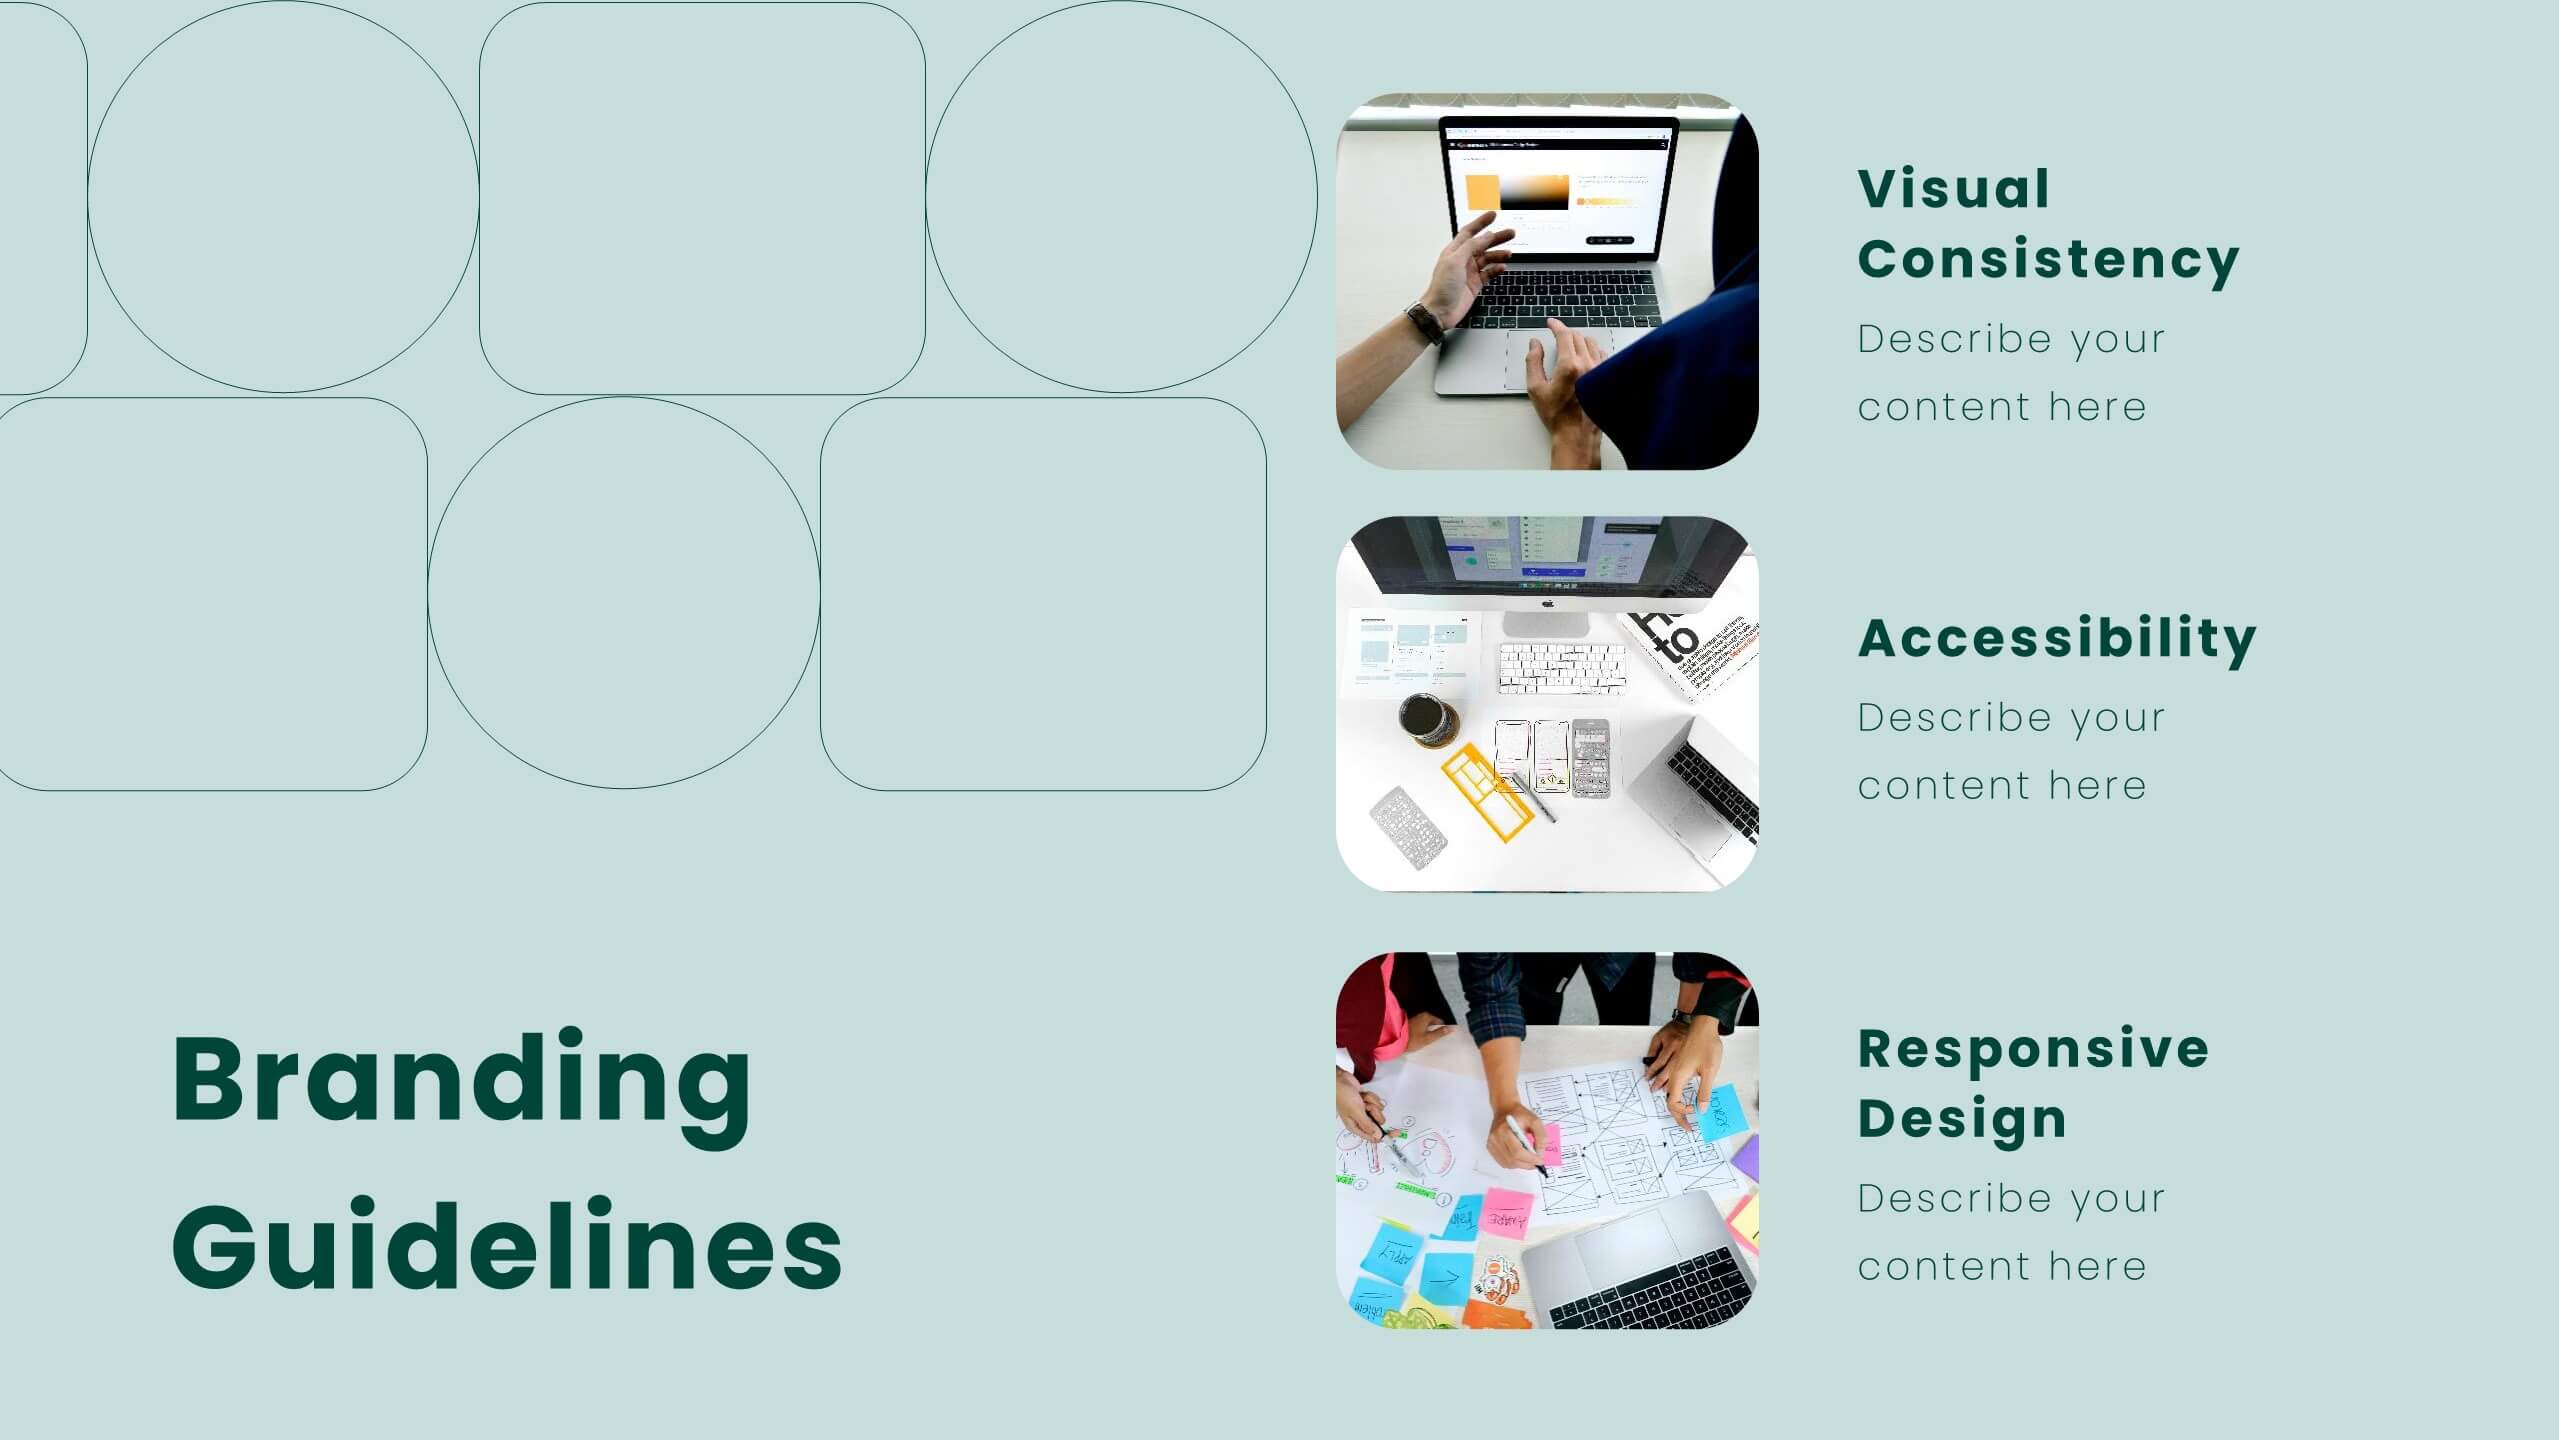
Lumina UX Case Study Presentation
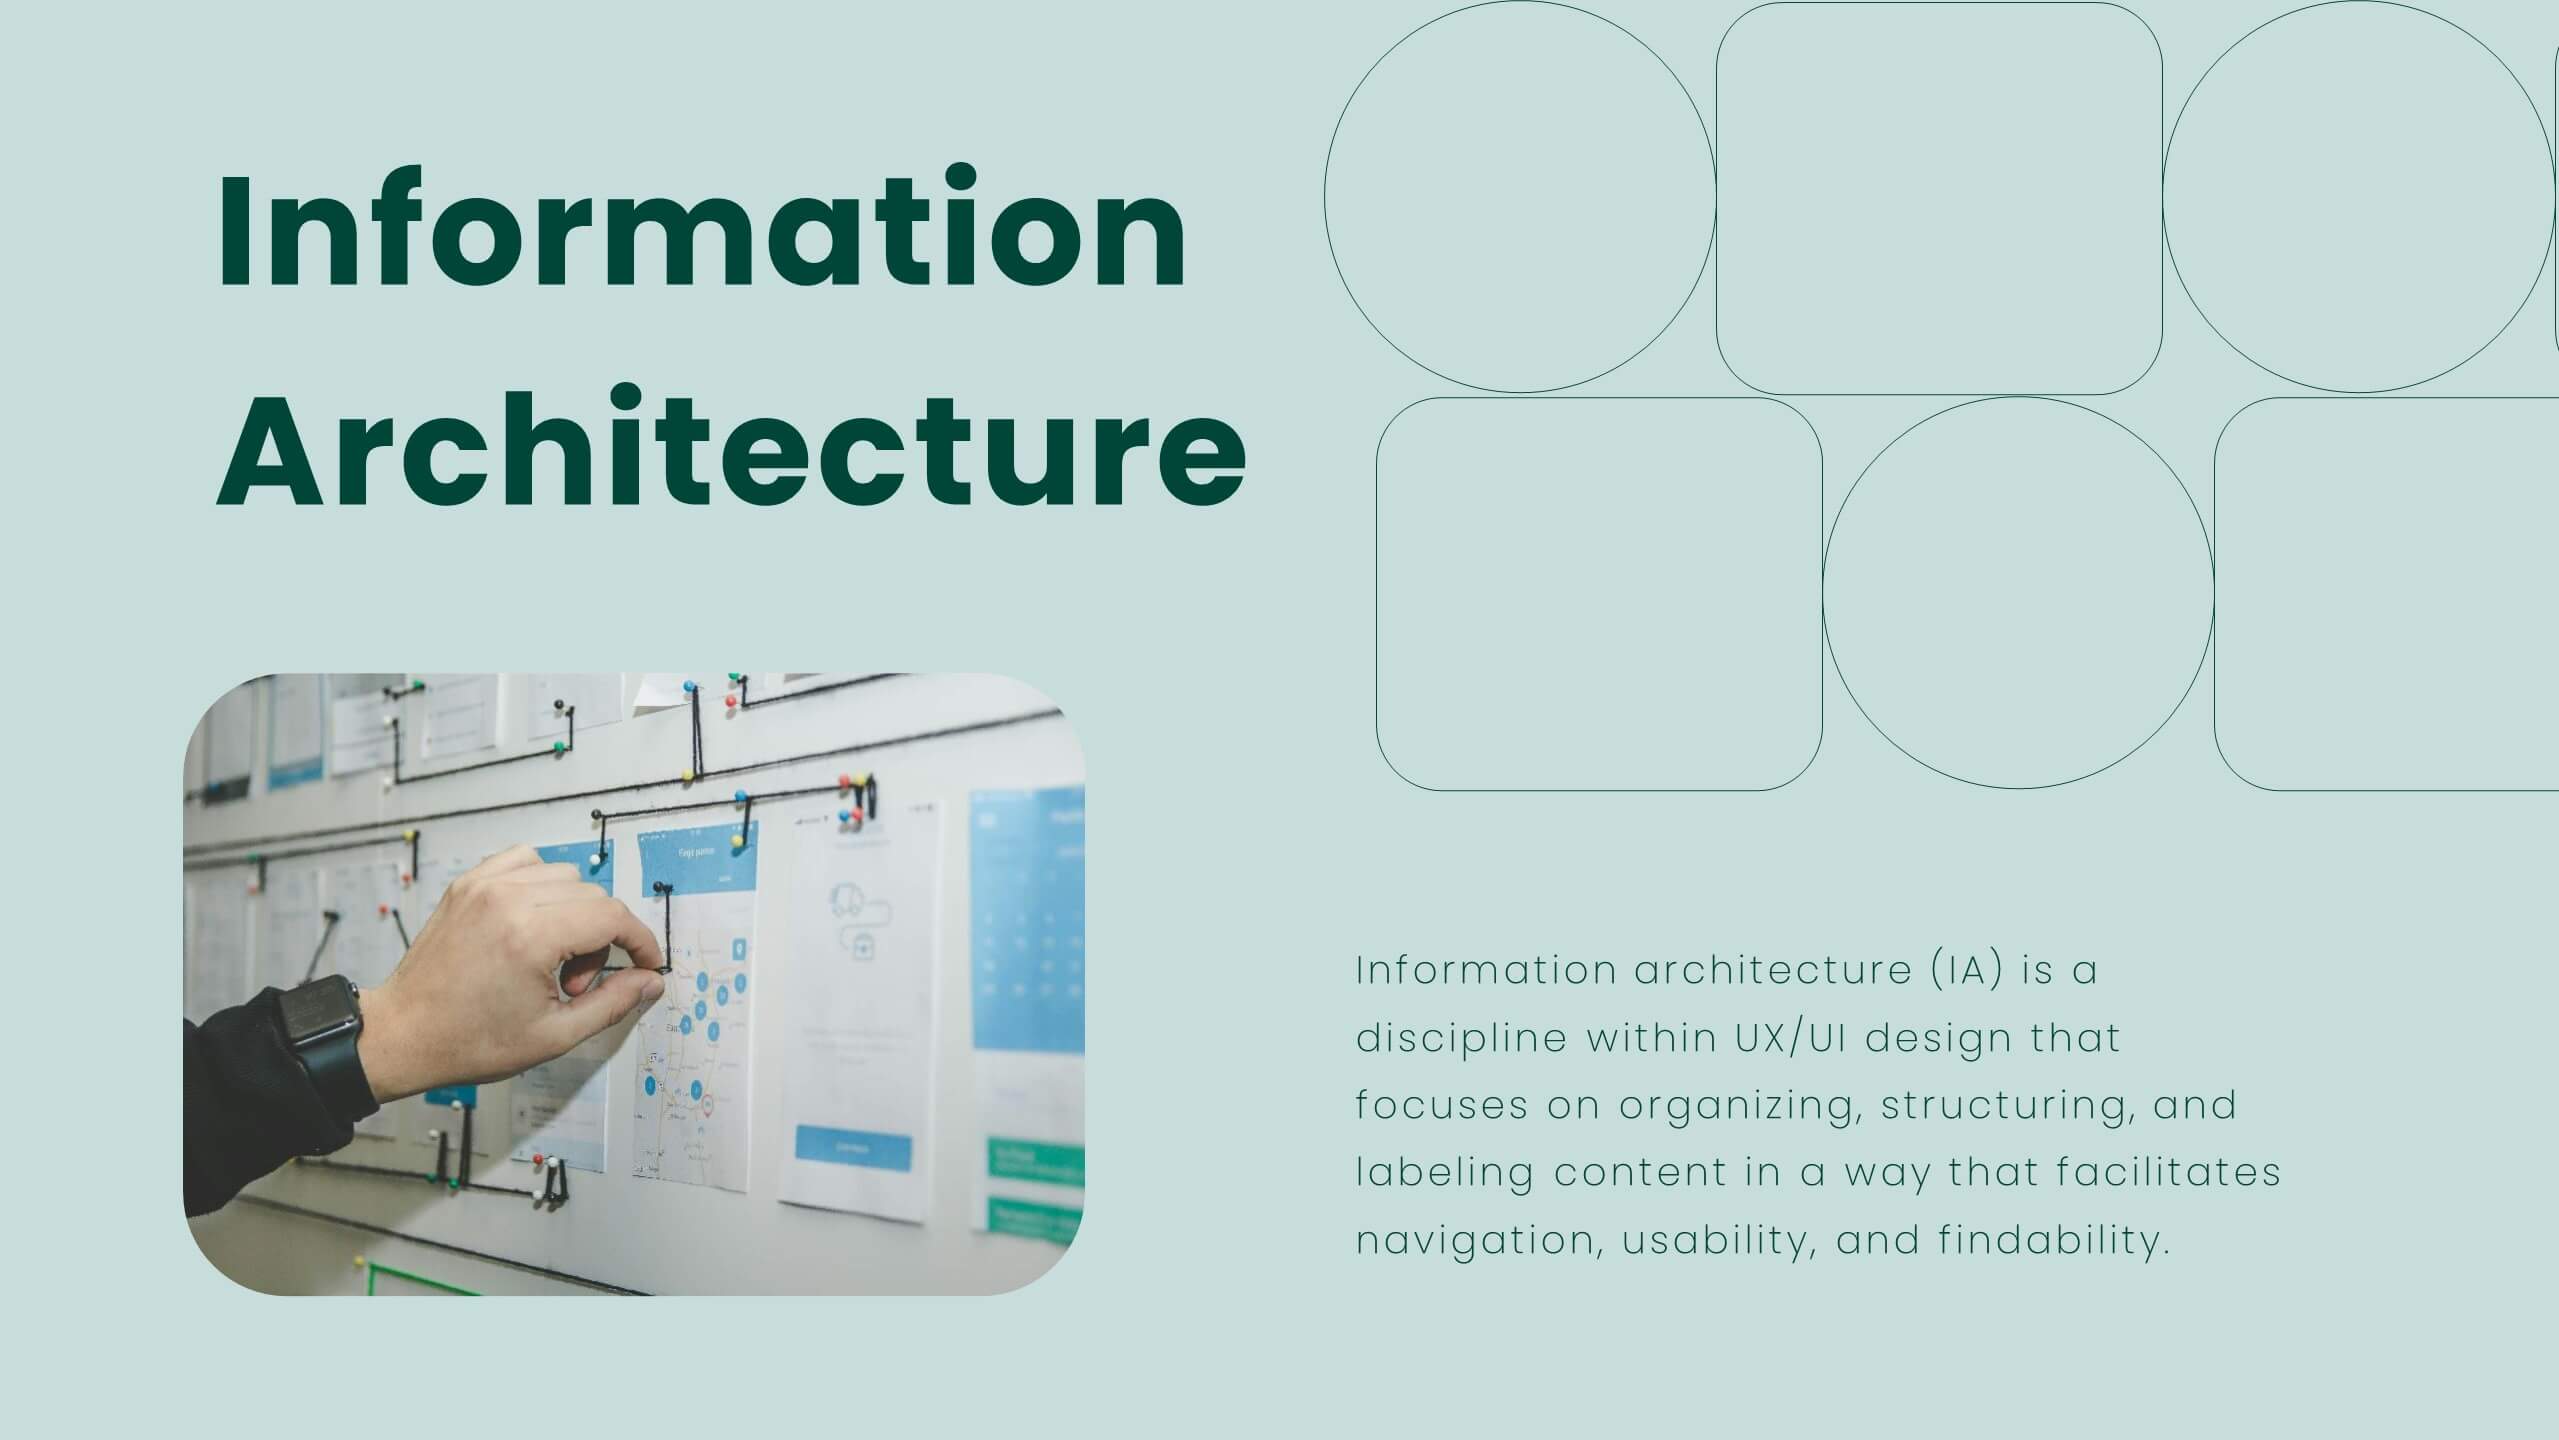
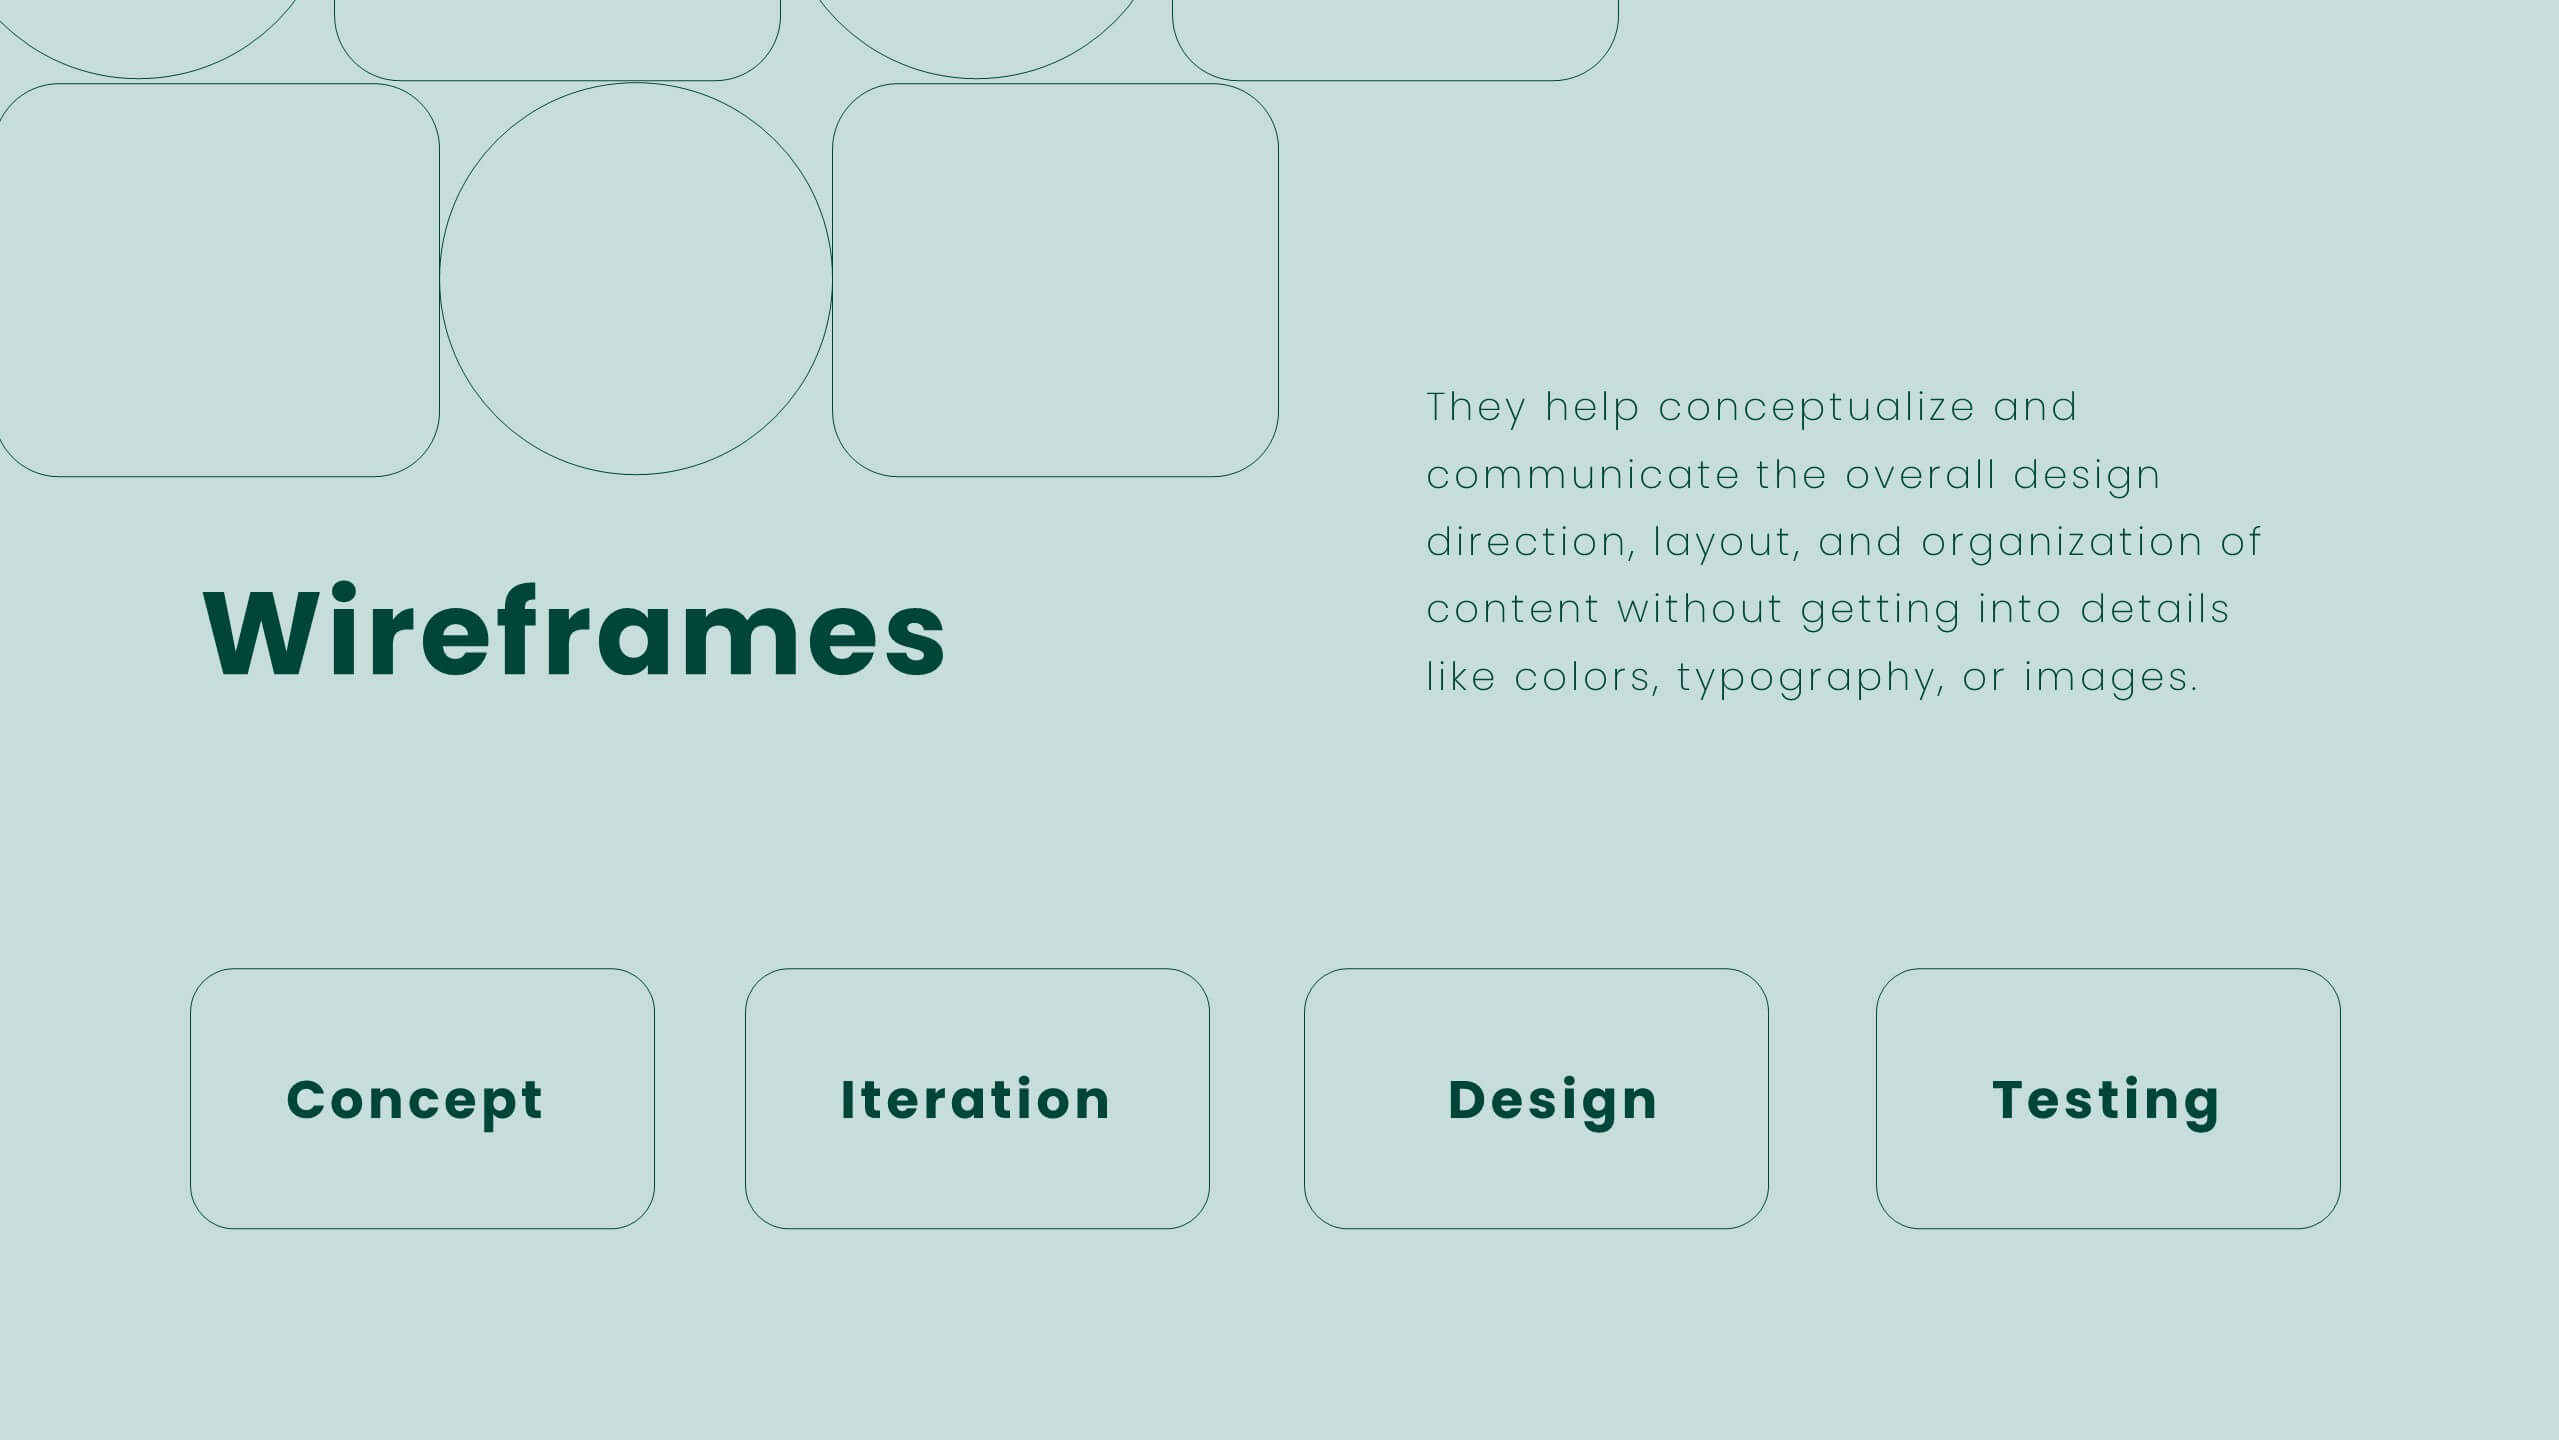
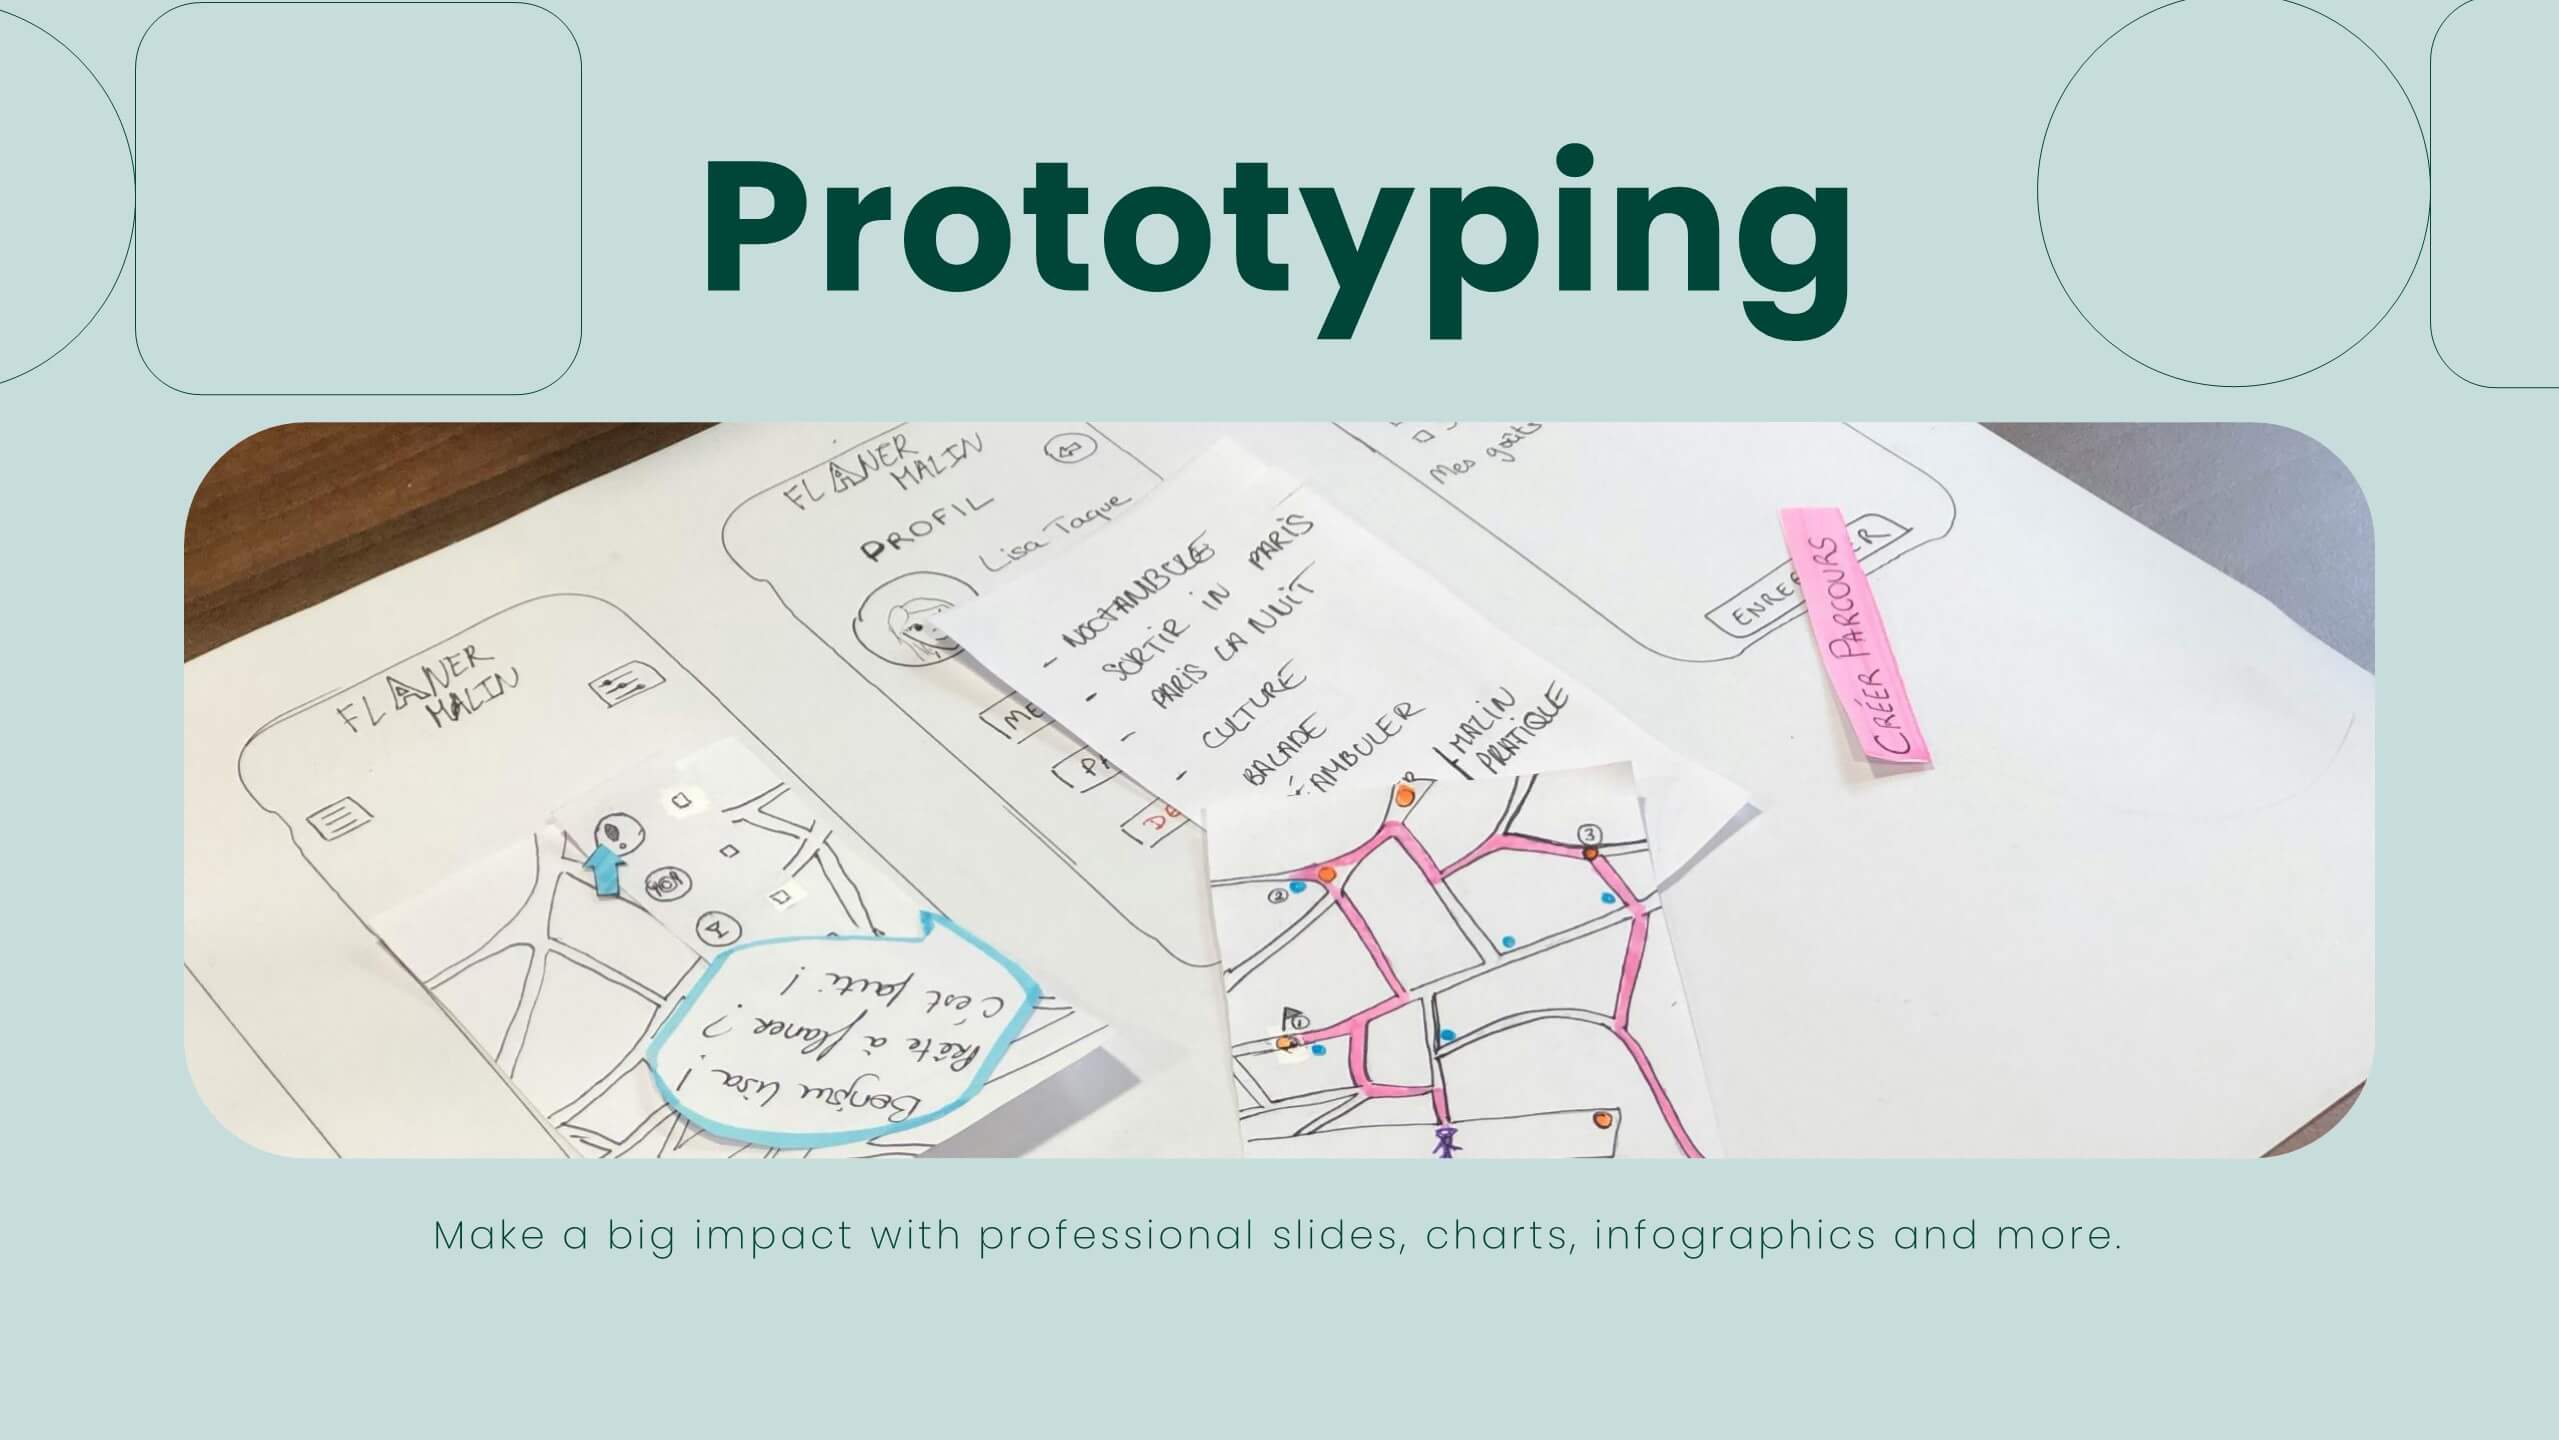
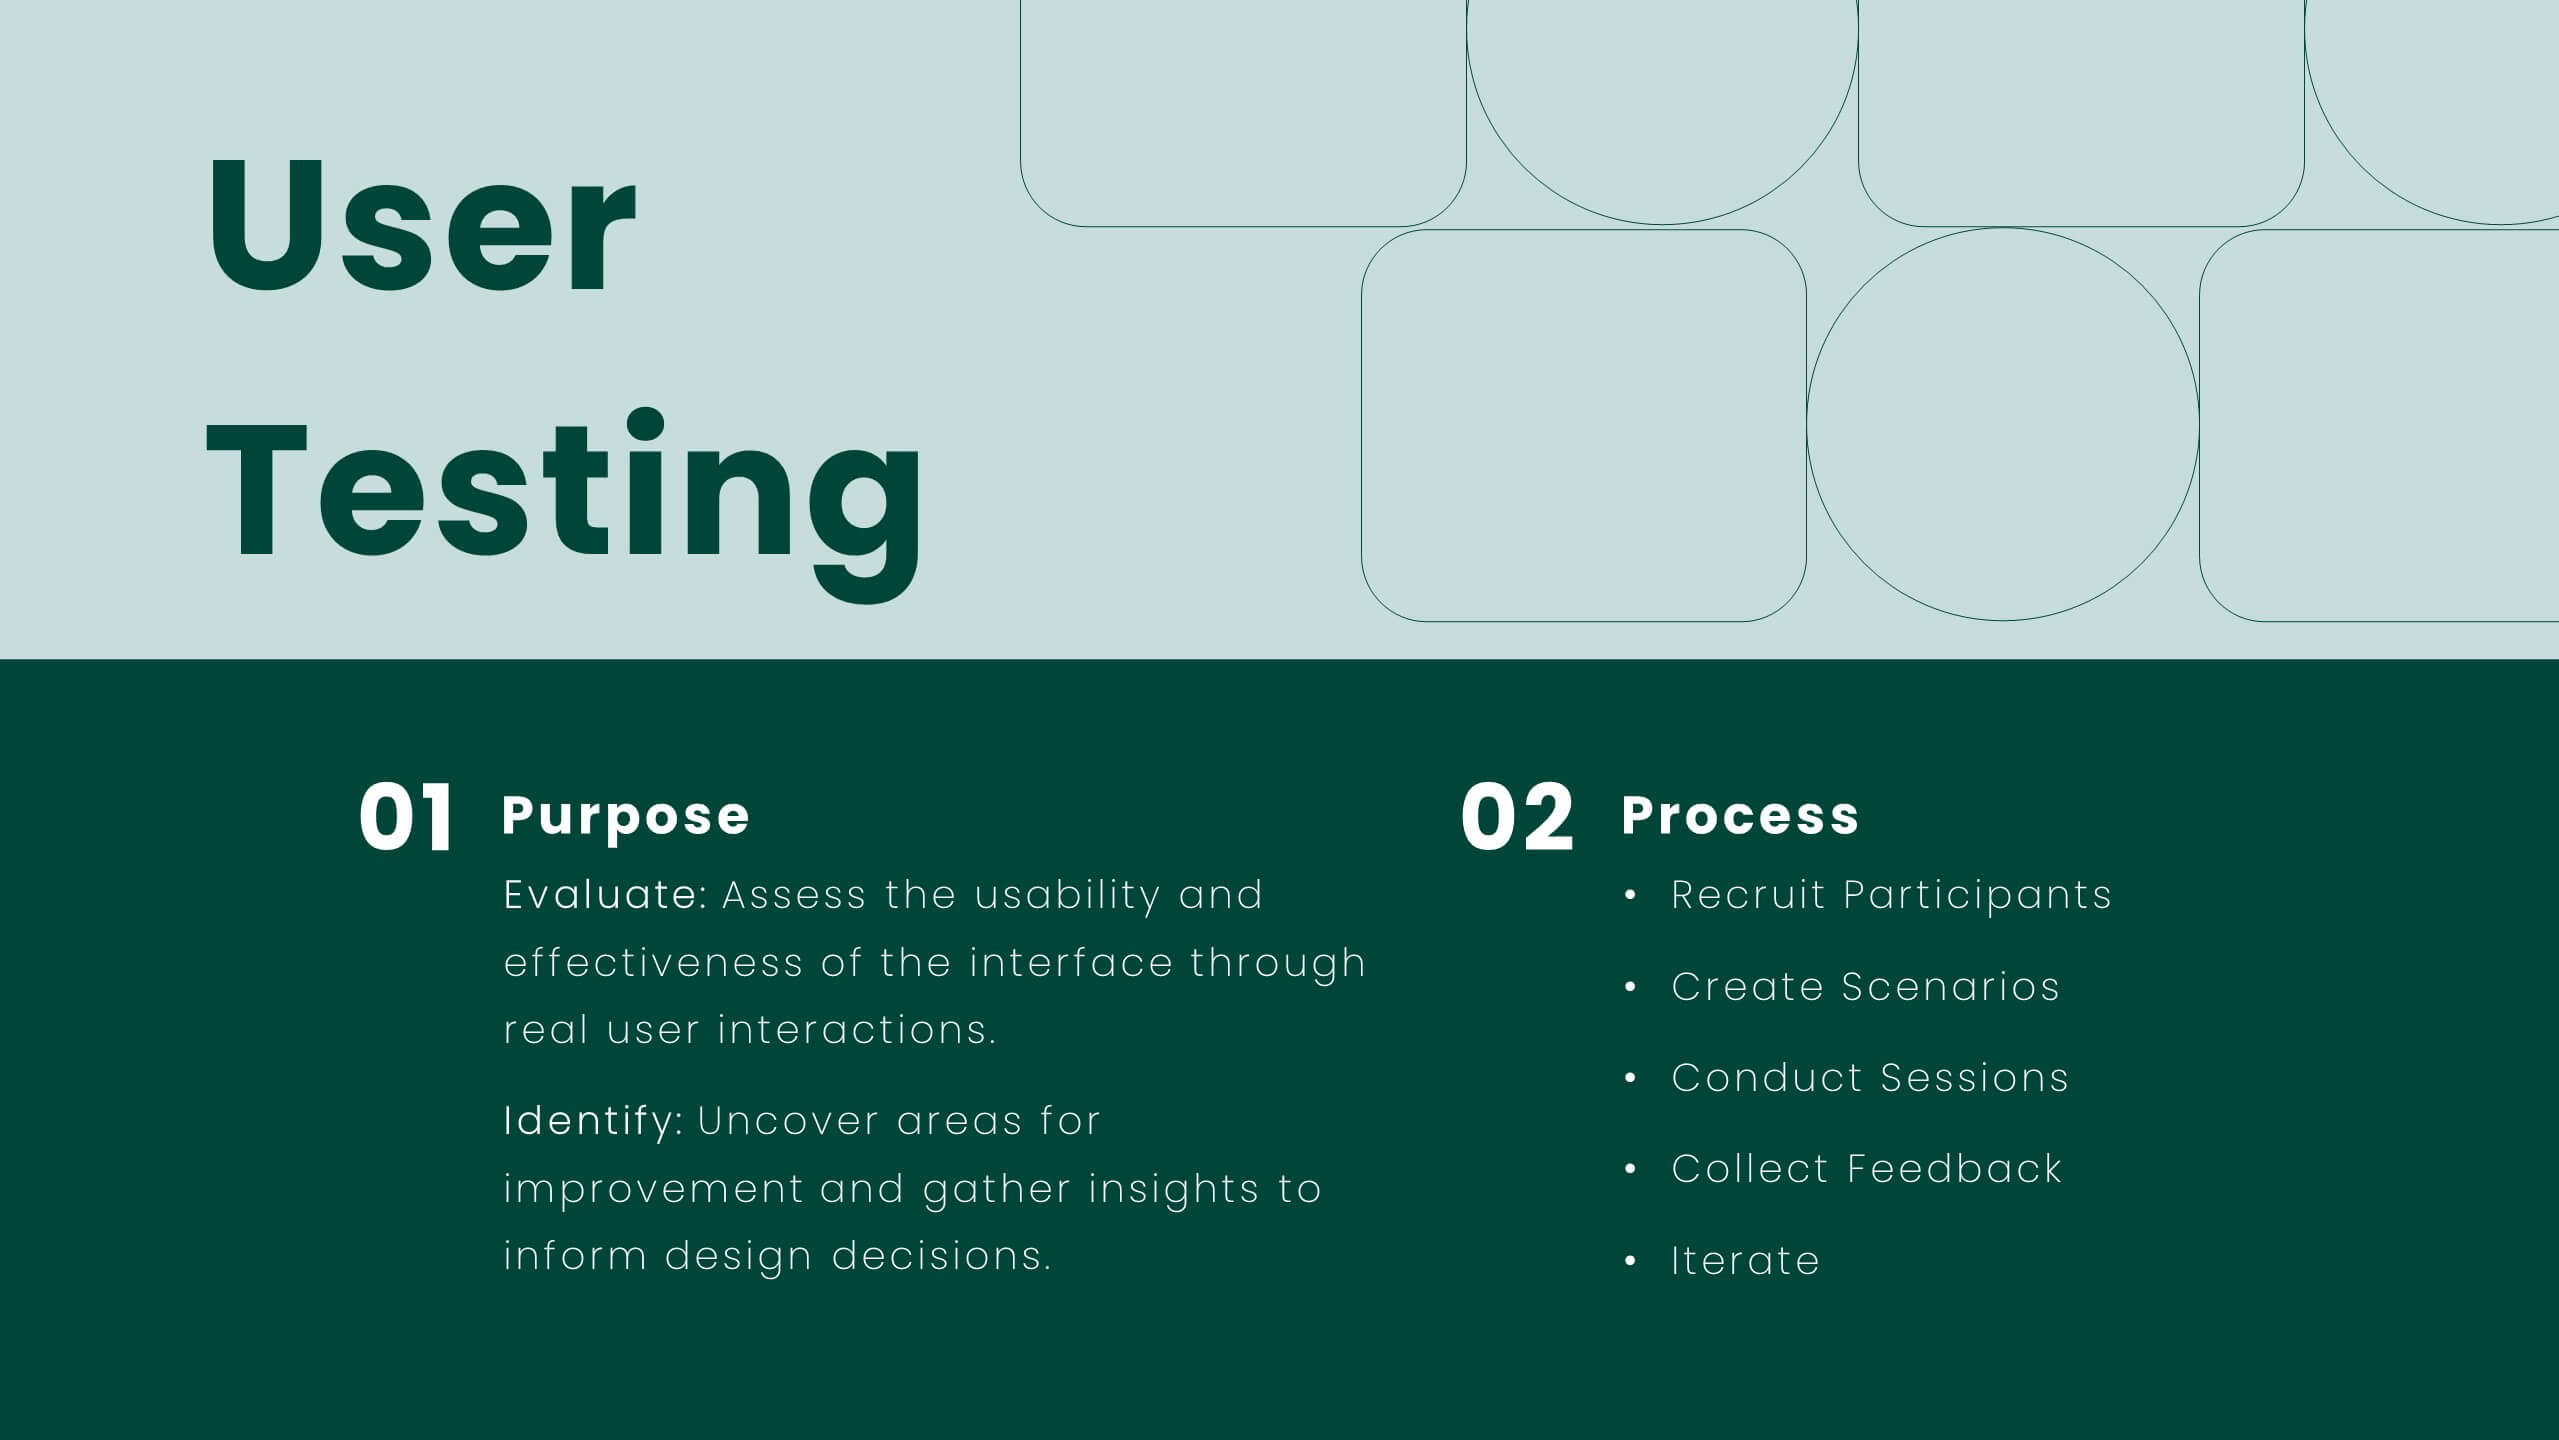
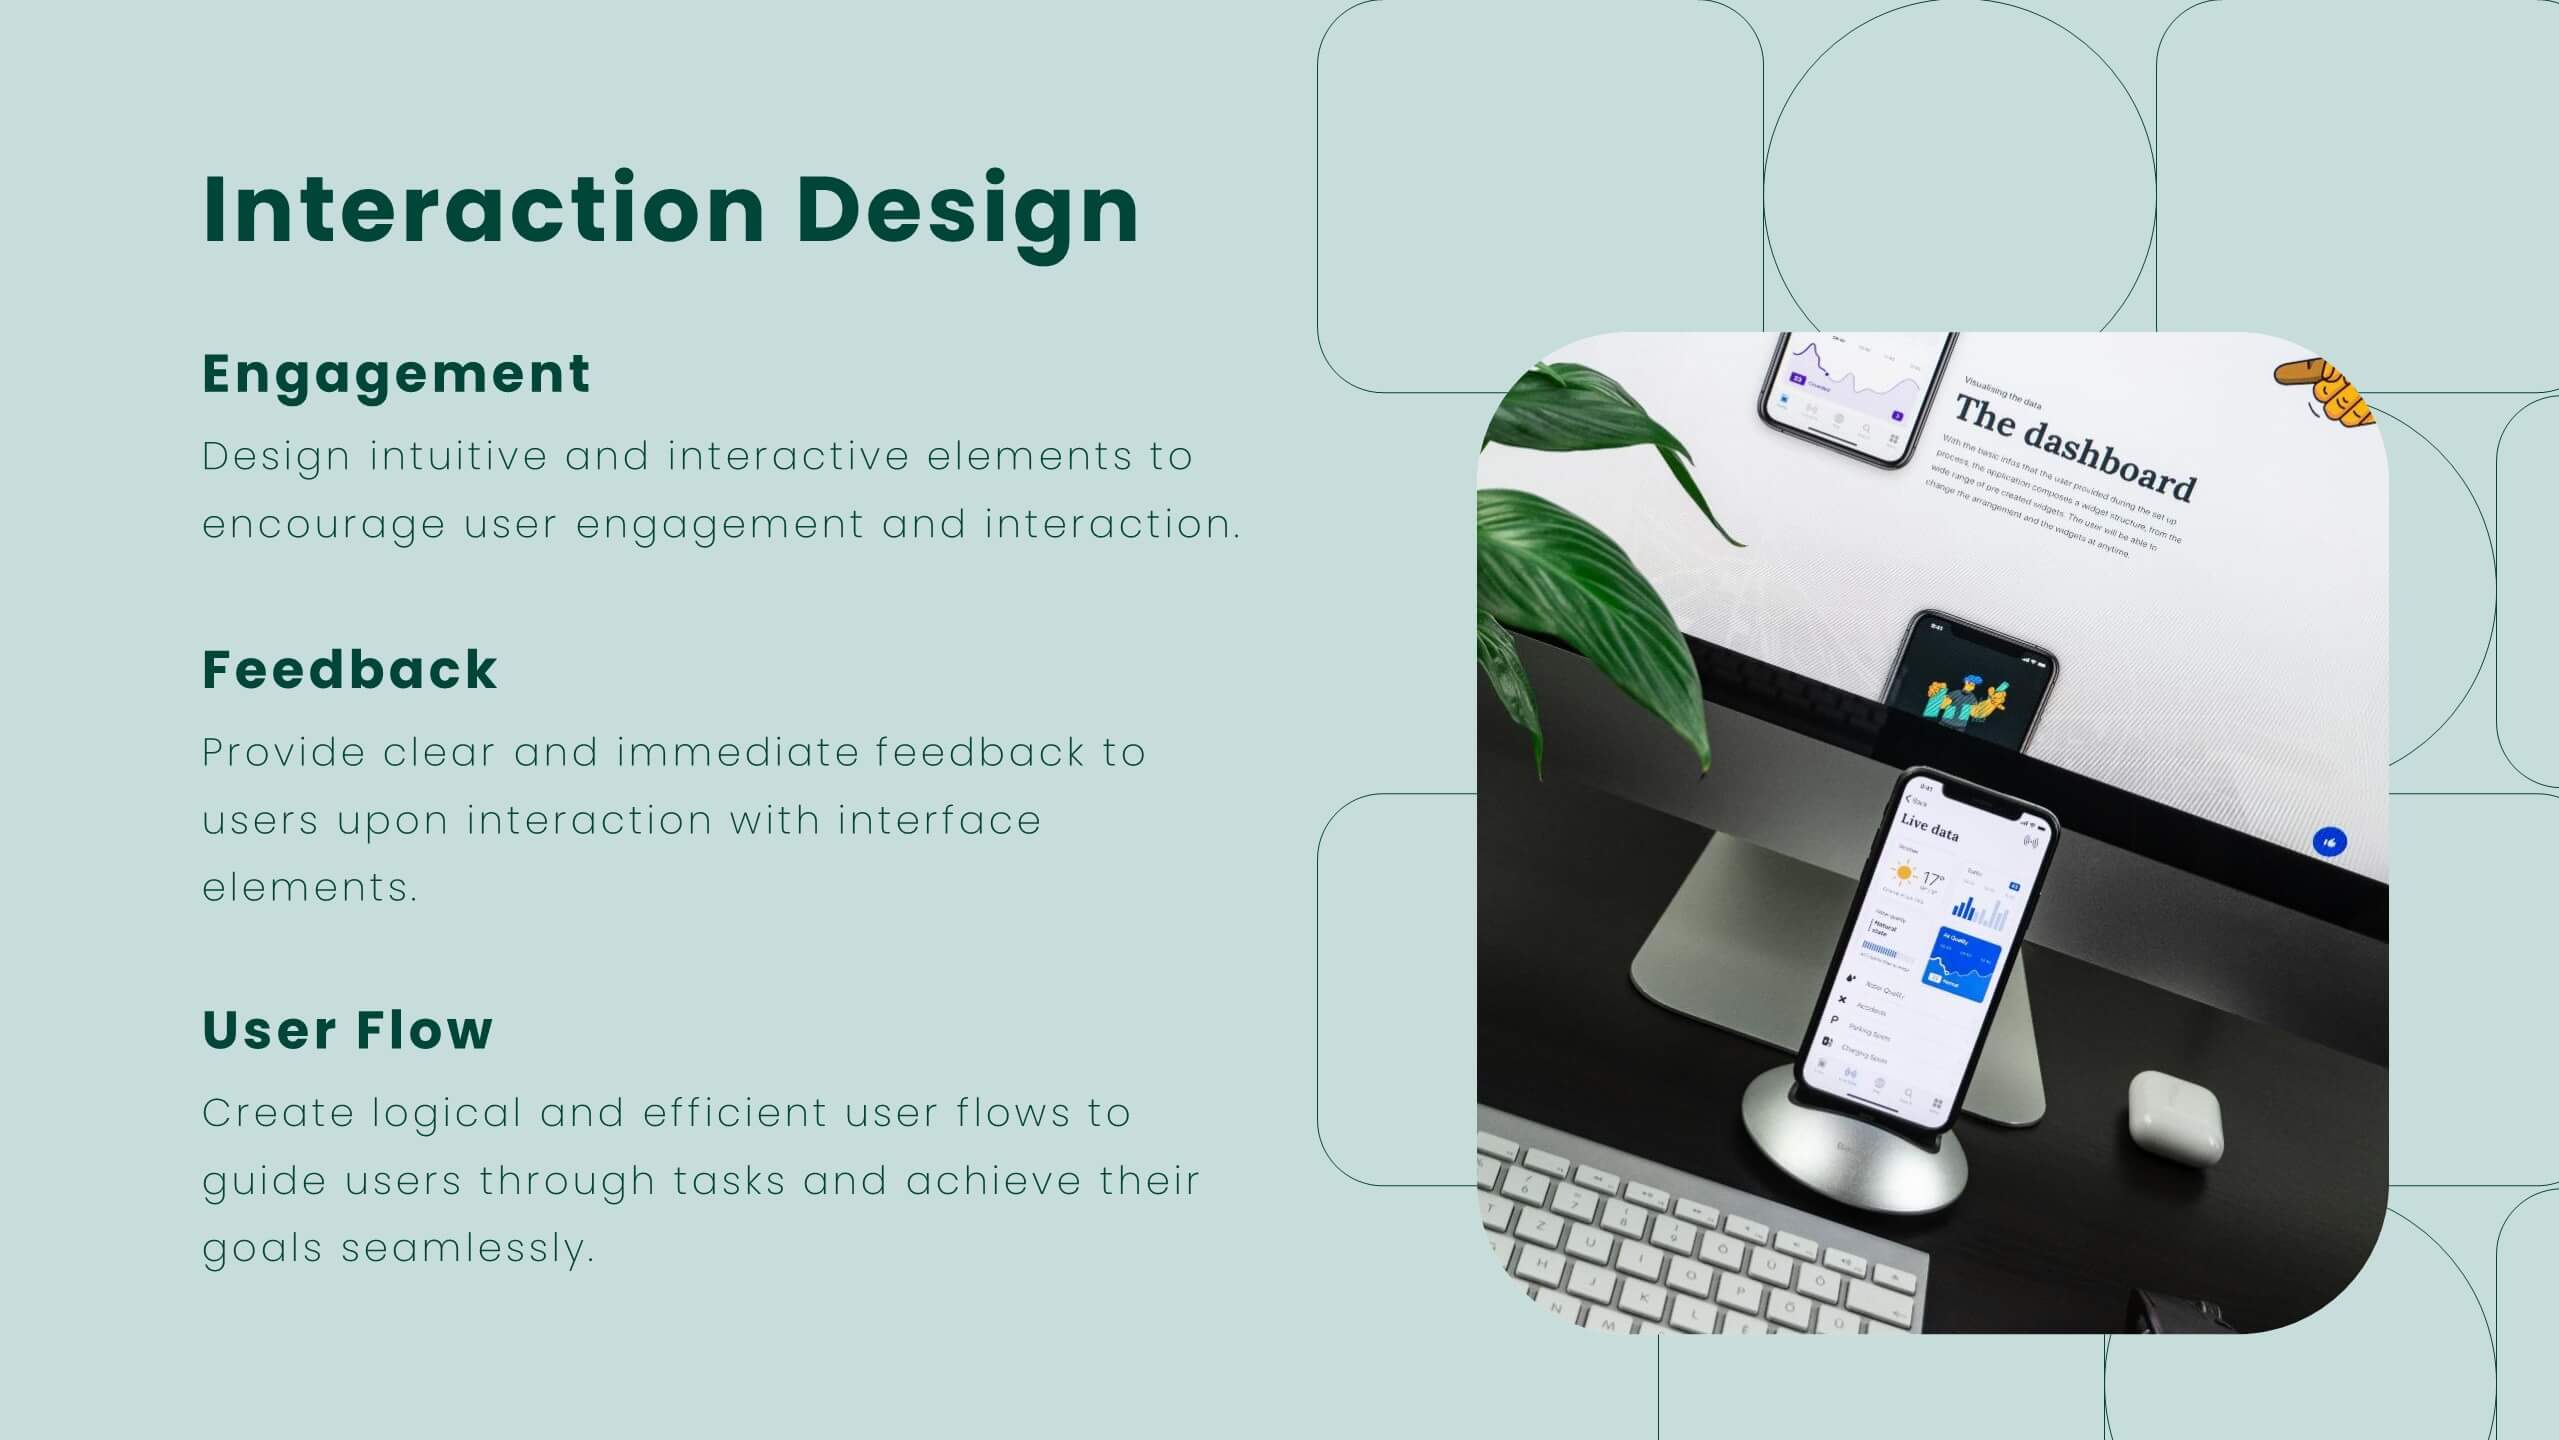
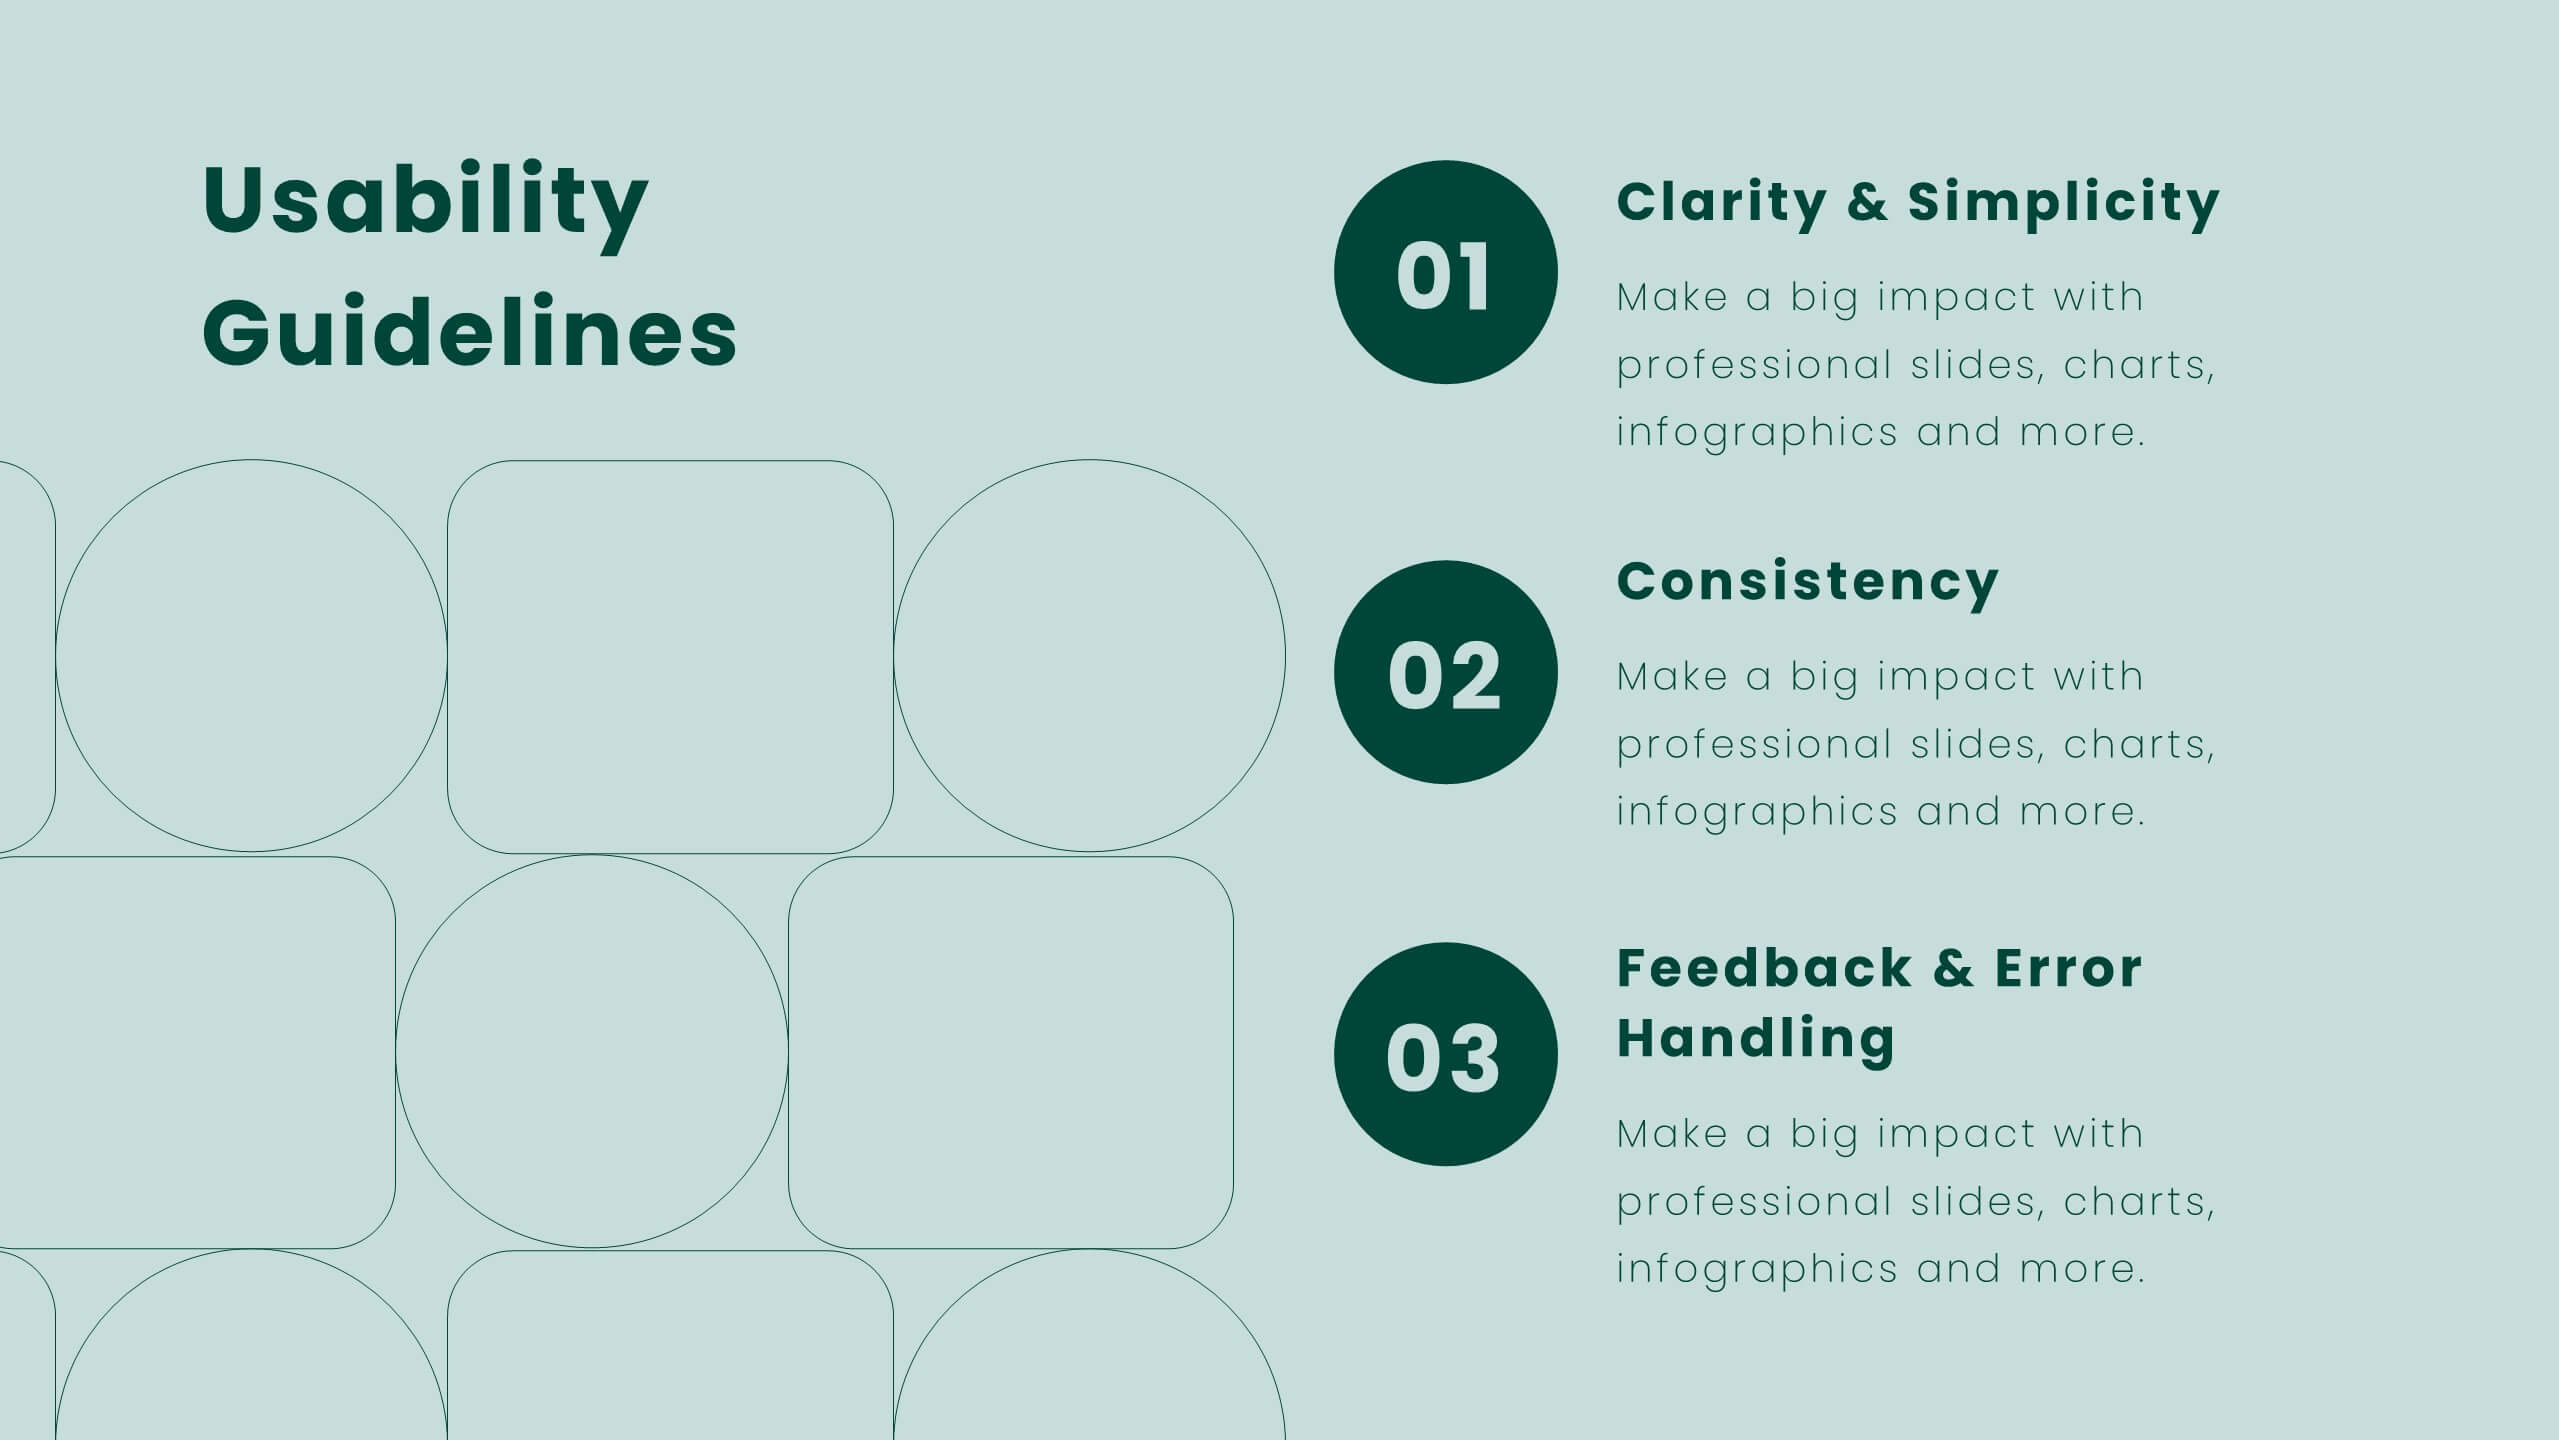
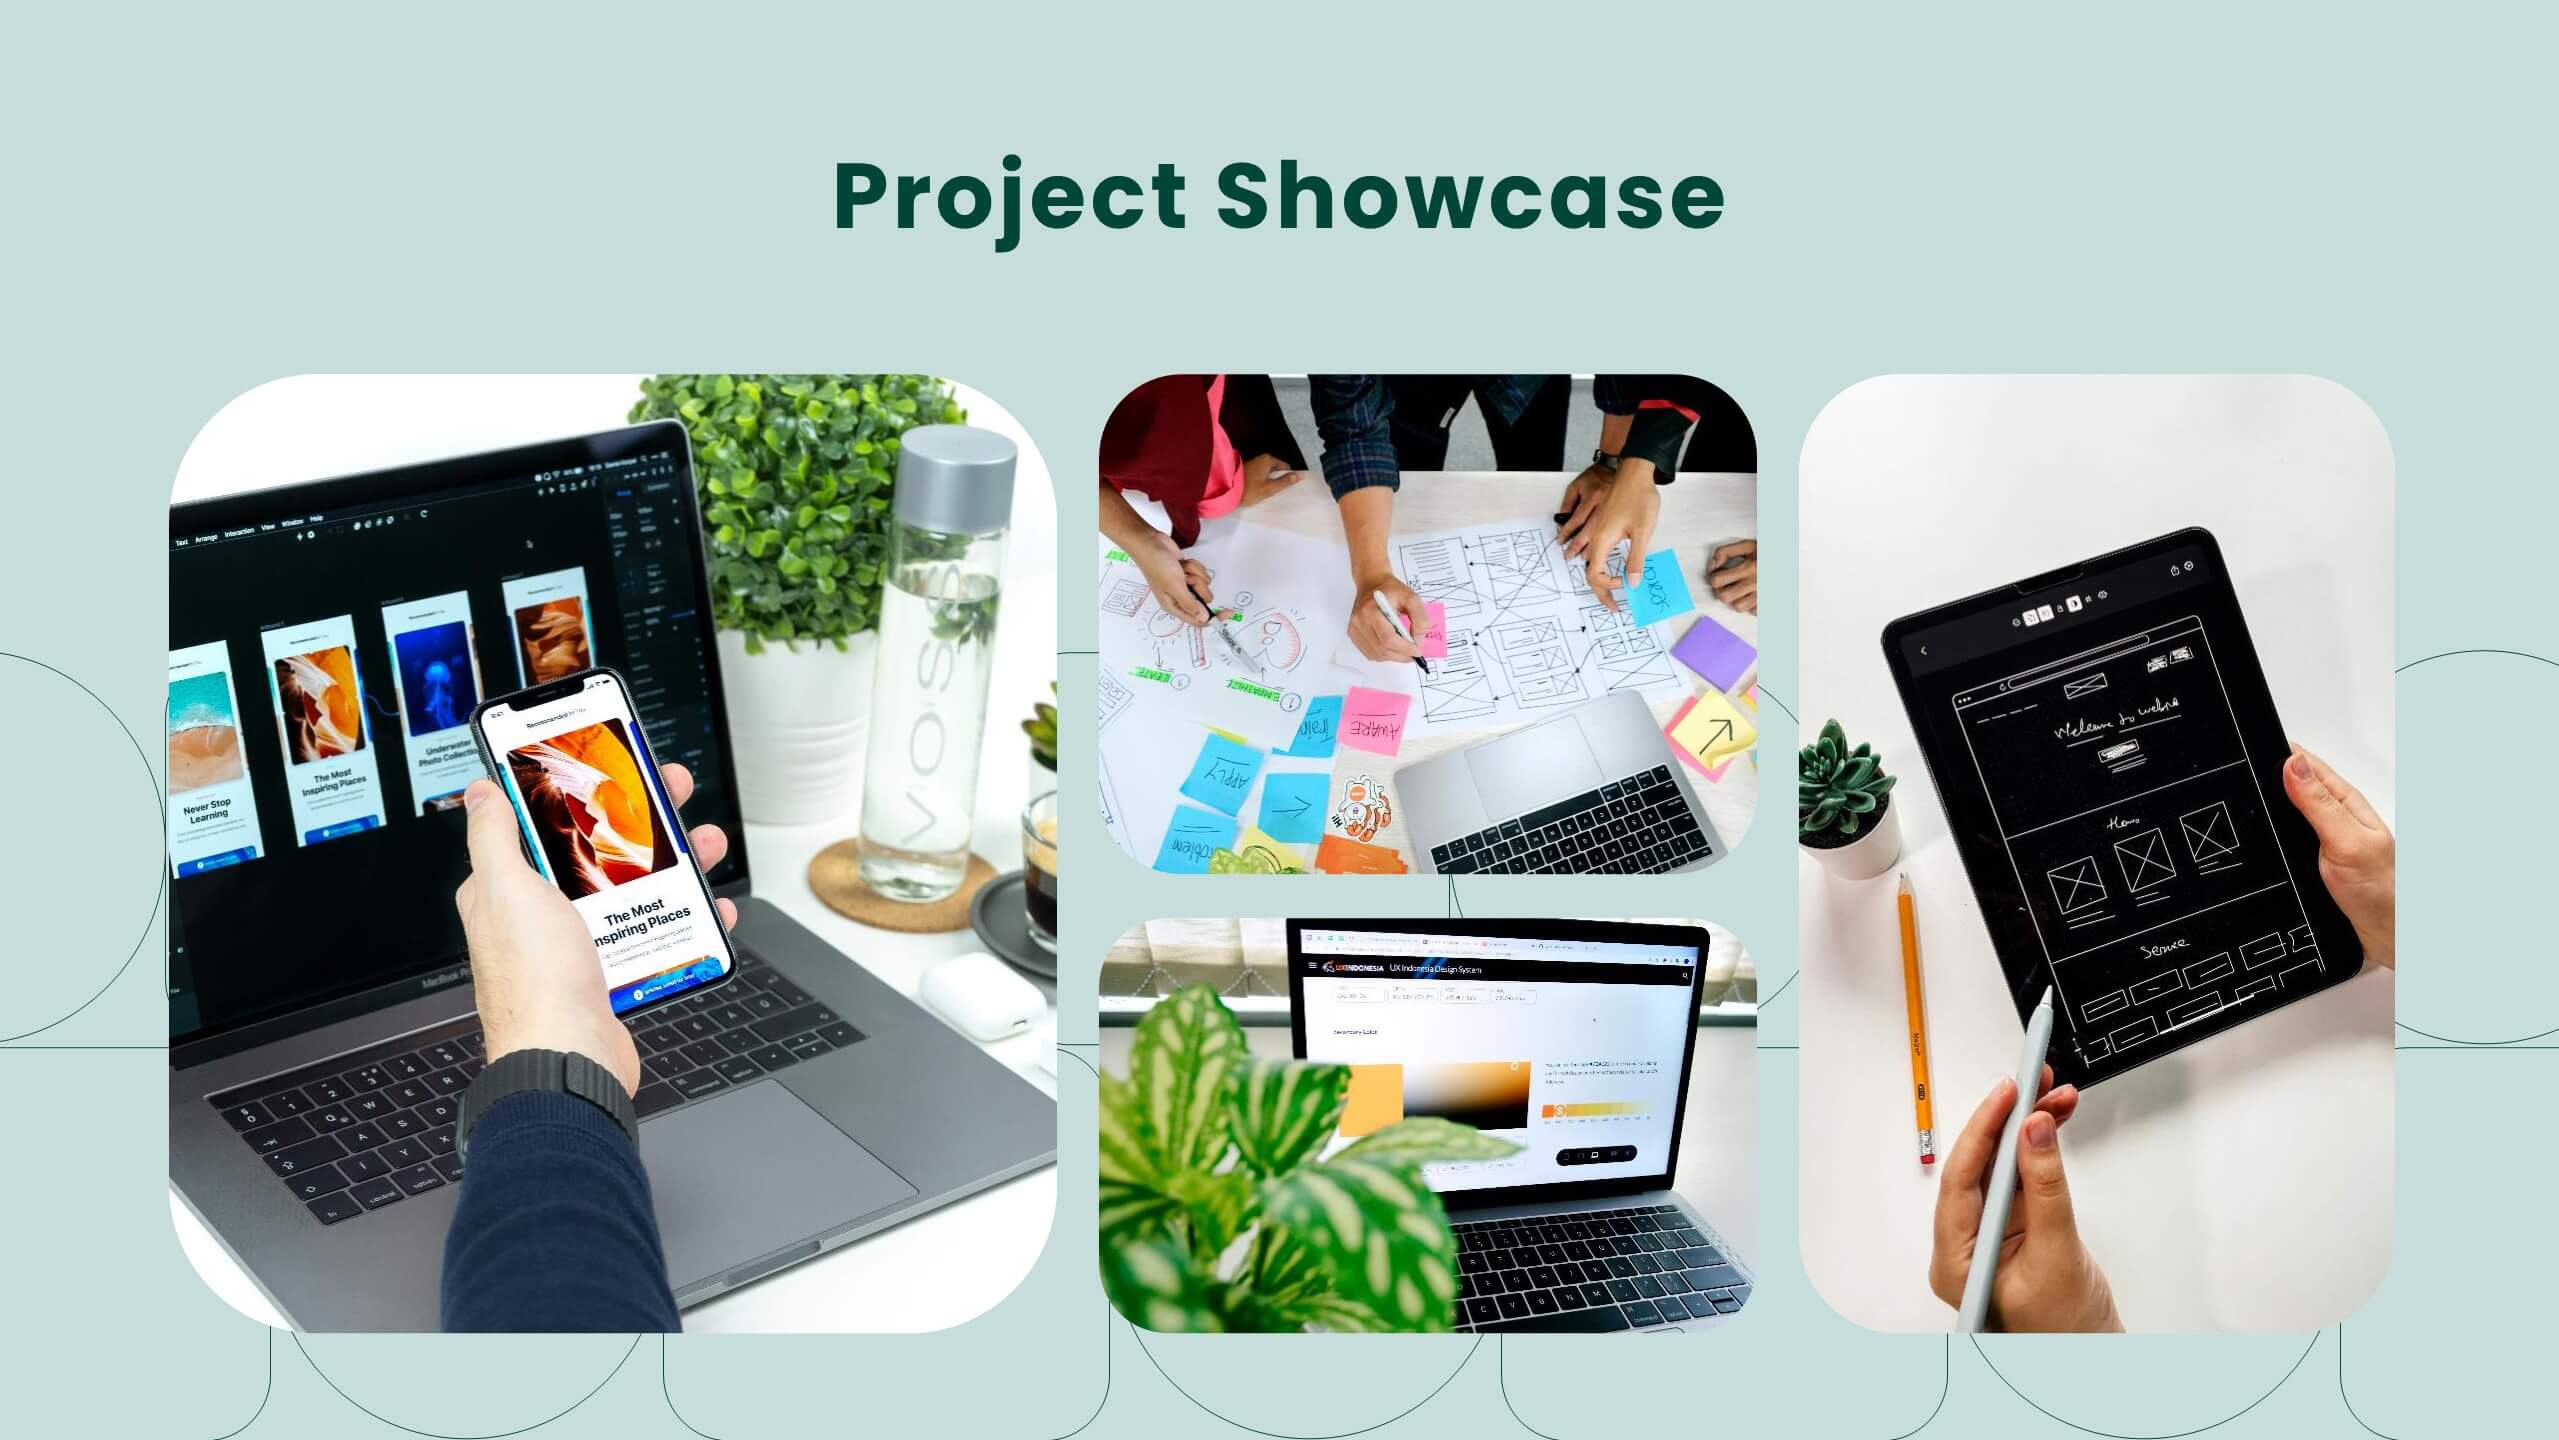
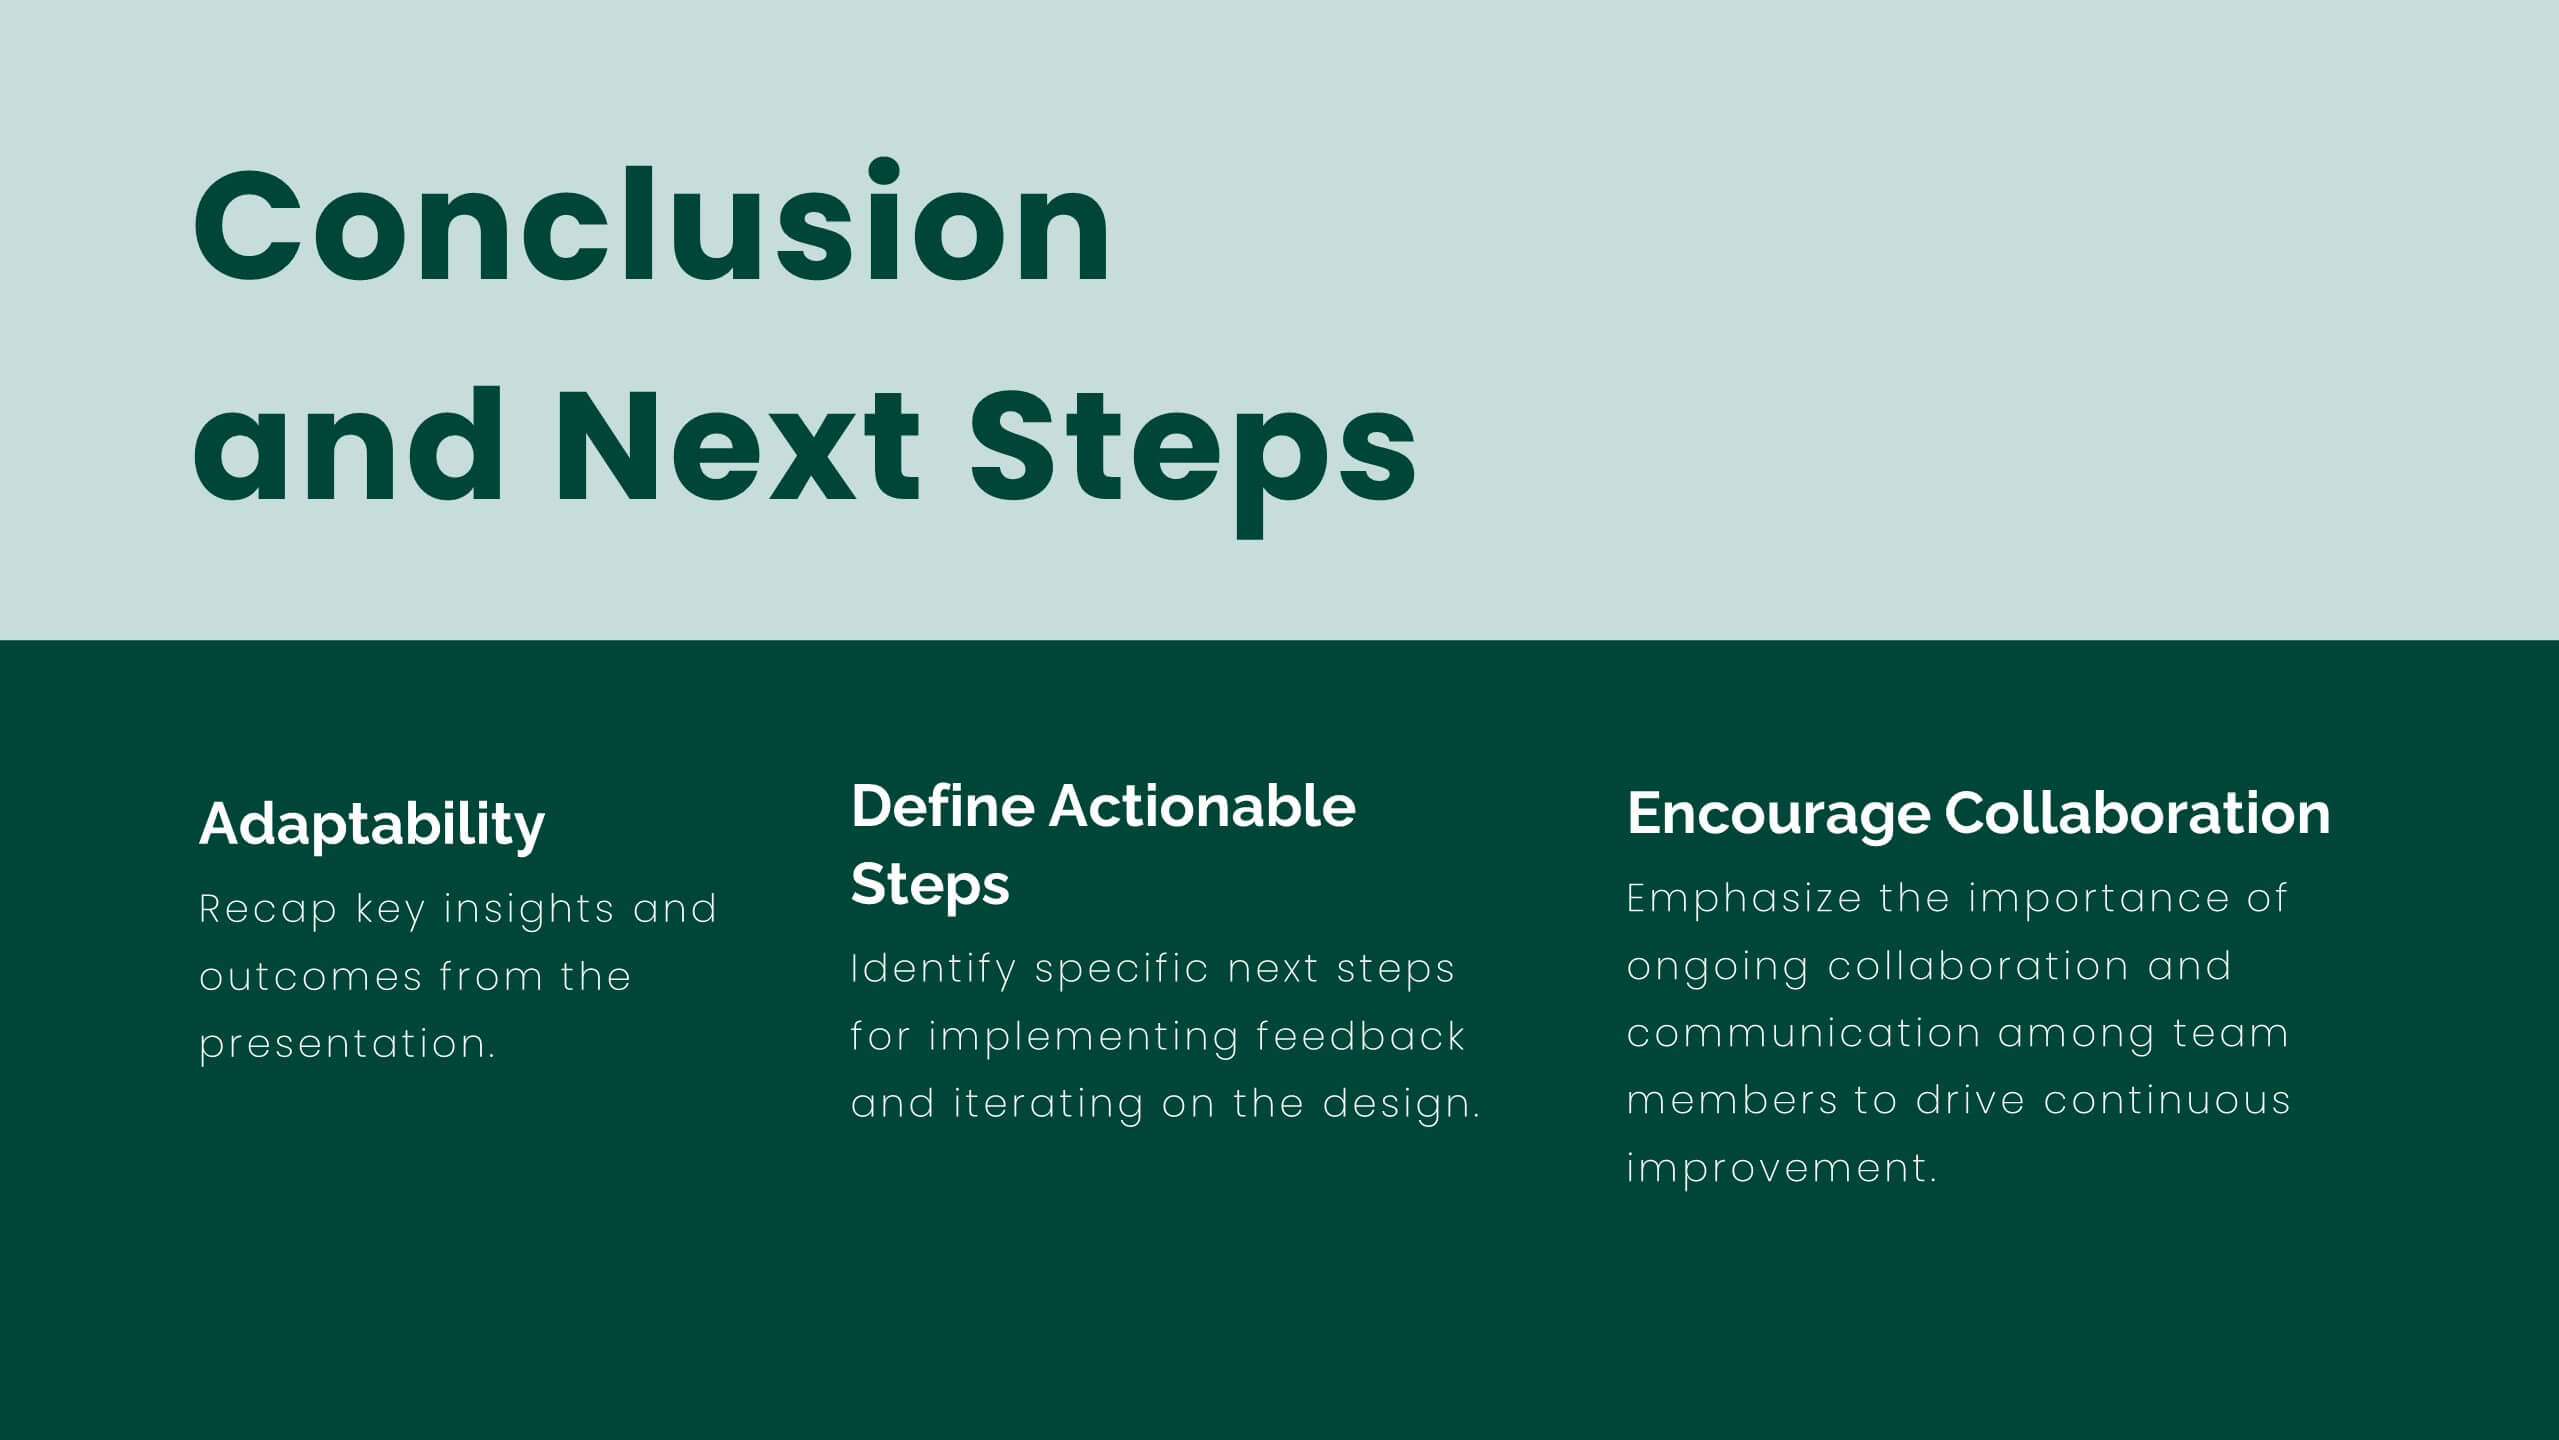
Create compelling UX case studies with this modern template. Cover user research, personas, wireframes, and prototyping. Perfect for showcasing UI design principles, responsive design, and usability guidelines. Highlight feedback, iteration, and project showcase. Compatible with PowerPoint, Keynote, and Google Slides. Elevate your UX presentations and impress stakeholders with clear, detailed insights.


7 slides
Online Marketing Plan Presentation
Turn your digital strategy into a story worth sharing with this clean, modern layout designed to showcase marketing goals, channels, and performance insights. Ideal for planning campaigns or presenting analytics, it keeps content structured and engaging. Fully editable and compatible with PowerPoint, Keynote, and Google Slides for easy customization.


7 slides
Work From Home Online Infographic
Work from home online refers to a work arrangement where individuals can perform their job responsibilities remotely, usually from their homes, using internet-connected devices like computers, laptops, tablets, or smartphones. Unveil the modern realm of remote work with our work from home online infographic. This visually engaging and informative template takes you on a journey through the digital landscape of remote work, showcasing its advantages, best practices, and the tools that enable seamless virtual collaboration. This infographic isn't just a visual guide it's a roadmap to thrive in the evolving world of work.


5 slides
Core to Outer Ring Concentric Planning Presentation
Present your strategy from the inside out with the Core to Outer Ring Concentric Planning Presentation. This layered, radial design guides viewers through a central concept outward into supporting elements—ideal for planning, process modeling, or decision frameworks. Fully customizable in PowerPoint, Keynote, and Google Slides.


6 slides
Aviation Classes Infographics
Discover the world of Aviation Classes with our customizable infographic template. This template is fully compatible with popular presentation software like PowerPoint, Keynote, and Google Slides, allowing you to easily customize it to illustrate and communicate various aspects of aviation education and training. The Aviation Classes infographic template offers a visually engaging platform to outline the types of aviation courses, training programs, career opportunities, and the importance of aviation education. Whether you're an aviation student, educator, aspiring pilot, or simply interested in aviation, this template provides a user-friendly canvas to create informative presentations and educational materials. Enhance your understanding of Aviation Classes with this SEO-optimized infographic template, thoughtfully designed for clarity and ease of use. Customize it to showcase different aviation disciplines, training institutions, certification requirements, and the role of education in the aviation industry. Ensure that your audience gains valuable insights into the world of aviation education. Start crafting your personalized infographic today to explore the realm of Aviation Classes.


8 slides
Workforce Skills Gap Analysis Presentation
Identify and Bridge Workforce Skill Gaps! This Workforce Skills Gap Analysis template provides a structured approach to assess, compare, and close competency gaps within an organization. Designed with interactive bar chart visuals, it enables HR professionals, managers, and training specialists to track employee skill levels, identify gaps, and align workforce development strategies. Fully customizable in PowerPoint, Keynote, and Google Slides, this template ensures a clear and data-driven approach to workforce planning and professional growth.


5 slides
European Countries Editable Map Presentation
Bring your data to life with a detailed and modern map layout that showcases insights across Europe. Perfect for visualizing country comparisons, regional statistics, or business expansion plans, this clean design ensures clarity and impact. Fully compatible with PowerPoint, Keynote, and Google Slides for easy editing and presentation.


6 slides
Future Trends in 5G Connectivity Presentation
Showcase the evolving landscape of mobile innovation with this modern 5G trends infographic. Featuring a central smartphone graphic and five vertically aligned icons, this slide is perfect for highlighting connectivity advancements, industry shifts, and upcoming opportunities. Color-coded markers enhance clarity for presentations on telecom, IoT, smart cities, and emerging tech. Fully editable in PowerPoint, Keynote, and Google Slides.


5 slides
Marketing Concepts Infographics
Marketing Concepts refer to the various strategies and philosophies that guide the marketing efforts of businesses and organizations. Our marketing concept infographics are visual representations of the different marketing concepts and strategies that businesses use to promote their products or services. These infographics can cover a wide range of marketing topics, including target audience, product positioning, branding, advertising, and video marketing. The purpose of these infographics is to provide a easy-to-understand overview of key marketing concepts that businesses can use to drive sales and increase brand awareness.