


Features
- 6 Unique slides
- Fully editable and easy to edit in Microsoft Powerpoint, Keynote and Google Slides
- 16:9 widescreen layout
- Clean and professional designs
- Export to JPG, PDF or send by email


Do you have any questions?
Recommend


5 slides
Business Process Workflow Presentation
Make your business processes crystal clear with this streamlined, modern layout. Designed to visualize every stage from start to success, this presentation helps communicate progress, efficiency, and key actions with precision. Perfect for business planning or reporting, it’s fully compatible with PowerPoint, Keynote, and Google Slides for easy customization.


19 slides
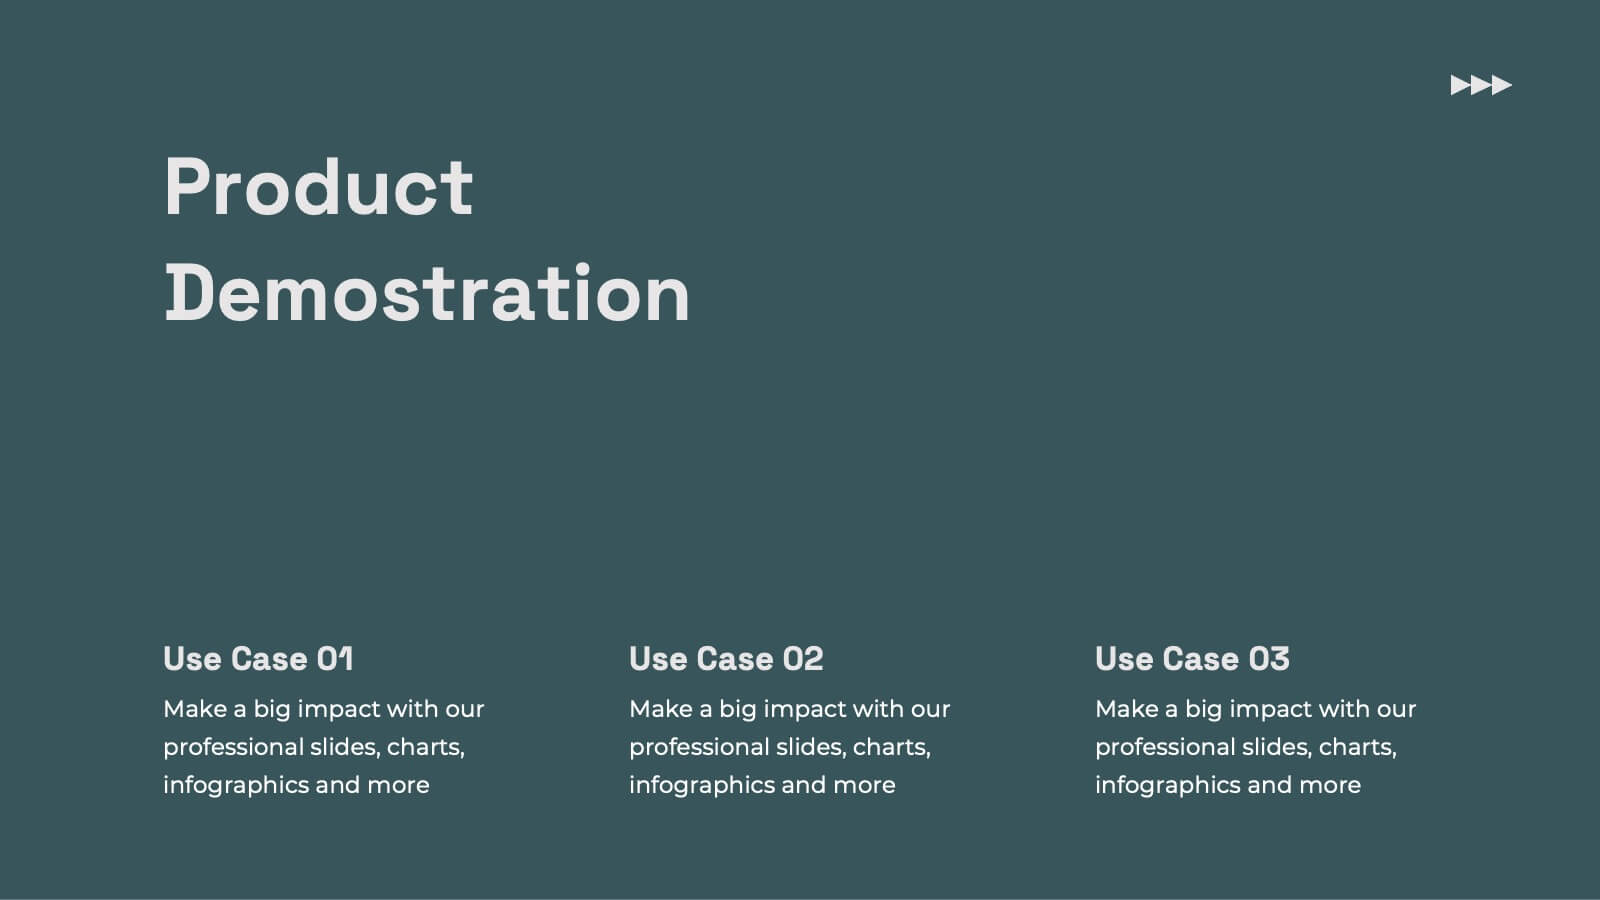
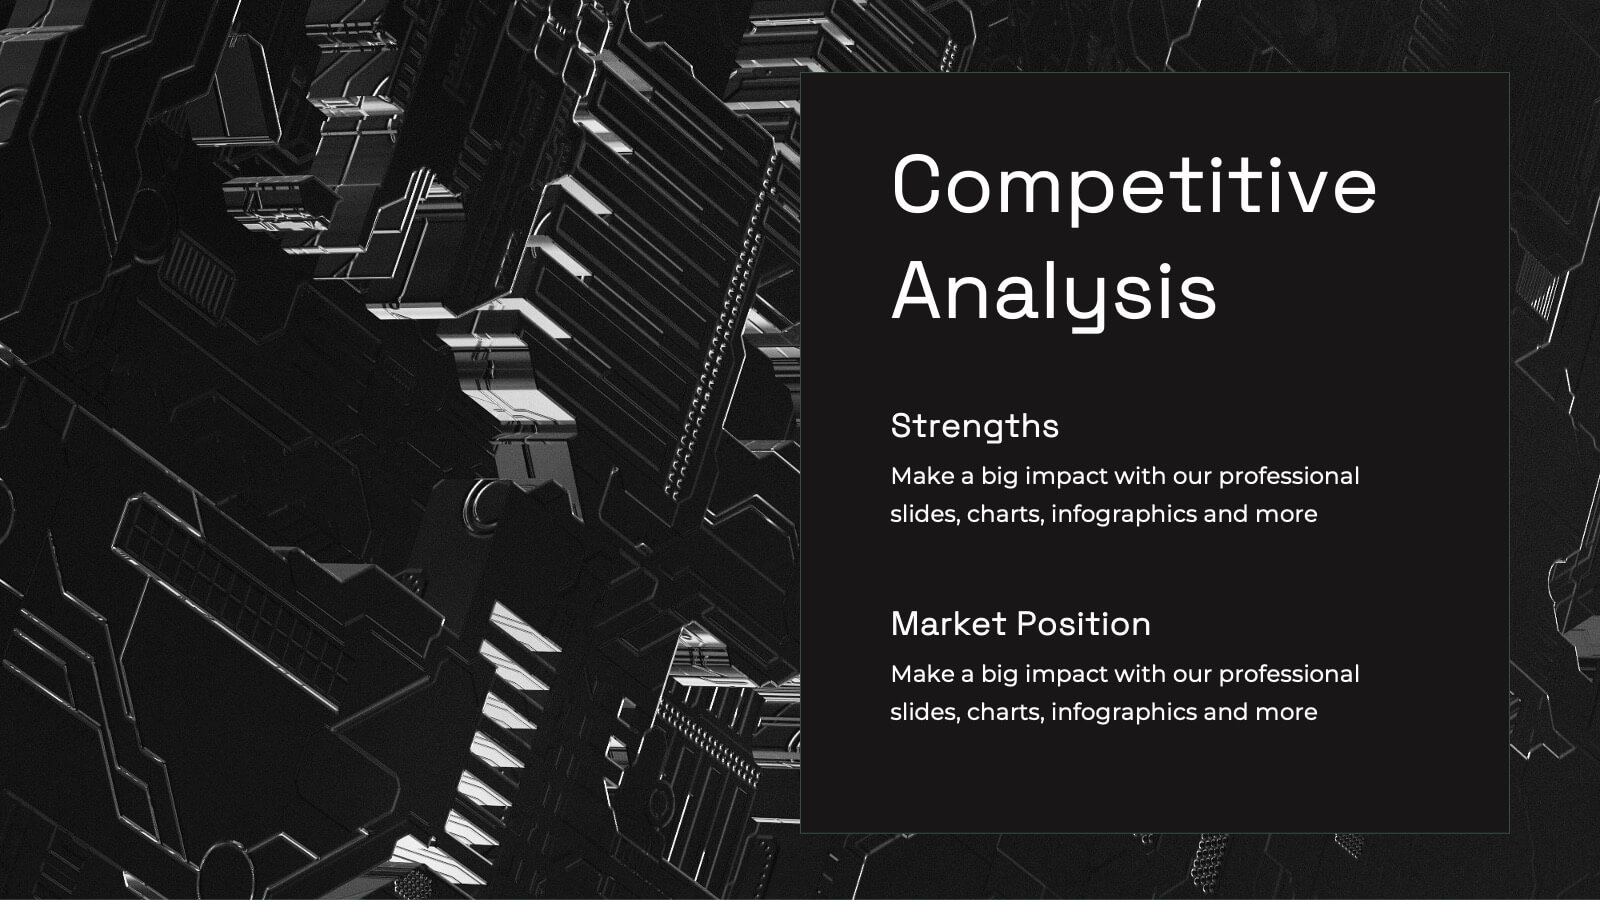
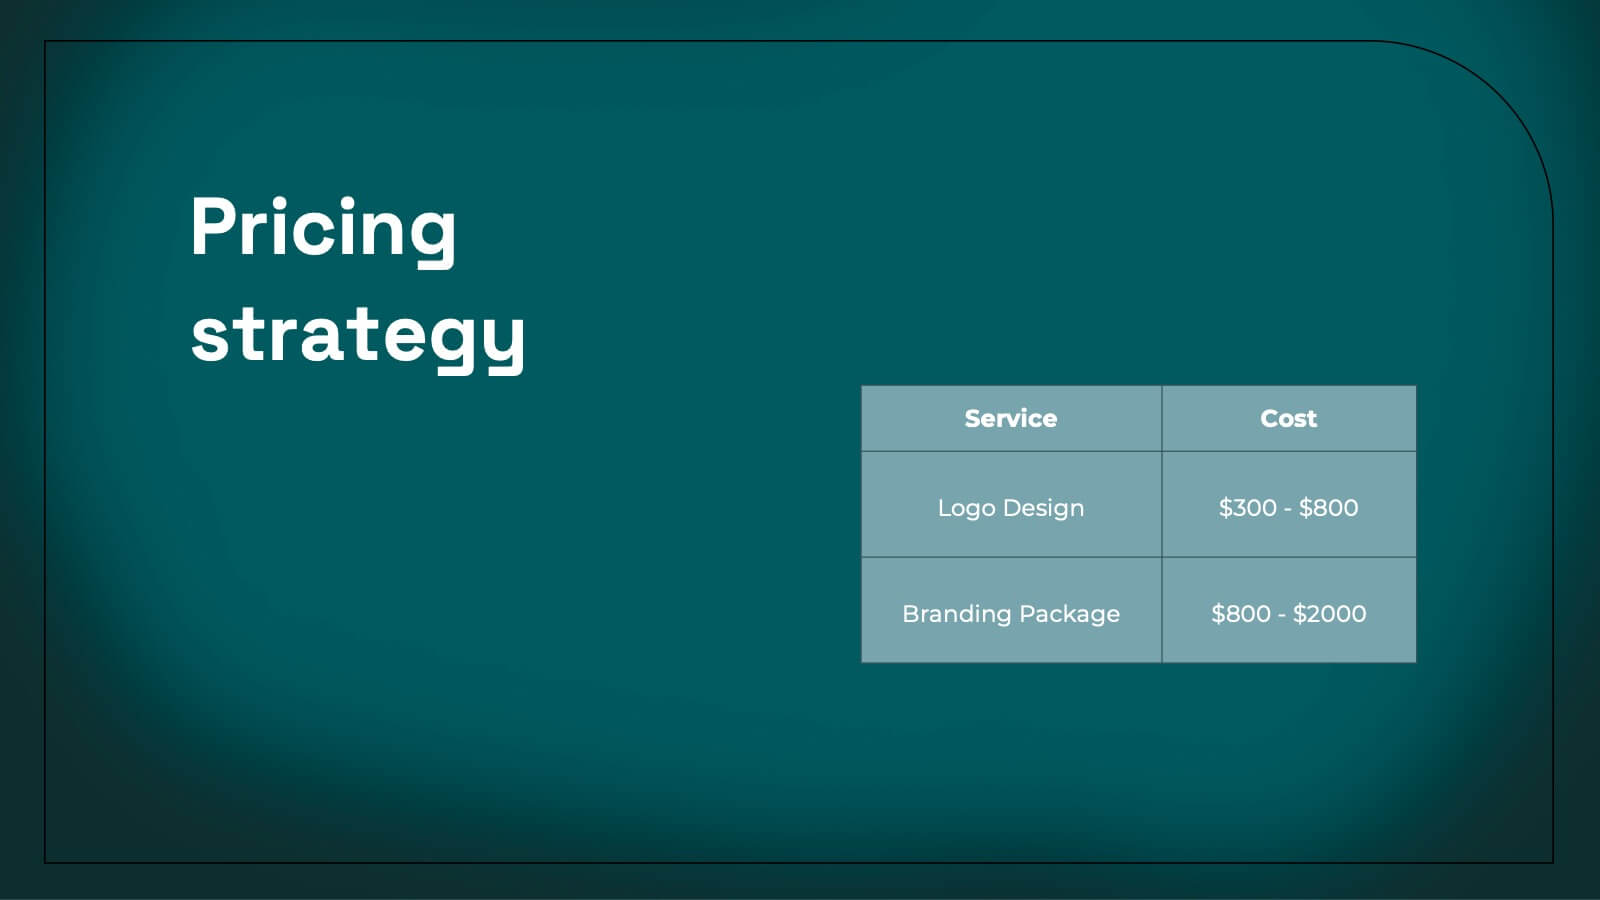
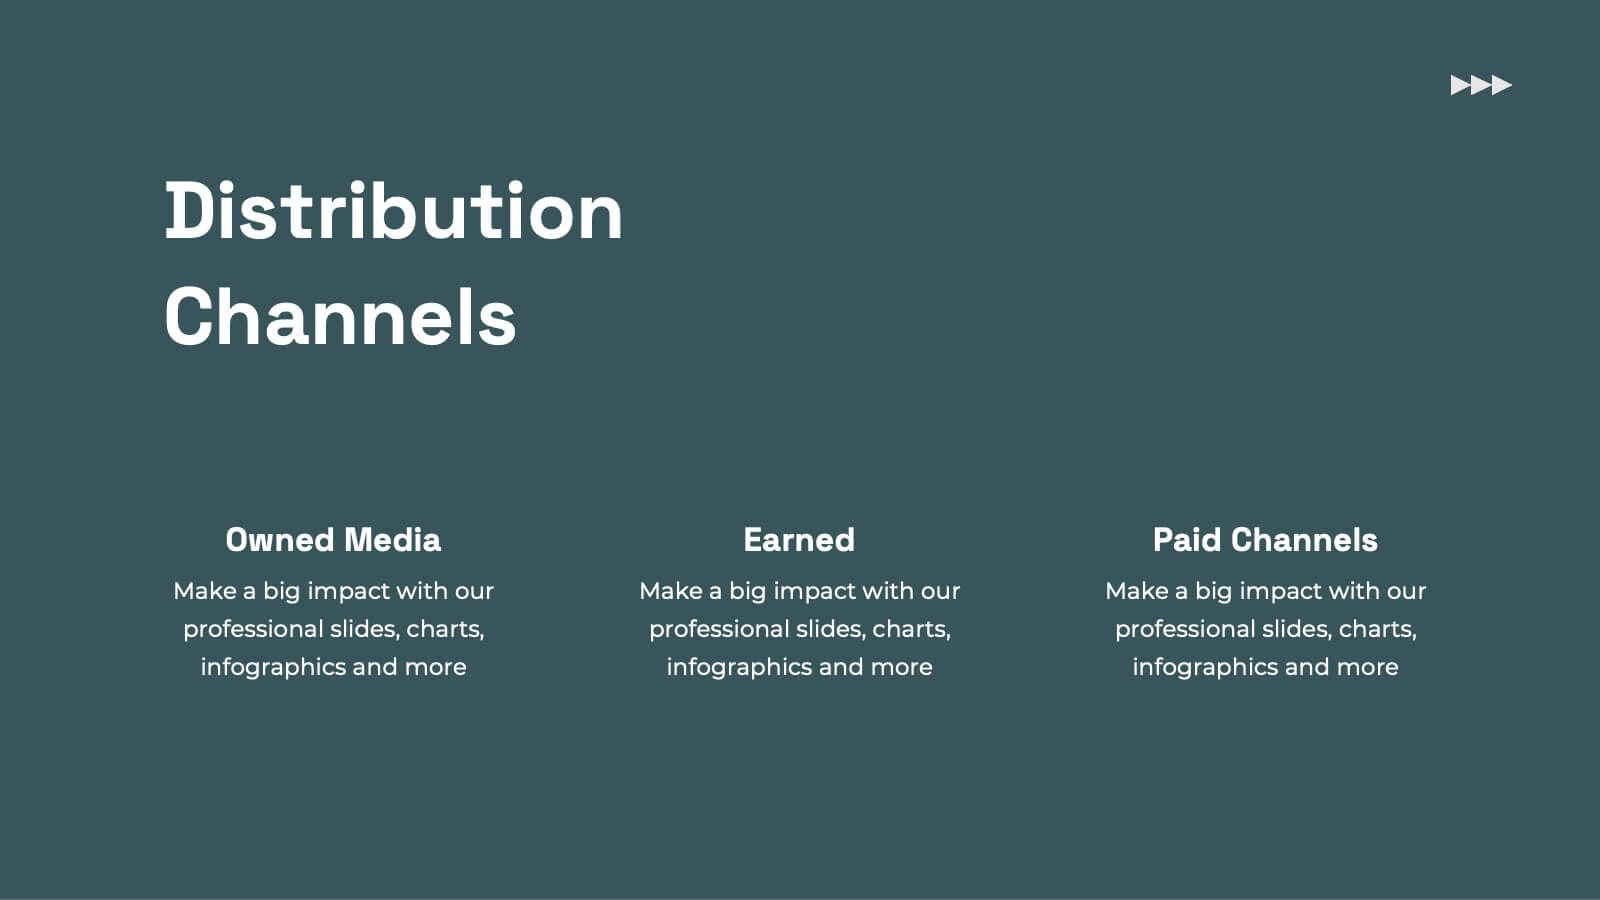
Kale Product Strategy Report Presentation
Unleash the power of your product with this bold and dynamic product strategy report template! Elevate your presentation with eye-catching designs that showcase product features, competitive analysis, and pricing strategies like never before. Captivate your audience from start to finish and leave a lasting impression. Fully compatible with PowerPoint, Keynote, and Google Slides!


7 slides
Circle Process Infographic
A Circle Process is a method used to involve a group of people in problem-solving and decision-making. The process is based on a circle shape, where everything is in a circle facing each other. The template includes vibrant colors and circle process charts that you can customize to make just right for your project. This template is perfect for any project or presentation school or business related. This circle process template works with Powerpoint, Keynote, and Google Slides, so you can use it on any device. This template is great for teamwork, community building, and conflict resolution.


5 slides
Startup Growth Roadmap and Milestones Presentation
Present your startup journey clearly with the Startup Growth Roadmap and Milestones Presentation. This timeline-style layout breaks down your key phases, from initial concept to market traction. Ideal for investor decks, pitch presentations, or internal planning. Fully editable in PowerPoint, Canva, and Google Slides for seamless customization.


21 slides
Veridian Agile Project Plan Presentation
Streamline your project management with this agile project plan template, featuring deliverables, timeline, resource allocation, and quality assurance. Ideal for agile teams, it helps in tracking progress and managing risks efficiently. Compatible with PowerPoint, Keynote, and Google Slides, ensuring seamless and impactful presentations.


21 slides
Riverlyn Artist Portfolio Template Presentation
Showcase your creative journey with this dynamic portfolio template, crafted for artists and creators seeking to captivate their audience. Highlight your philosophy, style, and key projects with a visually engaging design that reflects your artistic identity. Share your creative process and collaborations to provide deeper insights into your work. This template includes sections for client testimonials, services offered, and pricing details, making it an excellent choice for both professional presentations and personal branding. Fully customizable and compatible with PowerPoint, Google Slides, and Keynote, it offers seamless adaptability to meet your unique needs. Ideal for artists aiming to leave a lasting impression!


4 slides
Corporate Strategy Business Case Presentation
Develop a winning corporate strategy with this structured business case template! Perfect for analyzing finances, operations, market trends, and client insights, this clean and organized layout helps businesses communicate key strategies effectively. Fully customizable and compatible with PowerPoint, Keynote, and Google Slides for seamless, professional presentations.


7 slides
Team Work Skills Infographic Presentation
Teamwork is vital in the success of any venture. A team of people may be more powerful and productive than an individual. This template is designed to showcase all of your team work skills and abilities in an easy to follow structure. It uses icons, relevant graphics and vibrant colors. This Template will help you deliver your message with ease and style, enhancing the impact of your speech, whether in a solo performance or with a large audience. With this infographic your information is represented using geometric shapes, line graphs, pie charts, and more. Showcases your teamwork skills!


5 slides
Product Development and Market Growth
Showcase each stage of your product’s journey with this 5-step column chart—from idea to market expansion. Perfect for product managers, startups, and marketing teams. Fully customizable in PowerPoint, Keynote, or Google Slides to match your brand and message effortlessly.


4 slides
Executive Summary Business Presentation
Summarize key business insights effectively with this executive summary template! Designed to present an overview of your strategy, problem statement, solutions, and conclusions in a structured format, this layout ensures clarity and impact. Ideal for reports, proposals, and business plans. Fully customizable and compatible with PowerPoint, Keynote, and Google Slides.


6 slides
Structured Table of Content Layout Presentation
Organize your presentation with clarity using this Structured Table of Content Layout. Ideal for overviews, agendas, or segmented discussions, this template features clean typography, icons, and a photo section. Fully editable in PowerPoint, Keynote, and Google Slides—perfect for professional reports, project briefs, or pitch decks that need clear navigation.


4 slides
E-Learning Course Design Overview Presentation
Spark curiosity from the very first slide with a clean, modern layout that explains how effective online learning experiences are planned and delivered. This presentation walks through key elements of course structure, content flow, and learner engagement in a simple, visual way. Fully compatible with PowerPoint, Keynote, and Google Slides.


4 slides
Technology Device Mockup Presentation
Bring your ideas to life with a sleek, modern slide that showcases your digital product in a clean smartphone mockup. This presentation explains key features or app benefits with clear, structured text that keeps your message focused and professional. Fully compatible with PowerPoint, Keynote, and Google Slides for easy editing and use.


7 slides
Security Jobs Infographic
Security jobs refer to roles and positions within various industries that primarily focus on safeguarding individuals, properties, data, and assets from potential threats, risks, or unauthorized access. This infographic template is designed to shed light on the diverse and dynamic world of security professions. Fully customizable and compatible with Powerpoint, Keynote, and Google Slides. This infographic is your gateway to understanding the vital roles that contribute to a safer world. Discover your path, protect communities, and embark on a fulfilling career journey in security.


5 slides
Workplace Safety Guidelines and Protocols Presentation
Prioritize health and hazard awareness with the Workplace Safety Guidelines and Protocols presentation. Featuring a clean visual of a segmented fire extinguisher, this design clearly breaks down safety measures into five customizable steps. Ideal for internal training, HR onboarding, or compliance meetings, each section is paired with editable titles and descriptive placeholders. Communicate procedures like emergency response, equipment use, or safety checklists effectively. Compatible with PowerPoint, Keynote, and Google Slides, this template ensures your team stays informed and aligned.


21 slides
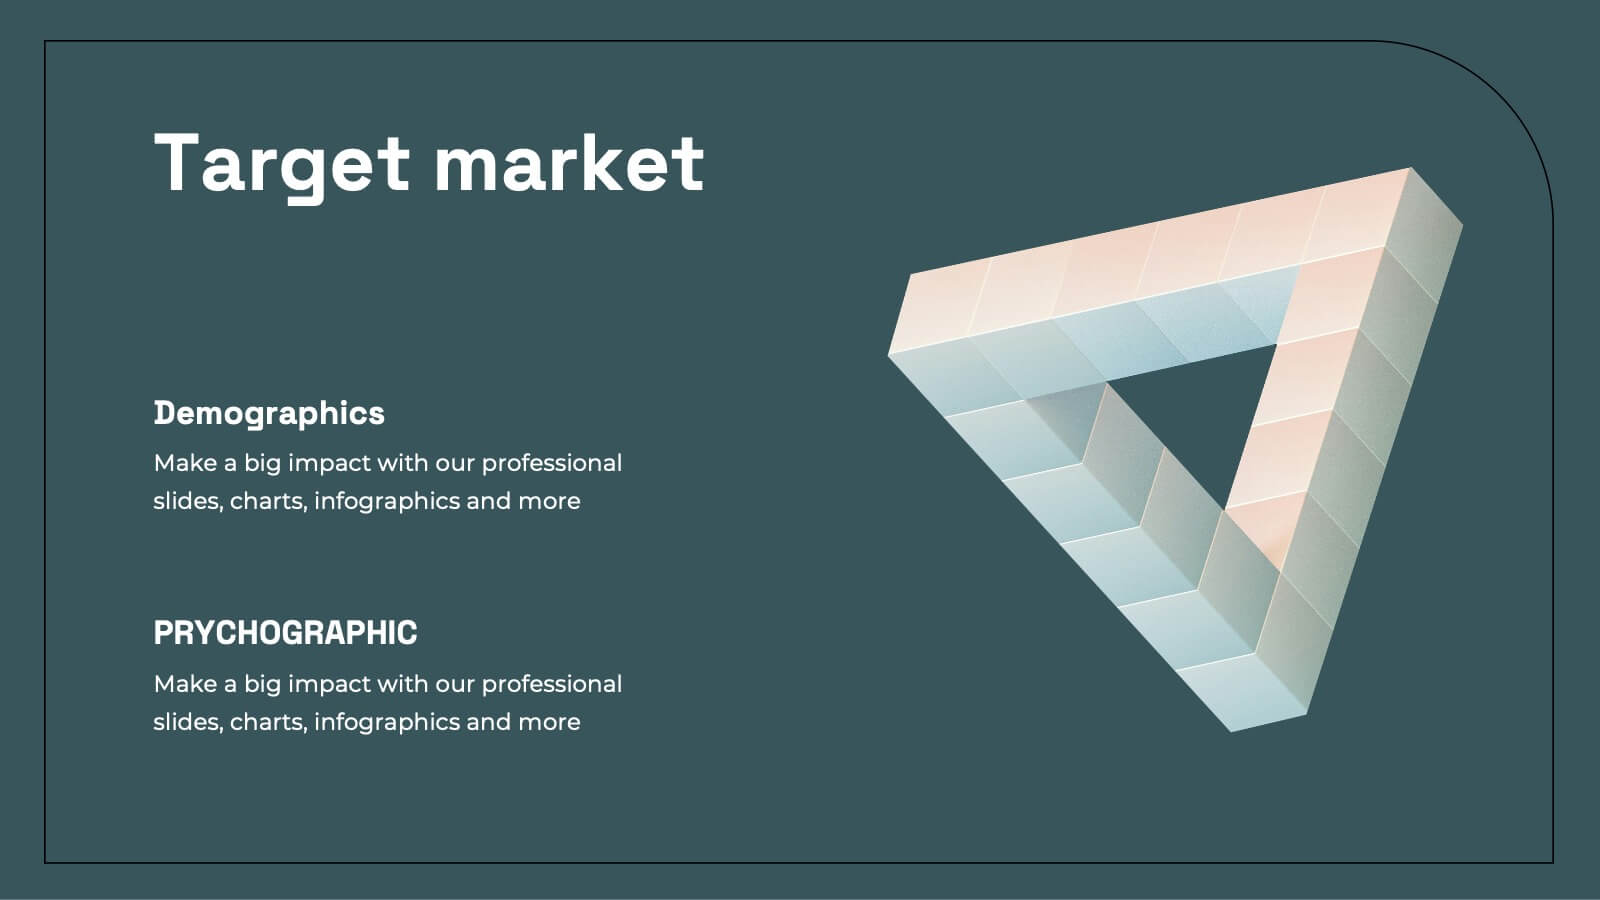
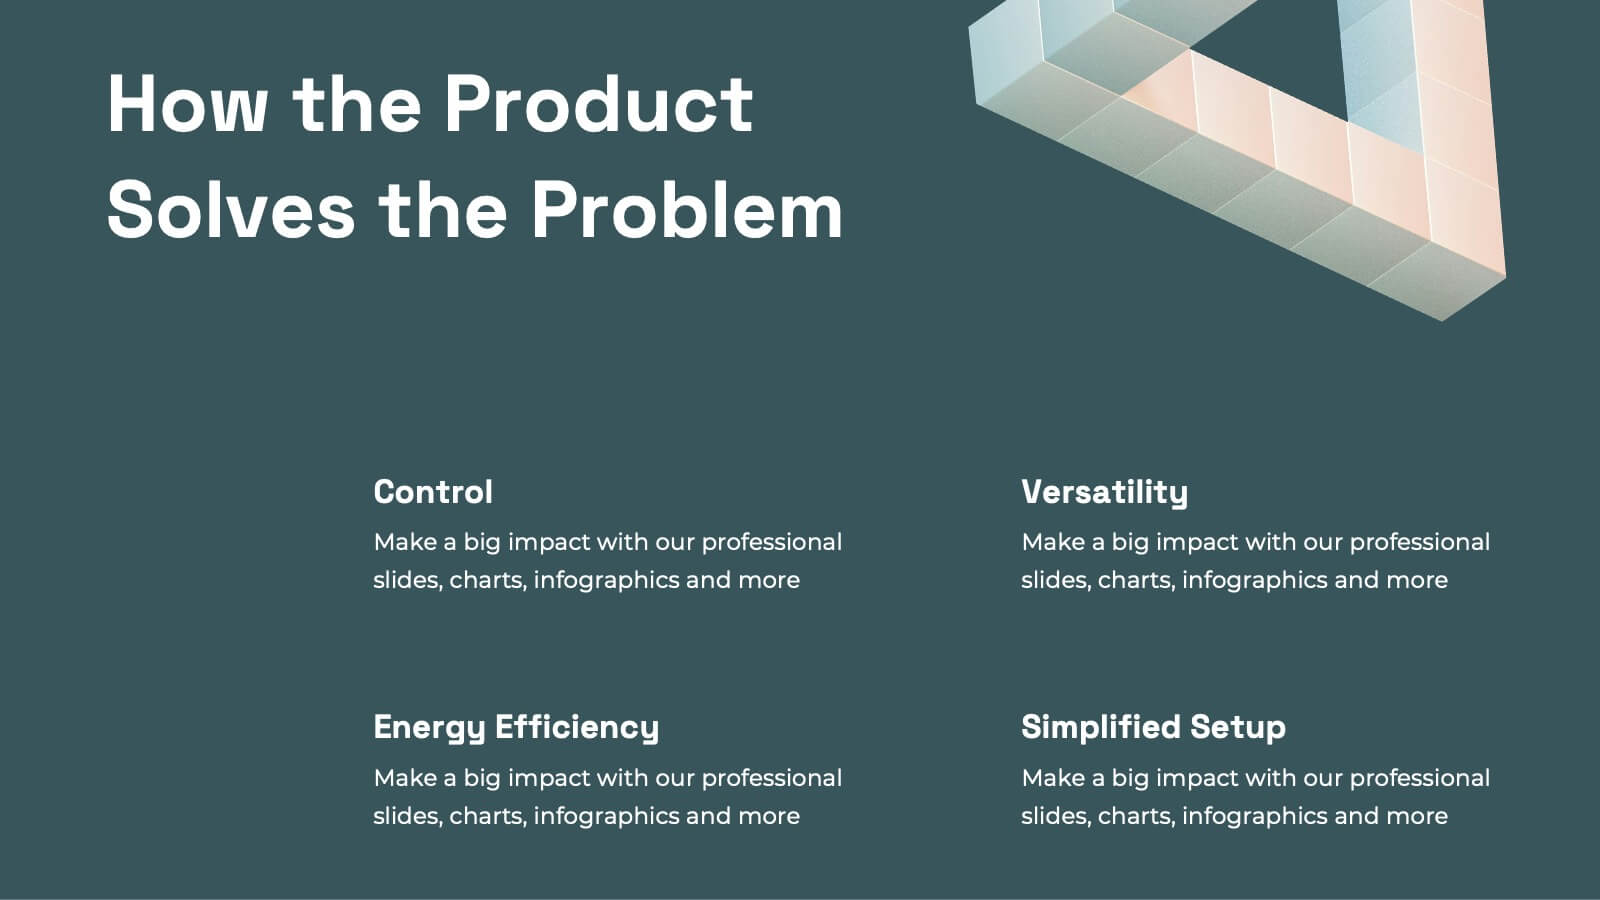
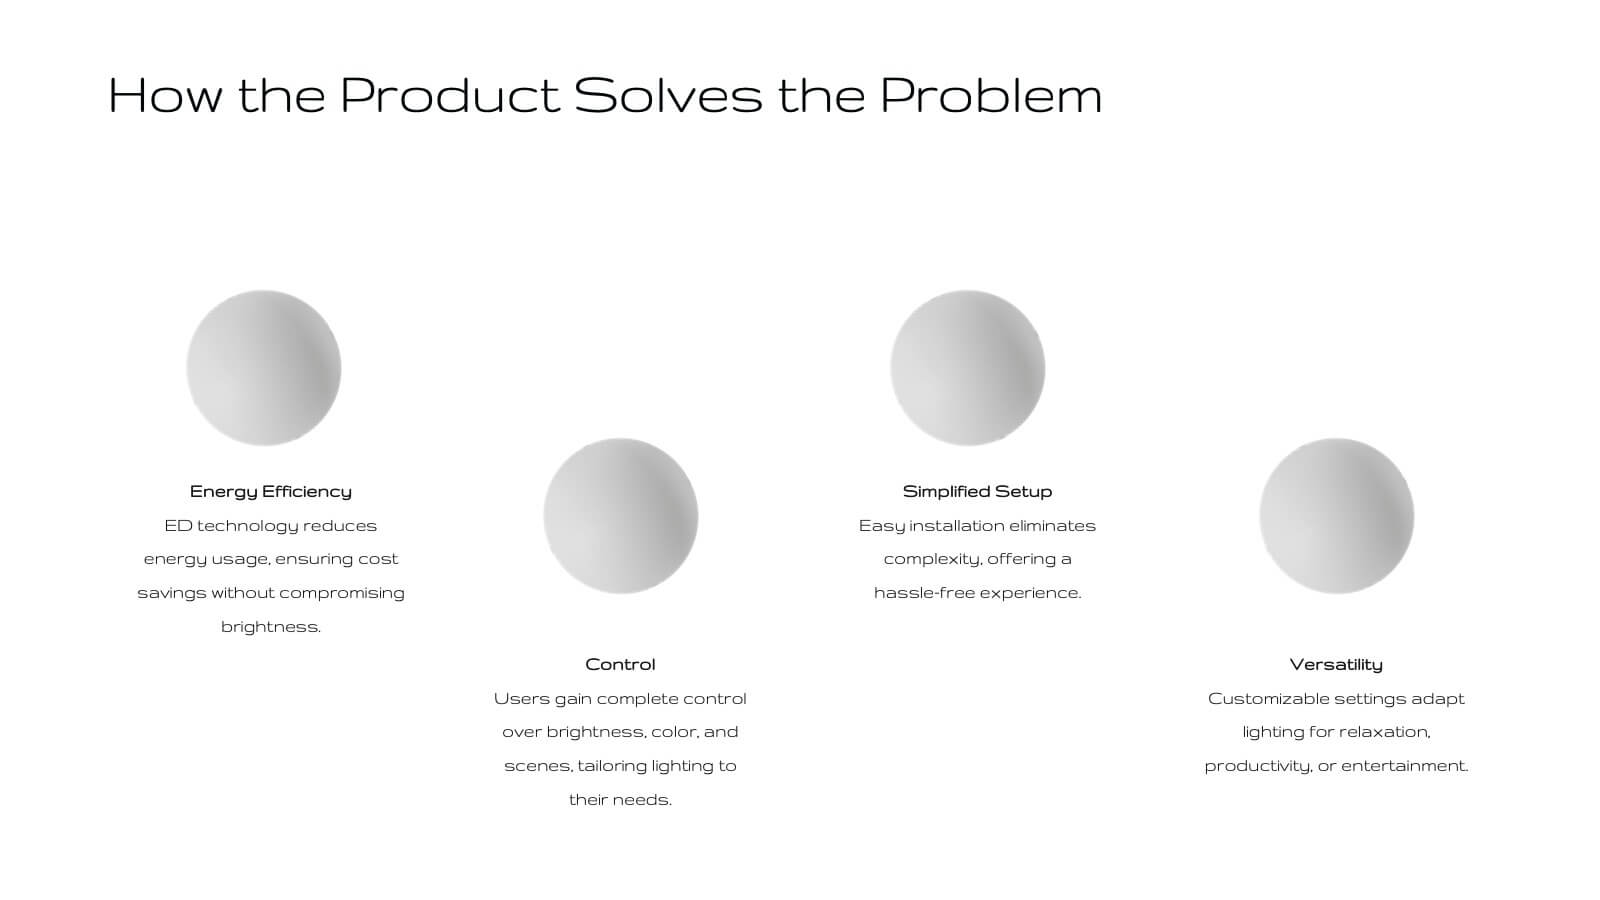
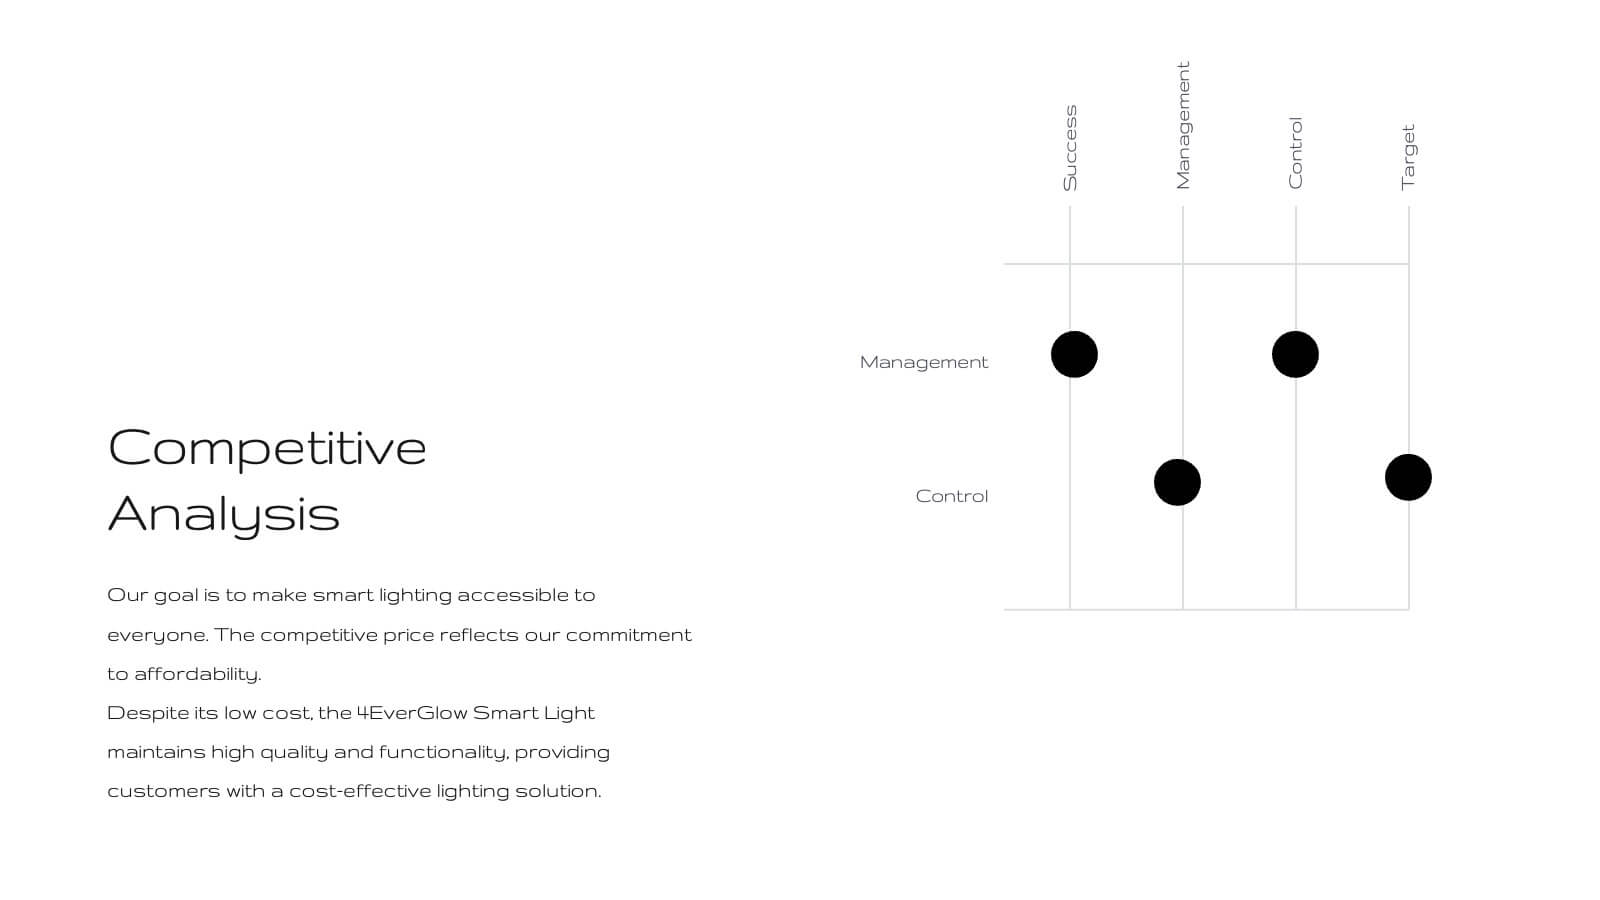
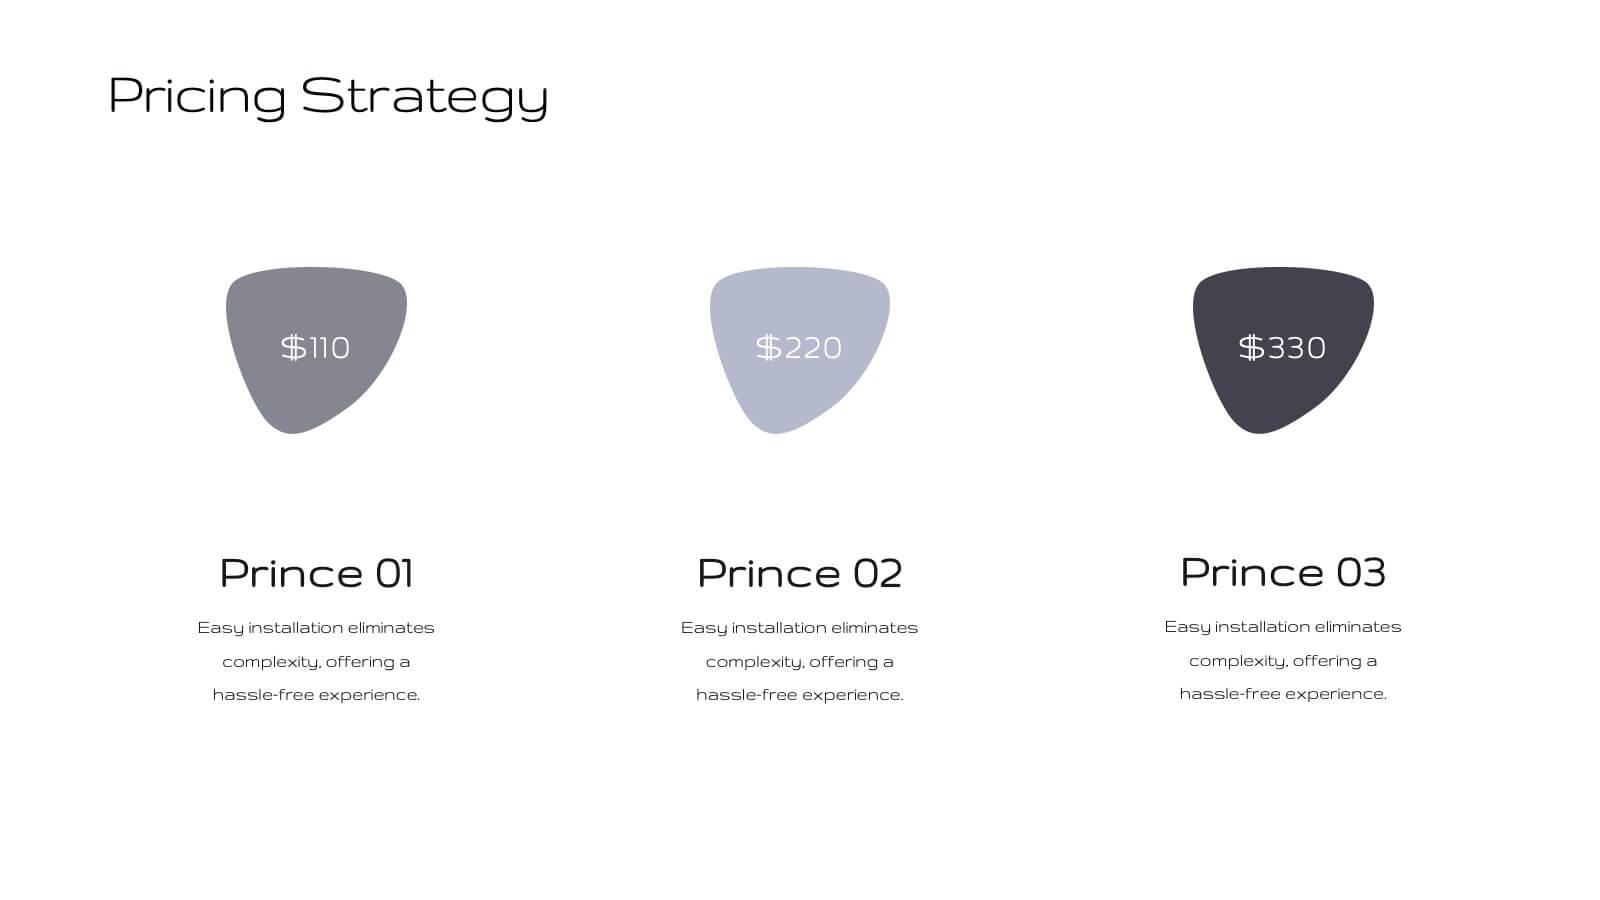
Fortuna Product Development Plan Presentation
Unveil your product's potential with this elegant, minimalist presentation template. Perfect for detailing product development, features, and market strategies, it features a clean design that emphasizes clarity and professionalism. Highlight key aspects like customer pain points, competitive analysis, and pricing strategies to captivate your audience. Compatible with PowerPoint, Keynote, and Google Slides, it ensures seamless presentations on any platform.


7 slides
Frequently Asked Questions (FAQ)
Answer key concerns clearly with this Frequently Asked Questions (FAQ) infographic template. Featuring a clean question mark-centered design with six content blocks, this layout is perfect for addressing customer queries, onboarding information, or stakeholder briefs. Fully customizable in PowerPoint, Keynote, and Google Slides.