


Features
- 5 Unique slides
- Fully editable and easy to edit in Microsoft Powerpoint, Keynote and Google Slides
- 16:9 widescreen layout
- Clean and professional designs
- Export to JPG, PDF or send by email


Do you have any questions?
Recommend


7 slides
McKinsey 7S Model Infographic Presentation Template
The McKinsey 7S model is a management framework developed by the consulting firm McKinsey & Company. The model consists of seven interdependent factors that are important for an organization's success: strategy, structure, systems, shared values, skills, staff, and style. The template can be used to visualize the 7S model hierarchy and the importance of each component to your business. This inventive presentation is designed to take an economic approach, If you’re interested in taking this strategic step to evaluating your processes and measuring performance, this presentation is for you.


10 slides
Financial Investment Strategy Presentation
Bring your financial ideas together with a clean, puzzle-style layout that instantly makes complex strategies feel organized and actionable. This presentation helps you explain key components, compare performance drivers, and present investment plans with clarity and confidence. Easy to edit and fully compatible with PowerPoint, Keynote, and Google Slides.


5 slides
Business Executive Summary Report Presentation
Simplify your executive reporting with this 'Business Executive Summary Report' template, designed to present critical insights at a glance. This template streamlines complex data into digestible parts, ensuring clarity and impact in every slide. Perfect for executives and managers using PowerPoint, Keynote, and Google Slides.


3 slides
Organized Bullet Point Summary Presentation
Present key facts clearly with the Organized Bullet Point Summary Presentation. Designed for structured communication, this layout visually breaks down your main points with icons, color blocks, and percentage highlights. Perfect for reporting metrics, comparing ideas, or prioritizing tasks. Fully editable in PowerPoint, Keynote, and Google Slides.


7 slides
Technology Infographic Presentation Template
A technology infographic is a visual representation of information or data related to technology. The purpose of this template is to present your complex information in a simple, easy-to-understand manner. This template contains pre-designed layouts and images that can be used to structure your content in a variety of ways. This template is perfect to use to help explain technology-related topics such as software, hardware, cybersecurity, and more. Infographics are commonly used in the technology industry to help educate people about the latest trends, products, and services.


20 slides
Amethyst Marketing Proposal Template Presentation
Bring your marketing ideas to life with this eye-catching amethyst-themed presentation! Tailored for presenting your marketing proposals, this template helps you outline key strategies, campaigns, and target audiences in a sleek, professional design. Its bold layout ensures your message shines through. Compatible with PowerPoint, Keynote, and Google Slides.


21 slides
Journey Sales Proposal Presentation
Get ready to seal the deal with the Journey Sales Proposal Presentation template! This template is designed to help you craft compelling sales proposals that captivate and convince. With a clean, modern design, it allows you to showcase your products or services, highlight your competitive edge, and present your pricing strategies effectively. Each slide is thoughtfully designed to guide your audience through the sales process, from introduction to final agreement. Whether you're pitching to potential clients or presenting to stakeholders, this template provides the perfect structure to outline your objectives, strategies, and key metrics. It also includes sections for team introductions, customer testimonials, and future opportunities, making it a comprehensive tool for any sales professional. The Journey template is fully customizable and compatible with PowerPoint, Keynote, and Google Slides, ensuring you can easily tailor it to fit your brand and message. Start closing more deals with style and confidence!


5 slides
Workout Motivation Infographics
Finding and maintaining Workout Motivation is a personal journey. These vertical infographics are informative designs that aim to inspire and motivate individuals to maintain an active and healthy lifestyle. This template is perfect for fitness professionals, personal trainers, health coaches, or anyone looking to create engaging content about workout motivation. With its vibrant and dynamic visuals, the template captures the essence of fitness and encourages viewers to embark on their fitness journey. They are designed with eye-catching icons, illustrations, and color schemes that grab attention and make the information easy to understand and remember.


7 slides
Demographic Traits Infographic
Dive deep into the world of demographics with our demographic traits infographic. Painted in hues of white, yellow, and blue, this infographic expertly visualizes population data within a map layout, ensuring a cohesive understanding of varied traits across regions. Tailored for market researchers, sociologists, business analysts, and educators, this tool is designed to make complex demographic data comprehensible and engaging. Whether you're using PowerPoint, Keynote, or Google Slides, our infographic will seamlessly fit, elevating the quality and clarity of your presentation.


6 slides
Hierarchical Thought Flow Mind Map Presentation
Present your ideas with clarity using this Hierarchical Thought Flow Mind Map presentation. Designed for structured thinking, this layout displays six key concepts radiating from a central theme, making it ideal for workflows, strategies, or team roles. Fully editable in Canva, PowerPoint, and Google Slides for total customization.


5 slides
AI Trends and Innovations Presentation
The "AI Trends and Innovations" presentation template is elegantly designed to help you convey the latest advancements and trends in artificial intelligence. Each slide focuses on different key points such as machine learning, neural networks, robotics, and data analytics, represented by interconnected icons that visually map the flow of information and ideas. This layout is perfect for professionals seeking to illustrate complex AI concepts in a digestible format, making it ideal for educational presentations, tech conferences, or internal company meetings focused on technological growth and innovation.


3 slides
Agile Workflow and Team Roles Presentation
Visualize team roles, responsibilities, and task flow using this agile loop diagram. Ideal for Scrum teams, project managers, and product owners. Clearly outline percentages, priorities, and stages in the process. Fully editable in PowerPoint, Keynote, and Google Slides—perfect for training, team updates, or workflow overviews.


6 slides
Consumer Decision Infographic
Consumer decision-making refers to the process through which individuals make choices about purchasing goods or services. This infographic template visually represents the process that consumers go through when making purchasing decisions. This template can be used to serve as a valuable tool to help your audience understand the steps consumers go through before making a purchase. This infographic is designed to provide insights for businesses to tailor their marketing strategies accordingly. Fully customizable and compatible with Powerpoint, Keynote, and Google Slides. Include statistics and data to highlight trends in consumer behavior.


6 slides
Business Risk Mitigation Framework Presentation
Visualize and communicate your risk management strategies with this two-part puzzle-style framework. Ideal for showcasing problems and solutions, action plans, or risk-response workflows. Clean and modern layout enhances clarity. Fully editable in PowerPoint, Keynote, and Google Slides—perfect for business continuity planning, operational strategy, and stakeholder presentations.


26 slides
Green Business Initiatives Presentation
Lead the charge in sustainability with our Green Business Initiatives presentation template. This eco-friendly template, fully compatible with PowerPoint, Keynote, and Google Slides, is designed for forward-thinking professionals committed to environmental stewardship. Showcase your company's dedication to sustainability with slides that highlight green policies, sustainable practices, and the long-term benefits of eco-conscious operations. The template's customizable elements allow you to present your environmental initiatives with clarity and impact, ensuring your message resonates with your audience. Whether you're a green startup or an established corporation, our template is SEO-optimized to help you spread the word about your commitment to the planet. Engage stakeholders and encourage industry-wide change with a presentation that underscores the value of green business strategies.


5 slides
Work Schedule Overview Presentation
Keep your week perfectly organized with this clean and modern layout designed to simplify planning and scheduling. Ideal for presenting weekly goals, tasks, or project timelines, it helps teams stay aligned and productive. Fully customizable and compatible with PowerPoint, Keynote, and Google Slides for effortless professional presentations.
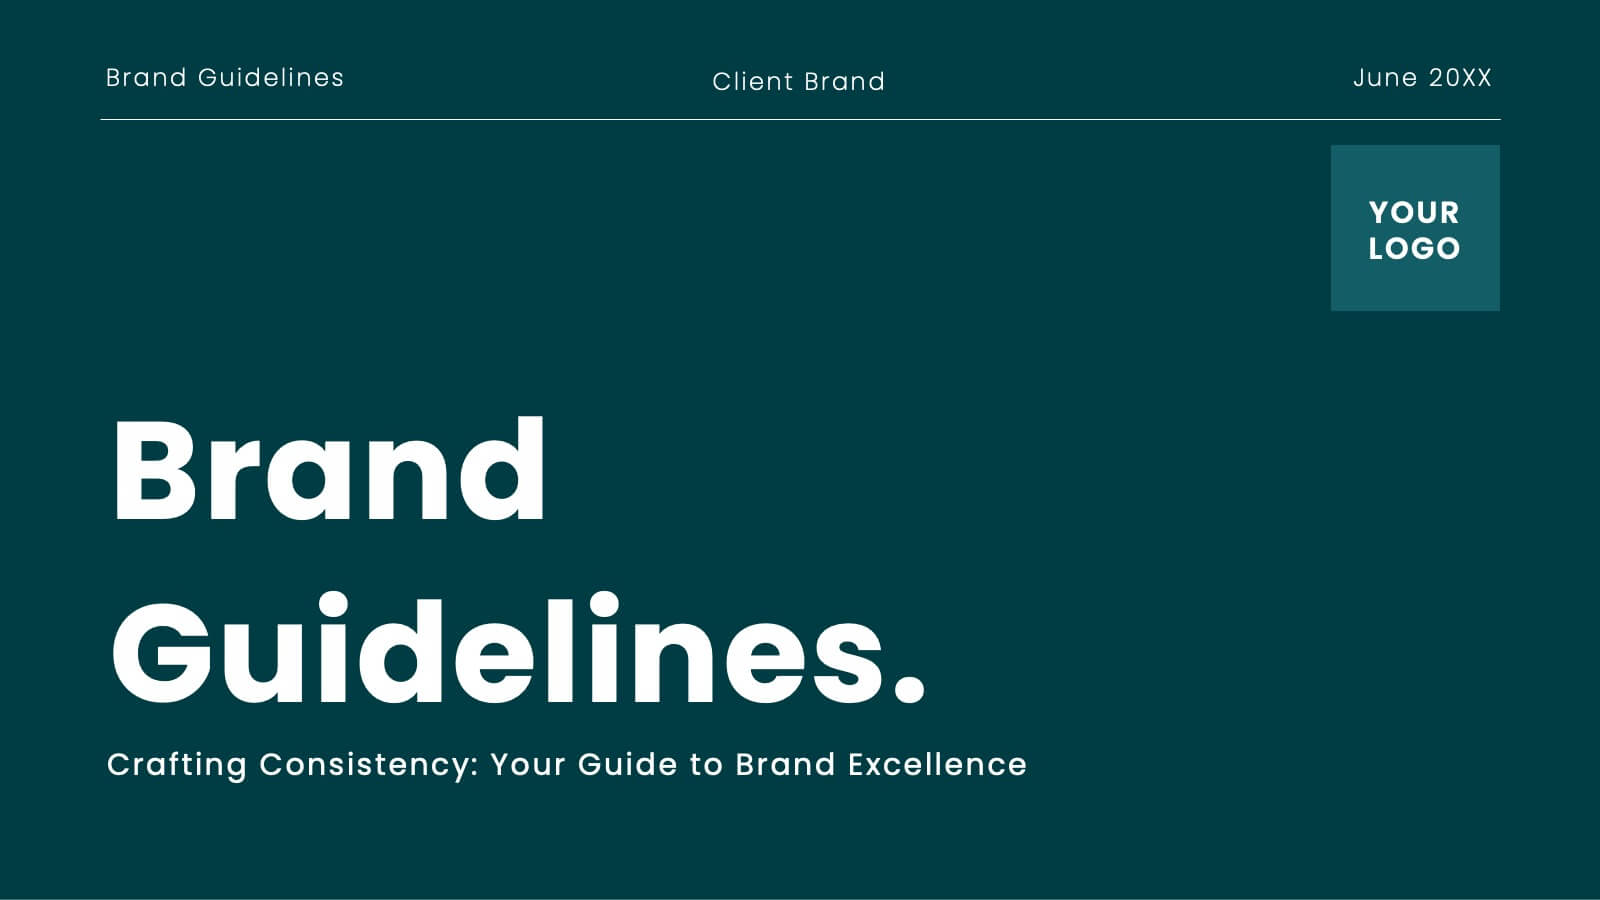
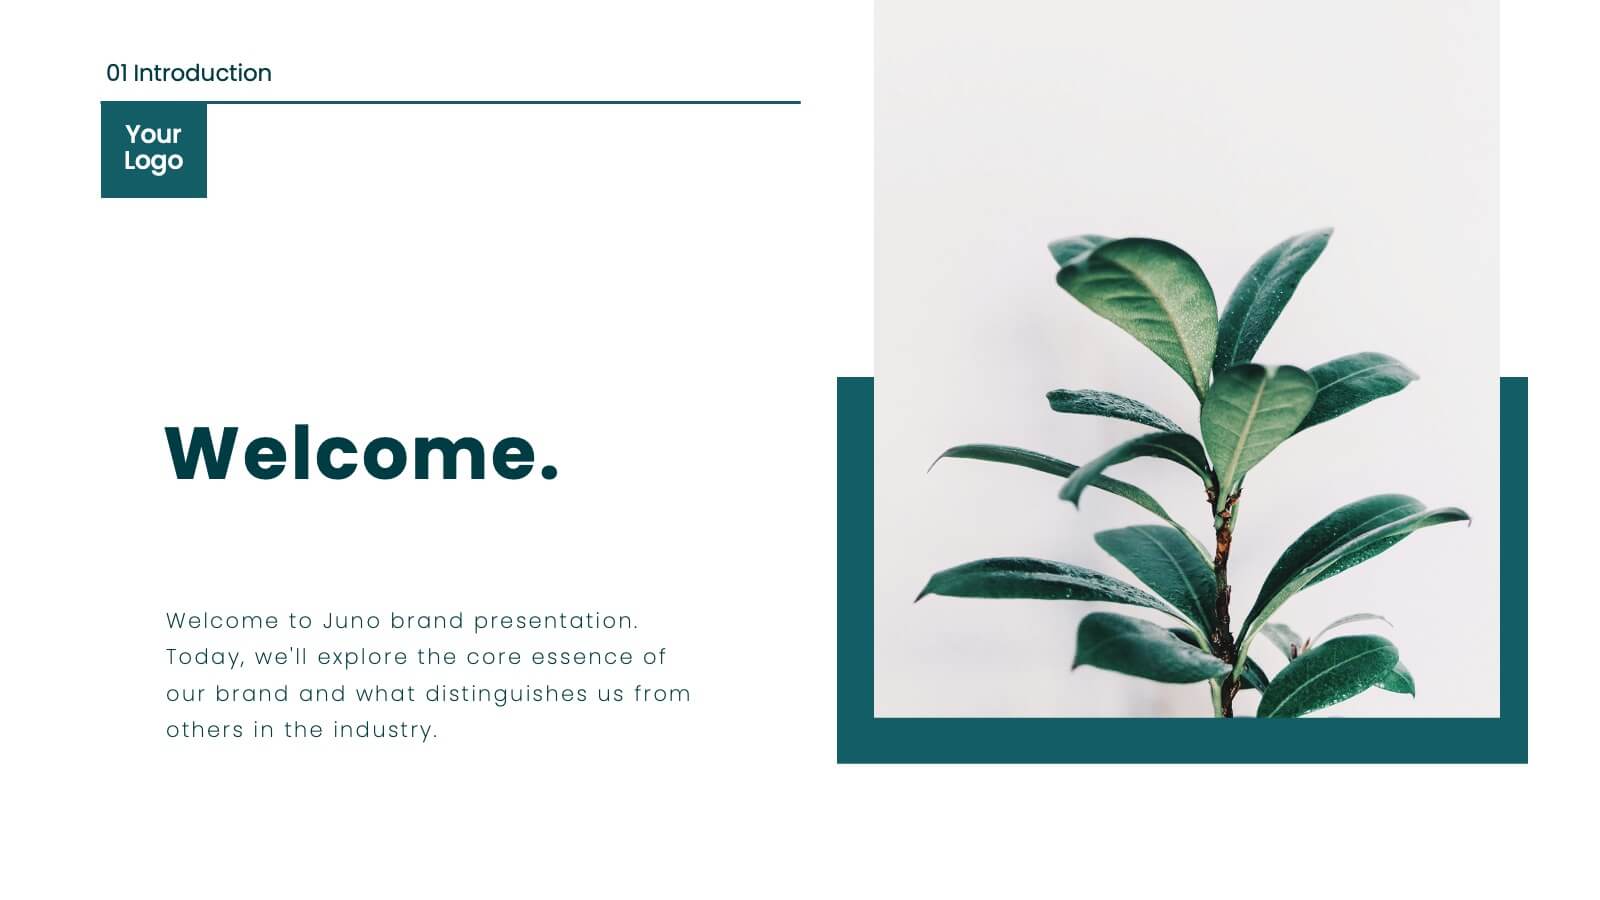


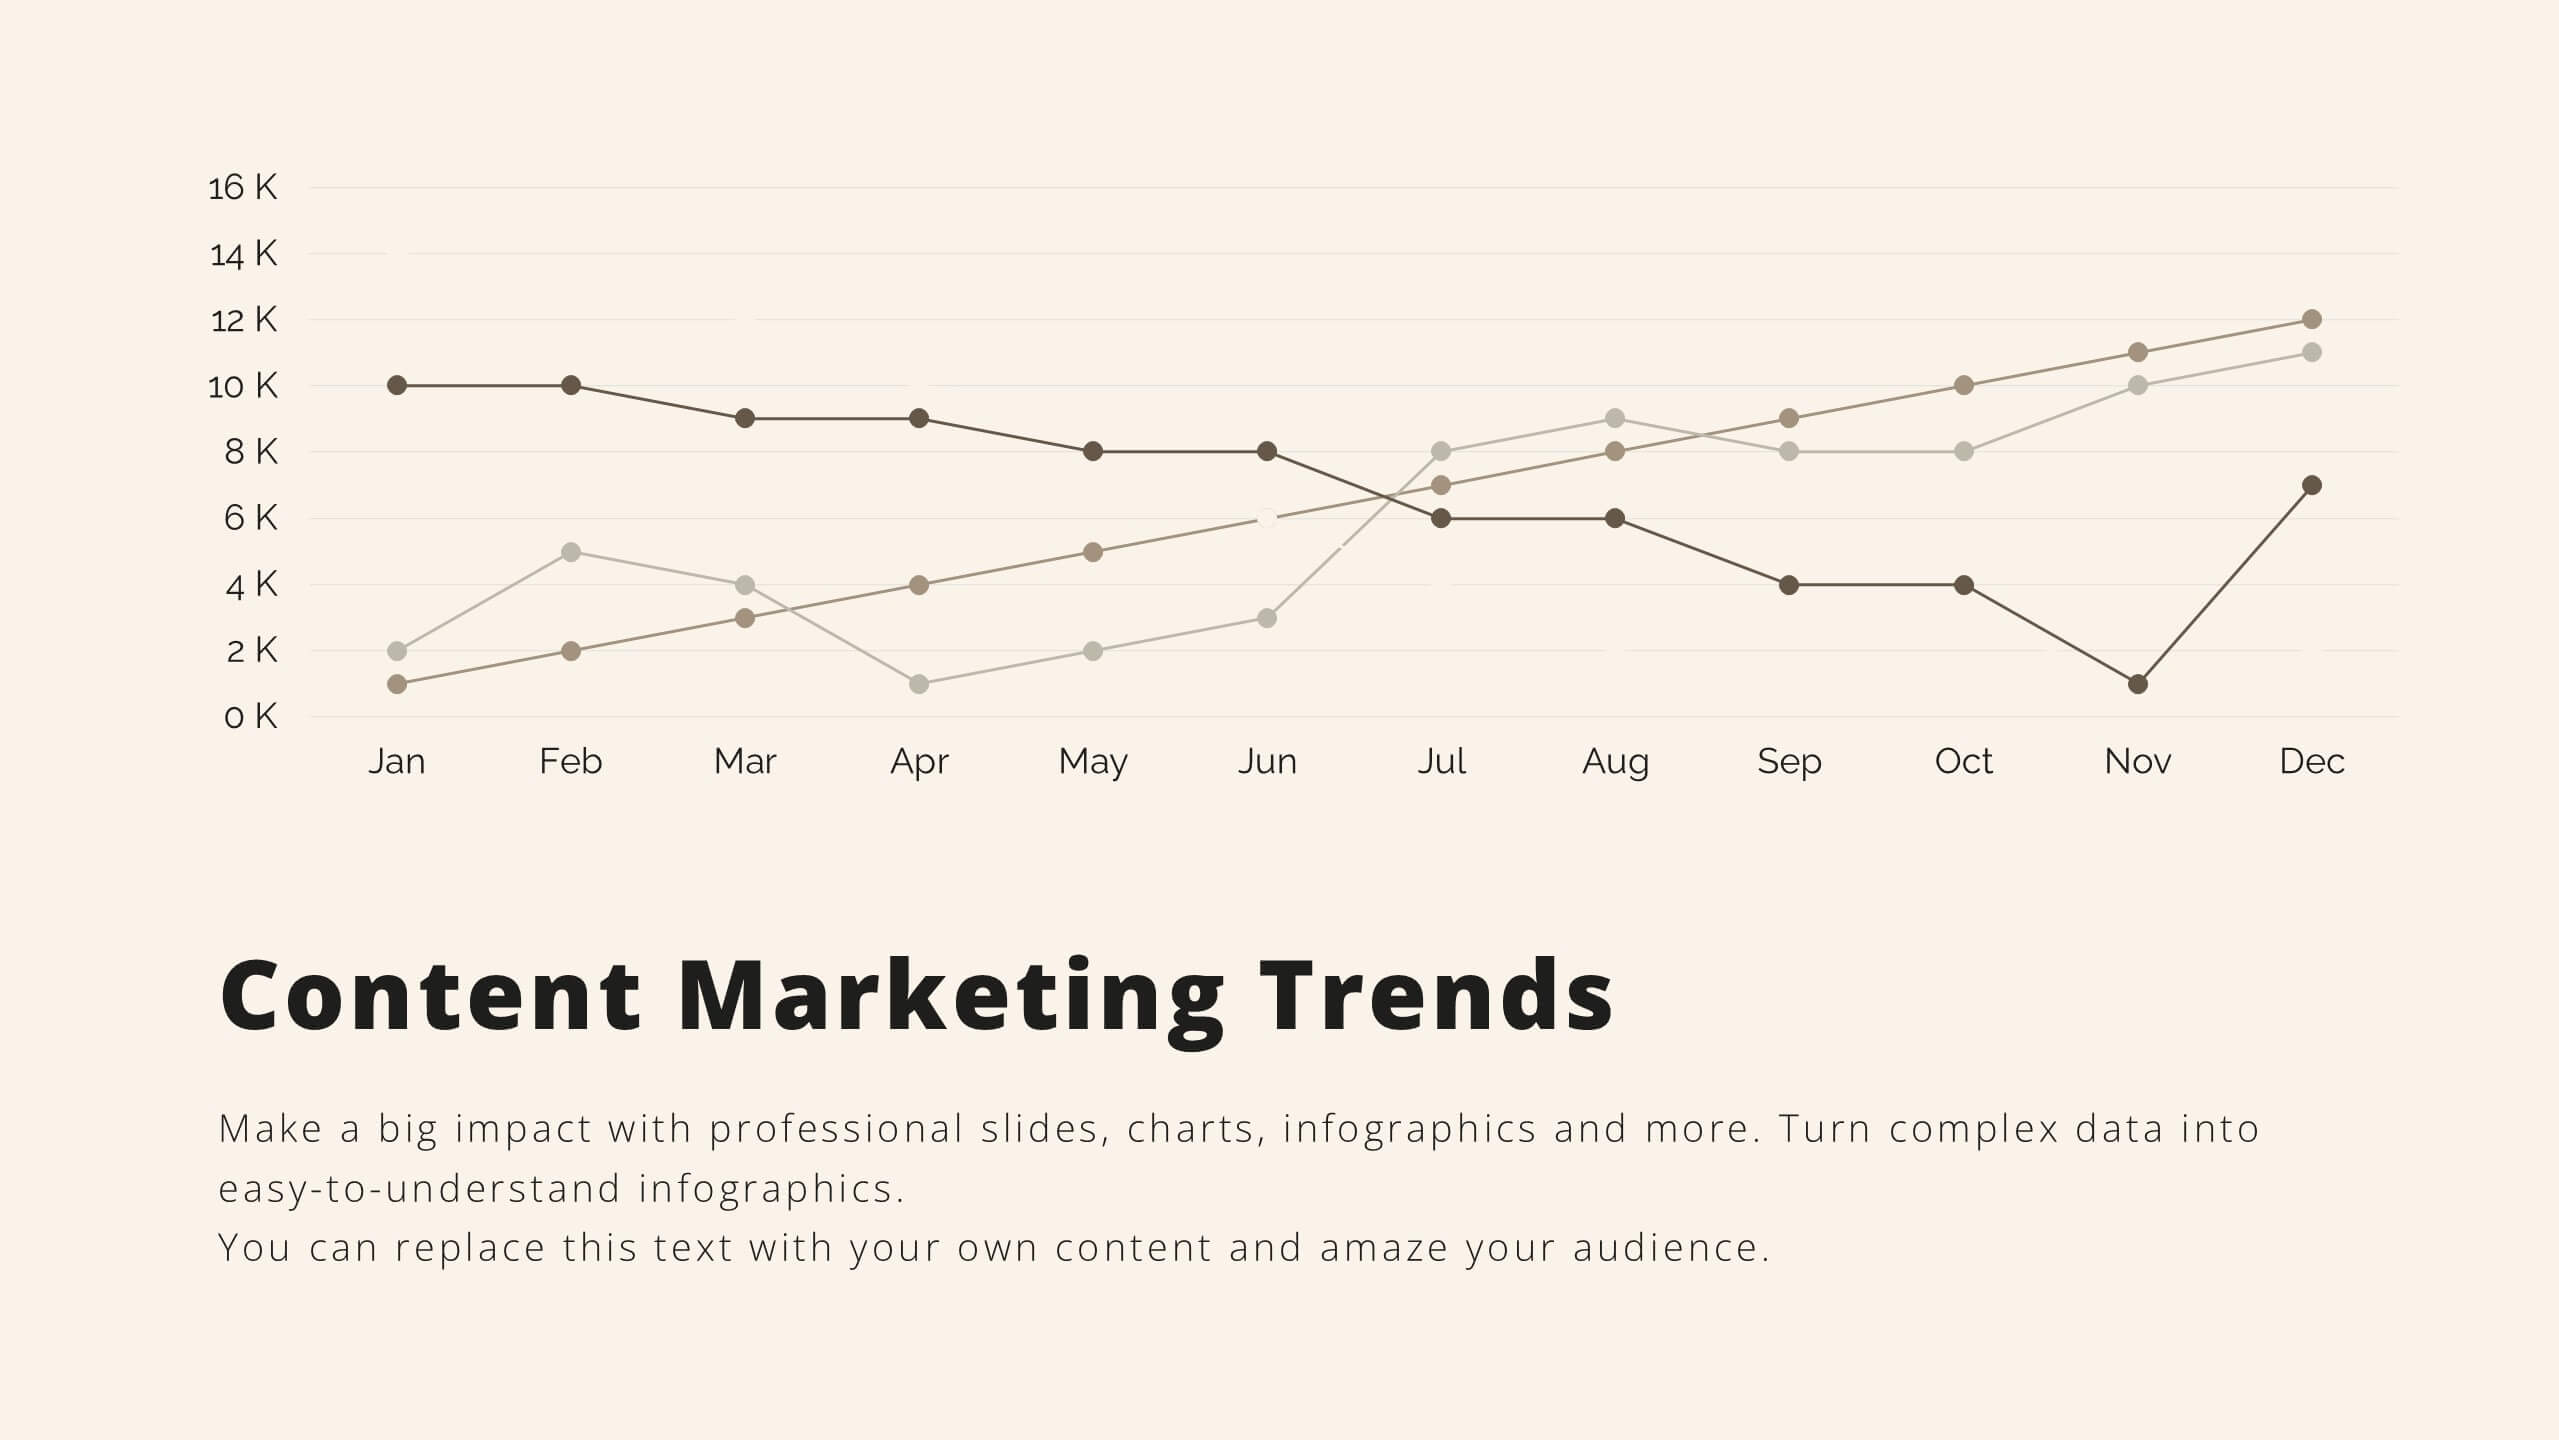
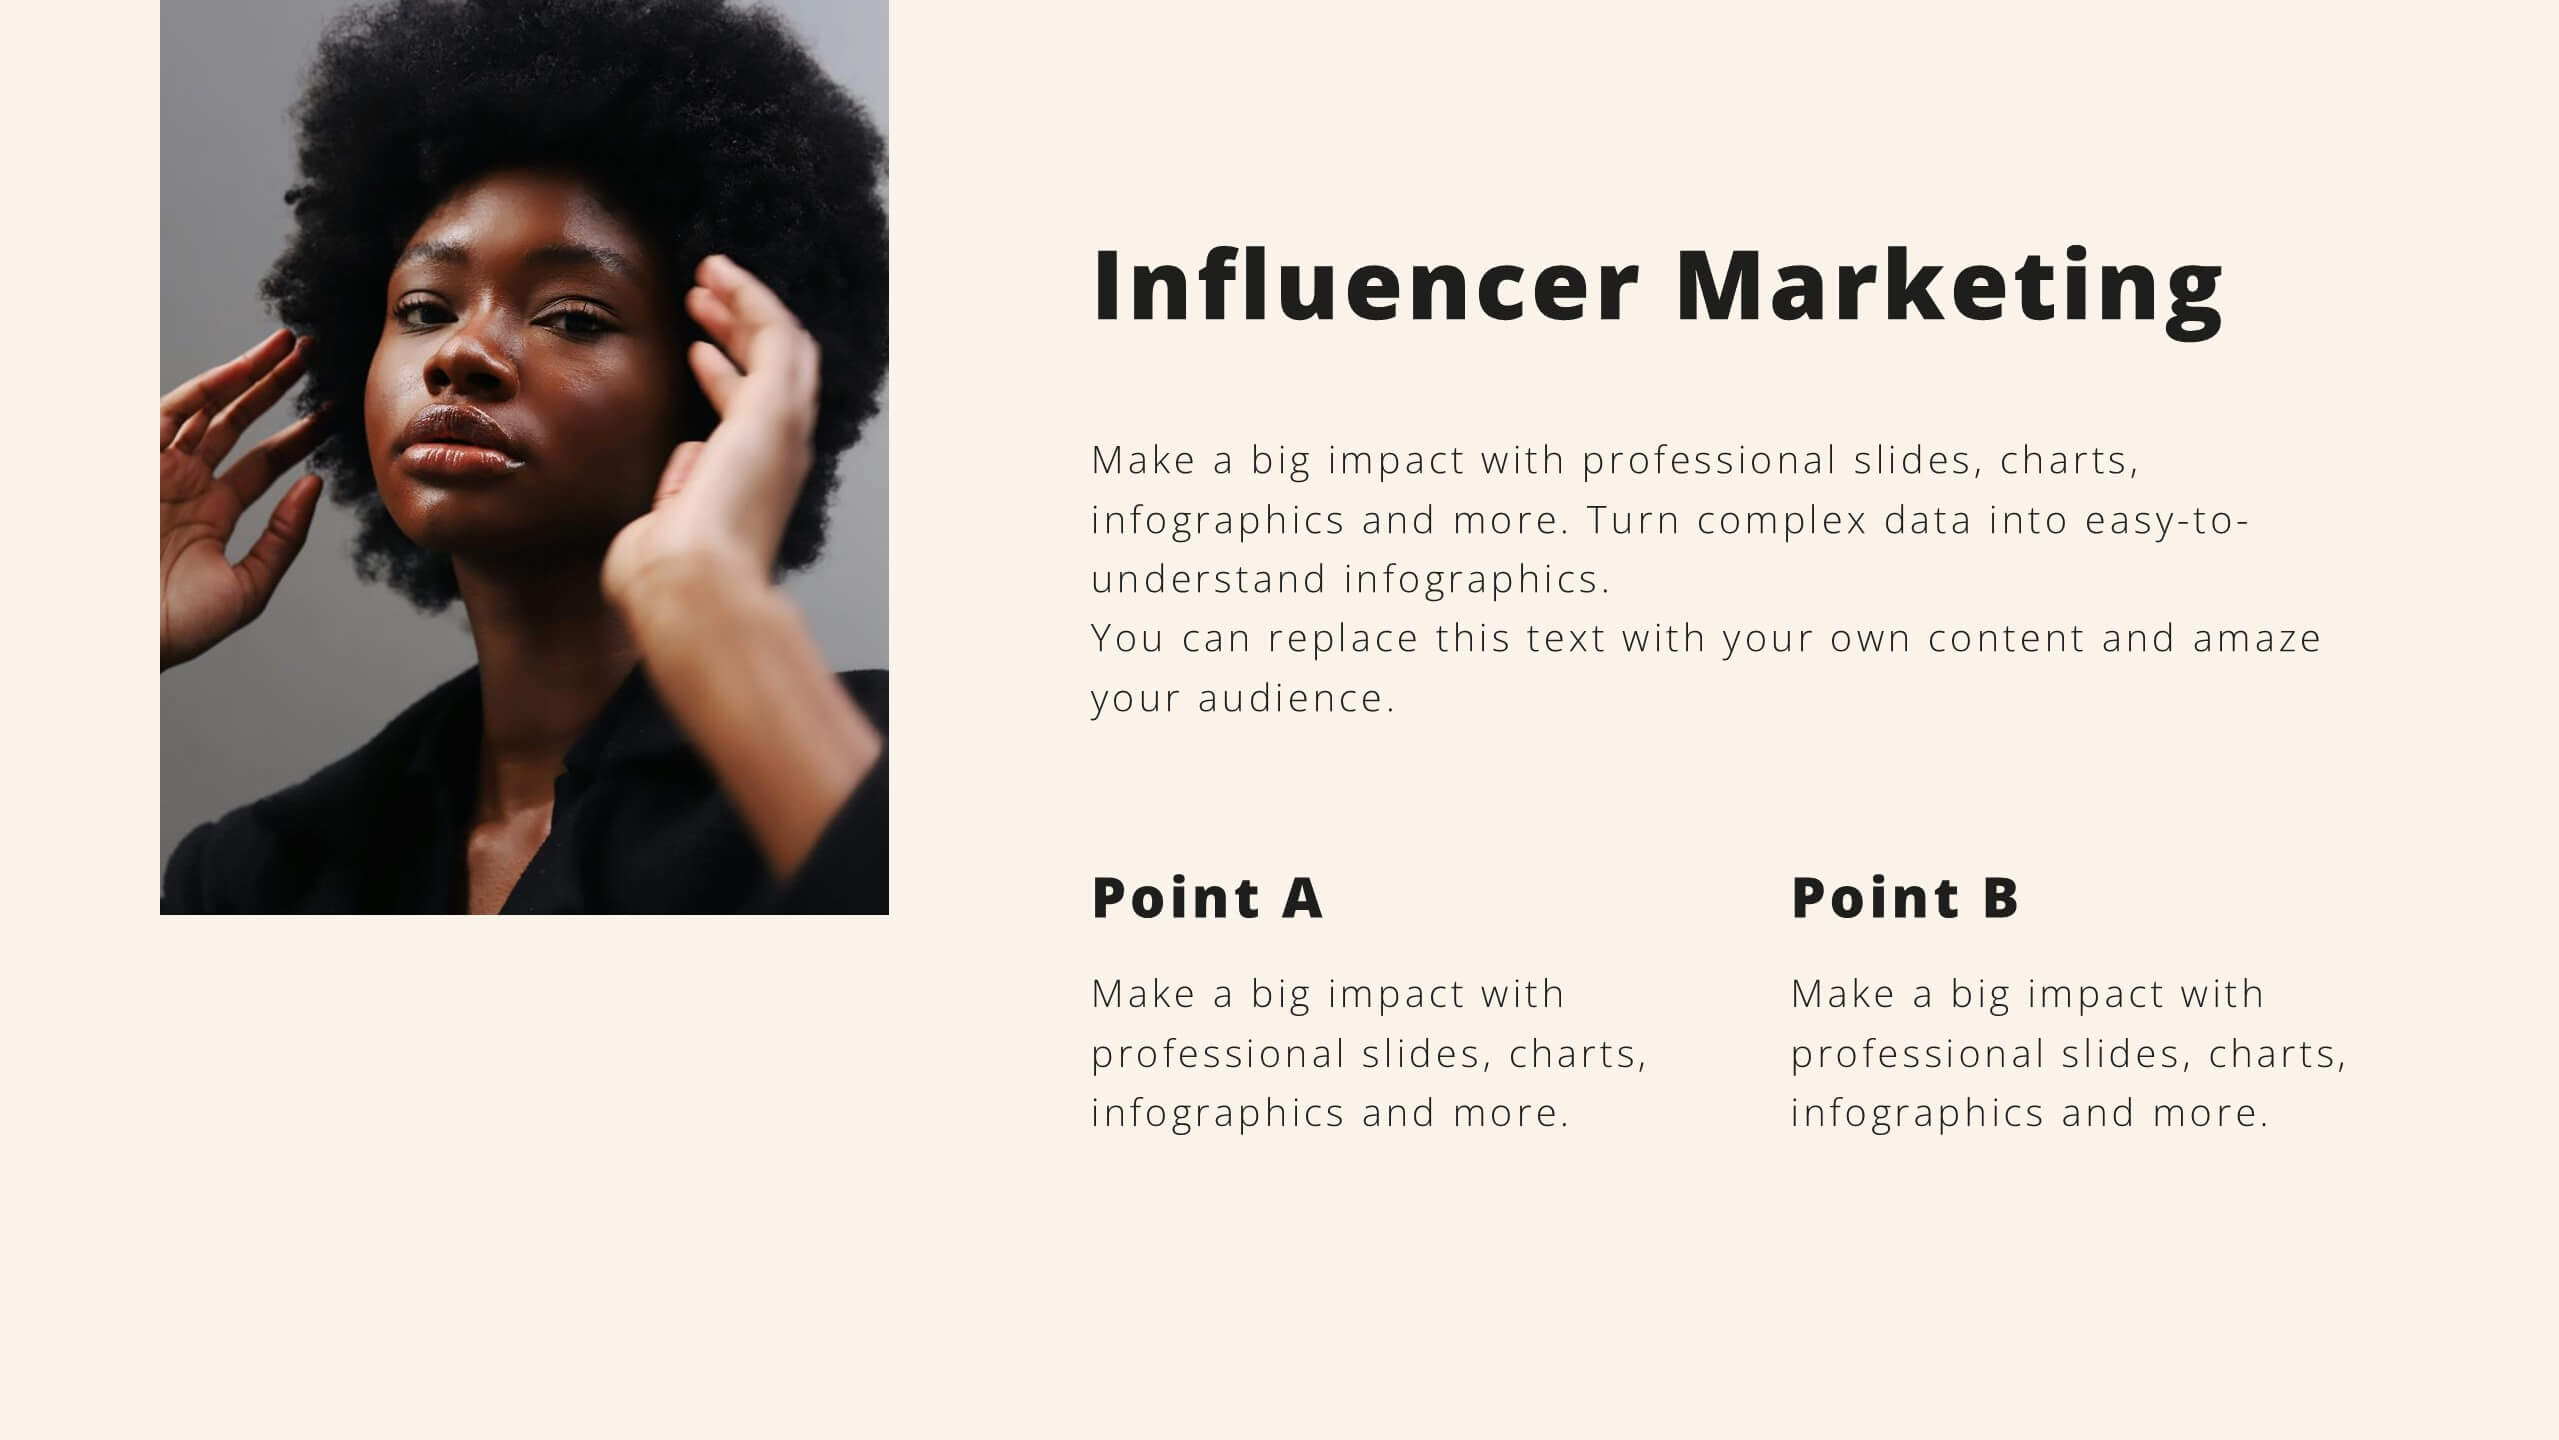
28 slides
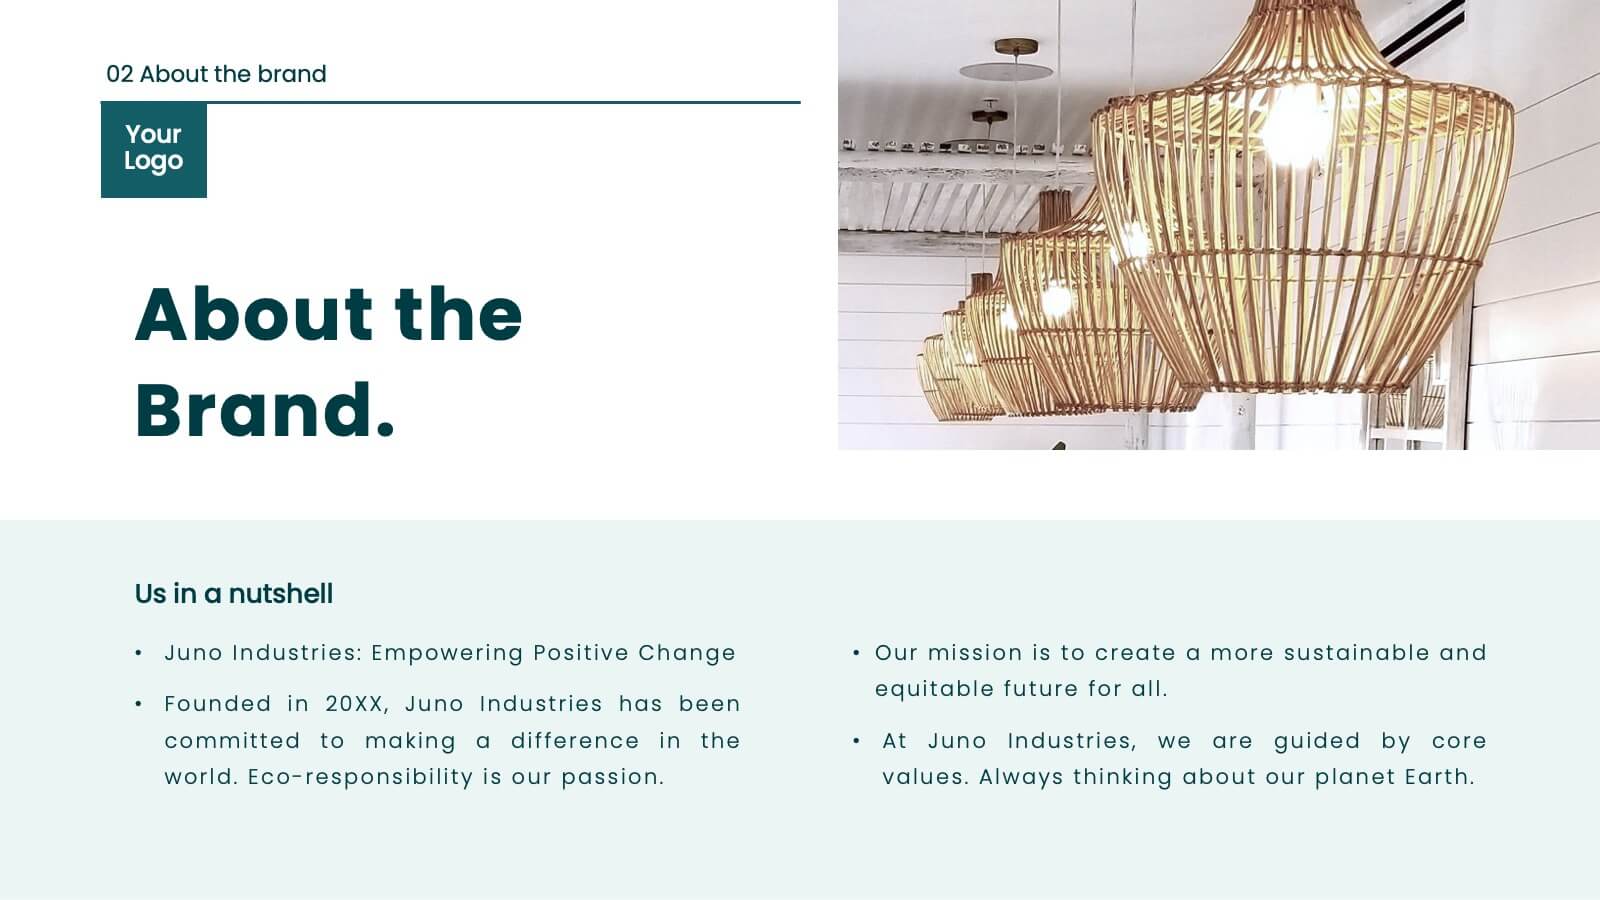
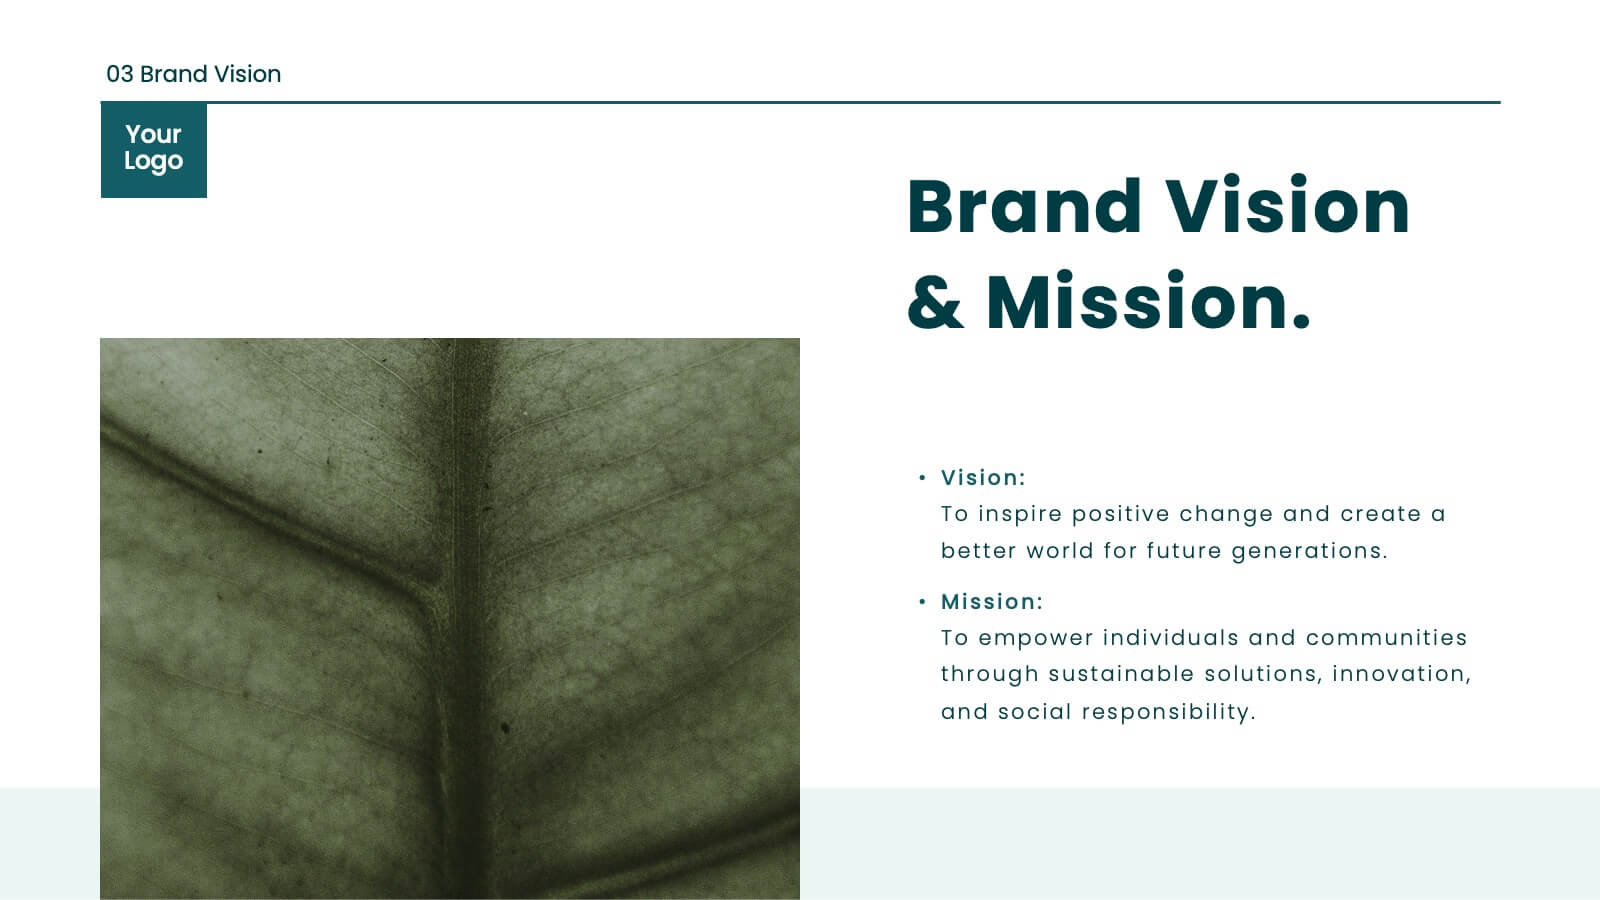
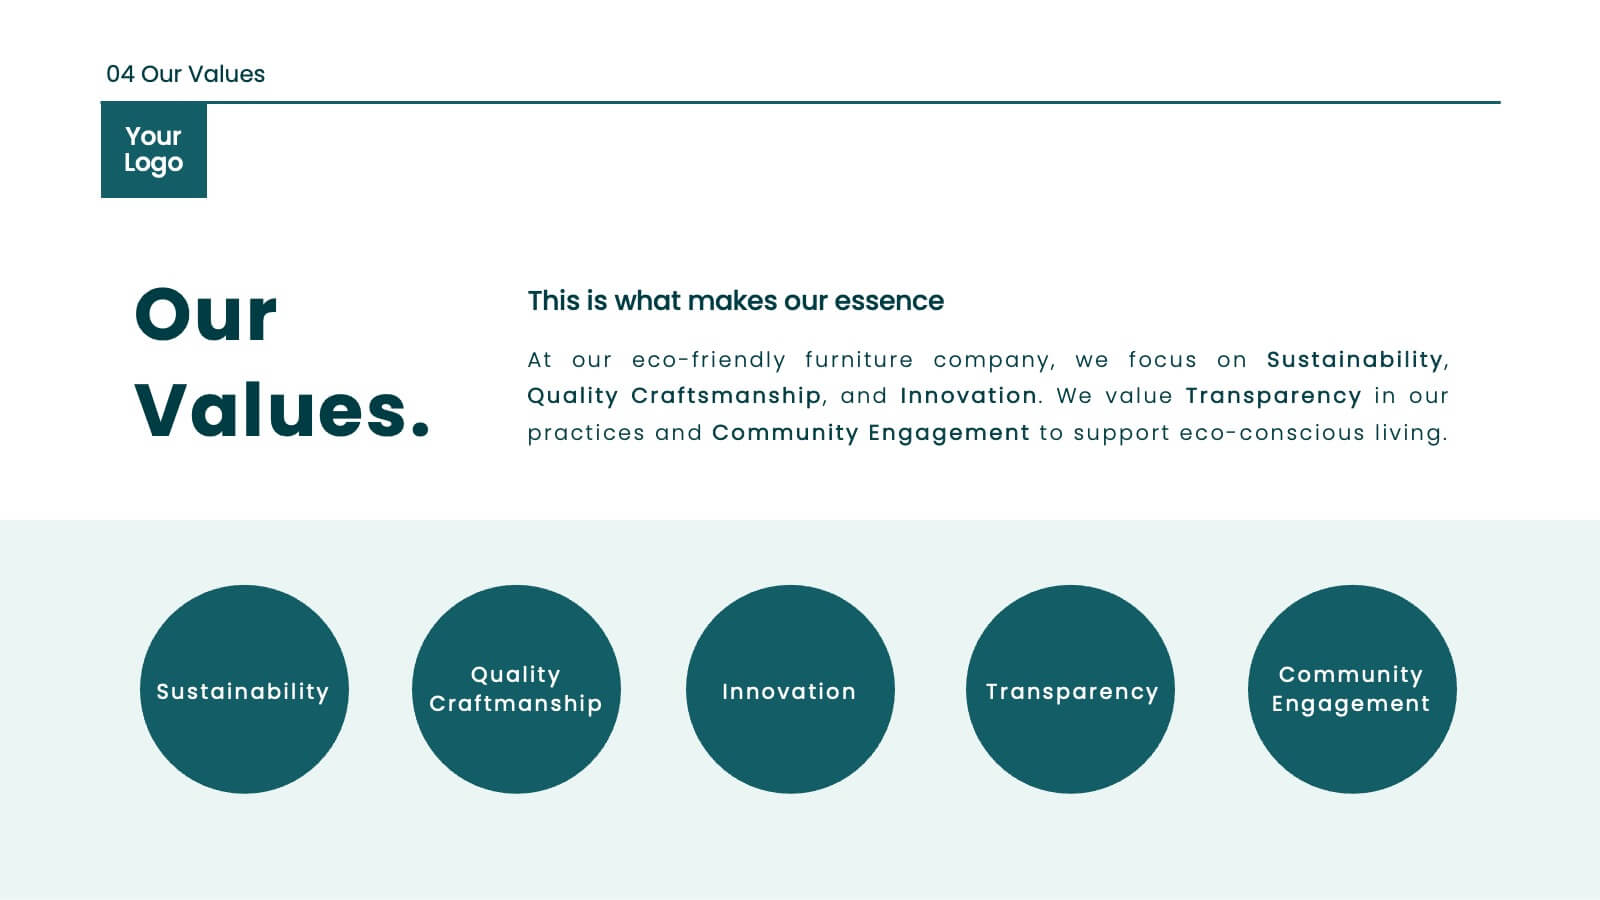
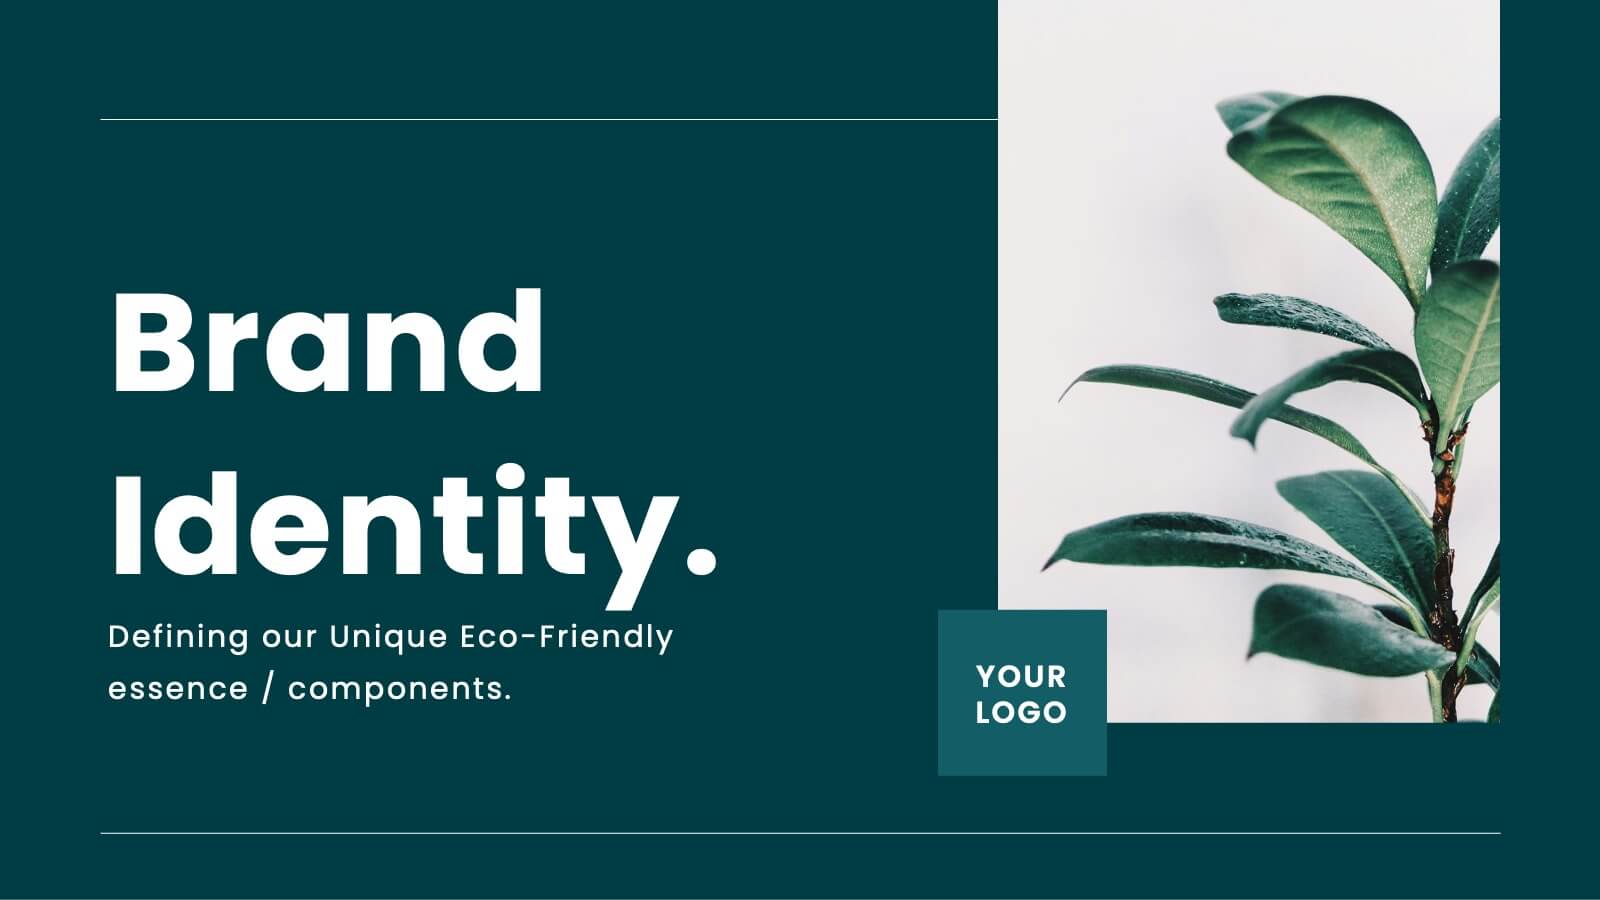
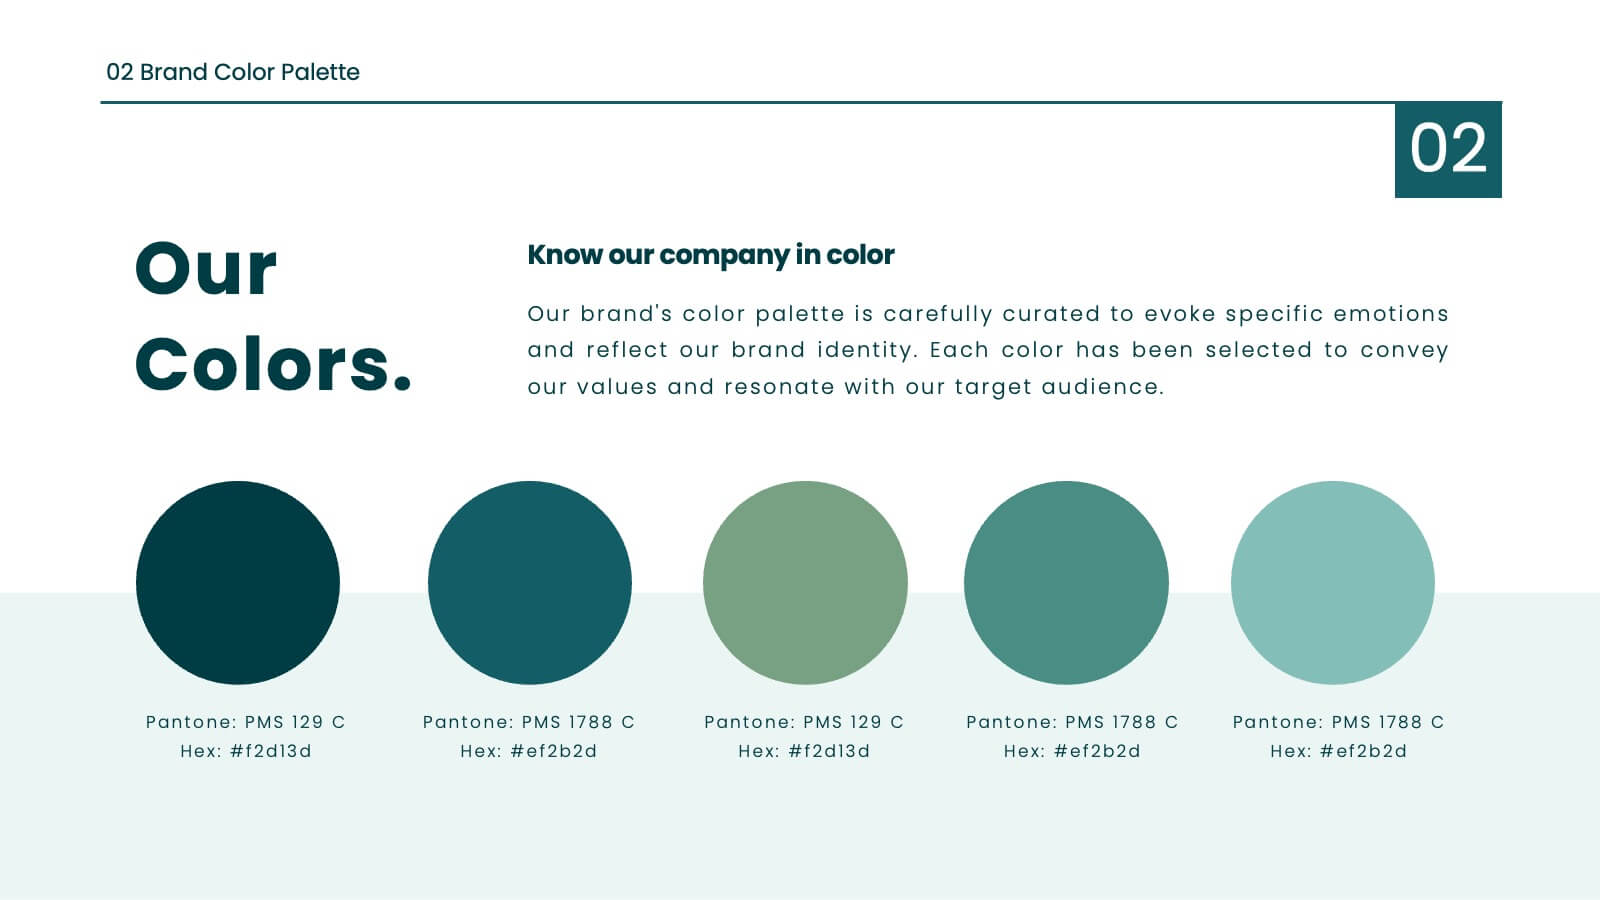
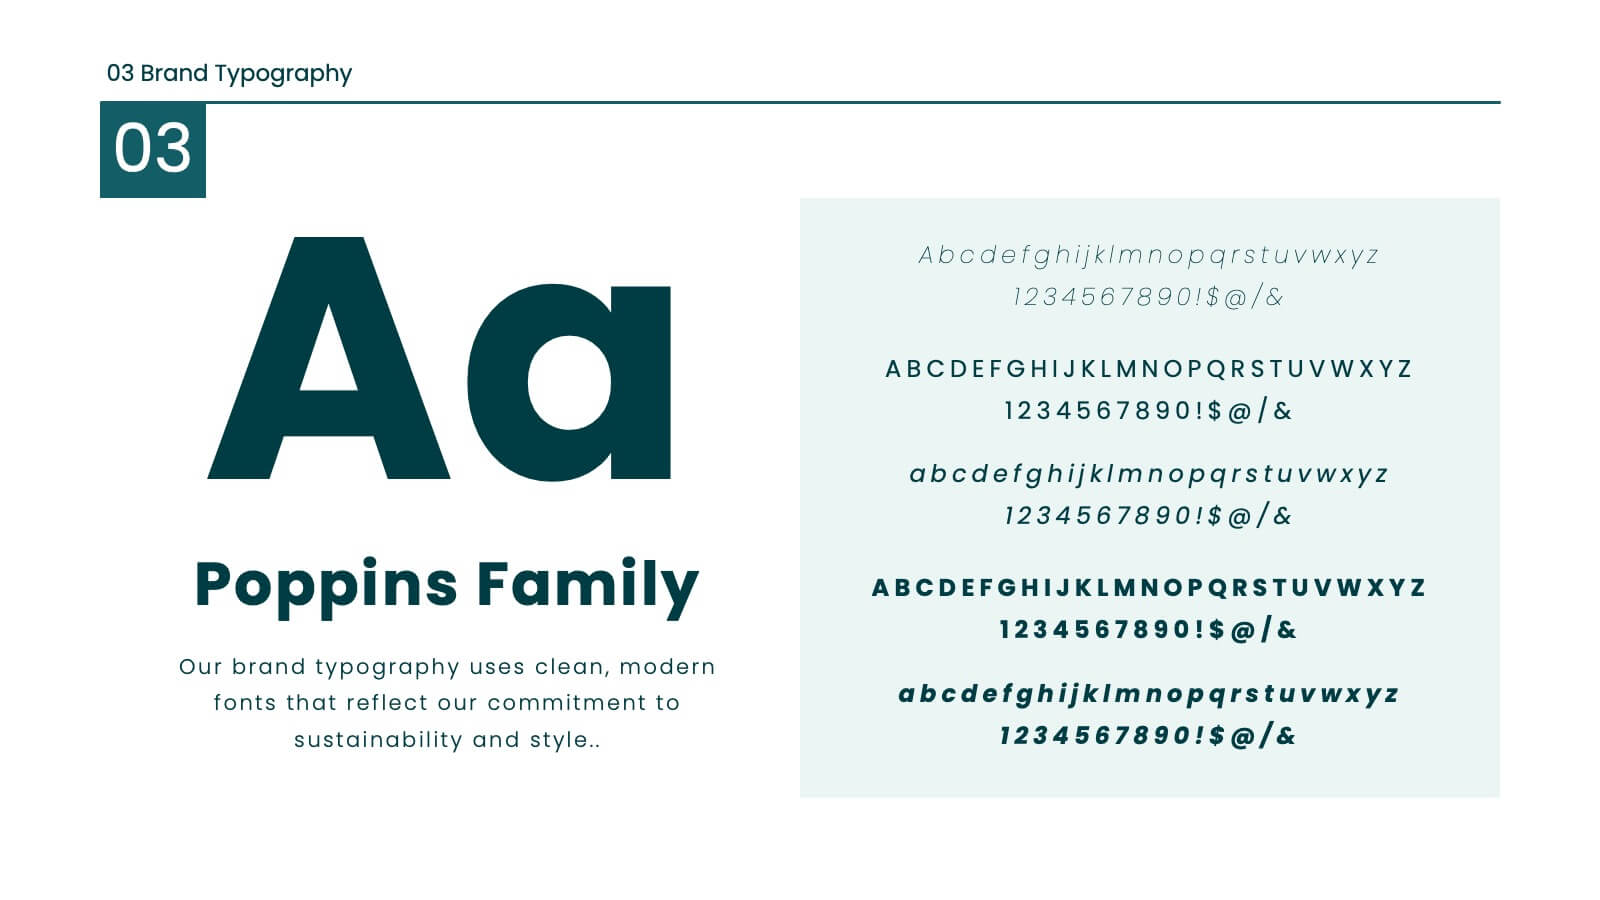
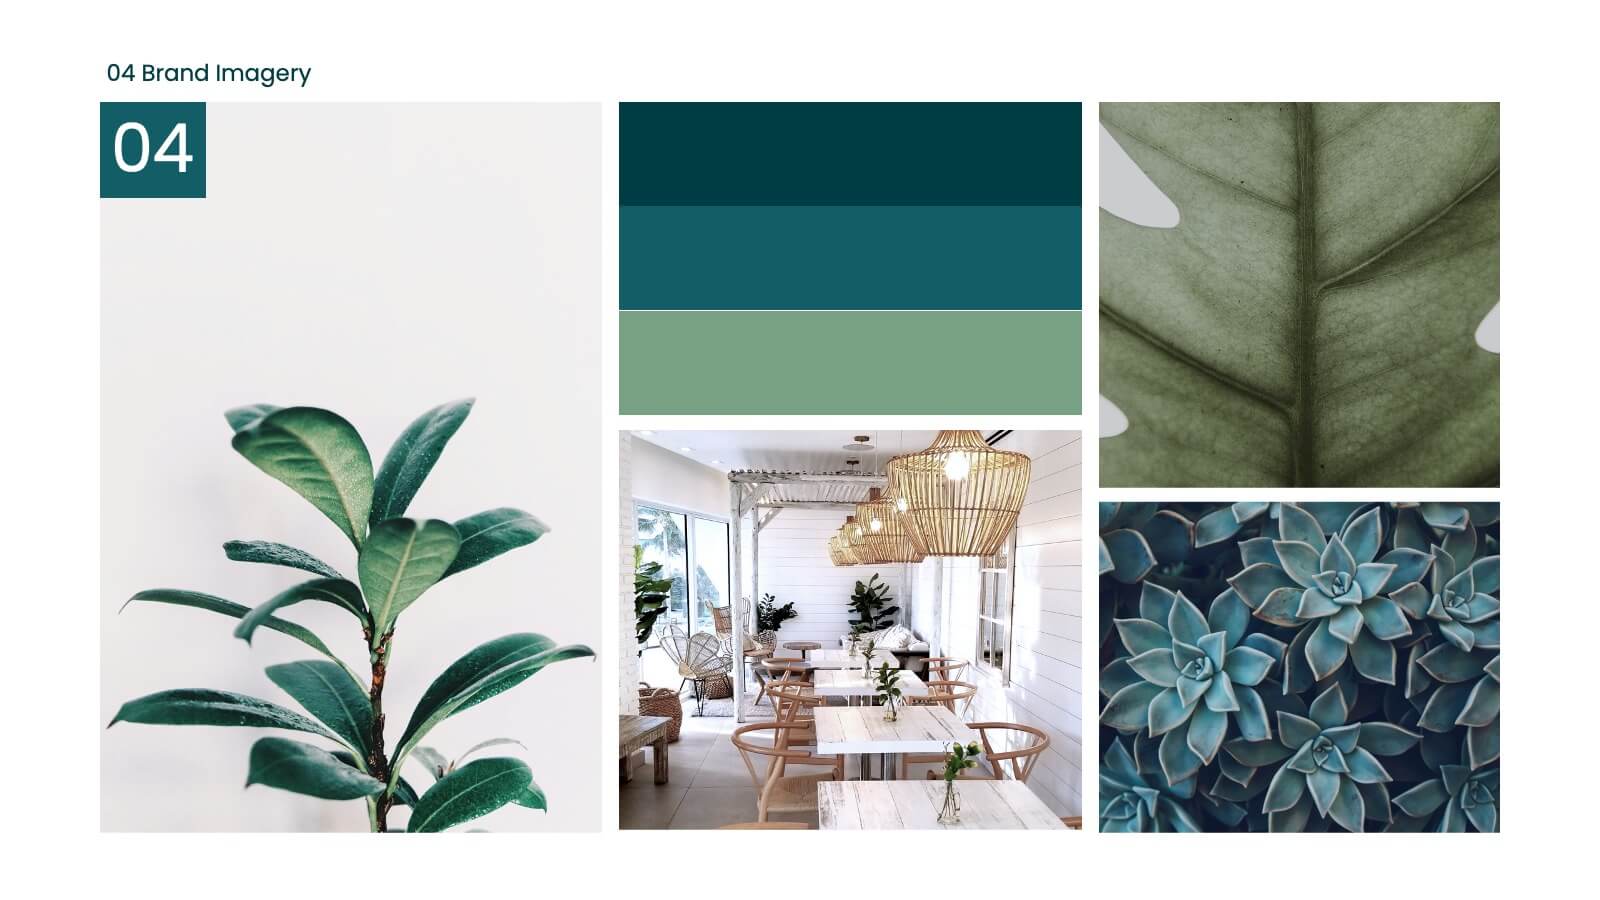
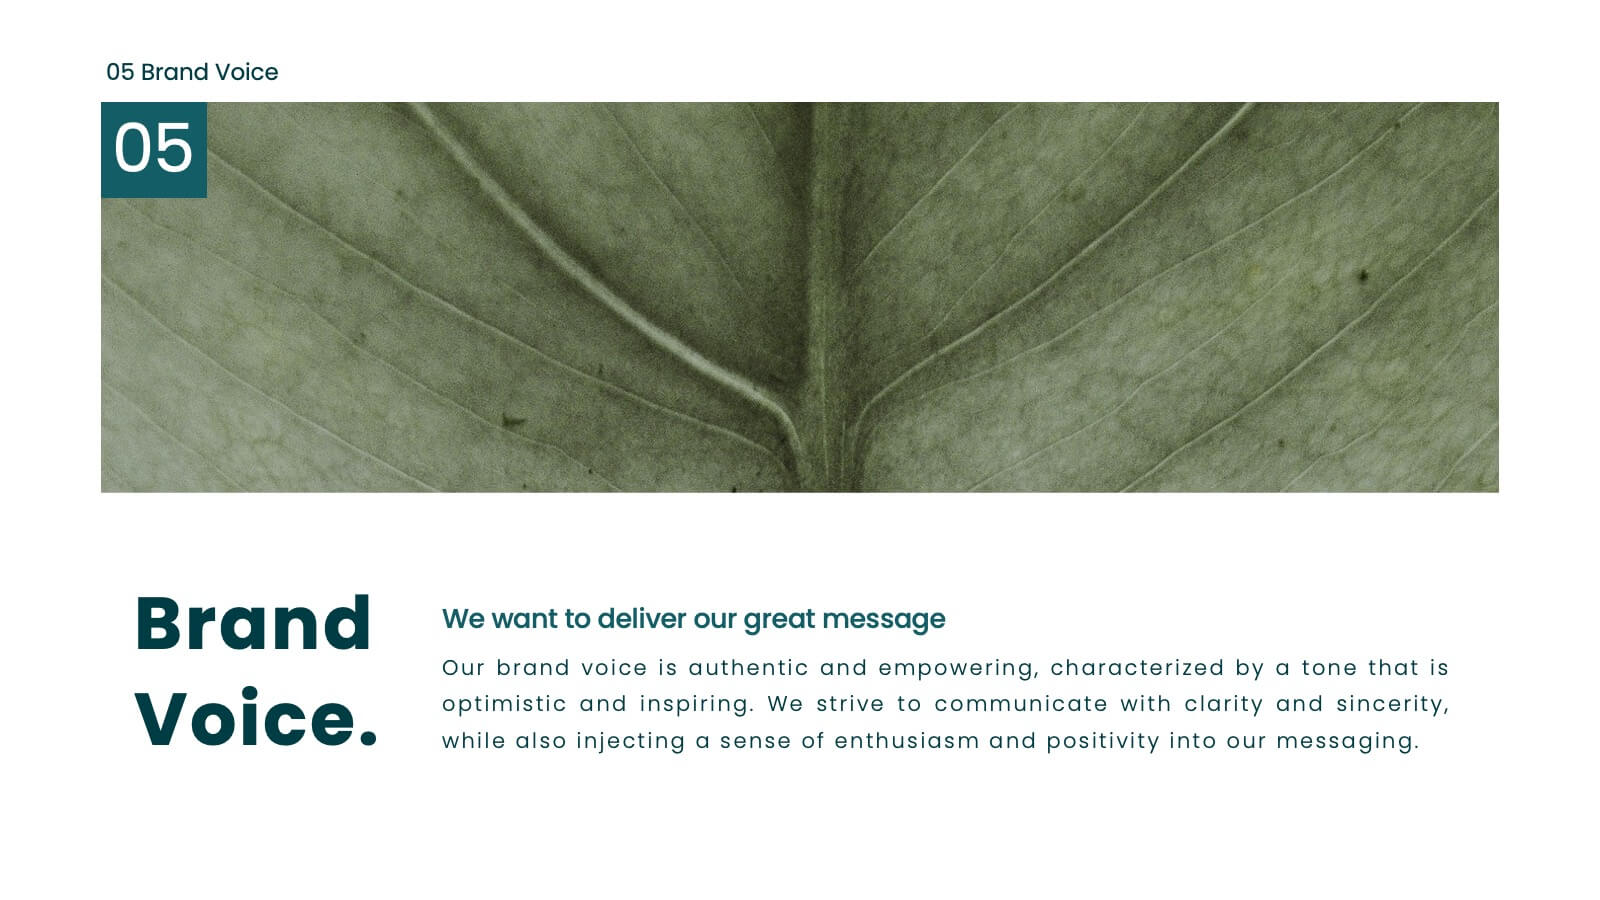
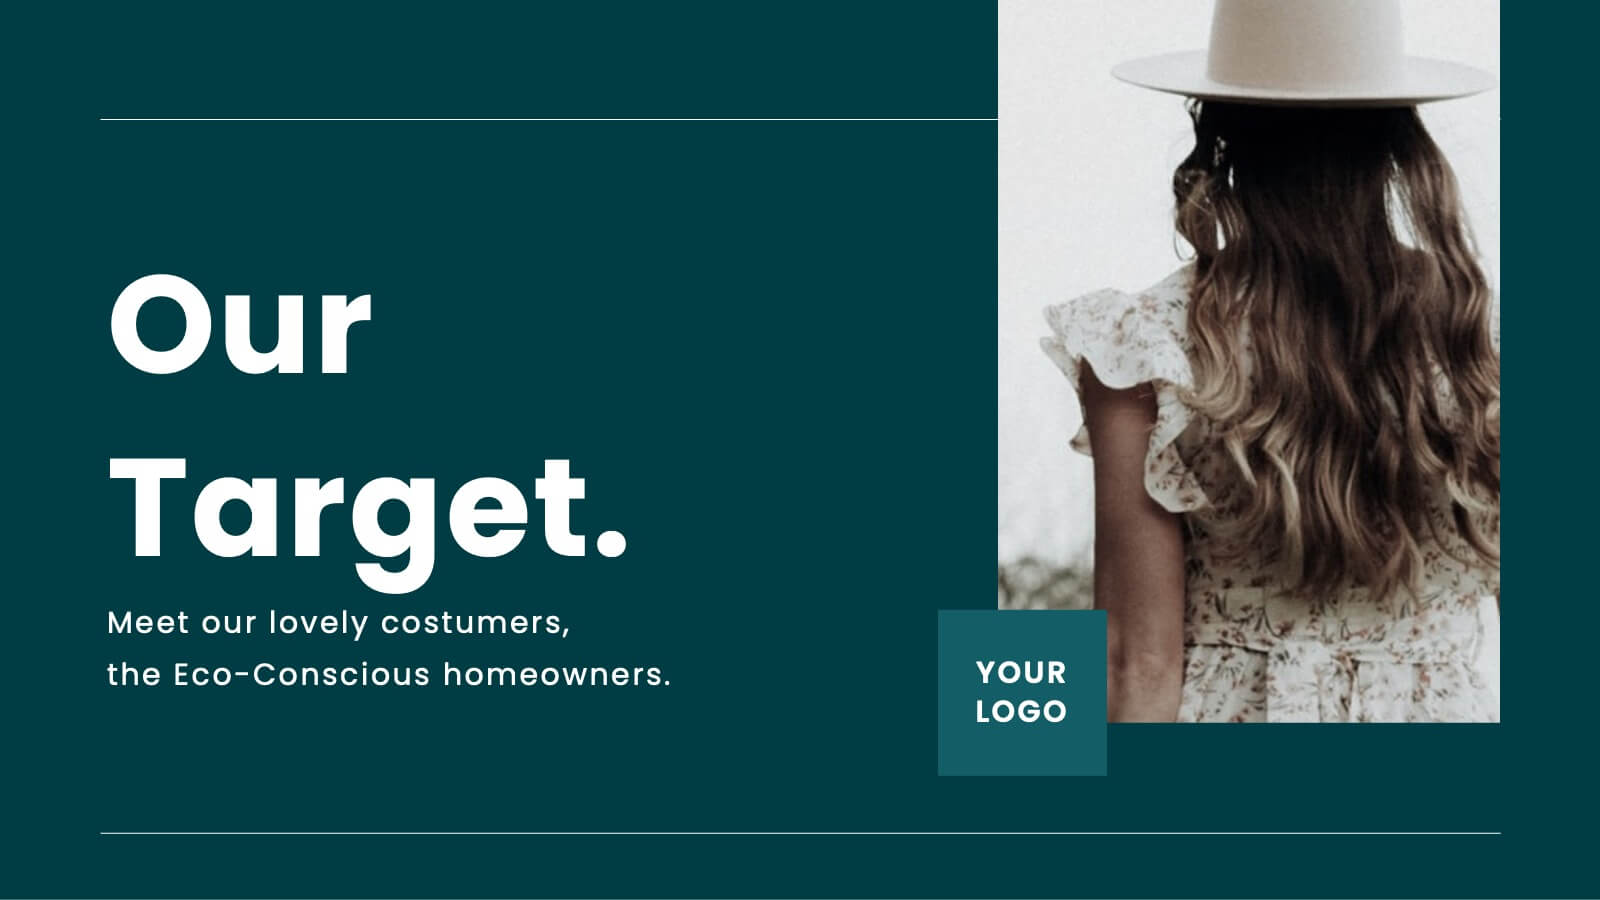
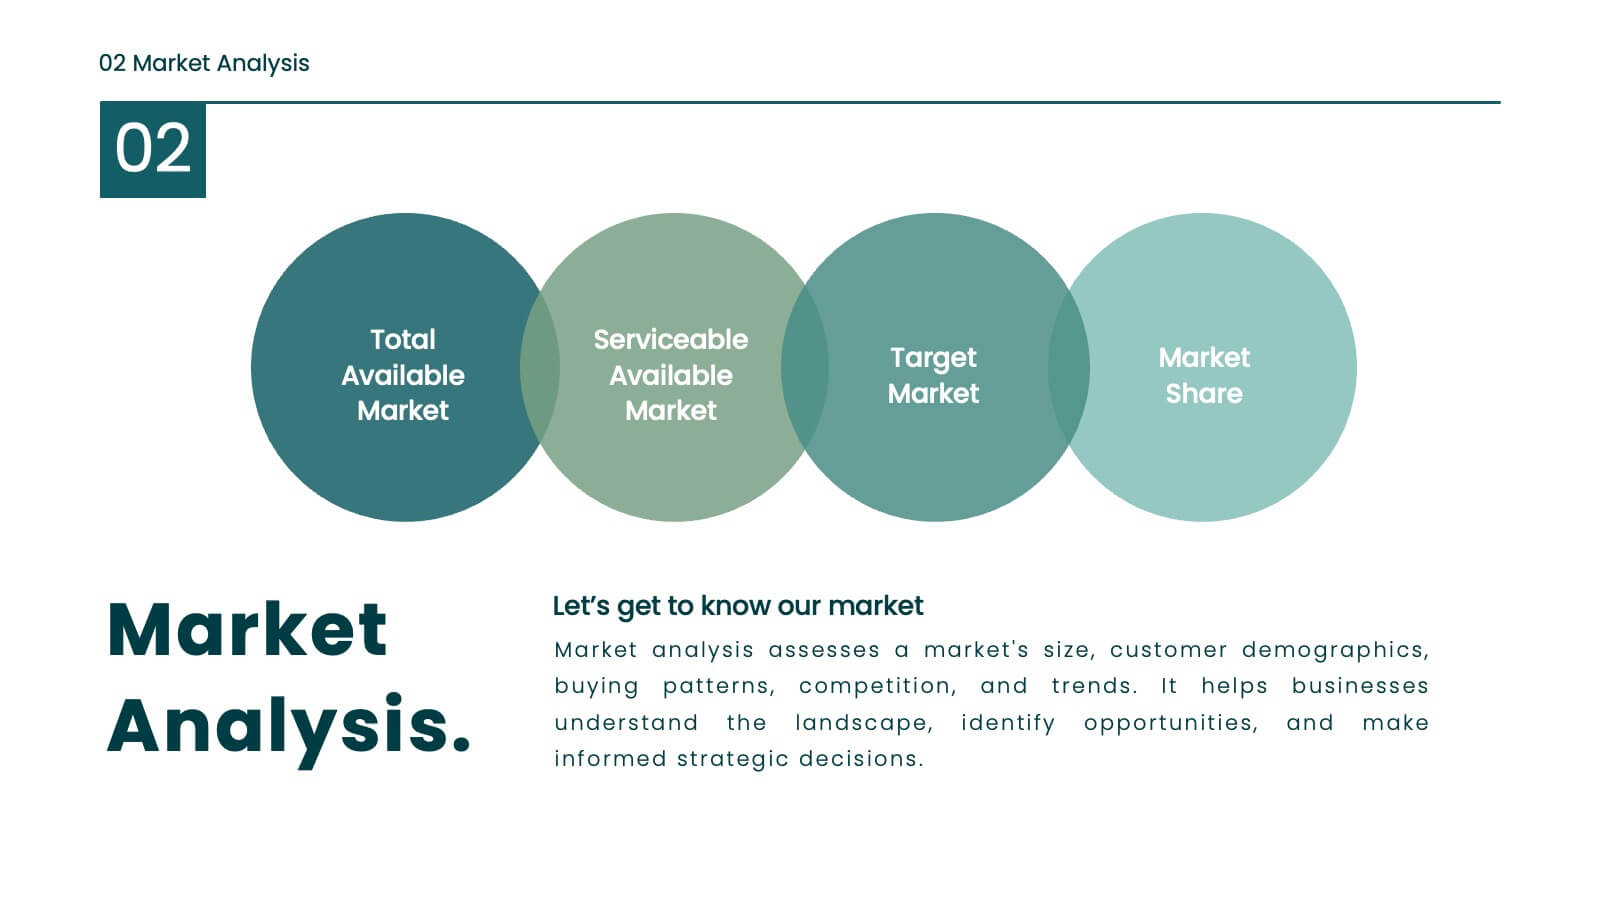
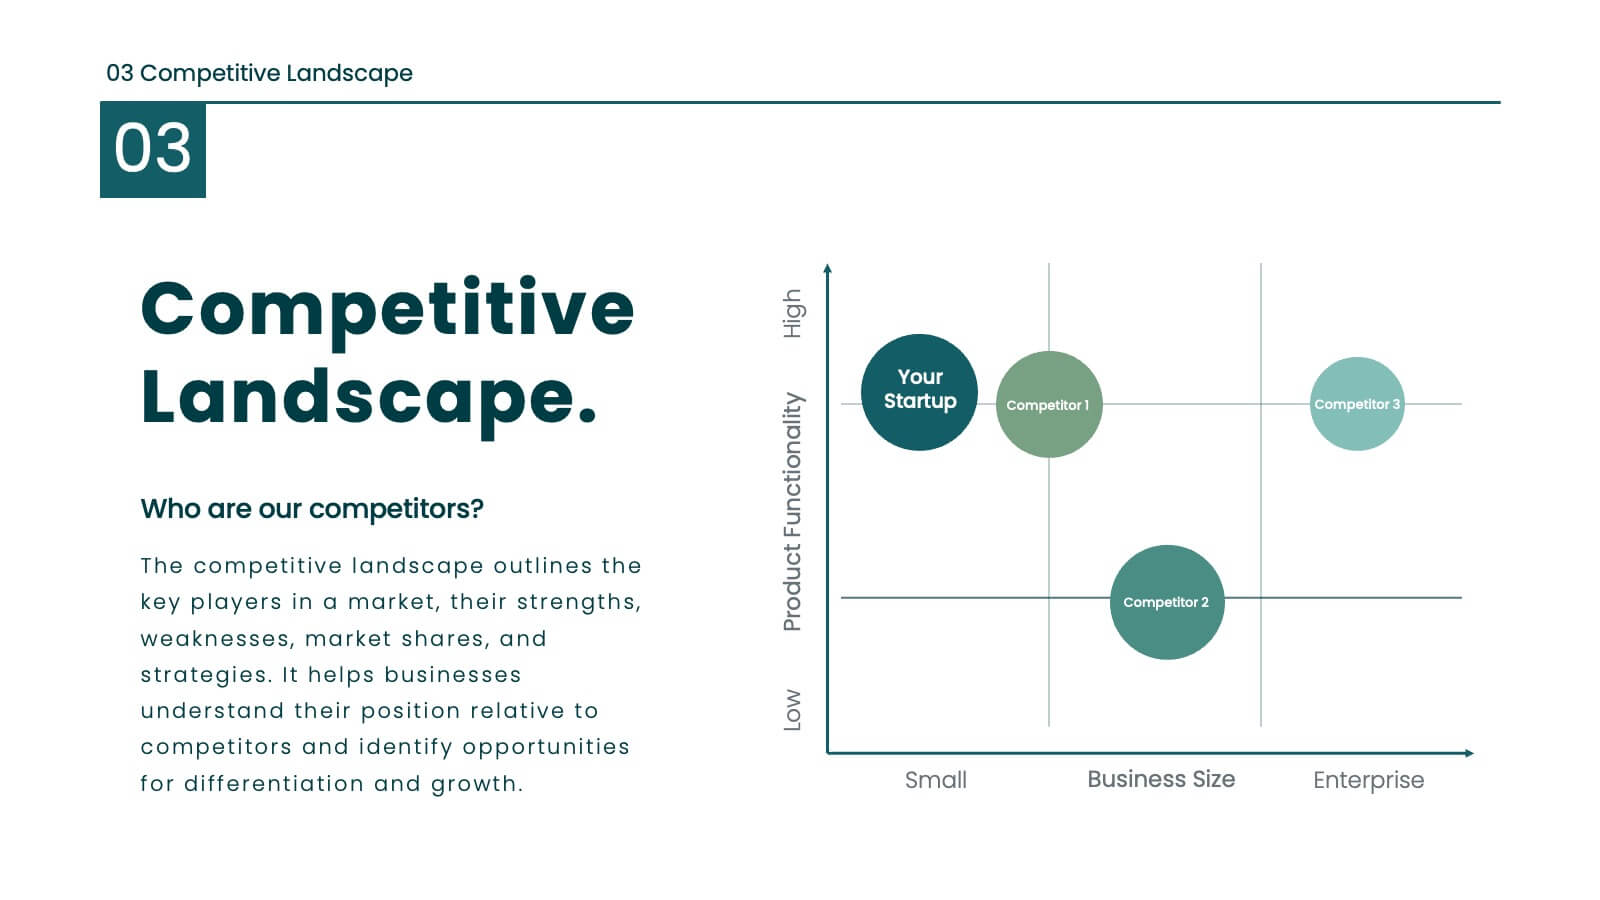
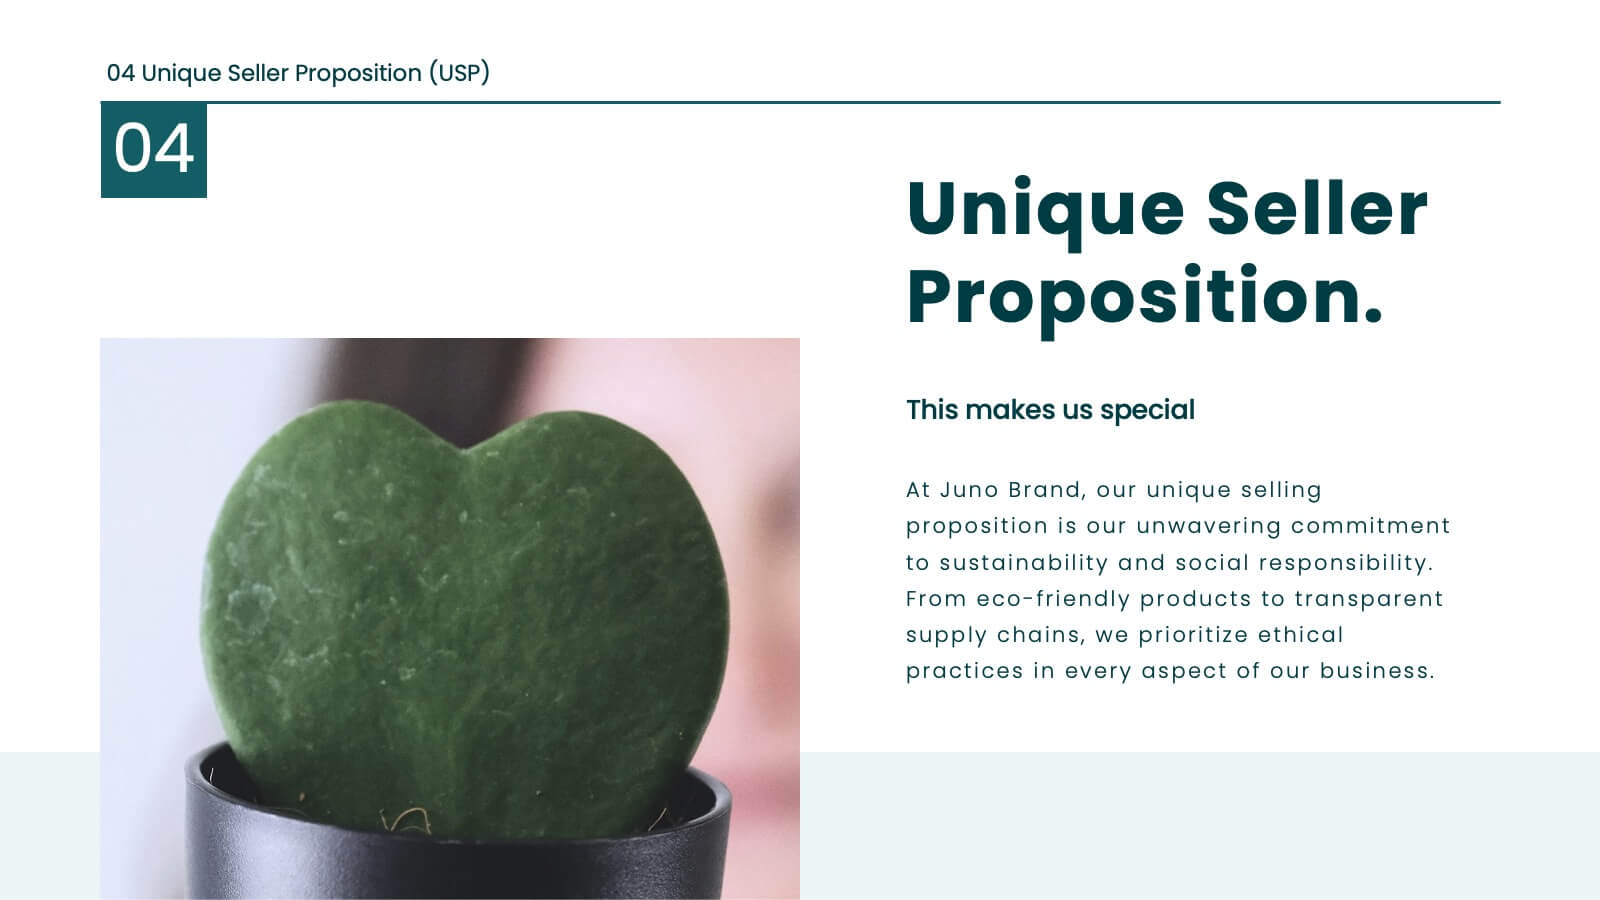
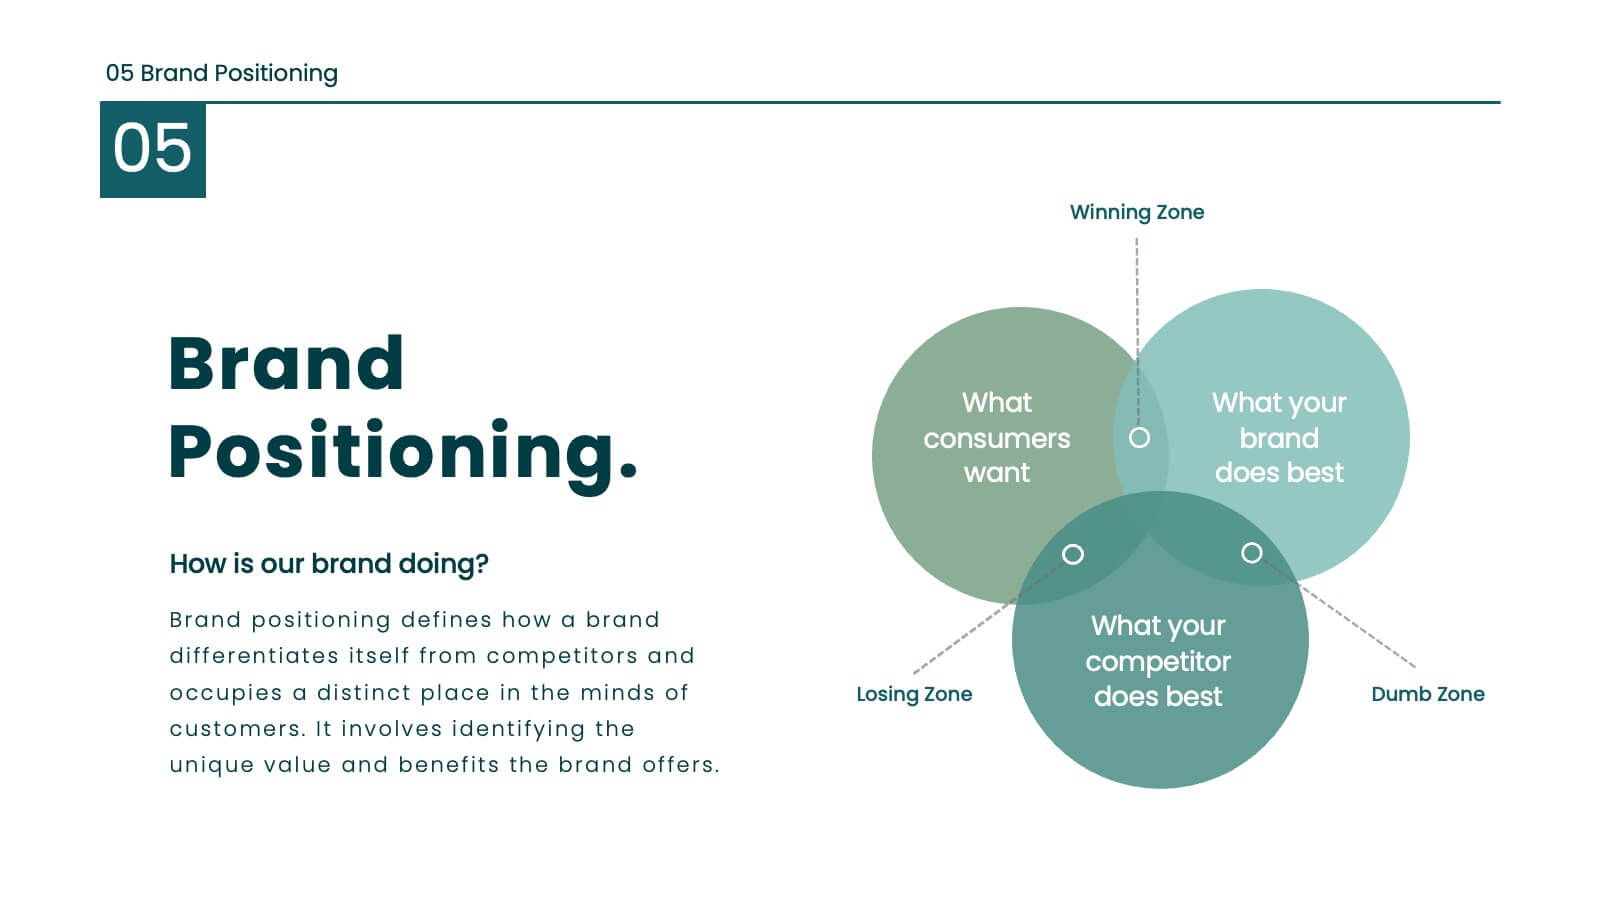
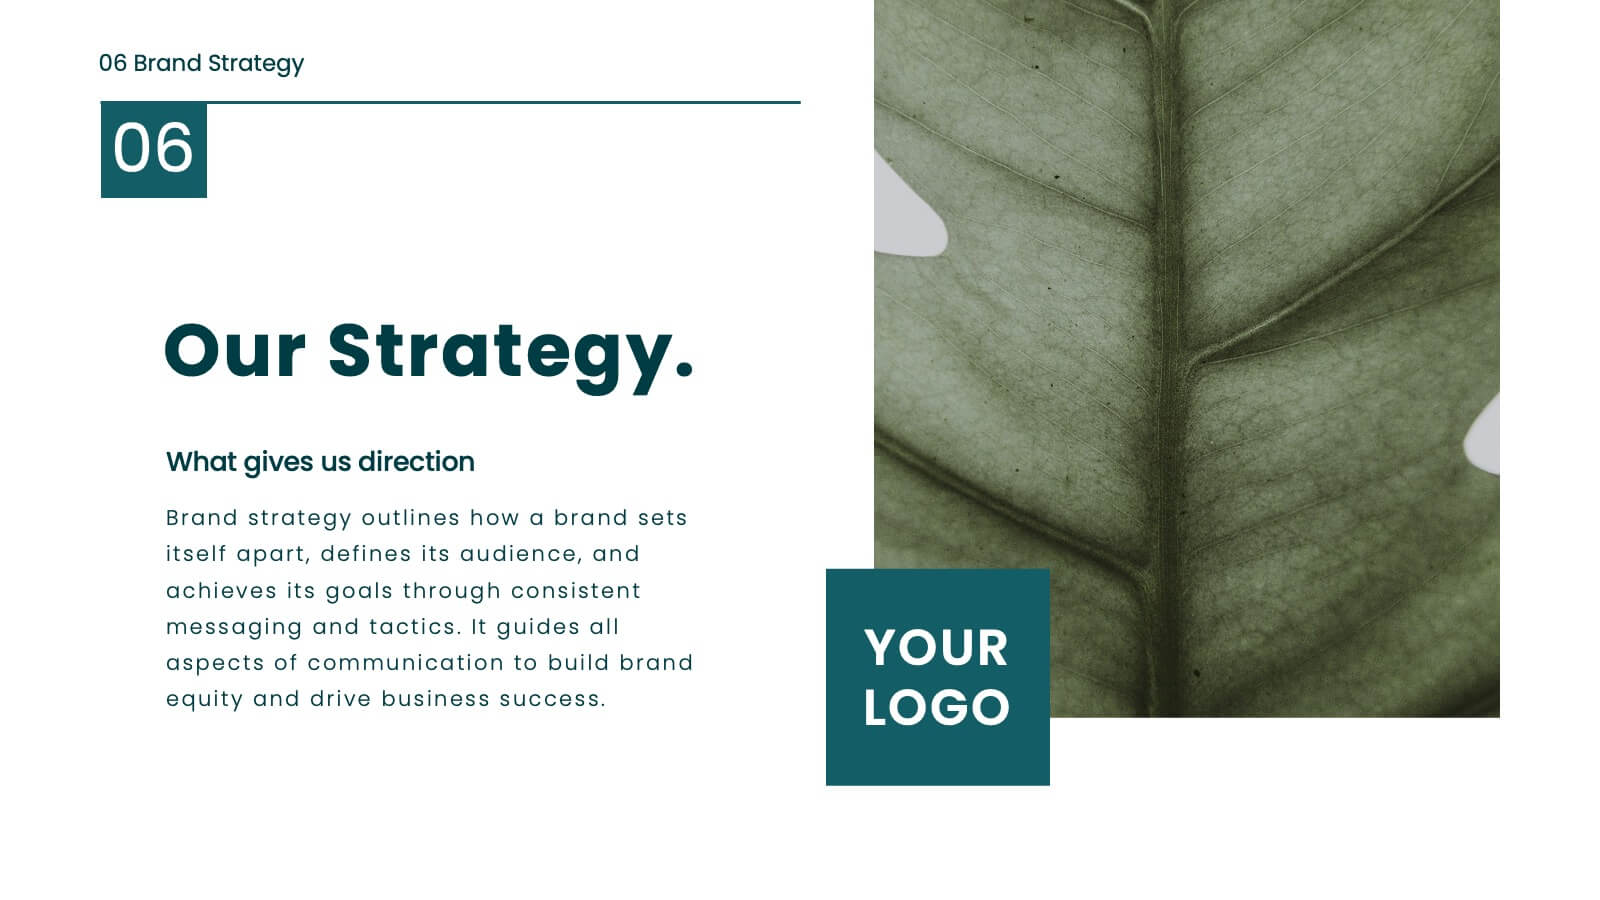
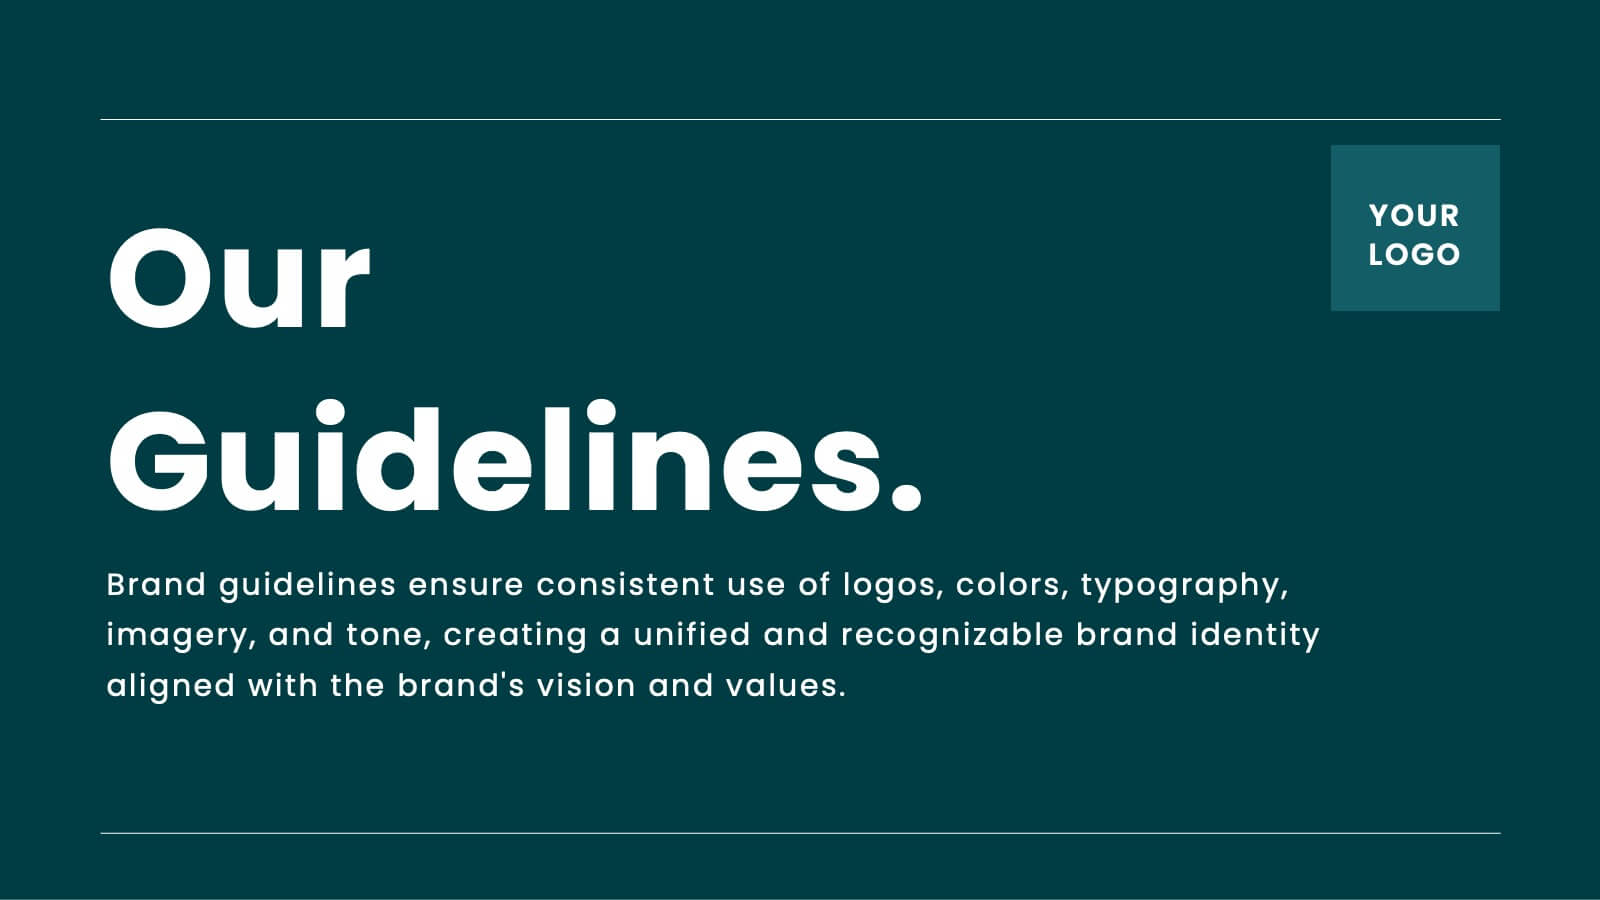
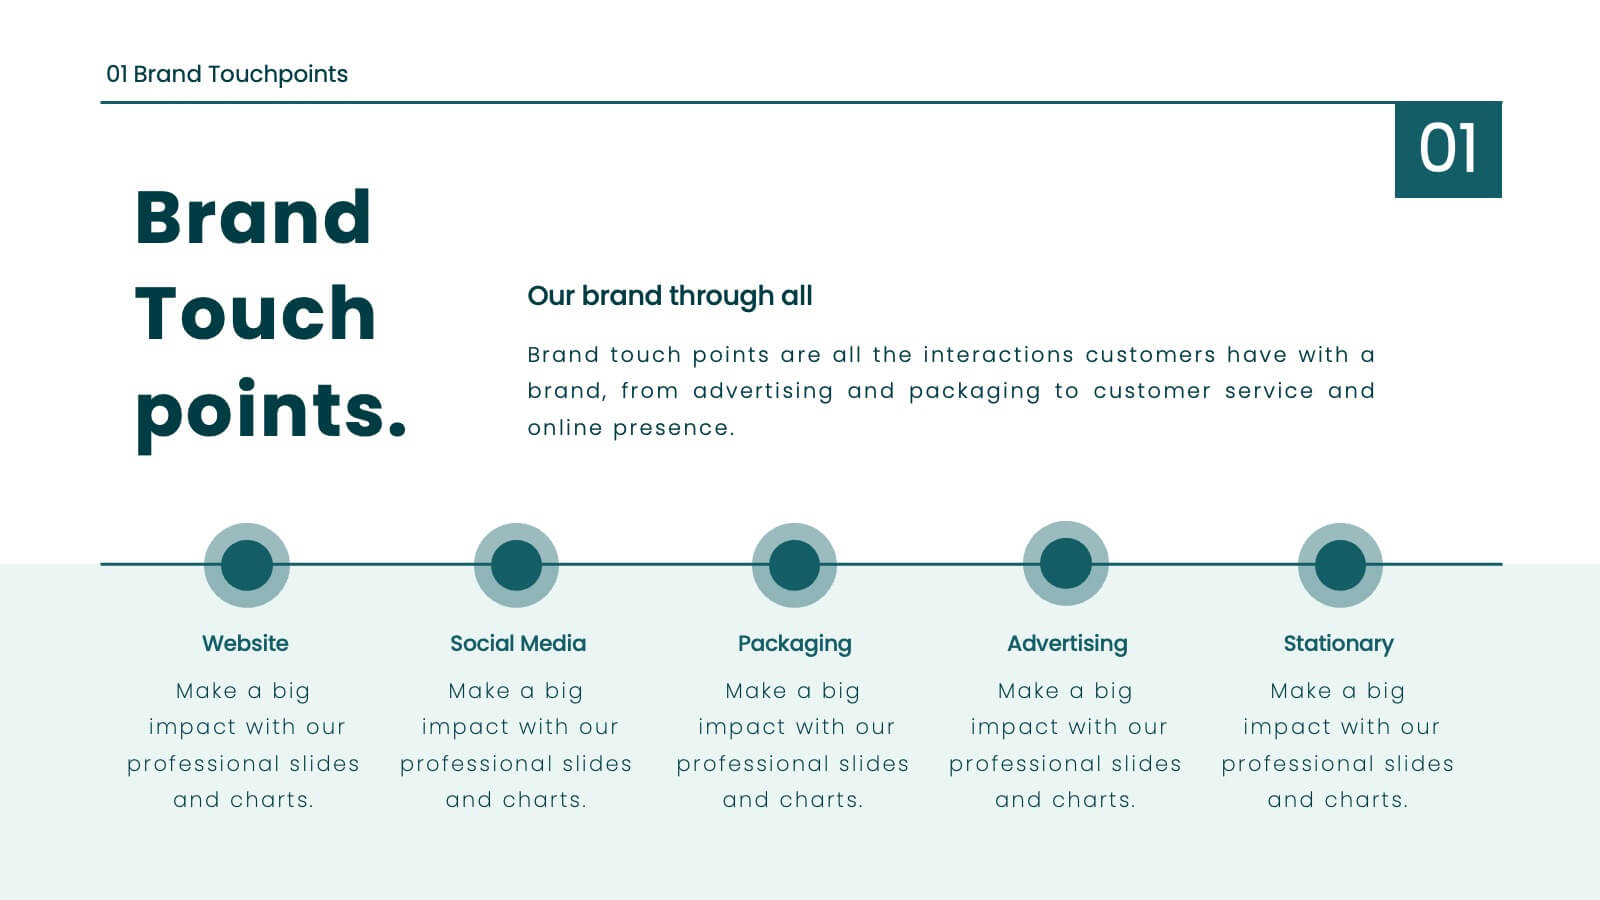
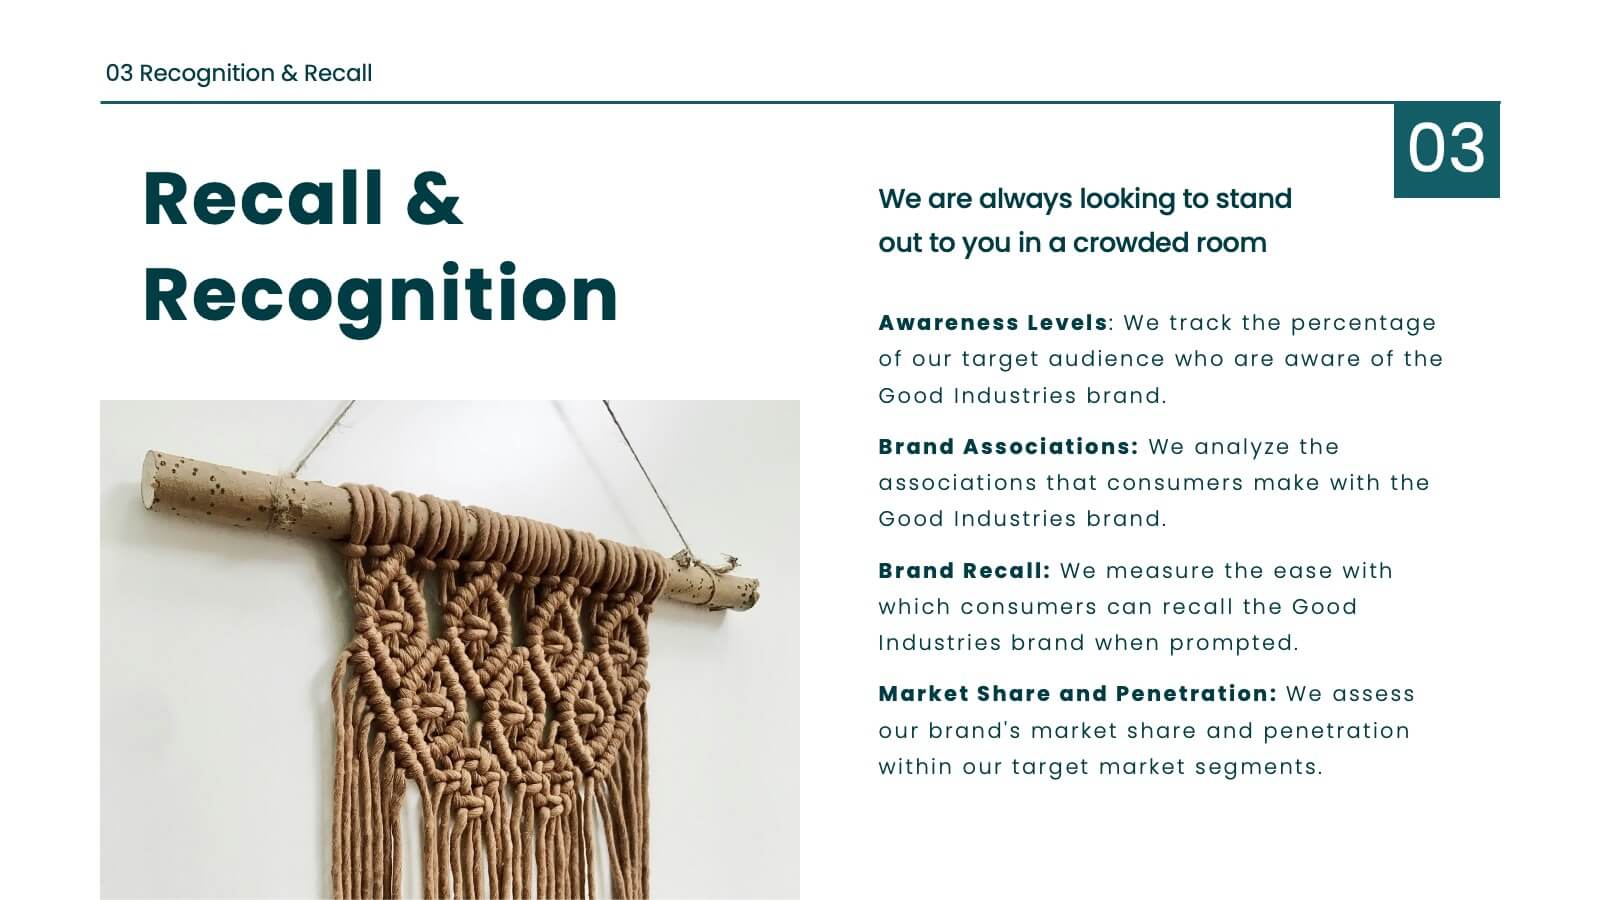
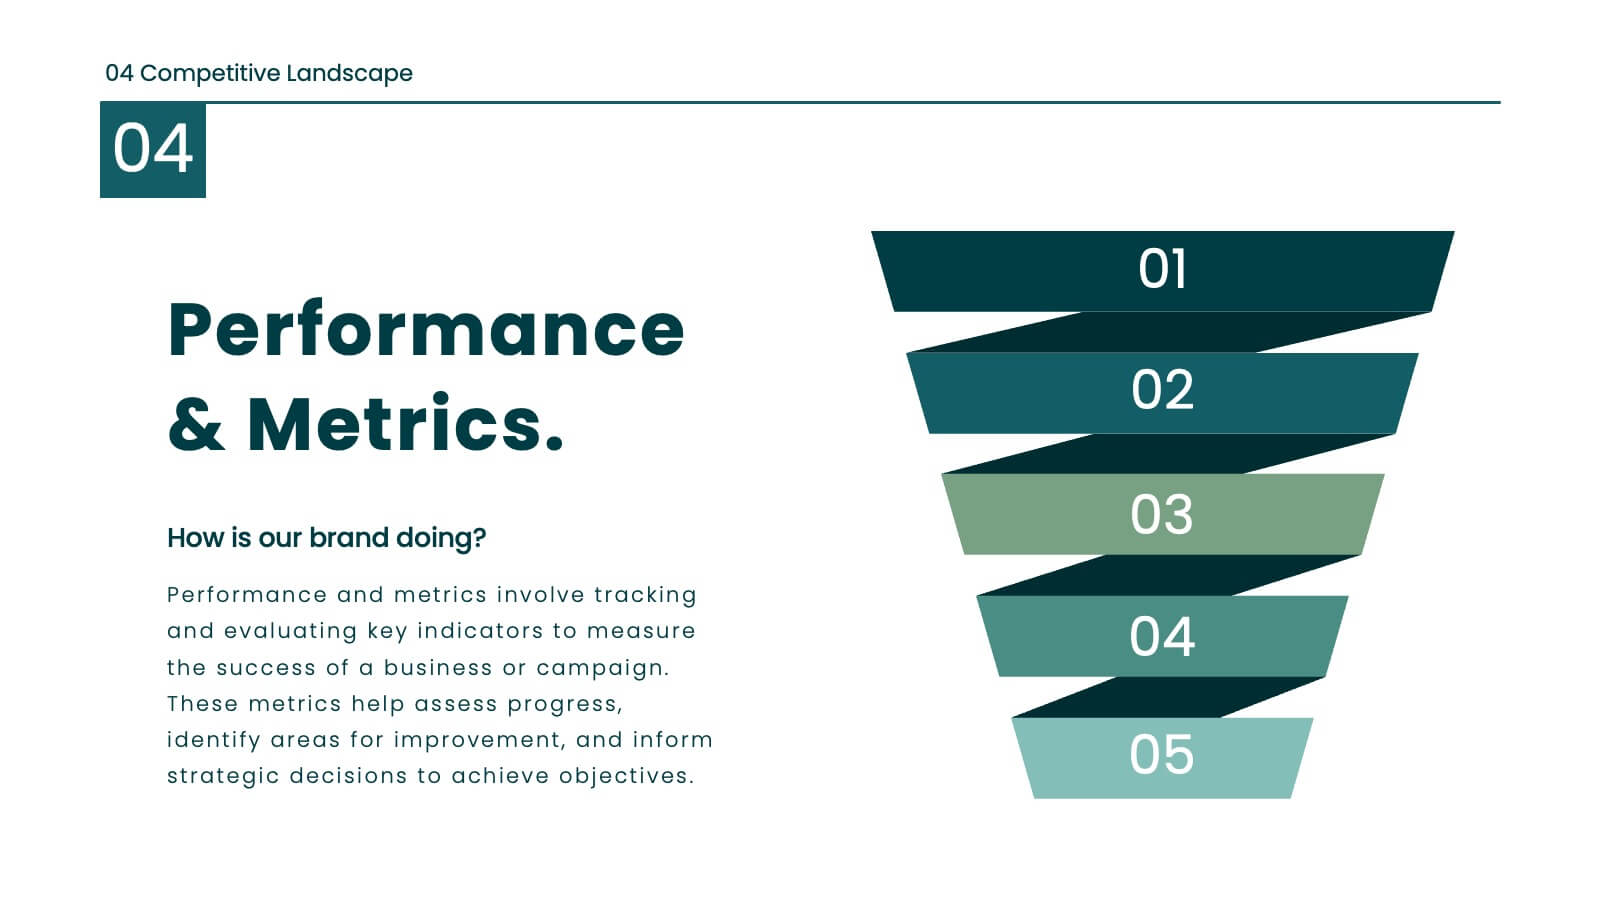
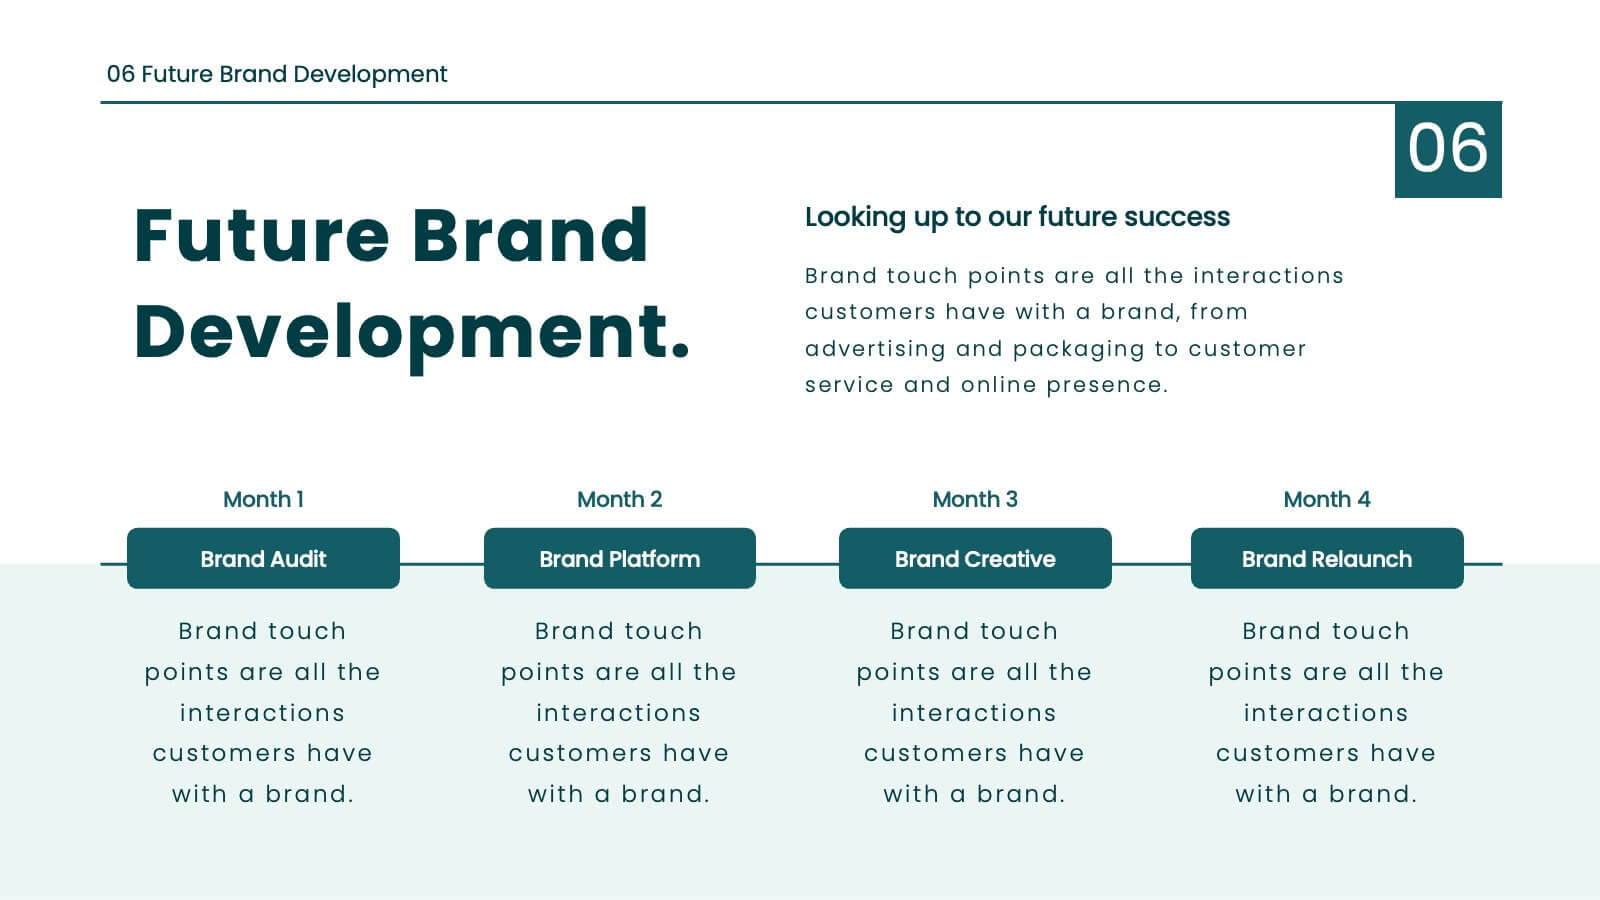
Juno Brand Guidelines Proposal Presentation
Define your brand's identity with this comprehensive, stylish presentation template. Perfect for detailing brand guidelines, vision, mission, and market analysis, it features a clean design with a professional layout. Highlight key elements like color palettes, typography, and unique selling propositions to ensure consistency and clarity. Compatible with PowerPoint, Keynote, and Google Slides, it’s ideal for any platform.