


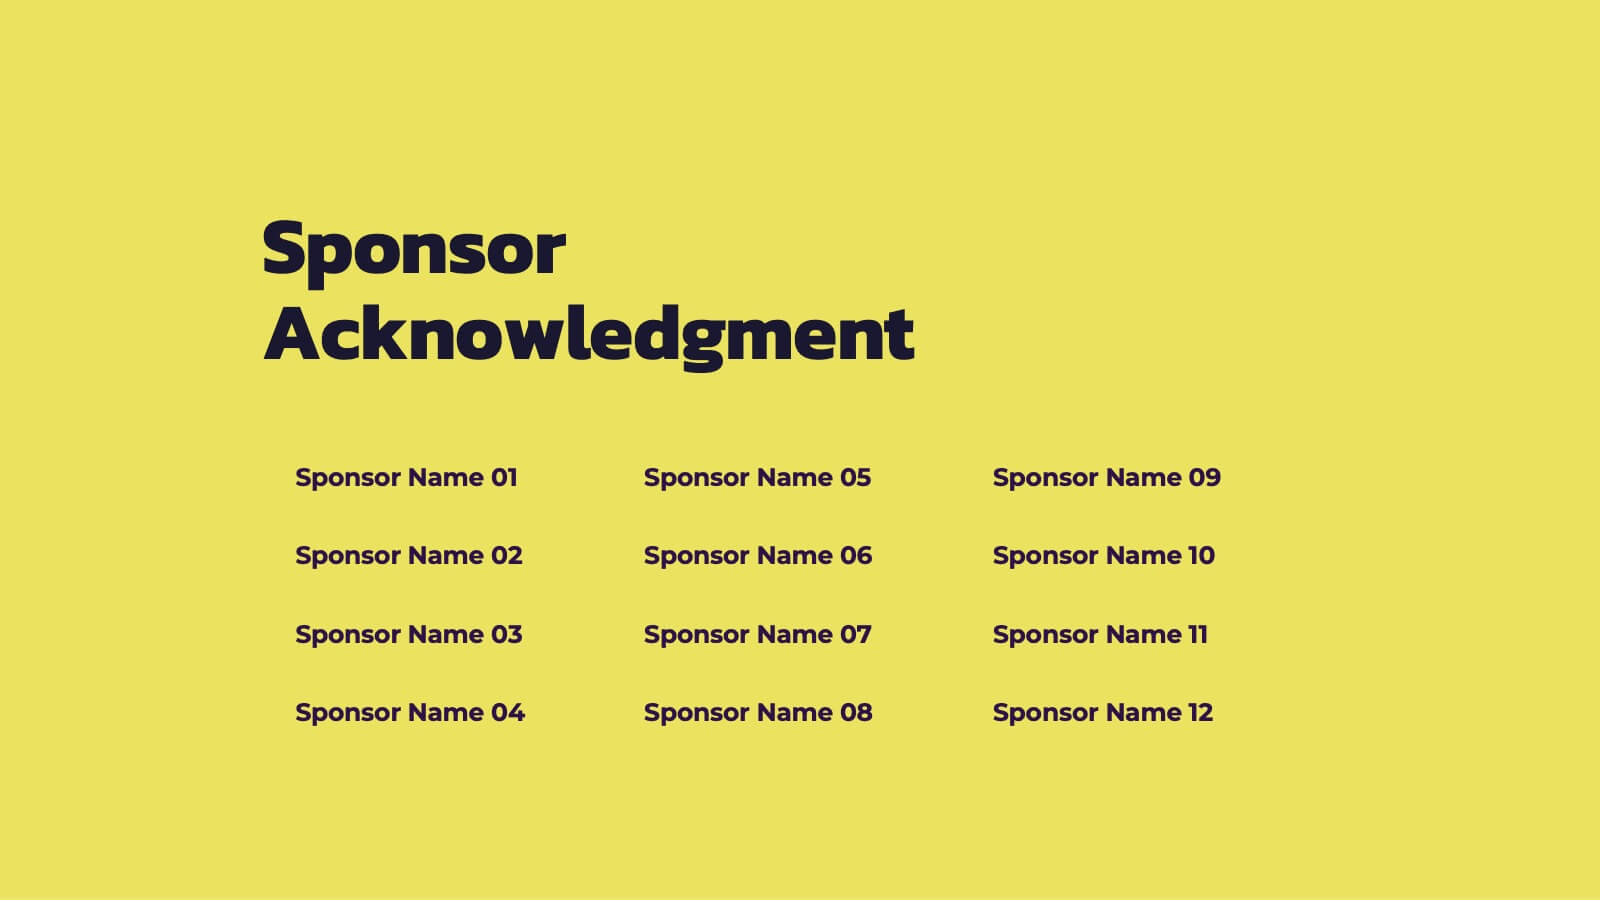
Features
- 4 Unique slides
- Fully editable and easy to edit in Microsoft Powerpoint, Keynote and Google Slides
- 16:9 widescreen layout
- Clean and professional designs
- Export to JPG, PDF or send by email


Do you have any questions?
Recommend


4 slides
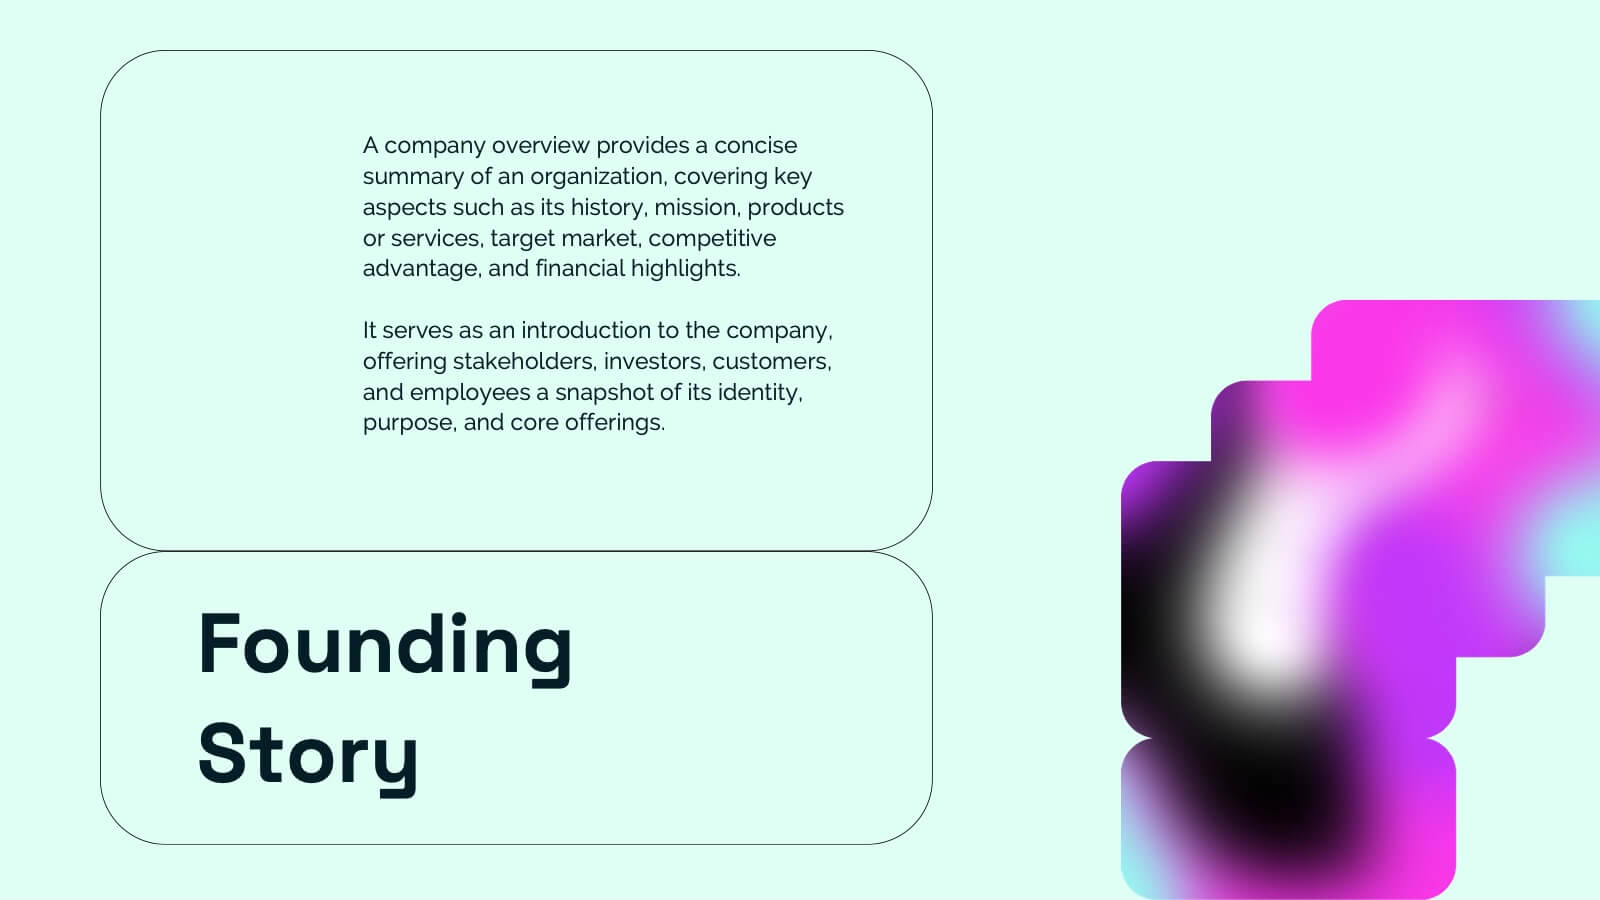
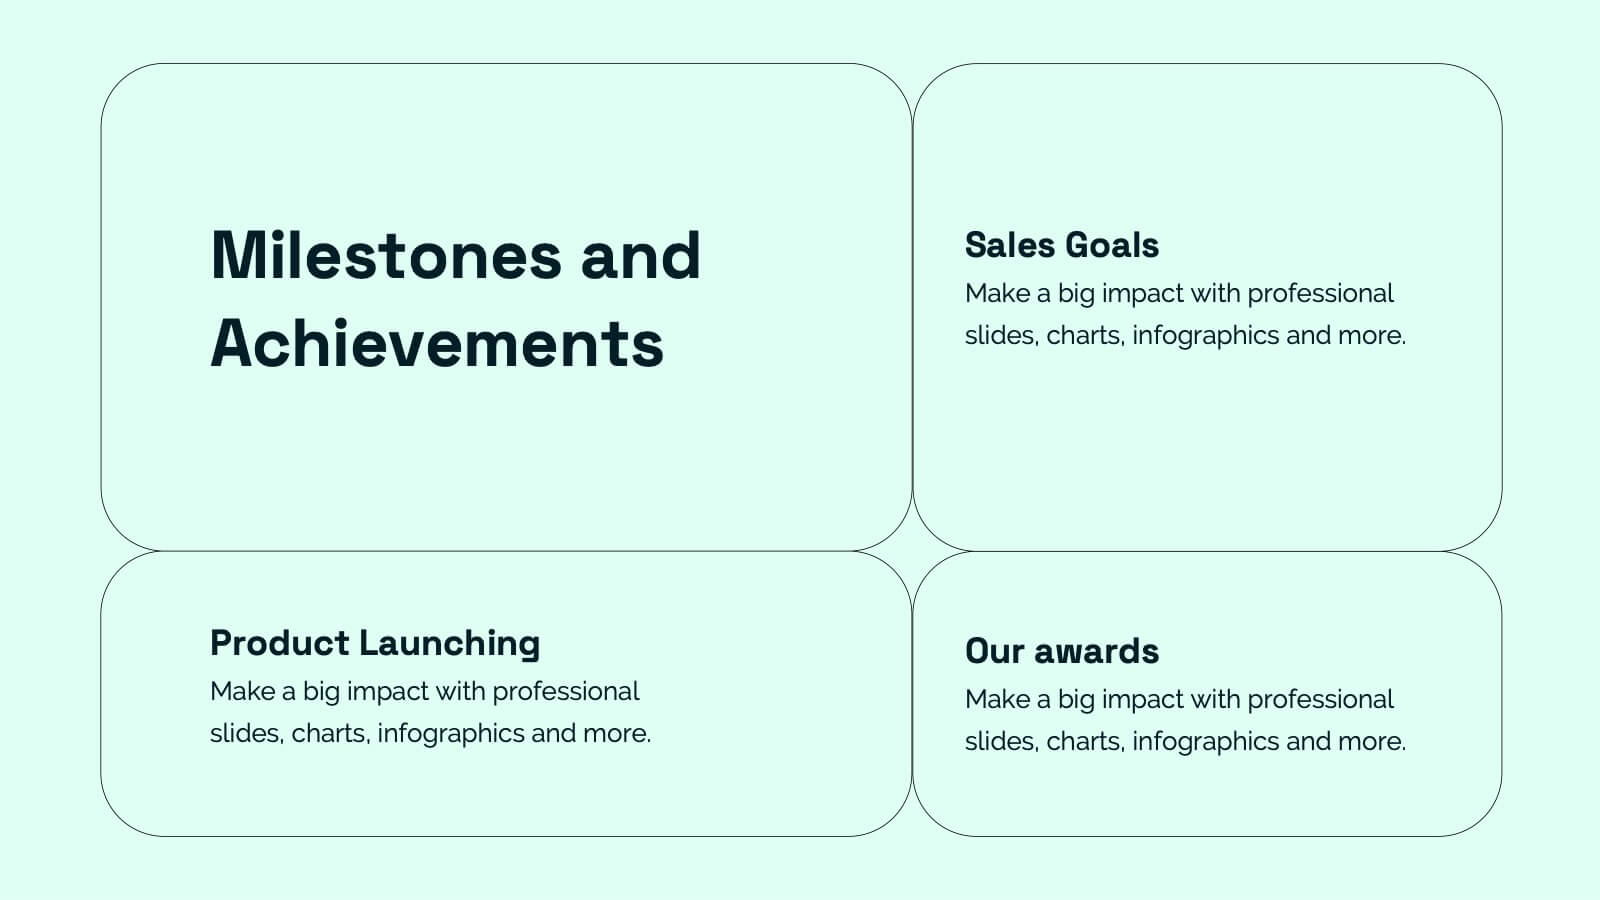
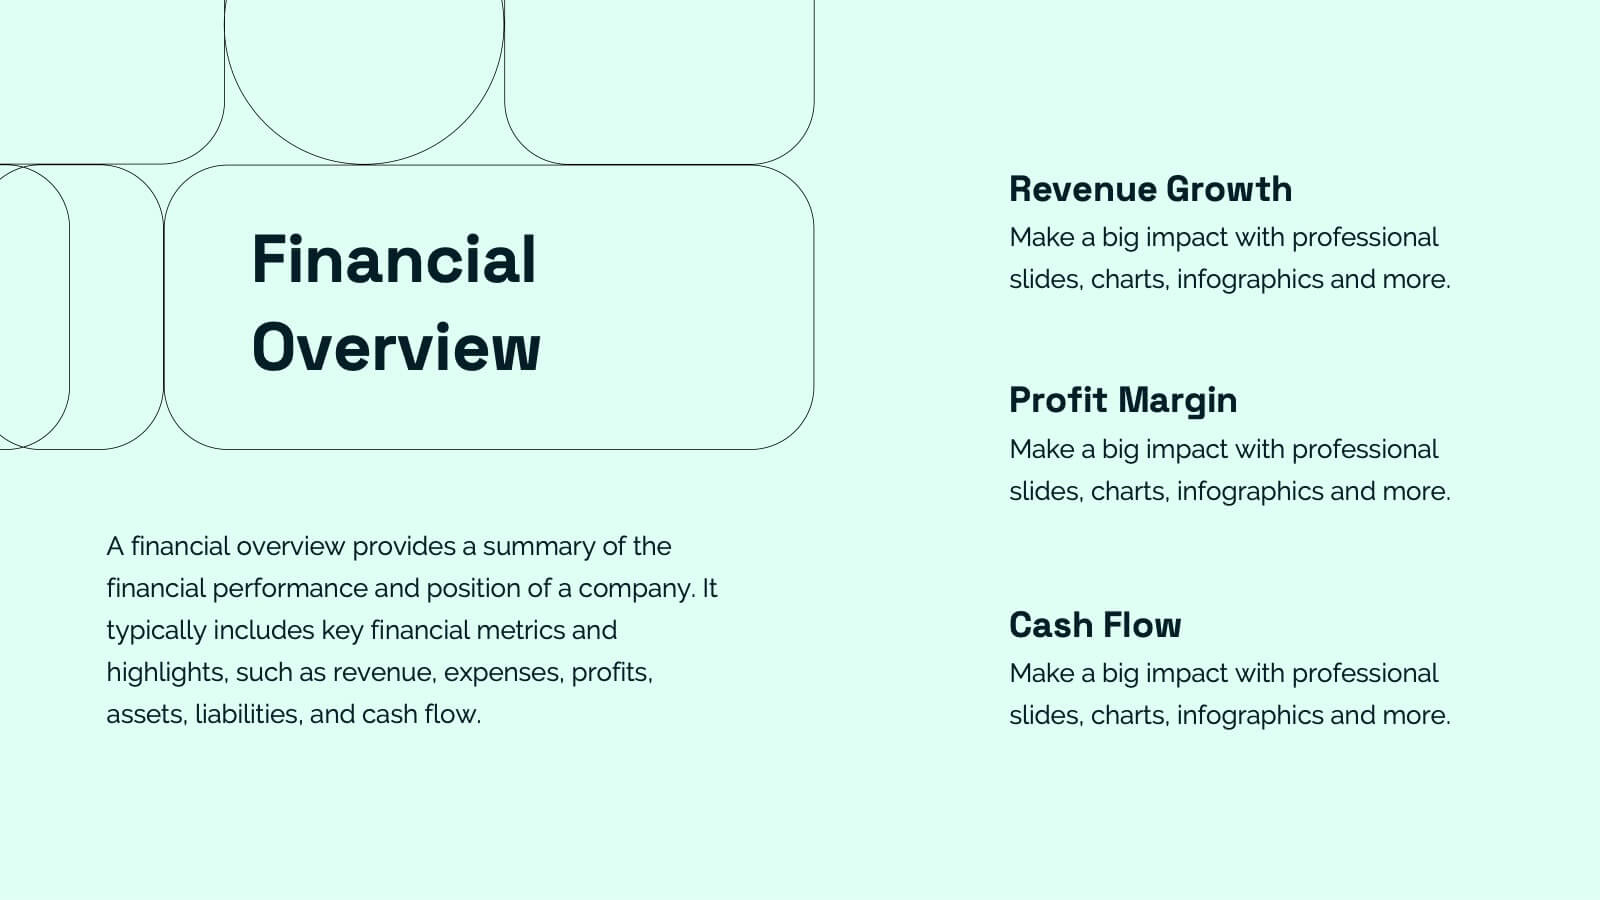
Annual Report Summary Slide
Present key performance metrics with confidence using this Annual Report Summary Slide. Designed with bold percentage visuals and clear titles, it helps break down quarterly or category results in a clean, professional format. Ideal for financial overviews, sales performance, or strategic summaries. Fully editable in PowerPoint, Keynote, and Google Slides.


4 slides
Meetings Agenda Slide Presentation
Make every meeting feel purposeful with a clean layout that highlights topics, timing, and key discussion points effortlessly. This presentation helps teams stay aligned, organized, and ready to follow the flow of the session. Perfect for planning or reporting. Fully compatible with PowerPoint, Keynote, and Google Slides.


6 slides
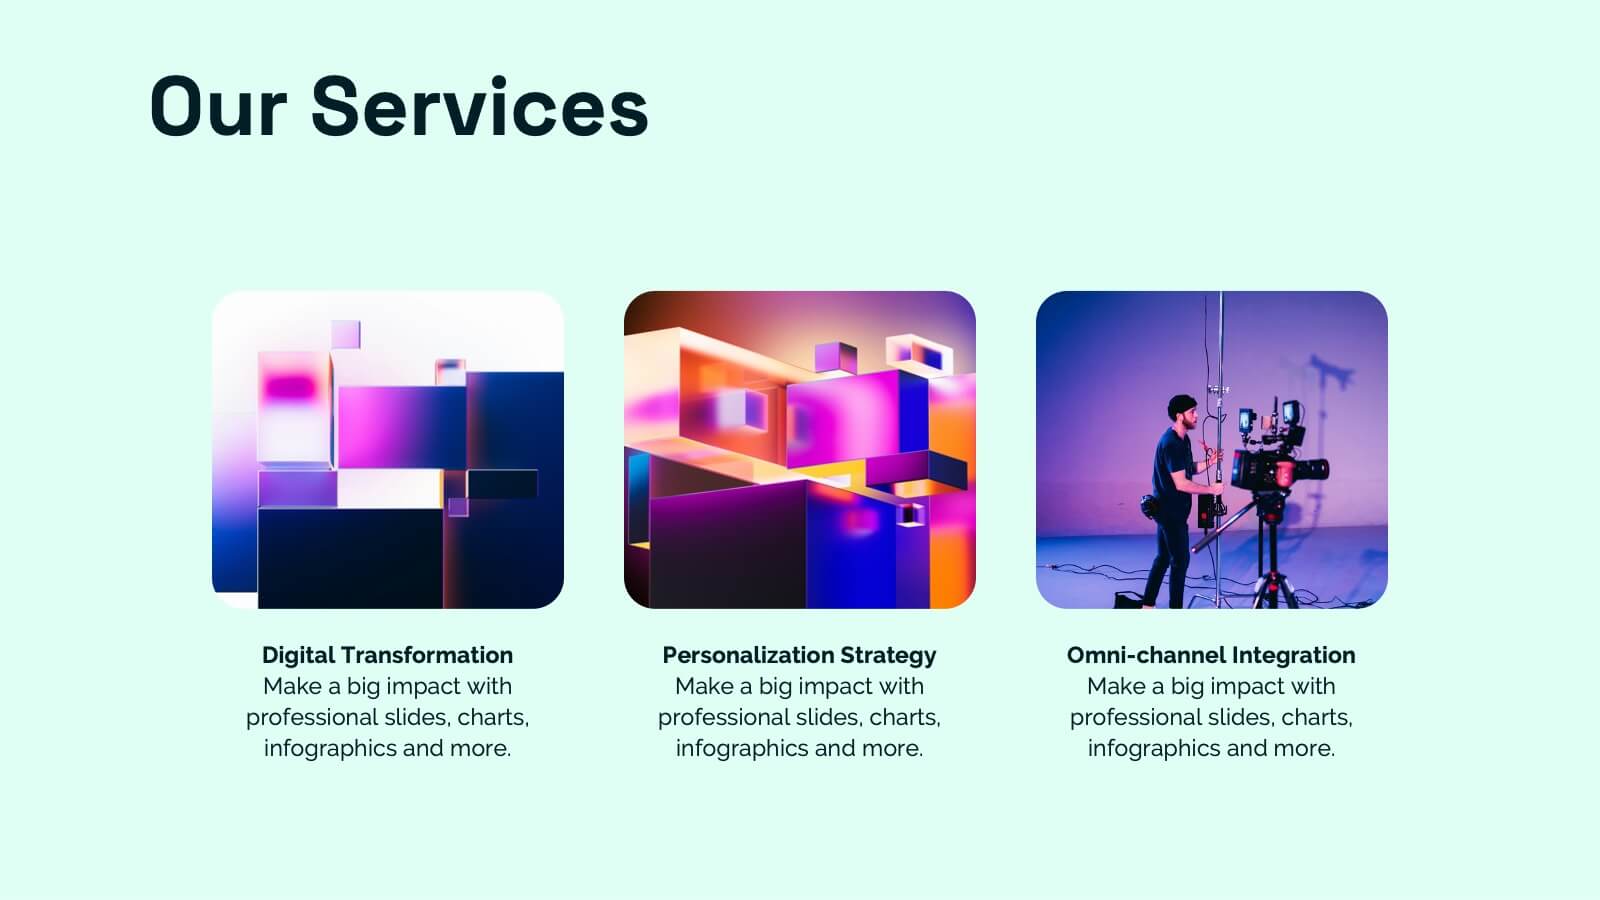
Internal Communication Strategy Presentation
Bring your message to life with a dynamic slide that turns communication goals into a simple, engaging visual story. This presentation highlights key steps, channels, and team roles to help audiences understand how information flows across an organization. Clean icons and structured layouts make every point clear and memorable. Fully compatible with PowerPoint, Keynote, and Google Slides.


6 slides
USA Market Reach Heatmap Presentation
Showcase your geographic impact with this USA Market Reach Heatmap template. Ideal for visualizing regional data, customer density, or sales performance. Features pinpoint markers, editable callouts, and a clean U.S. map layout. Fully customizable in PowerPoint, Keynote, and Google Slides—perfect for marketing, sales, or expansion strategy presentations.


12 slides
Predictive Analytics with Big Data Presentation
Unleash the power of Predictive Analytics with Big Data using this dynamic presentation template. Designed to highlight data-driven insights, AI-powered forecasting, and strategic decision-making, this template is ideal for data scientists, business analysts, and IT professionals. Fully customizable and available for PowerPoint, Keynote, and Google Slides, it ensures a visually compelling and structured presentation.


4 slides
Decision-Making Models and Strategies Presentation
Break down complex decision-making processes into clear, visual steps with the Decision-Making Models and Strategies presentation slide. This template uses a 3D staircase layout paired with data percentages to illustrate phases, criteria, or strategy distribution. It's perfect for business analysts, consultants, or strategic planning teams. Fully editable in PowerPoint, Keynote, and Google Slides for quick customization.


7 slides
5G Infographic Presentation Template
A 5G infographic is data related to the 5th generation of mobile telecommunications technology. This infographic template is an engaging way to display facts and figures, and attract attention from a wide audience. The main purpose of our 5G infographic template is to help you educate others about the new technology and its capabilities, and to help promote understanding of 5G. The information presented in this infographic can range from details, such as the differences between 5G and previous generations of mobile networks, and the benefits and potential applications of 5G.


8 slides
Healthcare Data Analysis Presentation
The "Healthcare Data Analysis Presentation" template offers a streamlined visual representation ideal for communicating complex healthcare data insights effectively. Designed with clarity in mind, it features sleek graphics symbolizing medical elements and clear percentage tags that quantify data in an immediately understandable way. This template facilitates the presentation of key data such as patient outcomes, treatment efficacy, or operational efficiency within healthcare settings. Its visual simplicity makes it an excellent choice for healthcare professionals and administrators who need to convey detailed statistics and results to stakeholders, ensuring that the key points are easily digestible and actionable.


22 slides
Crystal Business Plan Presentation
This business plan template is ideal for presenting strategies, conference overviews, and session details. With slides for keynote speakers, breakout sessions, and networking breaks, it offers a dynamic and professional layout. Compatible with PowerPoint, Keynote, and Google Slides, it ensures a clear and organized flow for any business presentation.


6 slides
3D Infographic Design
Visualize data like never before with this bold 3D block diagram layout. Designed to break down complex figures into three key segments, it’s perfect for presenting percentages, growth areas, or metric comparisons. Easily editable in PowerPoint, Keynote, and Google Slides.


5 slides
Product Development to Decline Model Presentation
Showcase the full journey of a product from its inception to phase-out with the Product Development to Decline Model presentation. This circular diagram clearly outlines the four core stages, ideal for product managers, business analysts, and strategic planners. Each section features clean icons and editable text zones to highlight key insights and milestones. Fully customizable in PowerPoint, Keynote, and Google Slides.


7 slides
Business Credit Card Infographic
Navigating business credit cards can seem overwhelming, but with our vibrant infographic, it becomes effortless. Drenched in playful pinks and dynamic colors, this tool is more than just eye-catching—it's a roadmap to the intricate realm of corporate credit. Tailored for everyone from financial educators to seasoned business owners, this infographic offers a clear, concise breakdown of business card essentials, benefits, and best practices. Whether you're presenting, learning, or simply seeking clarity, this resource promises invaluable insights with a dash of flair. Dive in and demystify the world of business credit cards with us!


23 slides
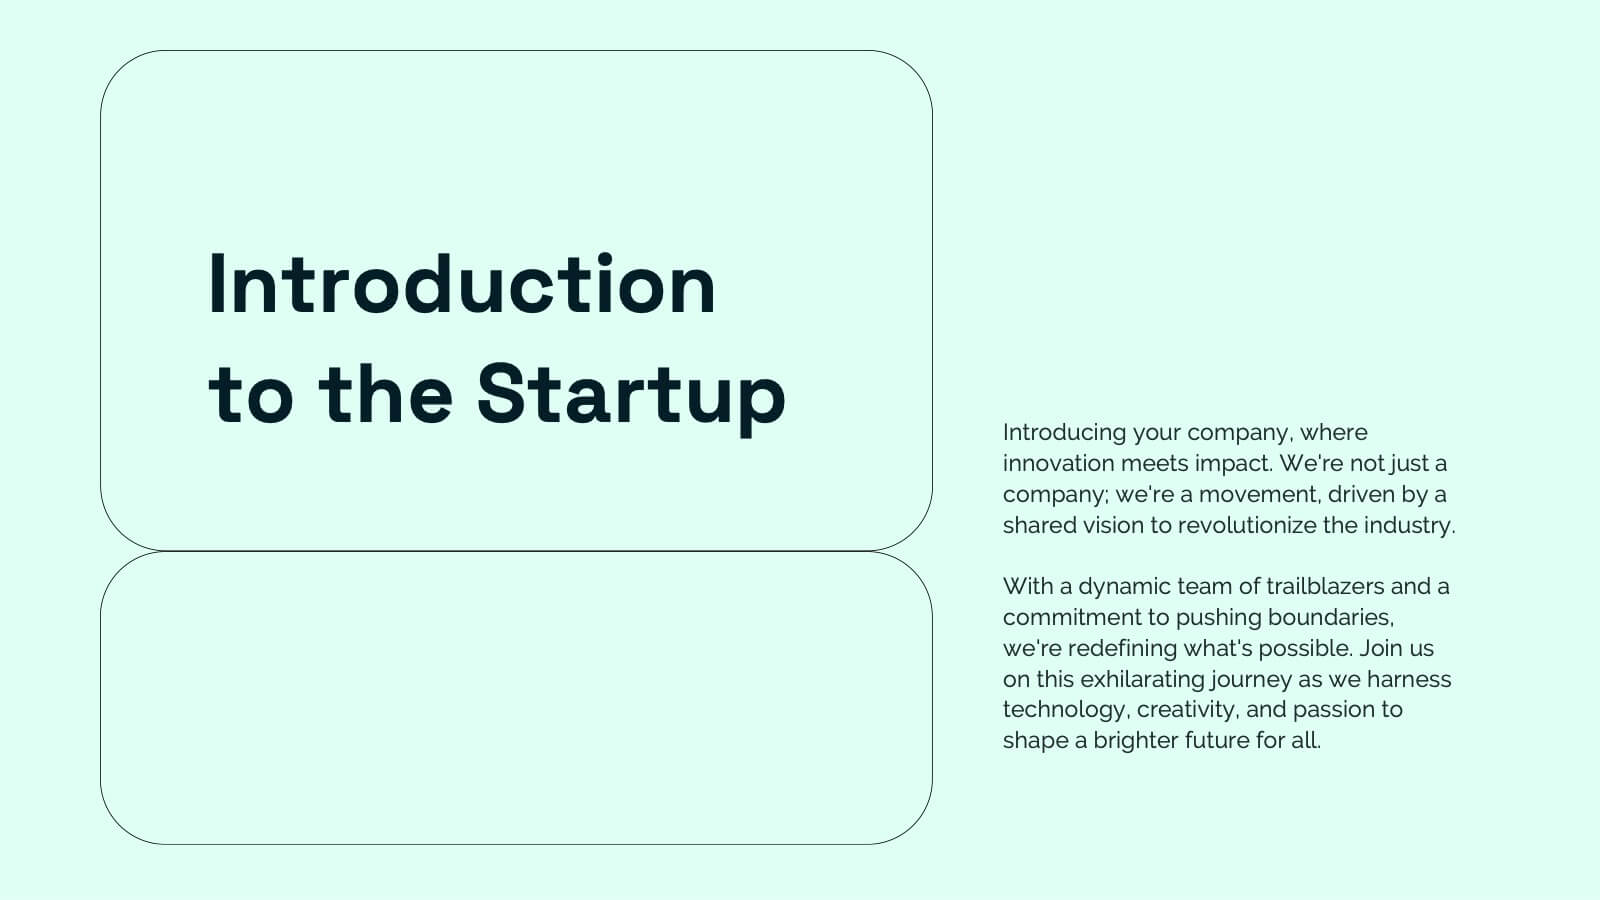
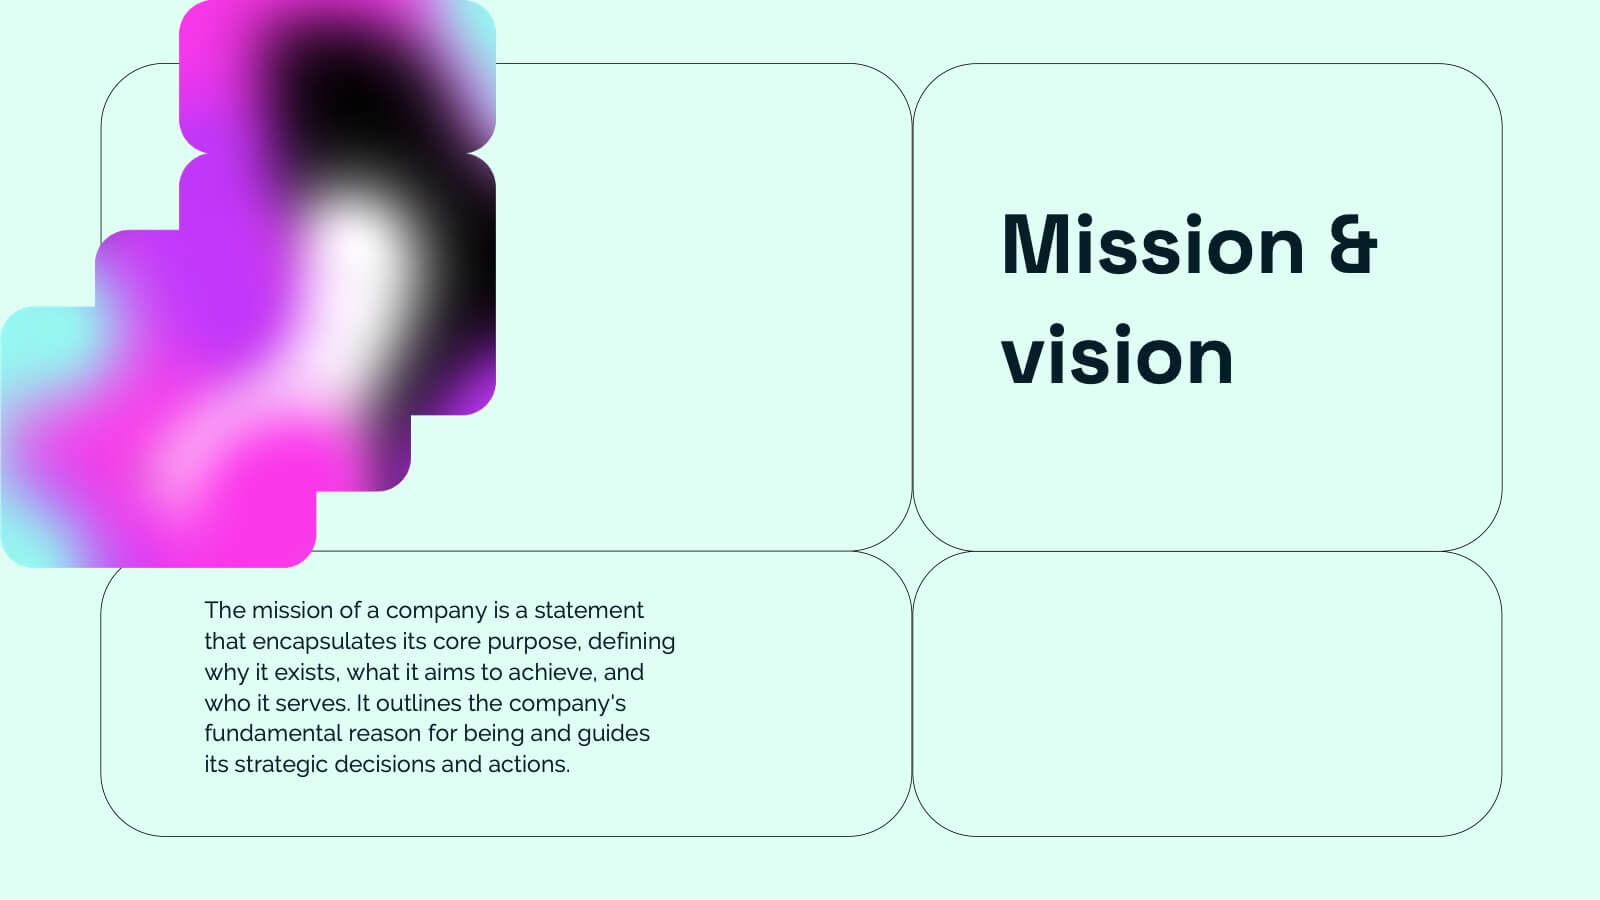
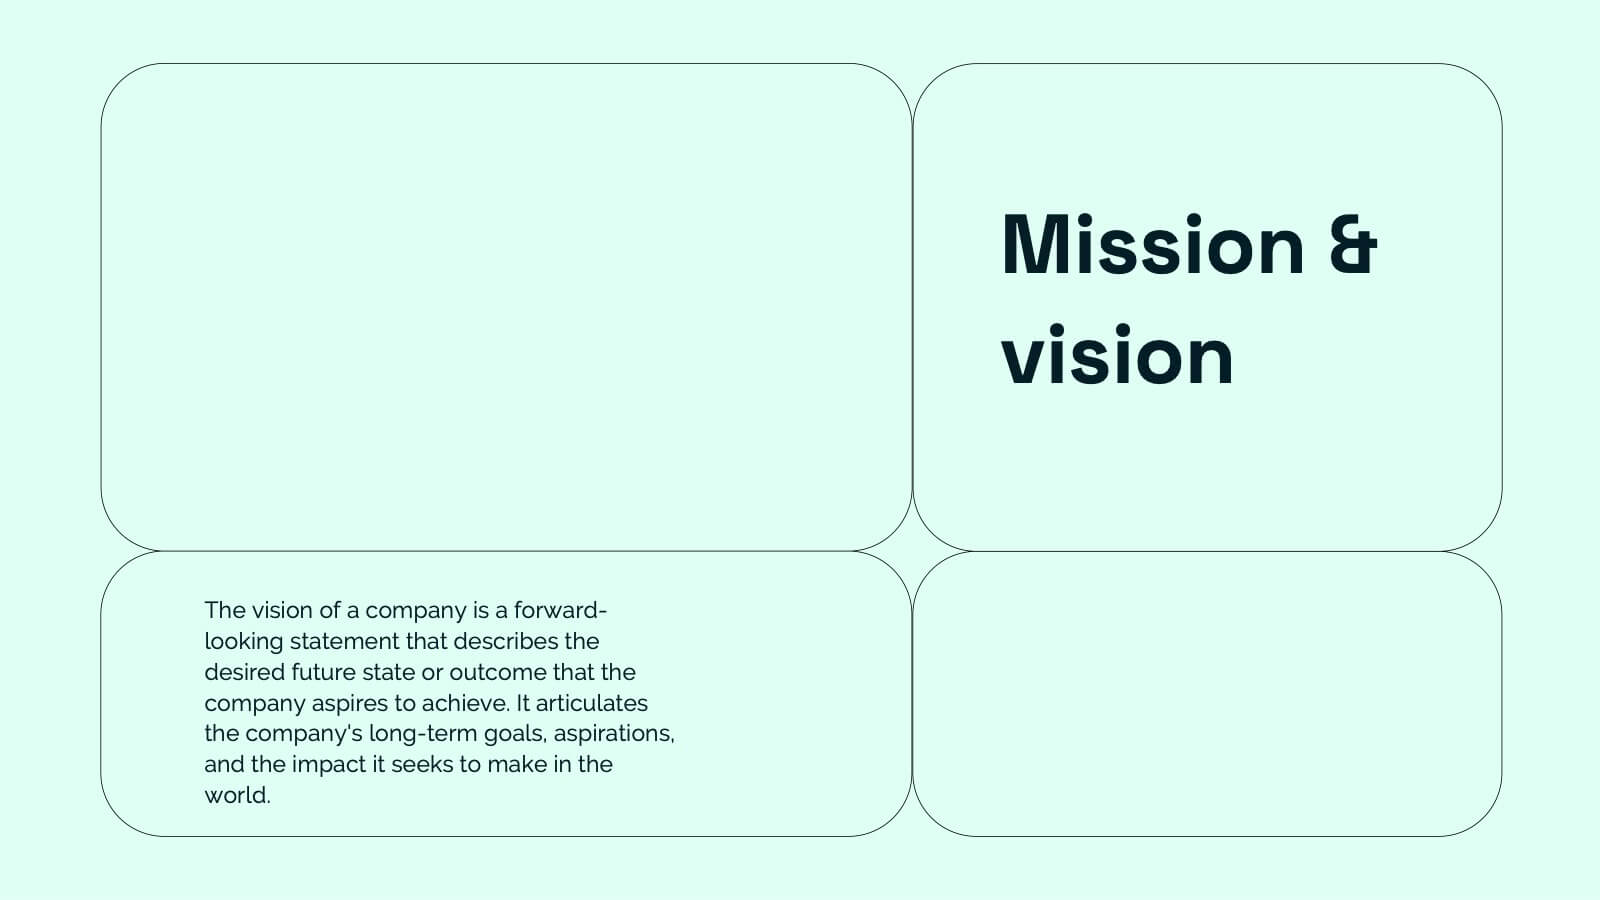
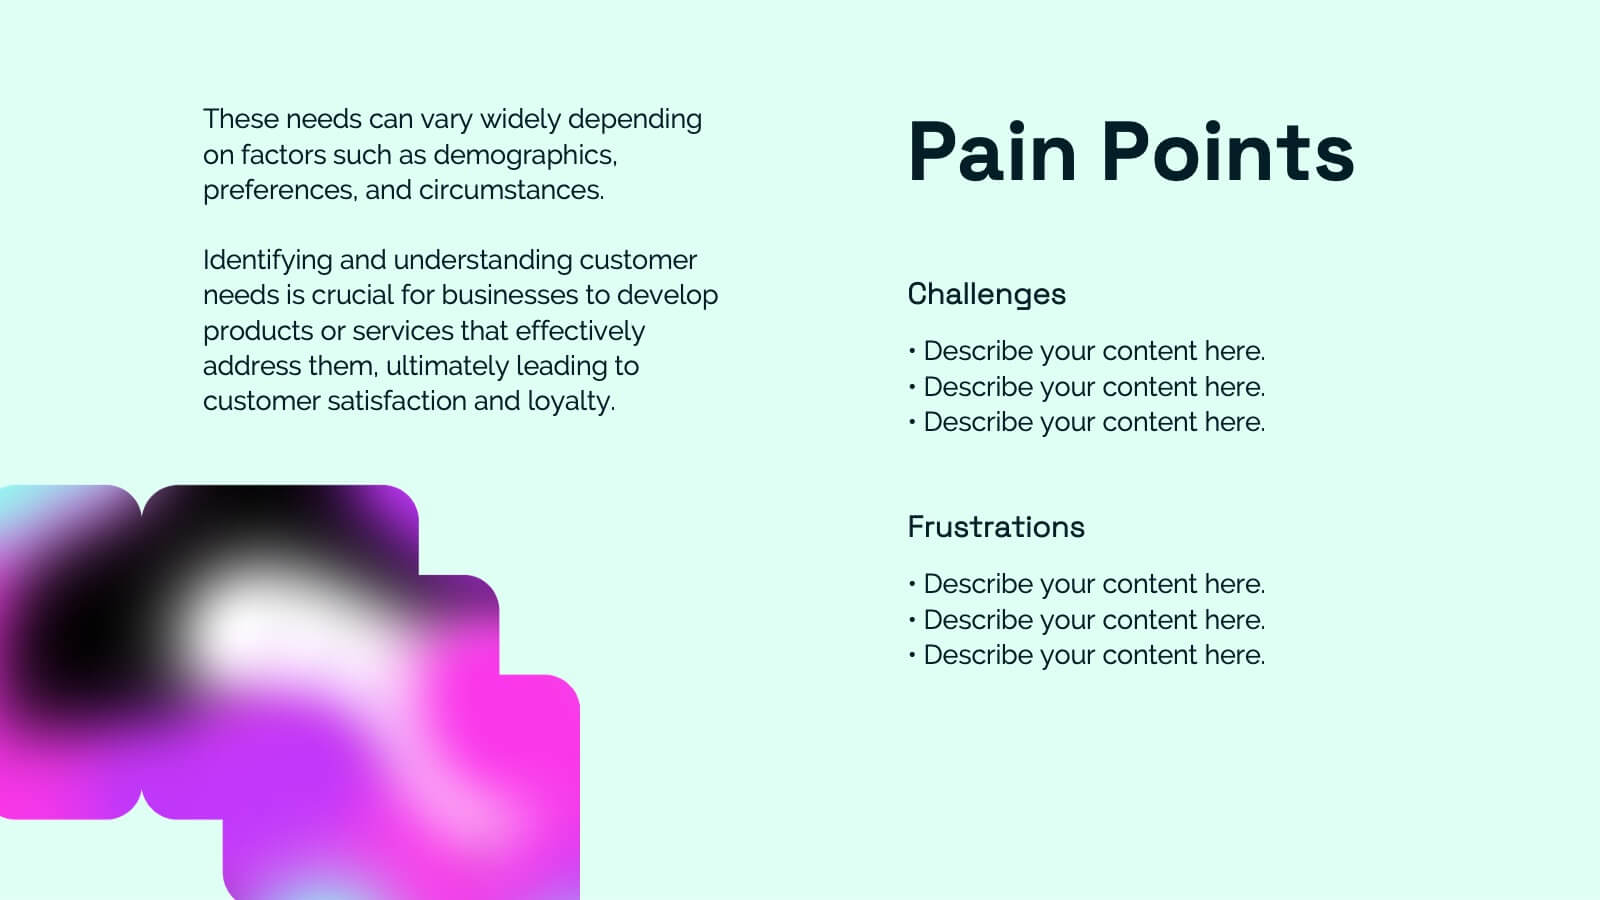
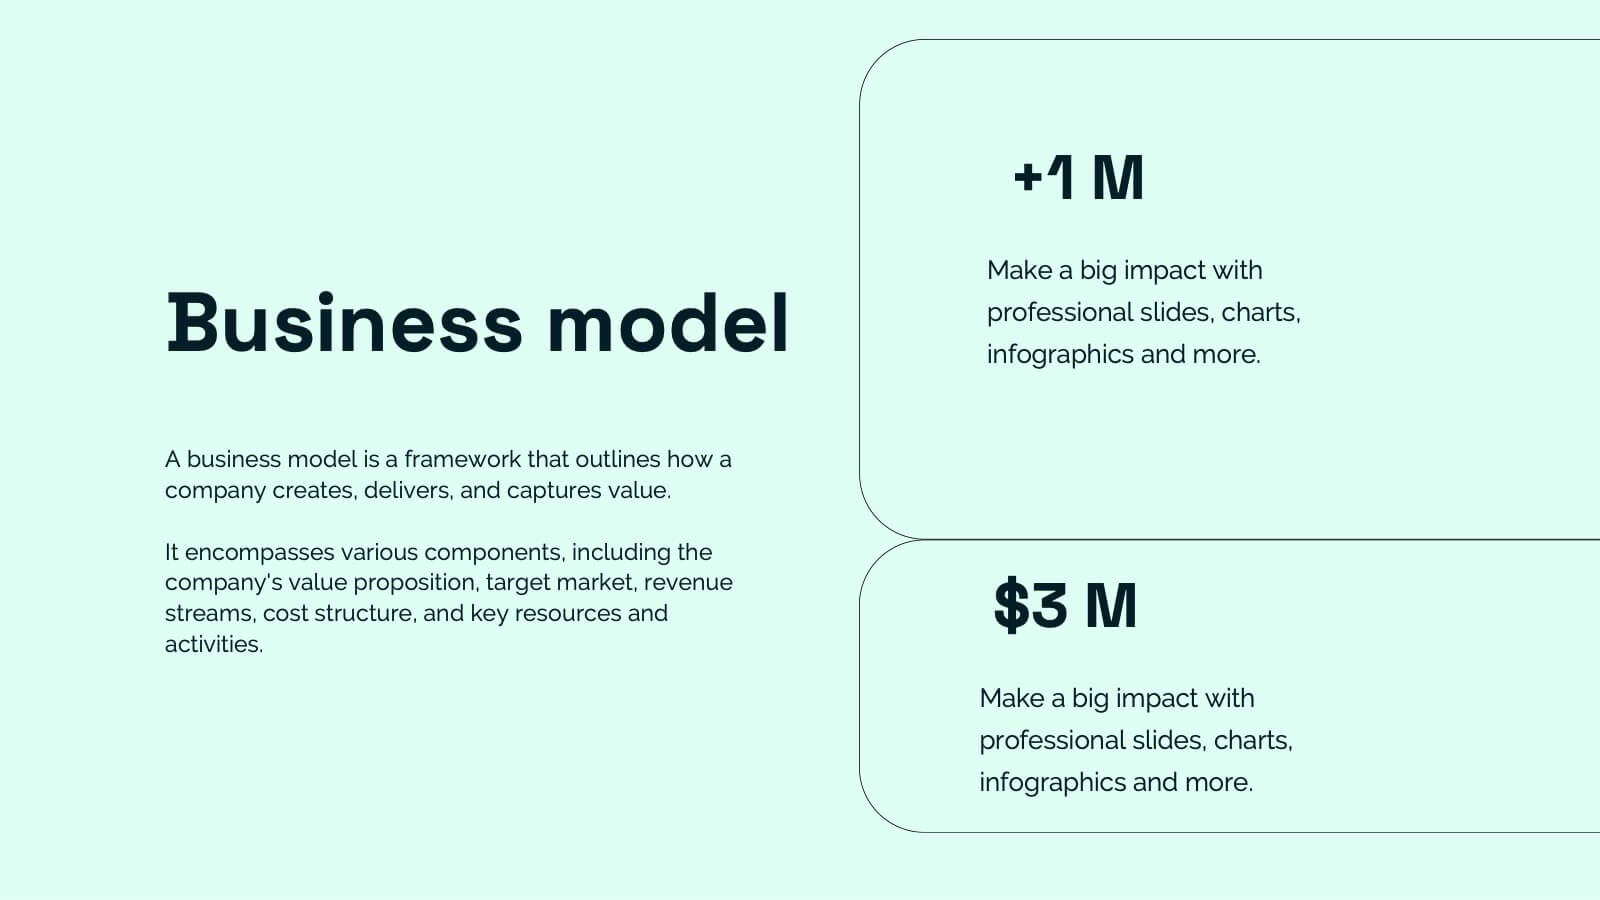
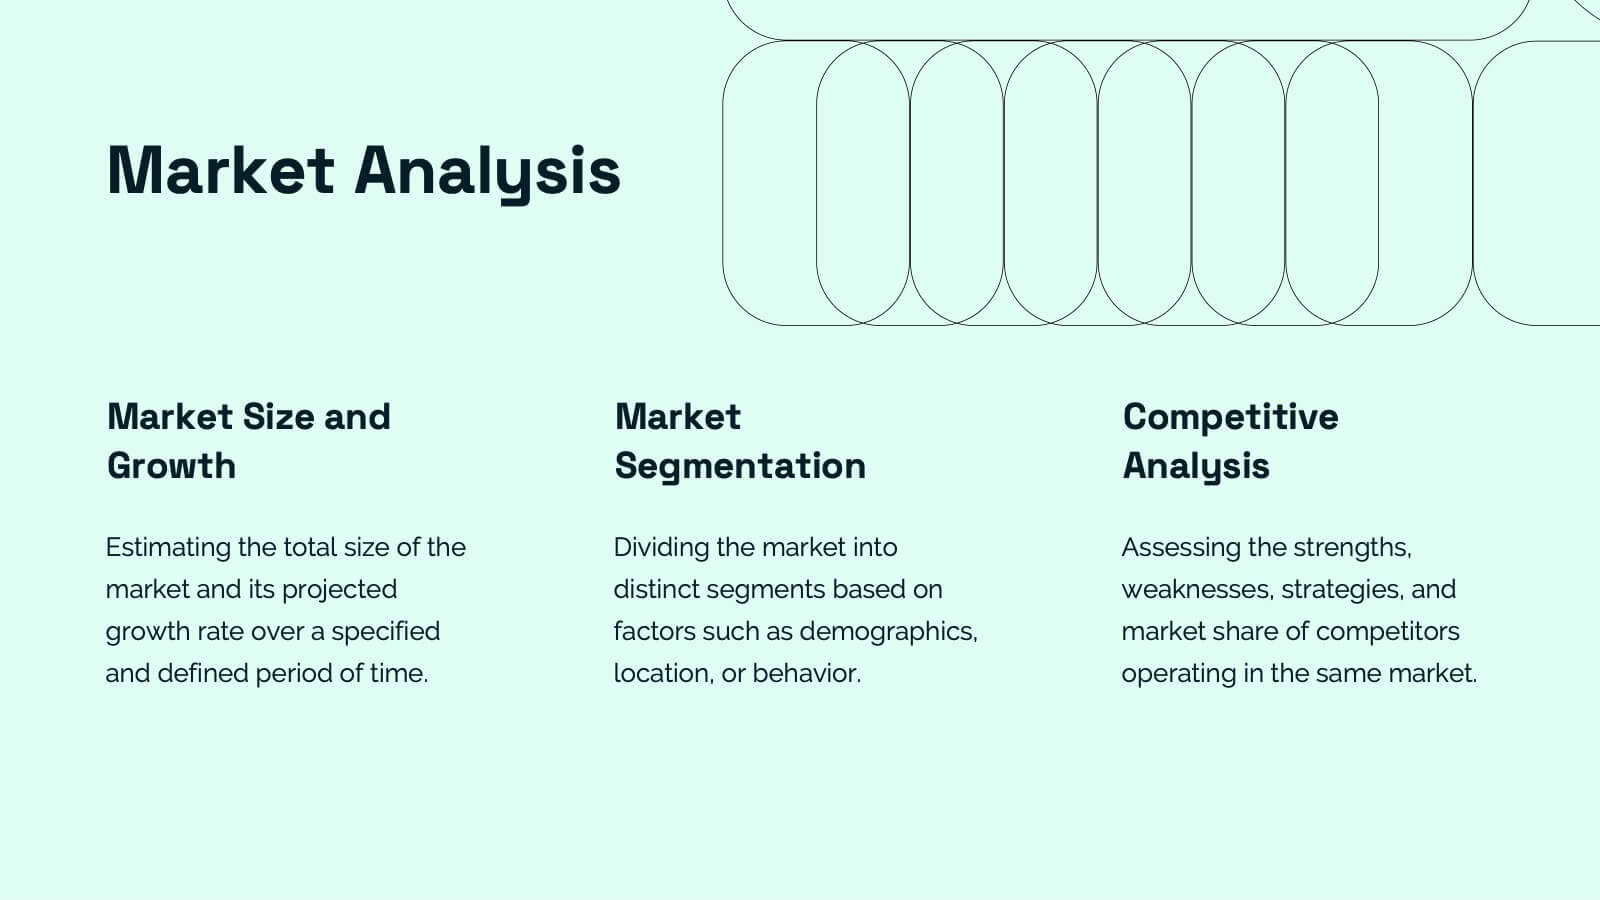
Nymph Startup Pitch Deck Presentation
This startup pitch deck template covers all the essentials for presenting a business. It includes slides for mission and vision, business model, market analysis, value proposition, and financial overview. Easily customizable for any startup industry, this modern design makes presenting your ideas a breeze. Compatible with PowerPoint, Keynote, and Google Slides.


7 slides
Technology Skills Gap Infographic Presentation
A Skills Gap Infographic is a visual representation of the difference between the skills that employers need and the skills that are possessed by job seekers or employees. This template illustrates the gap between the skills that are required for a particular job and the skills that are currently available in the workforce. This template include charts, diagrams, and other visual elements that help to explain the extent of the skills gap, as well as its impact on the economy, businesses, and individuals. Use this to raise awareness about the skills gap and its implications to encourage action.


7 slides
Leadership Skills Infographic
Leadership skills encompass a range of abilities and qualities that enable an individual to guide, motivate, and manage a team or group of people effectively. Embark on this joyful adventure through the realm of leadership skills, and let the vibrant colors and engaging design of our leadership skills infographic spark the leader within you. Compatible with Powerpoint, Keynote, and Google Slides. This template is designed to allow you to lead with a commitment to excellence. Roam through the realms of teamwork and collaboration, learning how to unite diverse individuals towards a common goal.


10 slides
Hospital Services Overview Presentation
Bring your healthcare message to life with a clean, modern layout that makes complex hospital services easy to understand. This presentation helps you outline key departments, care processes, and essential service details with clarity and confidence. Designed for smooth communication in medical settings, it works seamlessly in PowerPoint, Keynote, and Google Slides.


6 slides
Market Segmentation by Demographics
Visually break down consumer behavior by gender with this clean, gender-split demographic chart. Ideal for marketing analysts and business strategists, this slide highlights key audience insights, purchasing trends, or engagement metrics. Fully editable in PowerPoint, Keynote, and Google Slides.