


Features
- 5 Unique slides
- Fully editable and easy to edit in Microsoft Powerpoint, Keynote and Google Slides
- 16:9 widescreen layout
- Clean and professional designs
- Export to JPG, PDF or send by email


Do you have any questions?
Recommend


6 slides
Business Plan Next Steps Presentation
Map out your strategy with the Business Plan Next Steps Presentation template. This visually structured layout helps outline key actions, milestones, and priorities for business growth and execution. Ideal for entrepreneurs, executives, and project managers, this slide ensures clarity and alignment on upcoming initiatives. Fully customizable in PowerPoint, Keynote, and Google Slides for easy integration into your planning process.


6 slides
Remote Learning and Virtual Classrooms Presentation
Visualize the modern classroom experience with this six-step layout centered around a laptop graphic. Each point is displayed in a colorful speech bubble, making it perfect for showcasing online learning tools, virtual engagement strategies, or course delivery methods. Ideal for educators, trainers, and e-learning professionals, this slide is fully editable and works seamlessly in PowerPoint, Keynote, and Google Slides.


5 slides
Social Media Strategy Infographic
Social Media refers to digital platforms and websites that allow users to create and share content, engage with others, and participate in online communities. This presentation template is a powerful tool to help you create a comprehensive social media strategy. It provides a visually appealing and easy-to-understand overview of the key elements of a successful social media strategy. Use this template to plan and communicate your social media strategy effectively, ensuring that you make the most of your social media presence and engage your target audience efficiently. This template is compatible with Powerpoint, Keynote, and Google Slides.


5 slides
New Hire Orientation Program
Welcome new employees with confidence using the New Hire Orientation Program Presentation. This step-by-step slide is designed to outline your company’s onboarding journey in five clear, structured stages. With labeled “Step 01” through “Step 05” banners, icon placeholders, and editable text boxes, this template is ideal for HR teams, managers, or team leads introducing company values, processes, or benefits. Available in both full-color and progressive highlight variations, it's fully customizable in PowerPoint, Keynote, and Google Slides.


8 slides
Business KPI Dashboard Presentation
Track performance at a glance with the Business KPI Dashboard Presentation. This clean, professional layout includes a speedometer-style gauge and monthly bar chart to showcase progress, goals, or metrics clearly. Ideal for reporting, analysis, or executive summaries. Fully editable and compatible with PowerPoint, Keynote, and Google Slides.


5 slides
Benefits of Yoga Infographics
Yoga offers a wide range of benefits for the mind, body, and overall well-being, these also tend to deepen with regular practice. These infographic templates highlight the numerous advantages of practicing yoga. Whether you're a yoga instructor, wellness coach, or health enthusiast, this template provides a comprehensive overview of the physical, mental, and emotional benefits of yoga. The infographics include text boxes, illustrations, and graphs that can be used to promote the advantages of incorporating yoga into one's lifestyle. Compatible with Powerpoint, Keynote, and Google Slides, these are easily customizable.


6 slides
Thank You Letter Infographic
Showcase your appreciation with this collection, perfectly curated to express gratitude in the most heartfelt way. Each template is designed with a unique blend of style and simplicity, featuring modern layouts, elegant fonts, and a calming color scheme that adds a touch of sophistication to your message. These designs are versatile enough to be adapted for a variety of occasions, whether it's thanking a colleague, client, or friend. They provide a professional yet personal means to convey your thanks, enhancing the sincerity of your message. Customize the templates to include personal anecdotes or details specific to the recipient, making each thank you letter feel both genuine and thoughtful. Ideal for both corporate and personal use, this collection ensures that your gesture of gratitude leaves a lasting impression, enhancing professional relationships and personal bonds alike.


20 slides
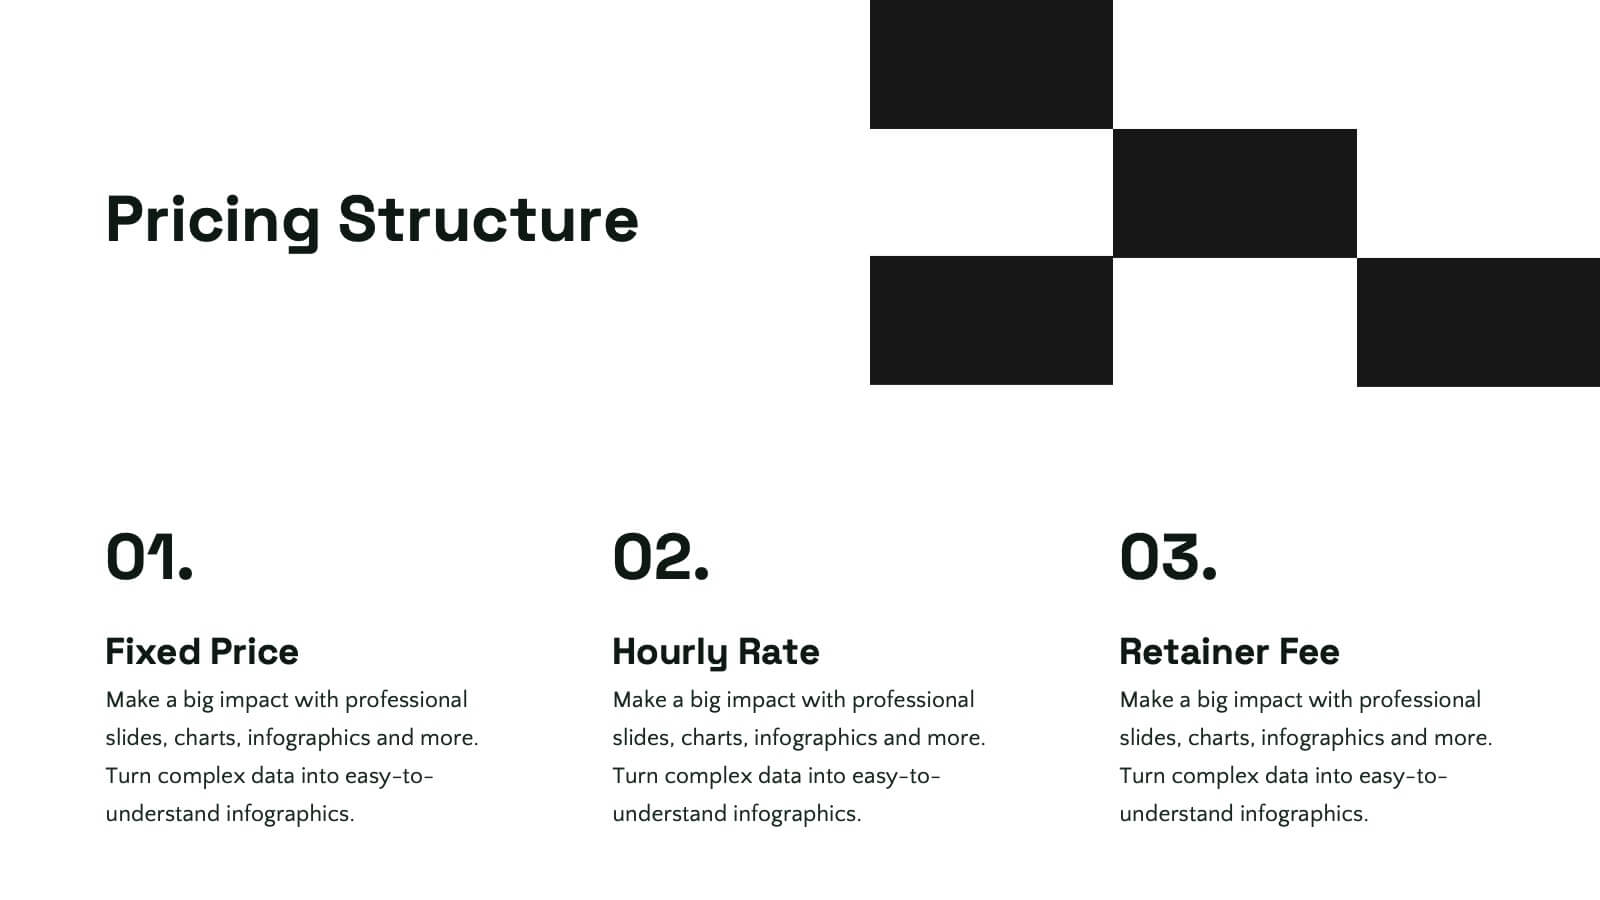
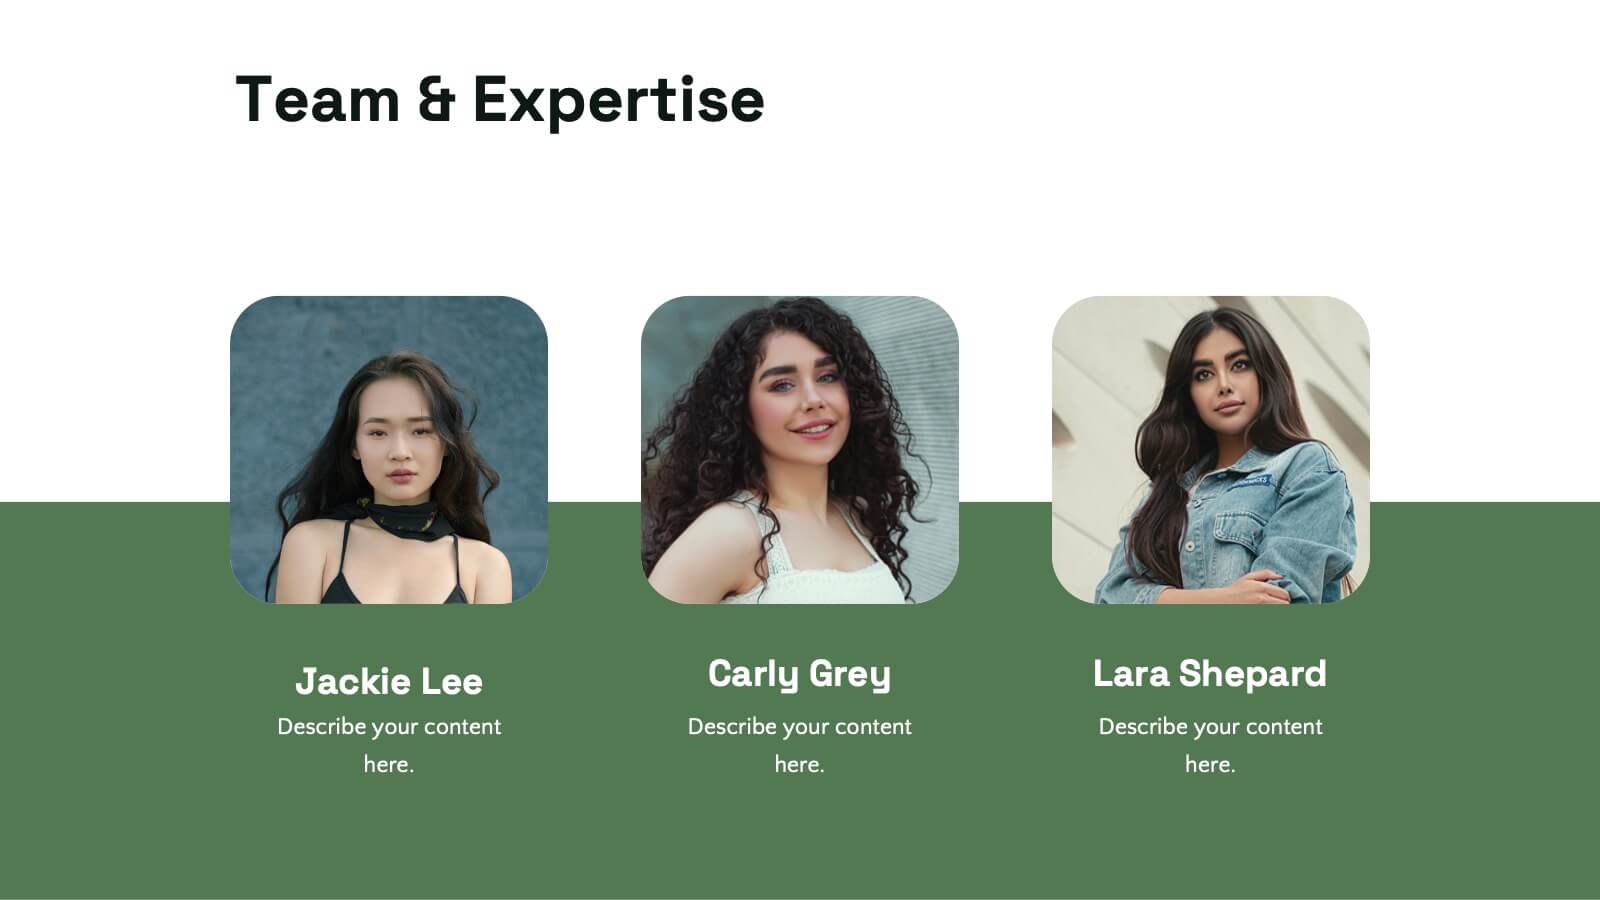
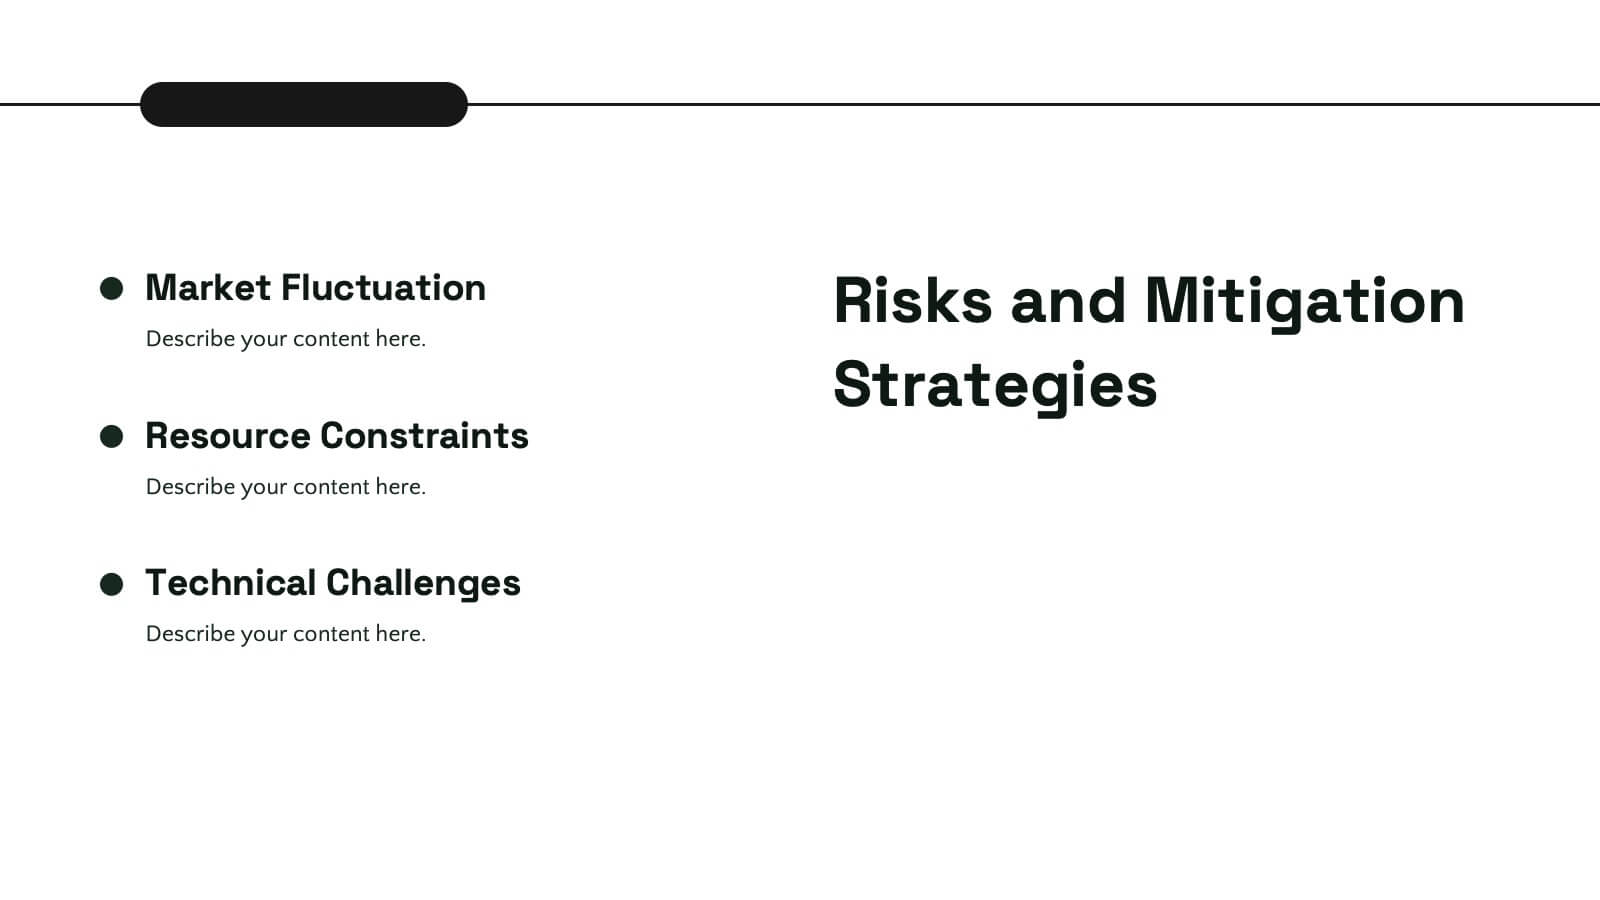
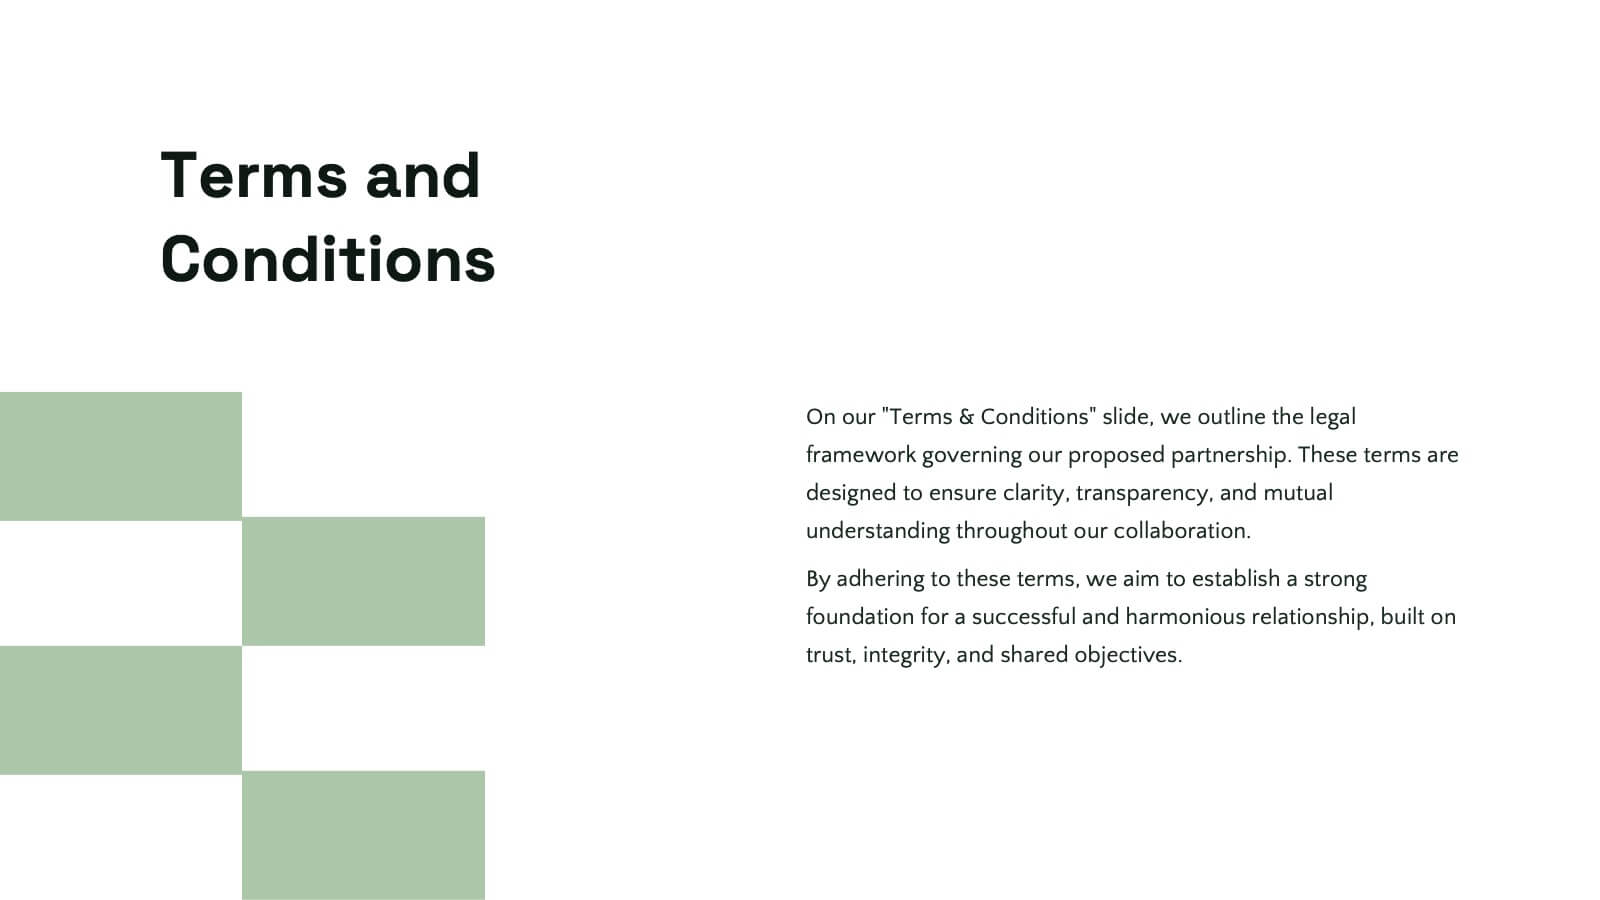
Wyrmwood Design Proposal Presentation
The Startup Funding Proposal Presentation Template includes 20 sleek and professional slides covering problem statements, solutions, pricing structures, and team expertise. With its modern black-and-white aesthetic, it ensures clarity and impact. Fully editable and compatible with PowerPoint, Keynote, and Google Slides, it's perfect for startups seeking investment opportunities and partnerships.


4 slides
Business Milestone Roadmap Presentation
Visualize your company's journey with this curved-road milestone infographic. Perfect for tracking key goals, quarterly achievements, or strategic plans, this template uses clear markers along a winding path to emphasize progress and direction. Ideal for business updates, project timelines, or growth strategies. Fully editable in PowerPoint, Keynote, and Google Slides.


7 slides
Scrum Sprints Planning Presentation
Kick off your workflow with a dynamic visual that maps out every phase of your team’s process in a clean, structured layout. This presentation helps explain planning cycles, task sequencing, and collaborative decision-making in a clear, engaging format. Fully compatible with PowerPoint, Keynote, and Google Slides.
19 slides
Tidal Design Proposal Presentation
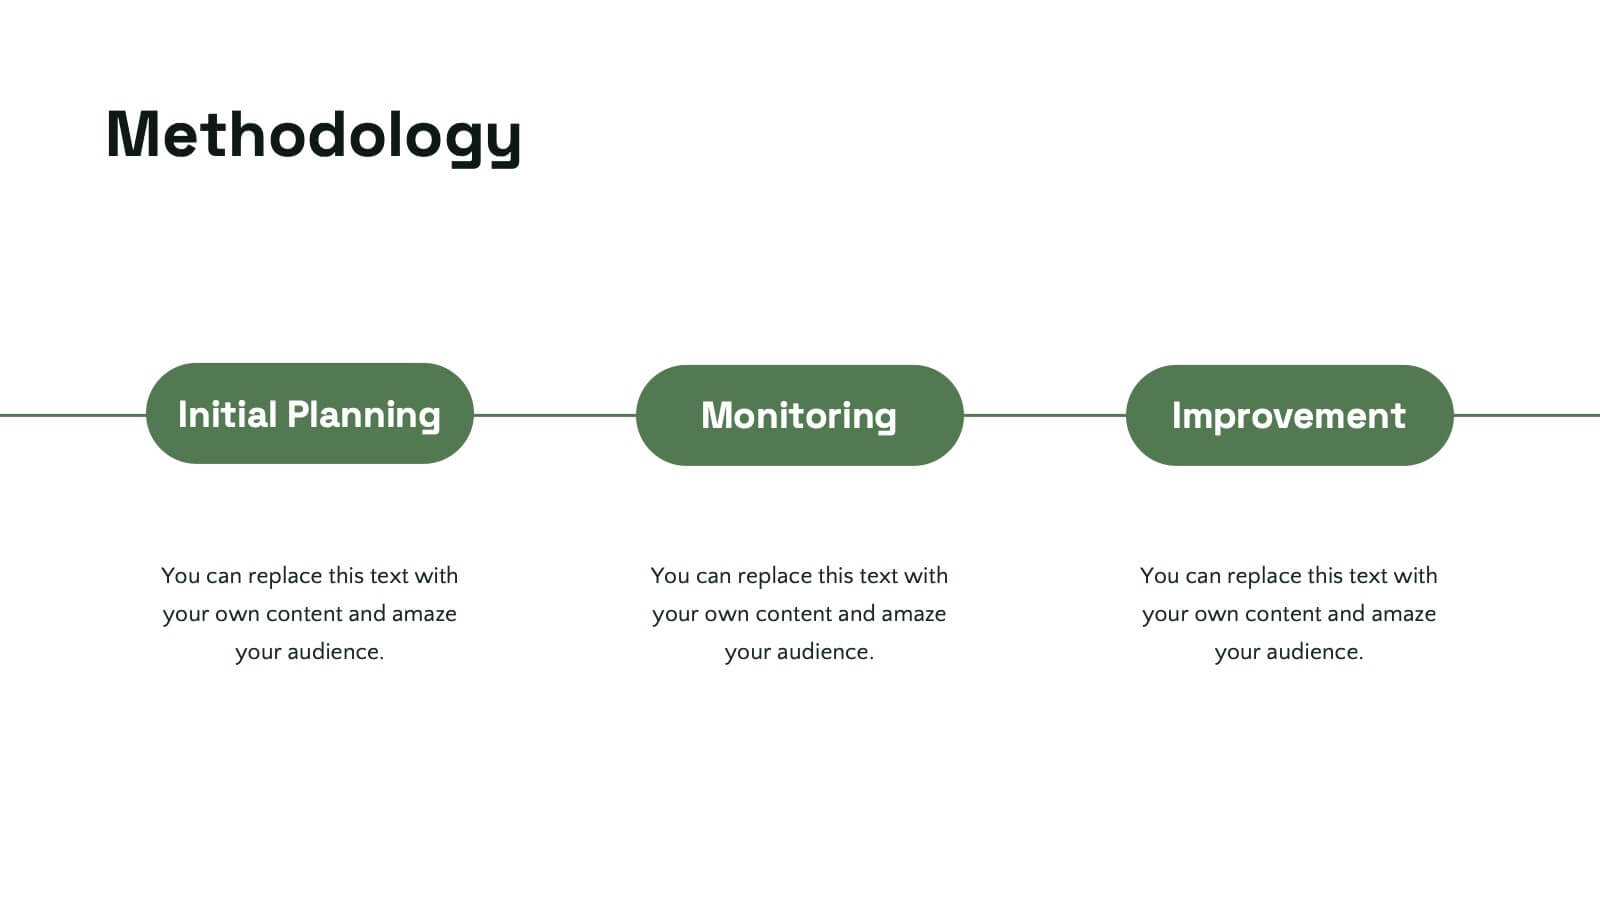
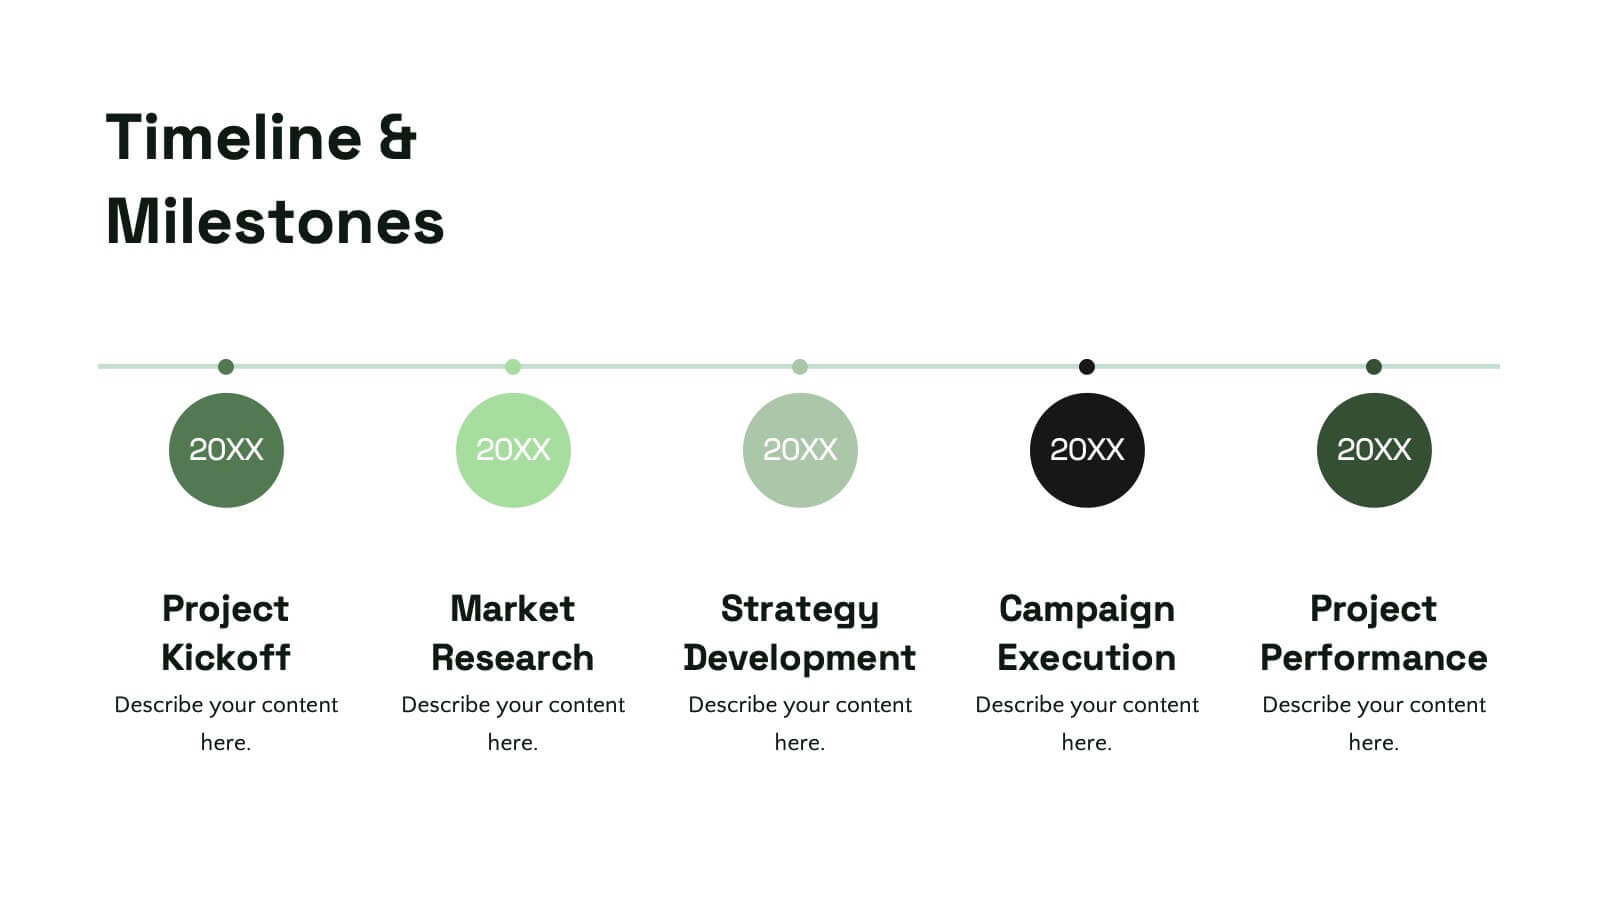
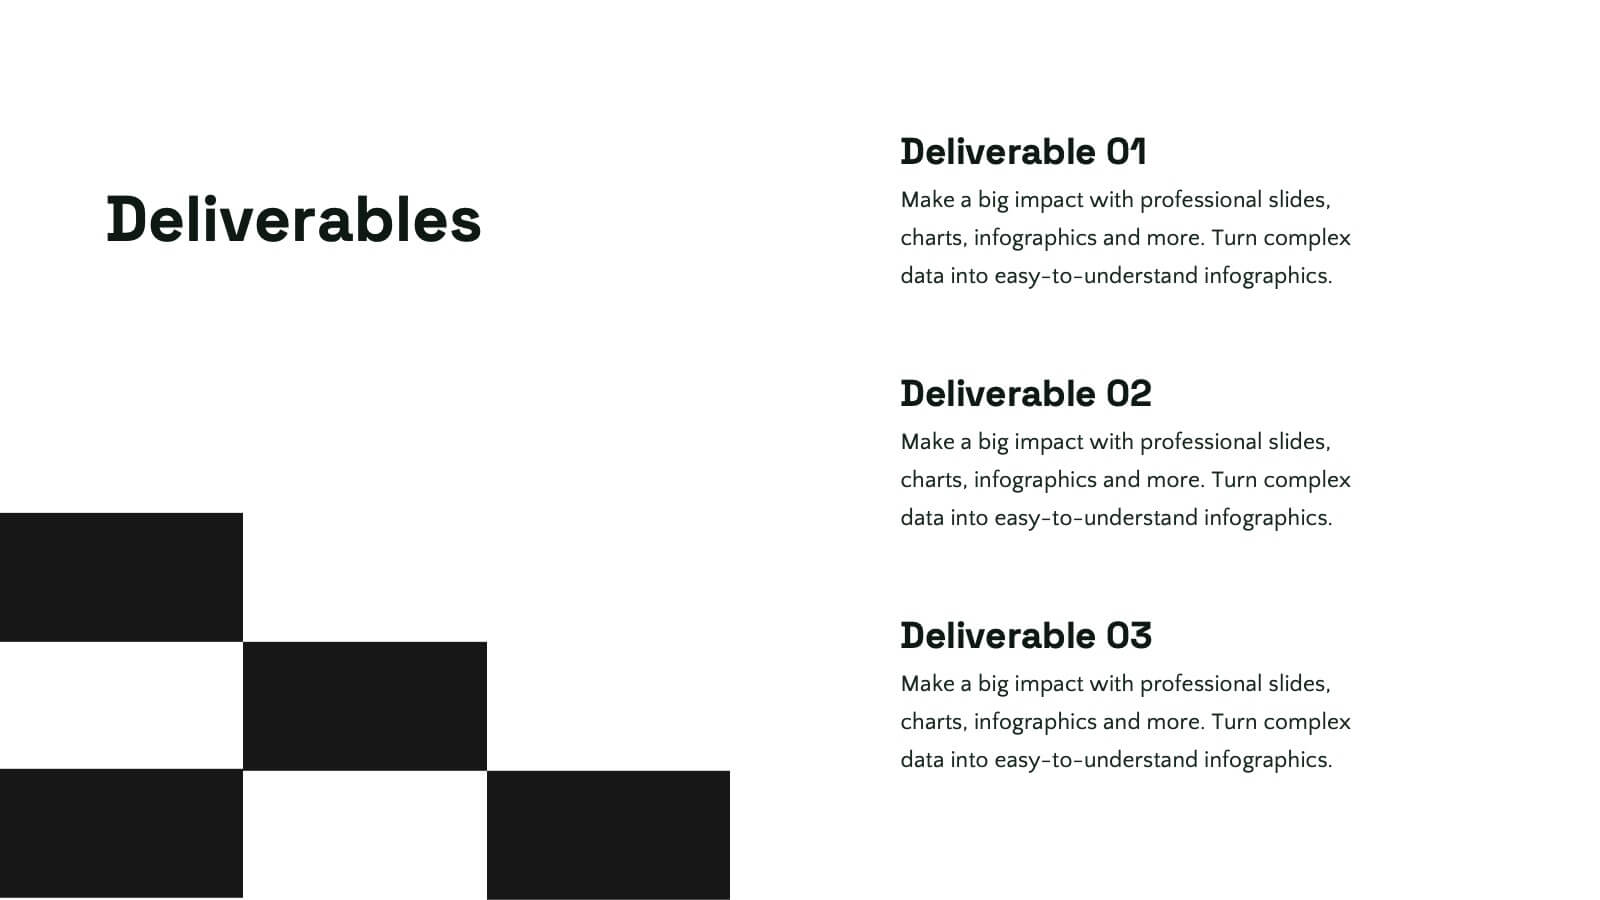
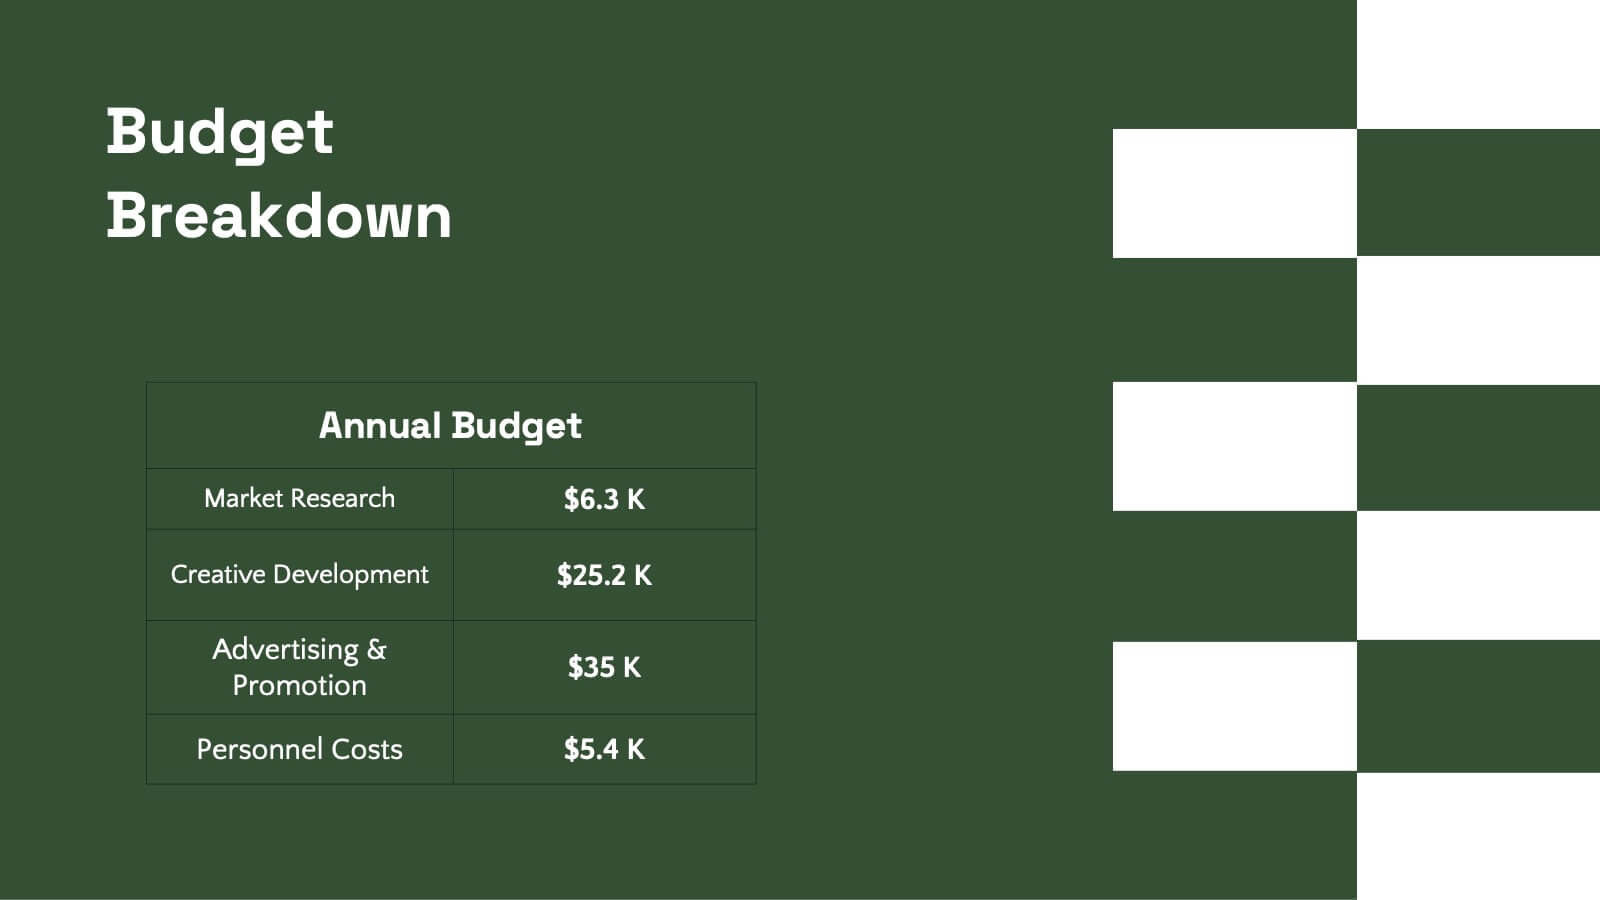
Elevate your pitch with this sleek design proposal template! Perfect for presenting project details, objectives, methodology, and milestones, it ensures your ideas stand out. Impress stakeholders with clear, structured slides and professional aesthetics. Compatible with PowerPoint, Keynote, and Google Slides for a seamless presentation experience across all platforms.


6 slides
Future of Automation with AI Tools
Showcase the future of innovation with the Emerging AI Applications in Business Presentation. This sleek, modern slide layout features a profile-tech illustration alongside four vertically stacked AI-themed icons—perfect for highlighting machine learning, data analytics, automation, and cloud integration. Ideal for AI startups, corporate pitches, and innovation strategy talks. Fully editable in PowerPoint, Keynote, and Google Slides.


7 slides
Customer Success Journey Infographic
A customer journey infographic is a visual representation of your customer's experience with your company. It can help you gain insight into where they're struggling and how they feel about your product or service. This infographic template will help you understand the top factors that influence your customers' decisions, including the most common problems they face. With this template you'll also learn how their behaviors change over time—and how to structure marketing campaigns that stay with them throughout their journey. Fully customizable and compatible with Powerpoint, Keynote, and Google Slides.


7 slides
E-Learning Solutions Infographic
Elevate the e-learning experience with our E-Learning infographic. Featuring a harmonious blend of serene purple and crisp white, this infographic encapsulates the transformative world of digital learning. Tailored for educators, e-learning consultants, and instructional designers, it vividly illustrates the nuances of online education. Incorporated within are ingenious graphics, relevant icons, and dedicated image placeholders, all set to anchor your content and enhance comprehension. Regardless of your preferred platform – PowerPoint, Keynote, or Google Slides – this template is your tool to effectively convey the dynamism of e-learning.


5 slides
Company Vision and Operations Overview Presentation
Present your company’s mission and structure with this Company Vision and Operations Overview Presentation. Designed around a central eye graphic, it highlights four strategic pillars or core values. Ideal for executive summaries, leadership decks, or internal briefings. Fully editable in Canva, PowerPoint, or Google Slides.


6 slides
Framework Architect Infographics
Explore the role of a Framework Architect with our customizable infographic template. This template is fully compatible with popular presentation software like PowerPoint, Keynote, and Google Slides, allowing you to easily customize it to illustrate and communicate the responsibilities and key aspects of a Framework Architect's role. The Framework Architect infographic template offers a visually engaging platform to define and explain the responsibilities, skills, and contributions of a Framework Architect within the field of software development or architecture. Whether you're a software architect, IT professional, or simply interested in understanding this role, this template provides a user-friendly canvas to create informative presentations and educational materials. Deepen your understanding of the Framework Architect role with this SEO-optimized infographic template, thoughtfully designed for clarity and ease of use. Customize it to highlight key responsibilities, architectural frameworks, collaboration methods, and the importance of this role in software development projects. Ensure that your audience gains valuable insights into the world of Framework Architecture. Start crafting your personalized infographic today to explore the role of a Framework Architect in greater depth.


5 slides
Step-by-Step Flow Diagram Presentation
Bring clarity to every stage of your process with a clean, easy-to-follow visual path that guides your audience step by step. This presentation helps simplify workflows, instructions, and project milestones in a structured, approachable layout. Fully compatible with PowerPoint, Keynote, and Google Slides.