


Features
- 6 Unique slides
- Fully editable and easy to edit in Microsoft Powerpoint, Keynote and Google Slides
- 16:9 widescreen layout
- Clean and professional designs
- Export to JPG, PDF or send by email


Do you have any questions?
Recommend


7 slides
Operational Workflow Chart Presentation
Turn complex operations into clear, engaging visuals with this clean, structured presentation design. Ideal for outlining procedures, systems, or process improvements, it helps your audience easily follow each stage from start to finish. Fully customizable and compatible with PowerPoint, Keynote, and Google Slides for effortless editing and professional results.


12 slides
Employee Feedback Smile Score Presentation
Track employee sentiment with this engaging employee feedback smile score template! Featuring a visually intuitive gauge design, this layout helps HR teams and managers assess workplace satisfaction and identify areas for improvement. Ideal for performance reviews, team surveys, and organizational assessments. Fully customizable and compatible with PowerPoint, Keynote, and Google Slides.


4 slides
Simple RACI Matrix Overview Presentation
Bring instant clarity to every role with a clean, puzzle-style layout designed to map responsibilities without confusion. This presentation helps teams outline who leads, supports, approves, and stays informed in any project, turning tasks into a simple visual grid. Fully editable and compatible with PowerPoint, Keynote, and Google Slides.


7 slides
Responsibility Assignment Matrix Project Infographic
A Responsibility Assignment Matrix, is a project management tool that helps in defining and organizing the roles and responsibilities of team members regarding different tasks or activities within a project. This infographic template is a bold, dynamic tool designed to empower your projects. This template lays out roles and responsibilities clearly, ensuring every project aspect is orchestrated with precision and clarity. Fully customizable and compatible with Powerpoint, Keynote, and Google Slides. Let the roles and responsibilities be your project's guiding stars, ensuring a smooth sail towards success.


5 slides
Wedding Ceremony Program Infographics
Wedding Ceremony infographics are visual representations that provide essential information and details about a wedding ceremony. These vertical infographics feature eye catching designs that will help you present a unique and memorable wedding ceremony program. This template is perfect for couples, wedding planners, or event organizers looking to present the order of events and important details in a visually engaging way. These infographics are designed using elegant and romantic elements, such as delicate illustrations, floral motifs, and soft color palettes, creating a charming and visually cohesive look.


5 slides
Comparison Table for Feature Mapping Presentation
Compare your product features with ease using this Comparison Table for Feature Mapping presentation. Ideal for highlighting similarities and differences across multiple offerings, this layout uses clean visuals and color-coded elements to show feature availability per product. Perfect for product teams, marketing, or internal decision-making. Compatible with PowerPoint, Canva, and Google Slides.


12 slides
Corporate Governance Strategy Presentation
Optimize your company's strategic direction with our Corporate Governance Strategy template. Designed to showcase the critical components of effective governance, this template is perfect for illustrating clear governance frameworks within PowerPoint, Keynote, and Google Slides. Ideal for corporate leaders aiming to enhance transparency, accountability, and organizational alignment, this template serves as an essential tool for fostering strong corporate governance practices.


7 slides
Editable List Slide Presentation
Organize your ideas with style and simplicity using this clean, structured layout designed for clarity and impact. Ideal for summarizing key points, checklists, or action plans, it keeps your content professional and easy to follow. Fully customizable and compatible with PowerPoint, Keynote, and Google Slides for seamless presentation design.


10 slides
SEO and Social Media Marketing Presentation
Shine a spotlight on your brand’s digital growth with this bold and professional layout designed to showcase analytics, engagement, and SEO strategies. Ideal for marketers, strategists, and agencies, it transforms data into visuals that persuade and inform. Fully compatible with PowerPoint, Keynote, and Google Slides for easy editing.


7 slides
Urban Ecology Illustrated Infographics
Ecology is the scientific study of the interactions between organisms and their environment. This ecology template will help you explain the science behind our world. This is great for anyone who is presenting information about ecology, environment, or sustainability. You can use this infographic as is or customize it by changing the colors and fonts of each slide. You can also add your own images, and text by downloading in Powerpoint, Keynote, or Google Slides. This Template comes with a wealth of key facts and figures on eco-friendly living and presents them in an infographic style.


26 slides
Martin Luther King Jr. Day Presentation Template
Celebrate the legacy of a visionary leader with this thoughtful and engaging presentation template. Perfectly designed for educational and commemorative purposes, this template highlights impactful moments, significant achievements, and inspirational quotes. With customizable slides, you can showcase timelines, infographics, and statistics to create a meaningful narrative. Easily incorporate multimedia and text to engage your audience and honor the history being celebrated. Compatible with PowerPoint, Google Slides, and Keynote, this template is accessible and easy to customize. Share the values of equality, justice, and perseverance with this visually compelling design.


4 slides
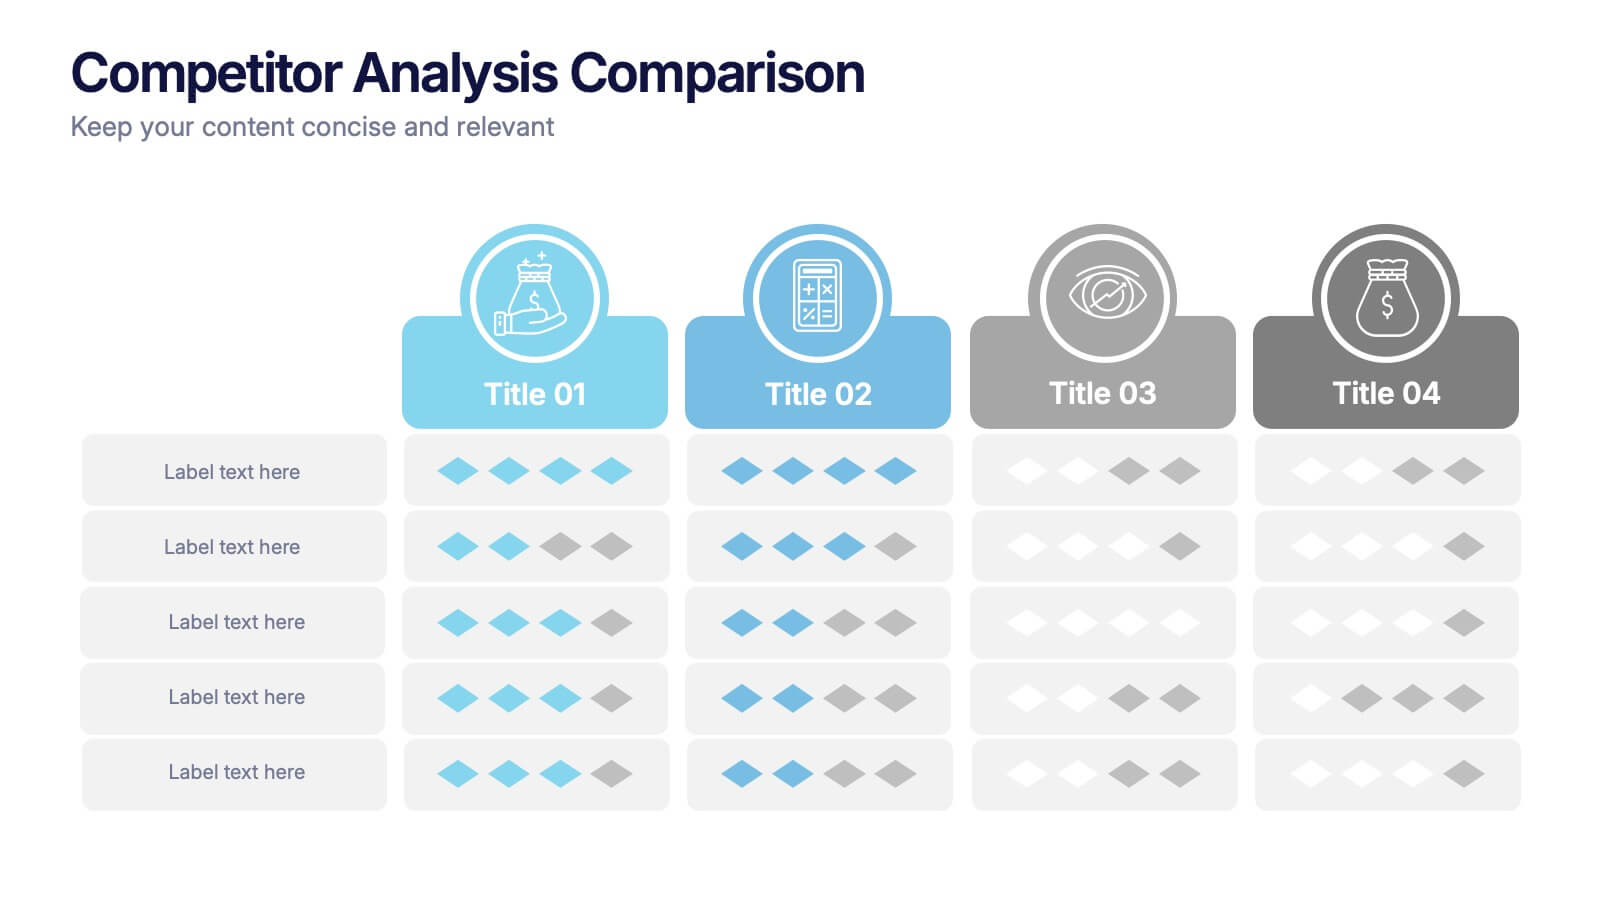
Competitor Analysis Comparison Presentation
Quickly evaluate strengths and weaknesses across your market landscape with this Competitor Analysis Comparison Presentation. Featuring clean tables, icons, and rating visuals, it's ideal for highlighting where your brand stands out. Fully editable in PowerPoint, Keynote, and Google Slides.


6 slides
Financial Forecasting and Numerical Analysis Presentation
Visualize your financial insights with clarity using this clean and modern bar chart template. Designed for presenting financial projections, budget analysis, and performance metrics, this slide breaks down six key categories for easy comparison. Ideal for financial reviews, business updates, or investment pitches. Fully editable in PowerPoint, Keynote, and Google Slides.


5 slides
Data-Driven Business Statistics
Visualize insights and percentages with this dynamic, data-driven infographic layout. Ideal for illustrating business progress, KPIs, and performance highlights. This editable template is fully compatible with PowerPoint, Keynote, and Google Slides, allowing you to tailor it effortlessly to fit your corporate style and messaging.


8 slides
Company Achievements Year in Review Presentation
Highlight milestones with impact using the Company Achievements Year in Review Presentation. This dynamic slide uses a multi-layered, pyramid-style layout to showcase your organization’s key wins, progress, and stats throughout the year. Perfect for internal reviews, investor decks, or annual reports. Fully editable and compatible with PowerPoint, Keynote, and Google Slides.


7 slides
Security Infographic Presentation Template
Security is the key to protecting your information and the future of your business. Security is the ability to defend a position and data from threats. This presentation template is a great way to show how important security is for your businesses. This includes physical security and digital security. With this template show how a strong security strategy is essential. Your first priority as a business owner should be the safety and security of your workplace. This template features the perfect security illustrations you need to get your point across when displaying this presentation.


4 slides
Data Science and AI Big Data
Visualize the core relationship between AI, data science, and analytics using this interconnected circular diagram. Ideal for tech professionals, researchers, and AI educators to explain data-driven processes clearly. Fully editable in PowerPoint, Keynote, and Google Slides for seamless customization.