


Features
- 7 Unique slides
- Fully editable and easy to edit in Microsoft Powerpoint, Keynote and Google Slides
- 16:9 widescreen layout
- Clean and professional designs
- Export to JPG, PDF or send by email


Do you have any questions?
Recommend


26 slides
Salus Rebranding Project Plan Presentation
This rebranding project plan template offers a clear framework for presenting brand identity transformation. Covering brand values, identity components, target audience, positioning, and guidelines, it’s ideal for companies refreshing their brand. Compatible with PowerPoint, Keynote, and Google Slides, it ensures a streamlined, professional presentation of your rebranding strategy.


9 slides
Sales Pitch Proposal Presentation
Win over your prospects with our Sales Pitch Proposal presentation template, crafted to highlight the strengths of your product or service compellingly and convincingly. The template opens with a bold title slide, immediately capturing attention, followed by a well-organized agenda that outlines the flow of your pitch. Dive into the 'Problem' slide to articulate the challenges your target audience faces, followed by the 'Solution - Steps' slide where you can break down how your offering addresses these challenges in phases. Showcase the 'Key Features' of your product, highlighting the unique benefits that set you apart from the competition. The 'Target Audience' slide allows you to visually represent the demographics of your ideal customer, making your proposal more relatable. The 'Pricing' slide is neatly designed for a clear display of your pricing tiers, ensuring transparency. Conclude with a 'Thank You' slide that leaves a lasting impression and a 'Credits' slide for due diligence. This template is adaptable for PowerPoint, Keynote, and Google Slides, ensuring a seamless presentation experience.


20 slides
Onyx Project Proposal Presentation
This sleek, modern project proposal template is designed for clarity and impact. Featuring sections like objectives, scope of work, pricing structure, and client testimonials, it’s ideal for presenting detailed proposals to stakeholders. Perfectly compatible with PowerPoint, Keynote, and Google Slides, it ensures a professional presentation that impresses every time!


7 slides
Tables of Content Samples Infographic Presentation
A Table of Content is an essential tool that improves the accessibility and organization of a document or book, and enhances its overall professionalism. This table of contents template is an excellent way to organize your information. This template is fully editable, which allows you to easily change colors and fonts, and add or delete components from the design. The slides are designed to be easily updated with new information, allowing you to keep the presentation fresh and up-to-date. Each template has a high quality design that is compatible with powerpoint, Keynote and Google Slides.


8 slides
Puzzle Piece Strategy Connection Presentation
Align your ideas with clarity using the Puzzle Piece Strategy Connection Presentation. This vertical puzzle layout visually connects four key steps, making it perfect for illustrating strategy alignment, workflow processes, or integrated systems. Easily editable in PowerPoint, Canva, or Google Slides—ideal for team briefings or strategic roadmaps.


7 slides
SCRUM Infographic Presentation Template
A SCRUM infographic is an Agile methodology for software development. The goal of this infographic template is to provide a clear and easy-to-understand overview of the key principles and practices of scrum, such as the roles, events, and artifacts used in the process. This template can be used as a reference for team members, as a teaching tool for new scrum practitioners, or as a way to communicate scrum to stakeholders. Our well-designed scrum infographic can help you and your audience quickly understand the basics of the framework, as well as its benefits, applications, and best practices.


6 slides
Central Idea Spider Layout Presentation
Bring your big idea to life with a sleek, organized layout that keeps every supporting point perfectly connected. This presentation is ideal for mapping strategies, goals, or project concepts in a clear, visual way. Fully customizable and compatible with PowerPoint, Keynote, and Google Slides for effortless editing.


4 slides
Emerging AI Applications in Business
Showcase innovation with clarity using the Emerging AI Applications in Business Presentation. This sleek 4-step layout features modern icons and a profile-style AI illustration, perfect for outlining use cases such as automation, data insights, machine learning, or cloud-based AI solutions. Ideal for tech-driven strategy decks, startup pitches, or digital transformation briefings. Fully editable in PowerPoint, Keynote, and Google Slides.


6 slides
Training Center Infographic
A training center is a facility or institution dedicated to providing education, skills development, and training to individuals or groups in various fields. This infographic provides a visual overview of the training programs, courses, and facilities offered by a training center. This template highlights the key information that potential learners or clients need to know. This infographic is fully customizable and compatible with Powerpoint, Keynote, and Google Slides. Allowing you to ensure that the colors, fonts, and graphics used align with your training center's branding.


6 slides
Veterinary School Infographics
Explore the world of Veterinary School with our customizable infographic template. This template is fully compatible with popular presentation software like PowerPoint, Keynote, and Google Slides, allowing you to easily customize it to illustrate and communicate various aspects of veterinary education and training. The Veterinary School infographic template offers a visually engaging platform to outline the curriculum, admissions process, career prospects, and importance of veterinary education. Whether you're a veterinary student, educator, prospective applicant, or simply interested in animal healthcare, this template provides a user-friendly canvas to create informative presentations and educational materials. Enhance your understanding of Veterinary School with this SEO-optimized infographic template, thoughtfully designed for clarity and ease of use. Customize it to showcase admission requirements, core subjects, clinical training, and the impact of veterinary professionals on animal health and welfare. Ensure that your audience gains valuable insights into the world of veterinary education. Start crafting your personalized infographic today to explore the realm of Veterinary School.


6 slides
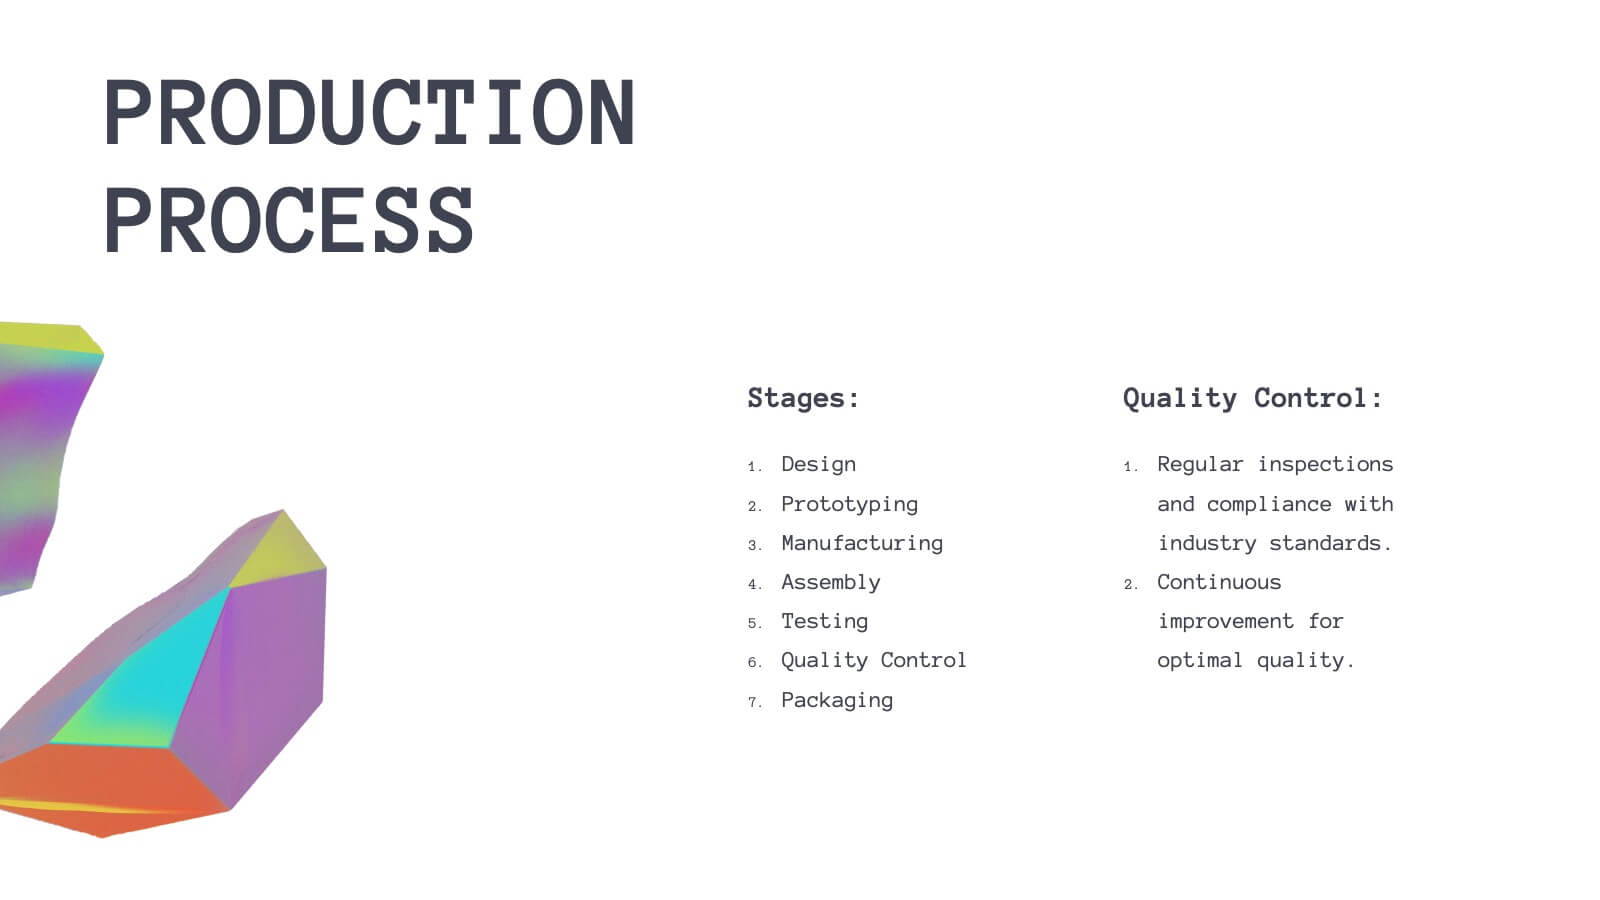
Product Development Cycles Presentation
A great product starts with a clear, engaging story—this presentation brings that journey to life. It outlines each stage of the development cycle in a simple, visual flow that helps teams communicate progress, milestones, and next steps. Perfect for strategy, planning, and updates. Fully compatible with PowerPoint, Keynote, and Google Slides.


6 slides
Product and Service Benefits Presentation
Highlight the unique value of your offerings with this Product and Service Benefits Presentation. Designed for clarity and impact, this visual layout allows you to break down six key features or advantages side-by-side. Perfect for product launches, sales decks, or service comparisons. Easily customizable in PowerPoint, Keynote, and Google Slides — ideal for marketers, sales teams, and consultants.
21 slides
Luster Product Roadmap Presentation
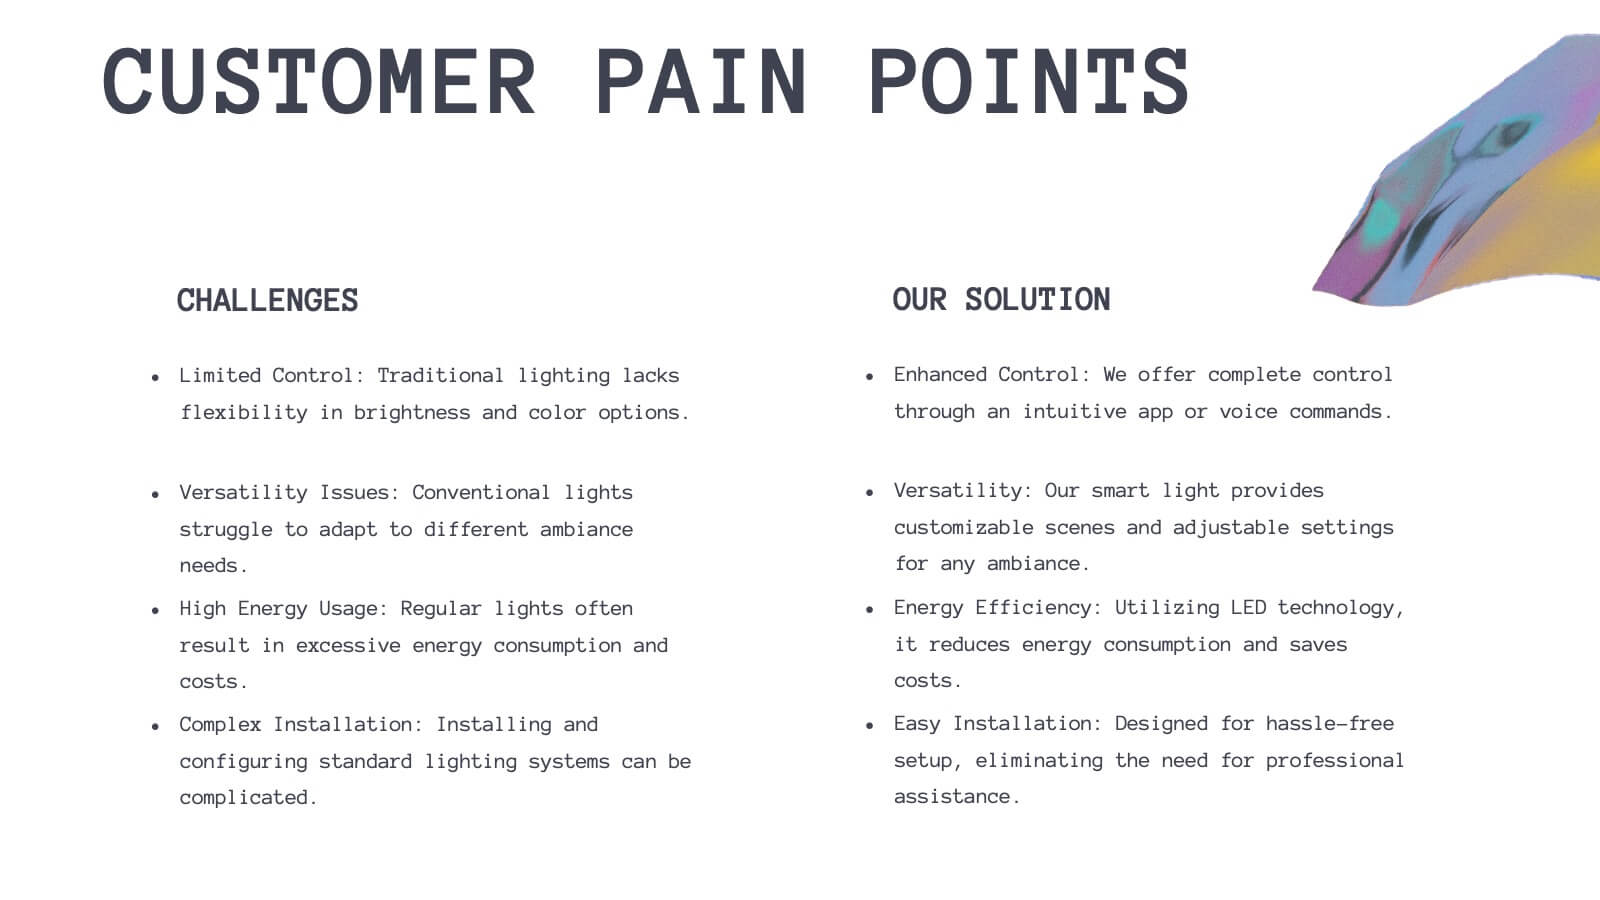
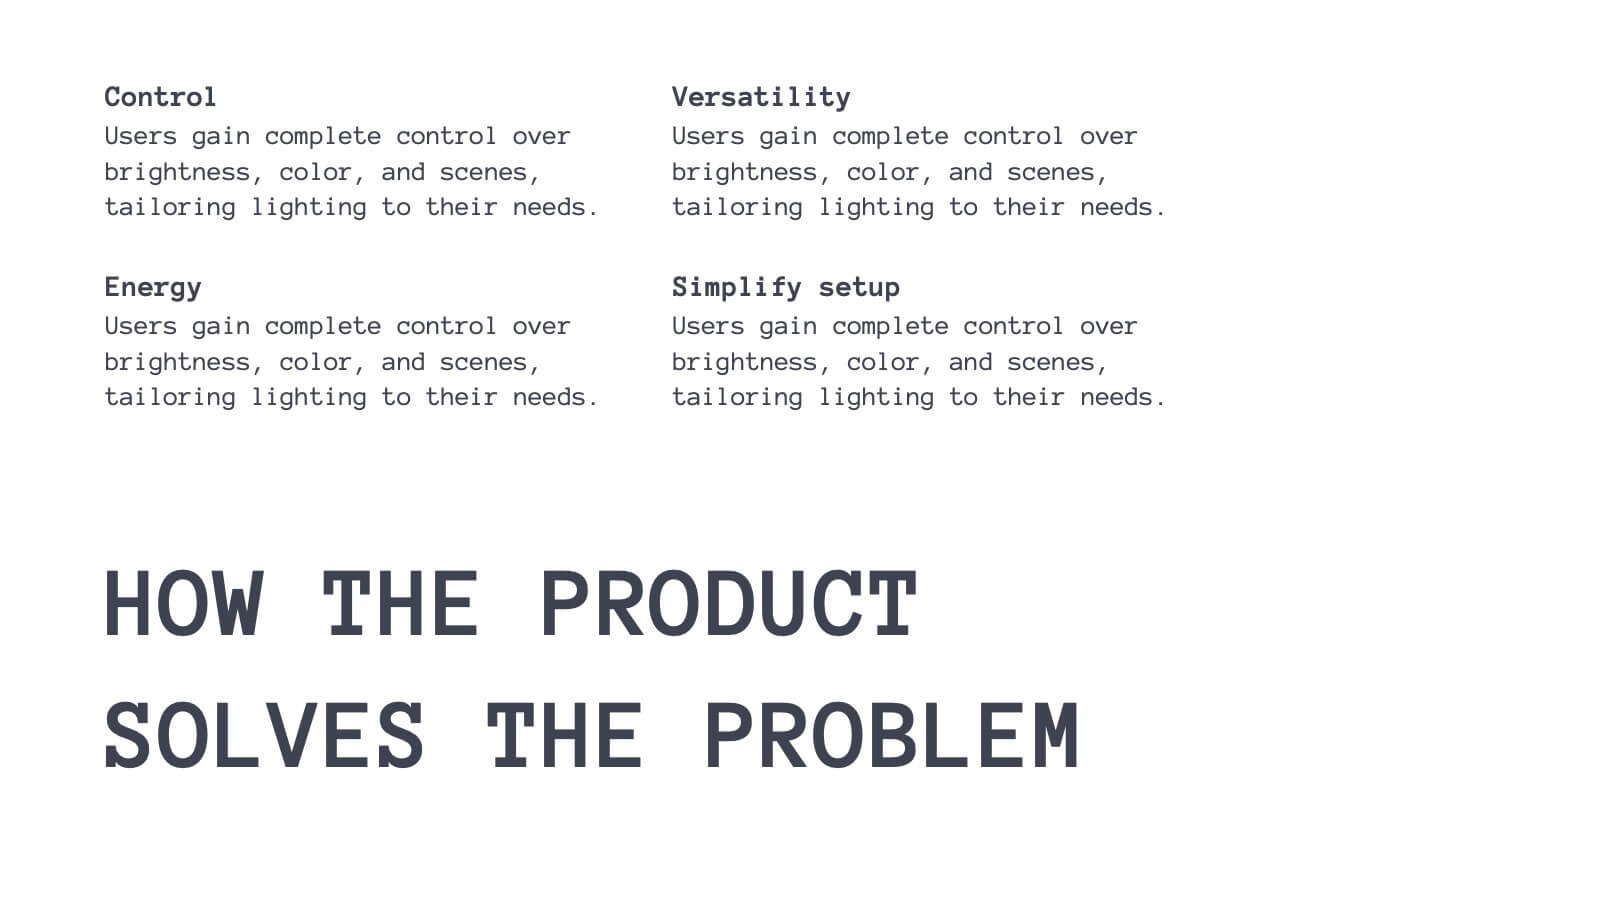
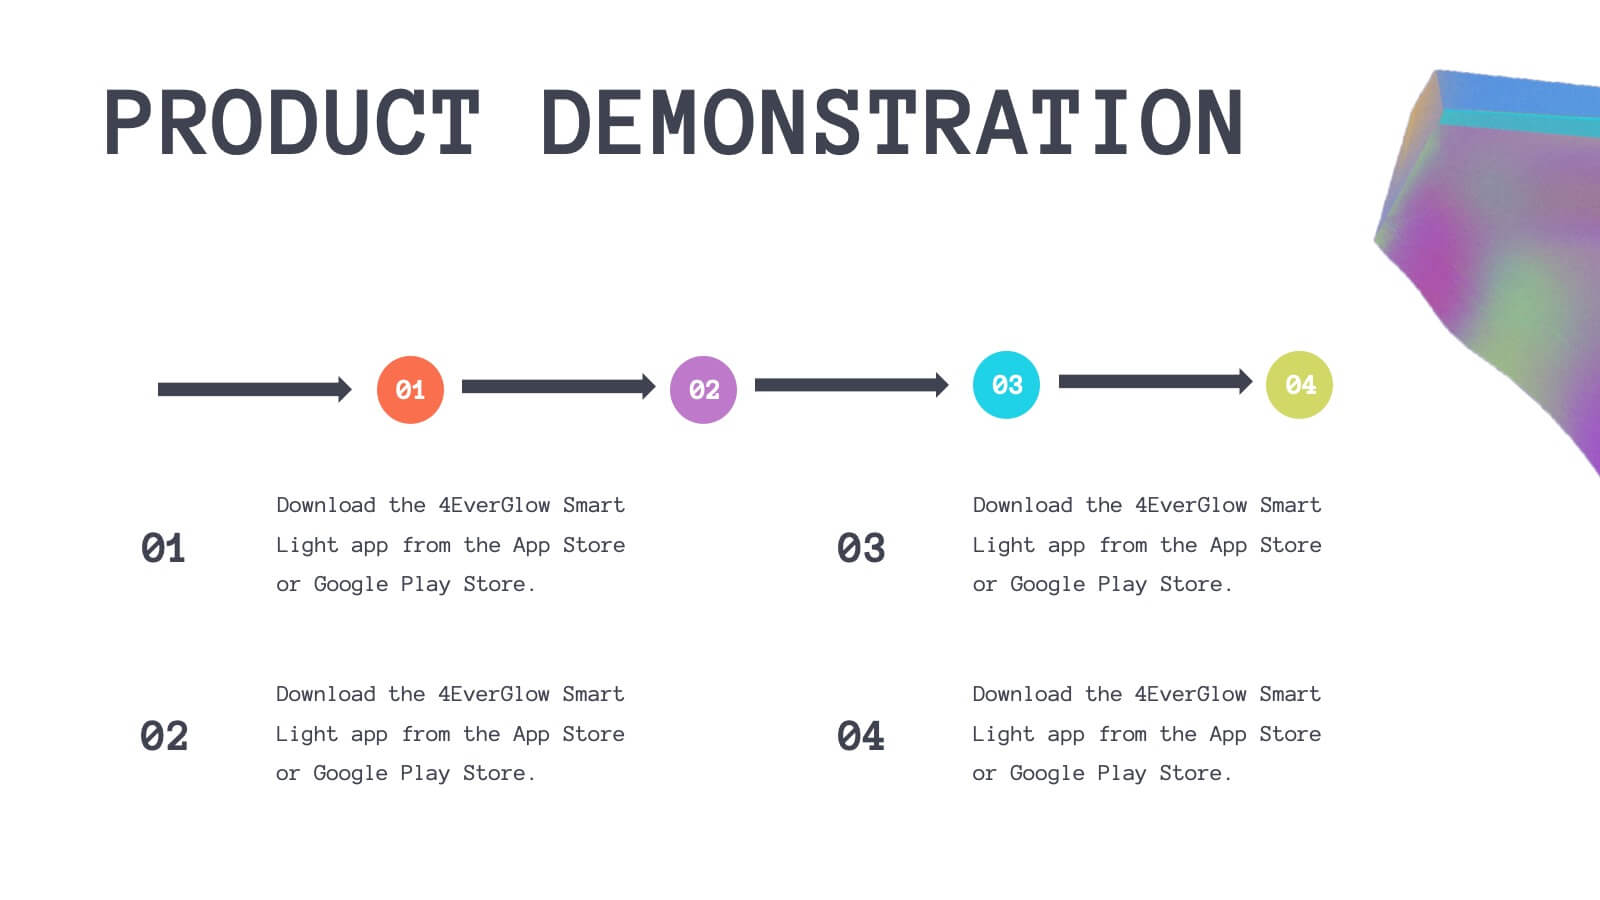
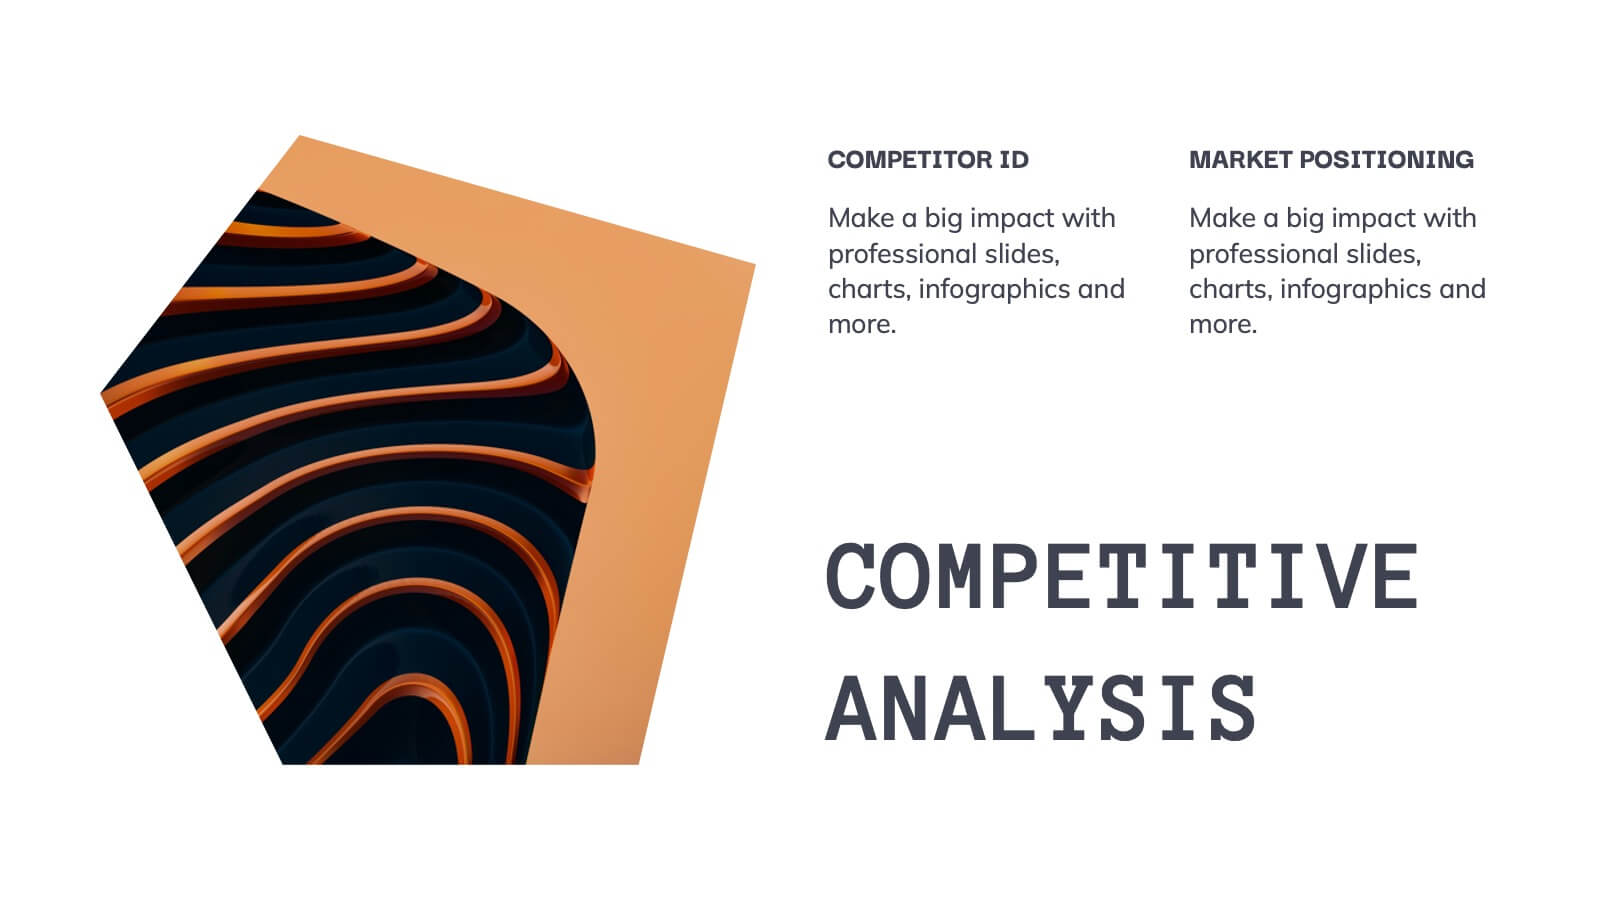
Bring your product journey to life with this vibrant, modern presentation template! Perfect for guiding your audience through product features, customer pain points, and competitive analysis, it’s designed for maximum clarity and engagement. Whether you’re showcasing technical specs or marketing strategies, this template fits all your needs. Compatible with PowerPoint, Keynote, and Google Slides.


4 slides
Team Alignment and Discussion Summary Presentation
Foster collaboration and keep everyone on the same page with the Team Alignment and Discussion Summary presentation. This template highlights discussion points, action items, and key takeaways alongside a professional image layout—perfect for recaps, team syncs, and leadership updates. Fully editable in PowerPoint, Keynote, and Google Slides.


26 slides
Mazen Presentation Template
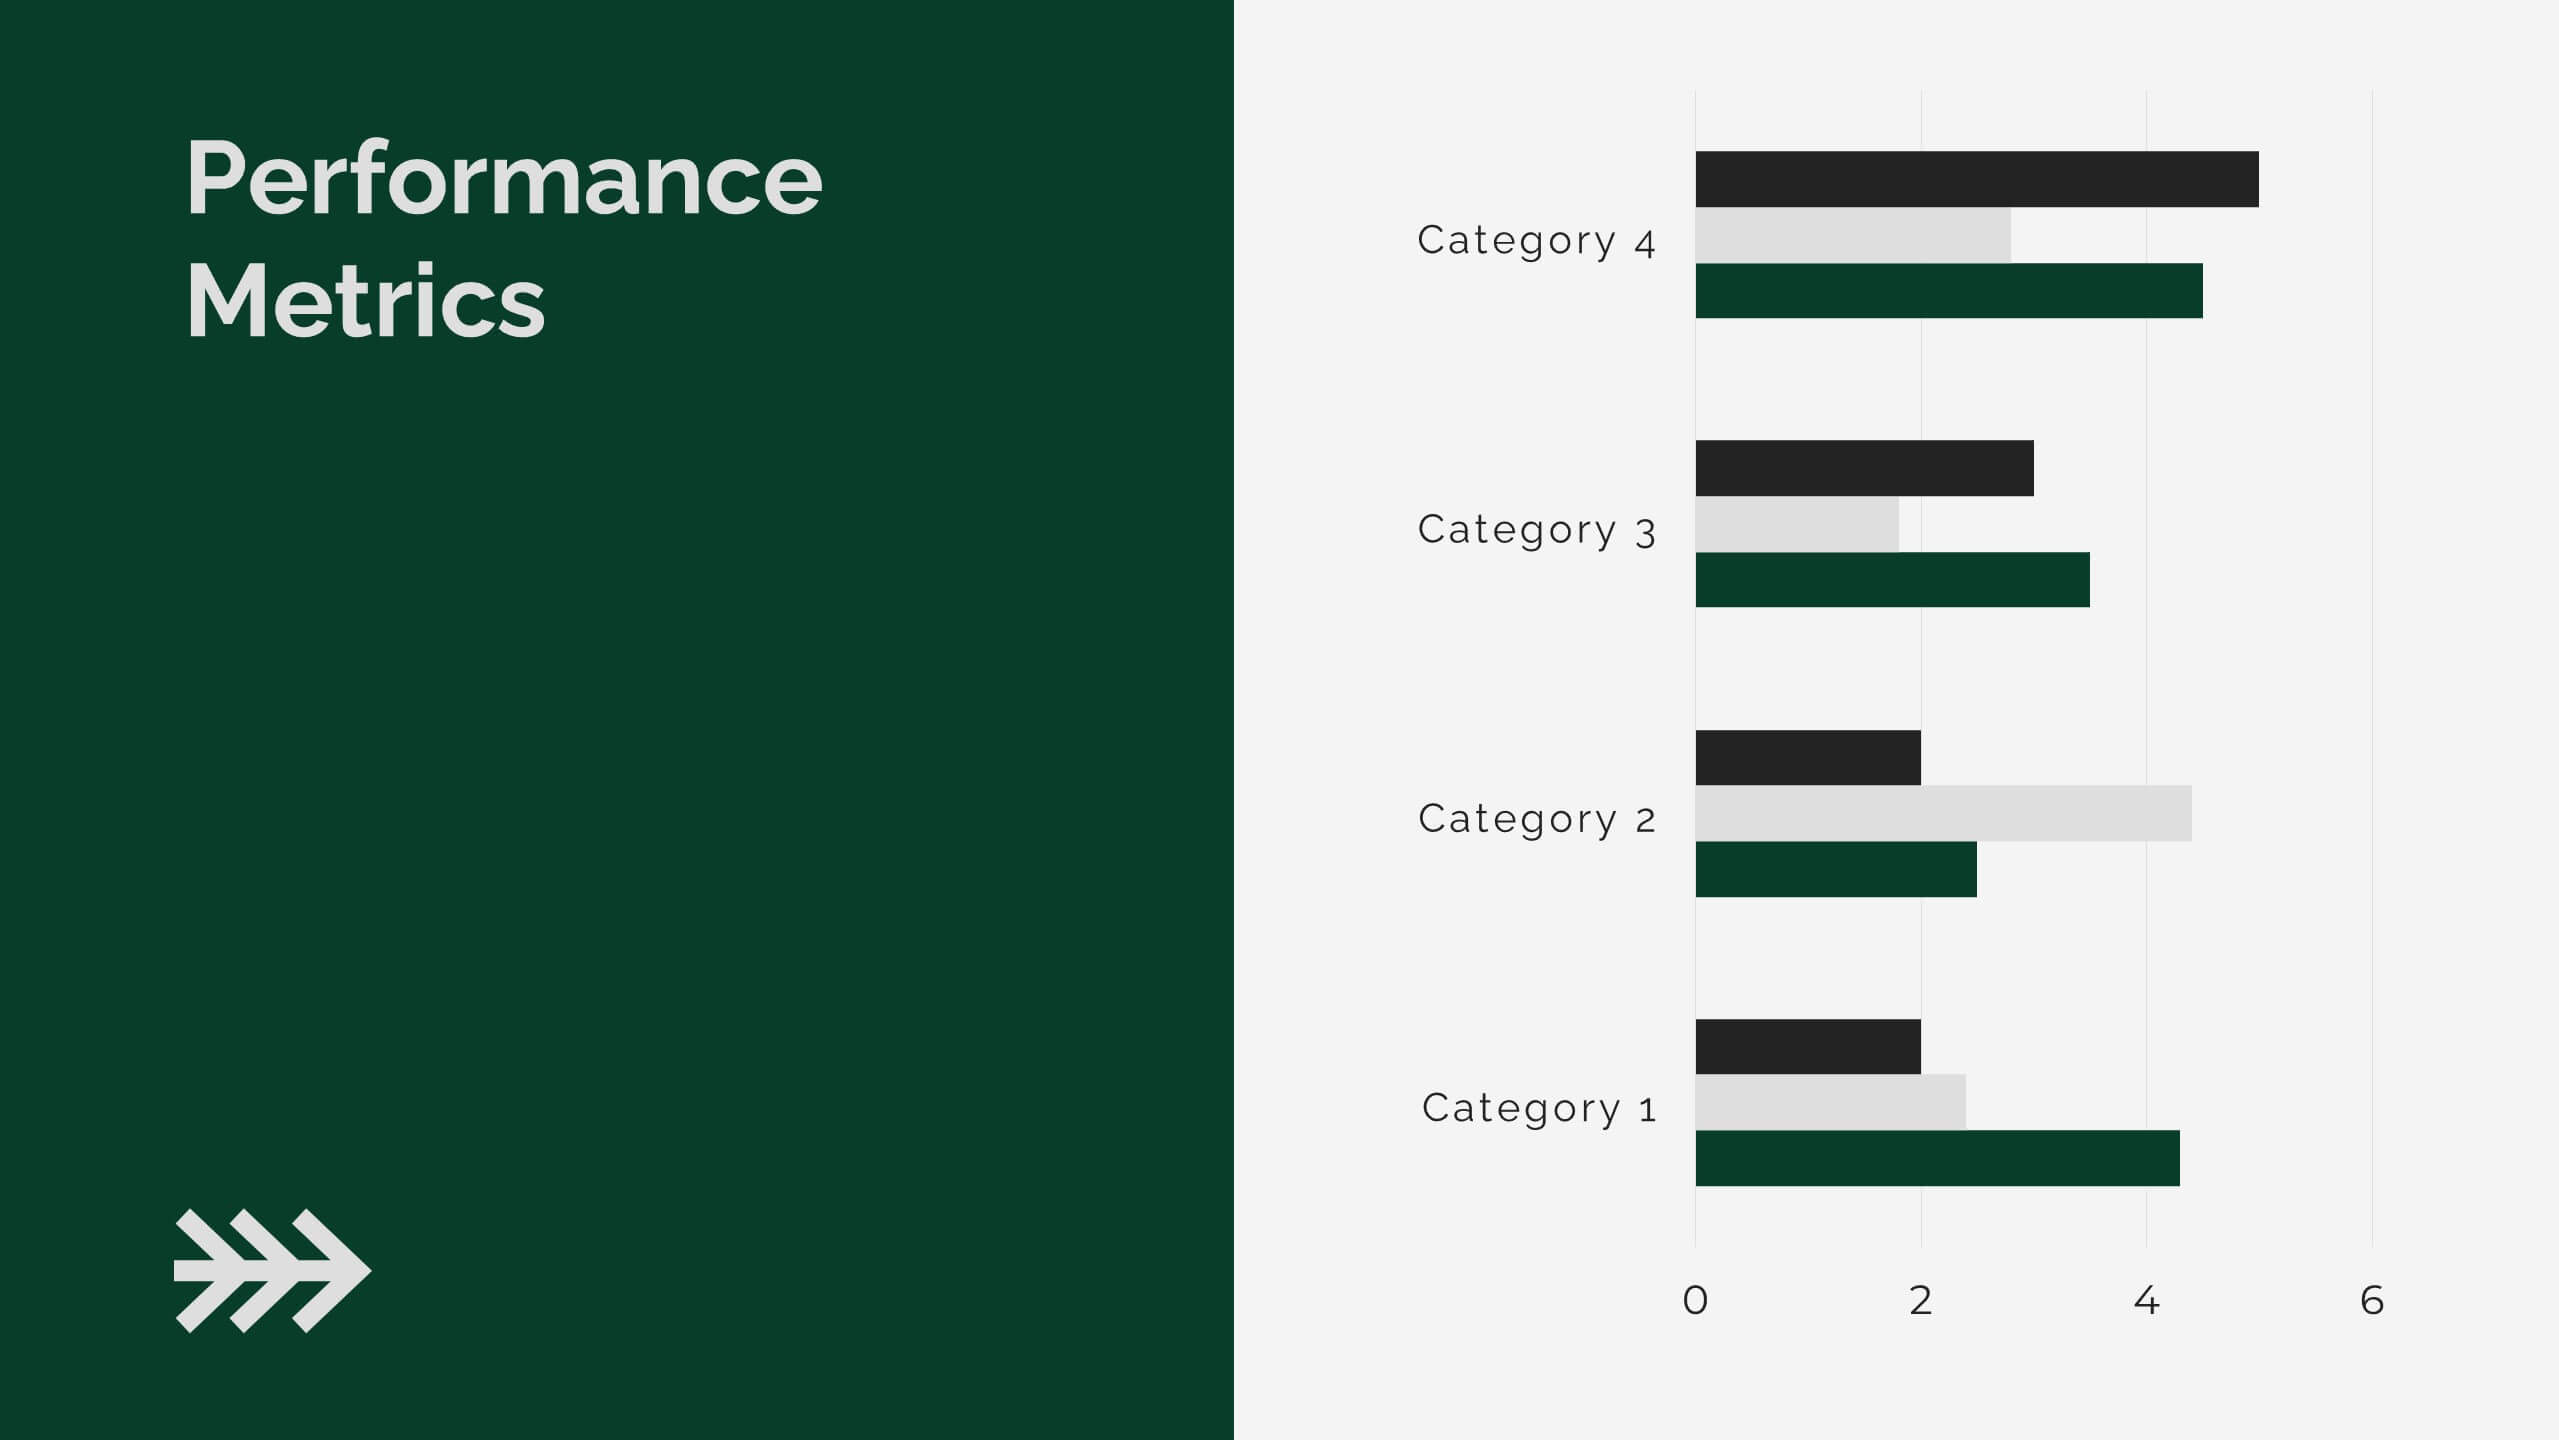
Mazen is a multi-purpose template that’s perfect for any business. The colors and layout are clean and chic, and it’s suitable for all types of businesses, from small business accounts to large corporate companies. It also has a hip aesthetic with nude warm tones, while pictures and charts are easy to edit and easy to read so users can easily understand the information in them. Easy to use, high quality and many features make this template suitable for all kinds of businesses. Pictures and charts are also made for easy editing as well as easy readability without too much confusion on reading.


12 slides
Compliance and Policy Management Presentation
Visualize your compliance ecosystem with the Compliance and Policy Management Presentation. Designed around a planetary orbit concept, this slide maps core policies at the center with surrounding regulations and enforcement layers. Each orbit can represent levels of governance, department roles, or regulatory zones—making it ideal for risk teams, auditors, and legal advisors. Fully customizable in PowerPoint, Keynote, and Google Slides for seamless use.


10 slides
Corporate Sustainability Goals Planning
Drive environmental impact with clarity using the Corporate Sustainability Goals Planning Presentation. This clean, circular infographic helps communicate sustainability initiatives, eco-objectives, and long-term strategy with ease. Perfect for ESG reports, internal goal tracking, or stakeholder updates. Fully editable in PowerPoint, Keynote, and Google Slides.