


Features
- 22 Unique Slides
- Fully editable and easy to edit in Microsoft Powerpoint, Keynote and Google Slides
- 16:9 widescreen layout
- Clean and professional designs
- Export to JPG, PDF or send by email


Do you have any questions?
Recommend


4 slides
RACI Matrix Roles and Responsibilities Presentation
Bring clarity to complex workflows with a vibrant, easy-to-follow layout designed to map roles, responsibilities, and decision-making at a glance. This presentation helps teams understand who leads, supports, approves, and informs across key tasks, making collaboration smoother. Fully editable and ready to use in PowerPoint, Keynote, and Google Slides.


21 slides
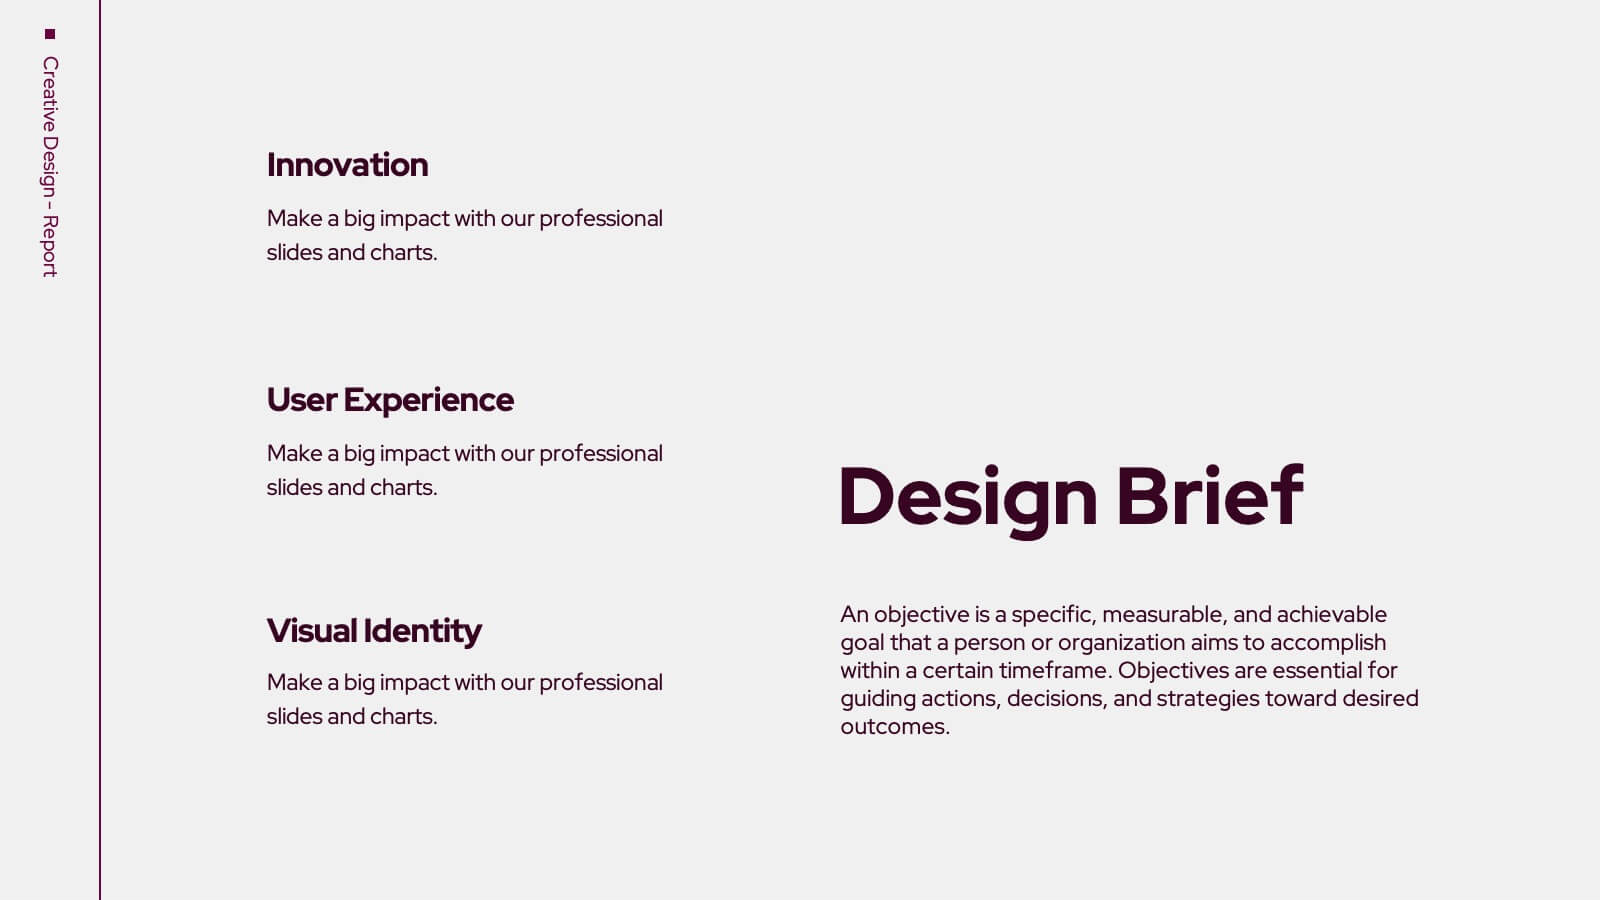
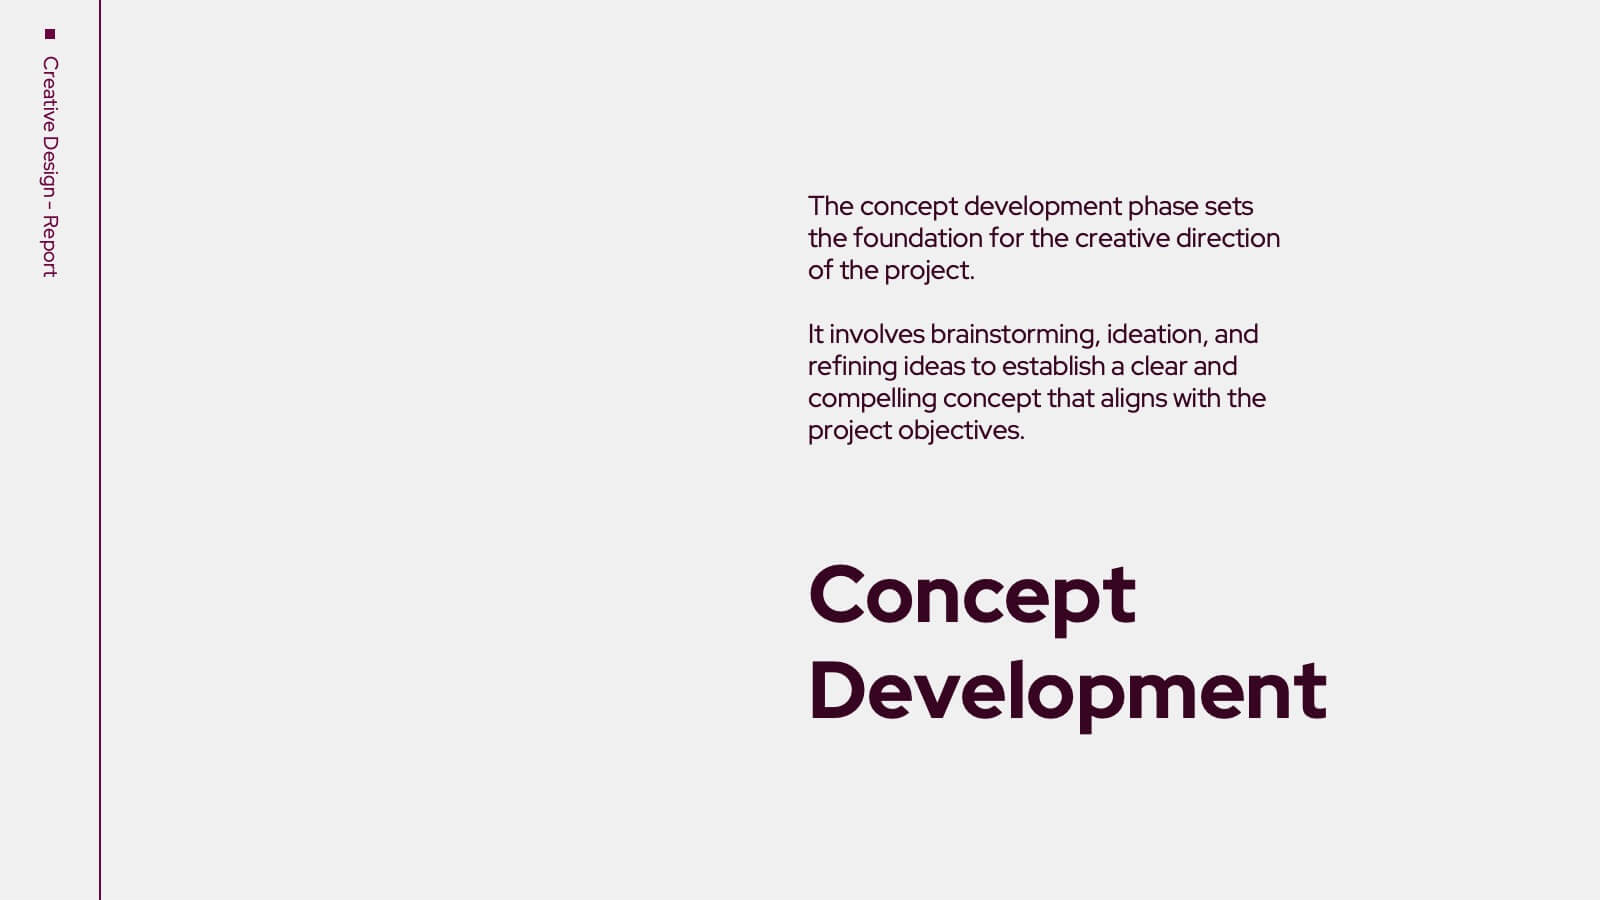
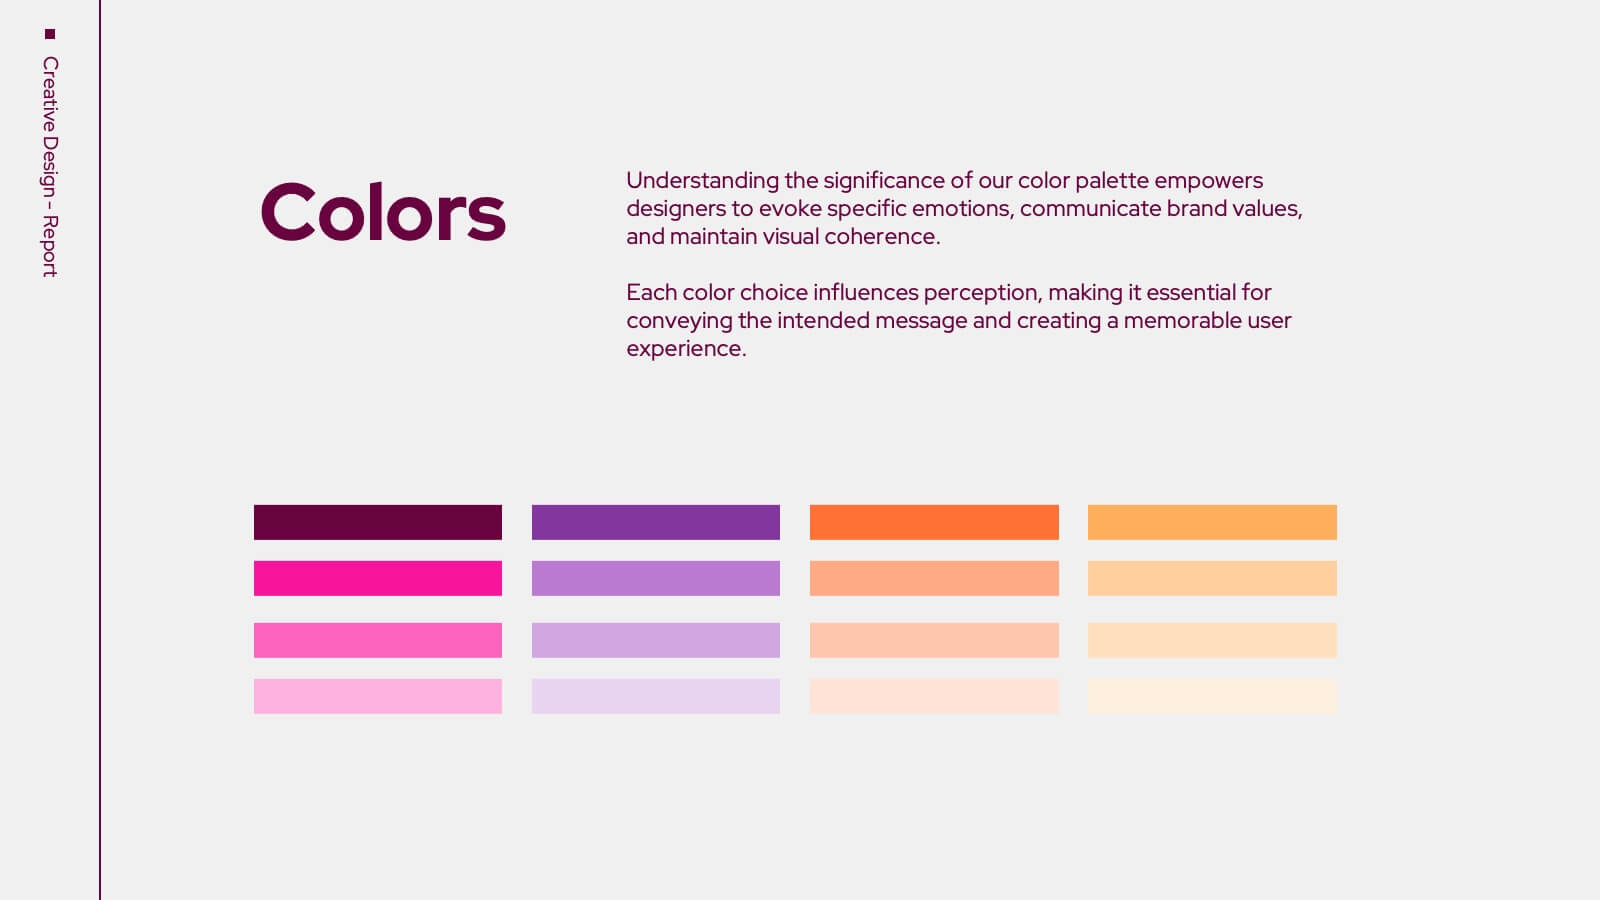
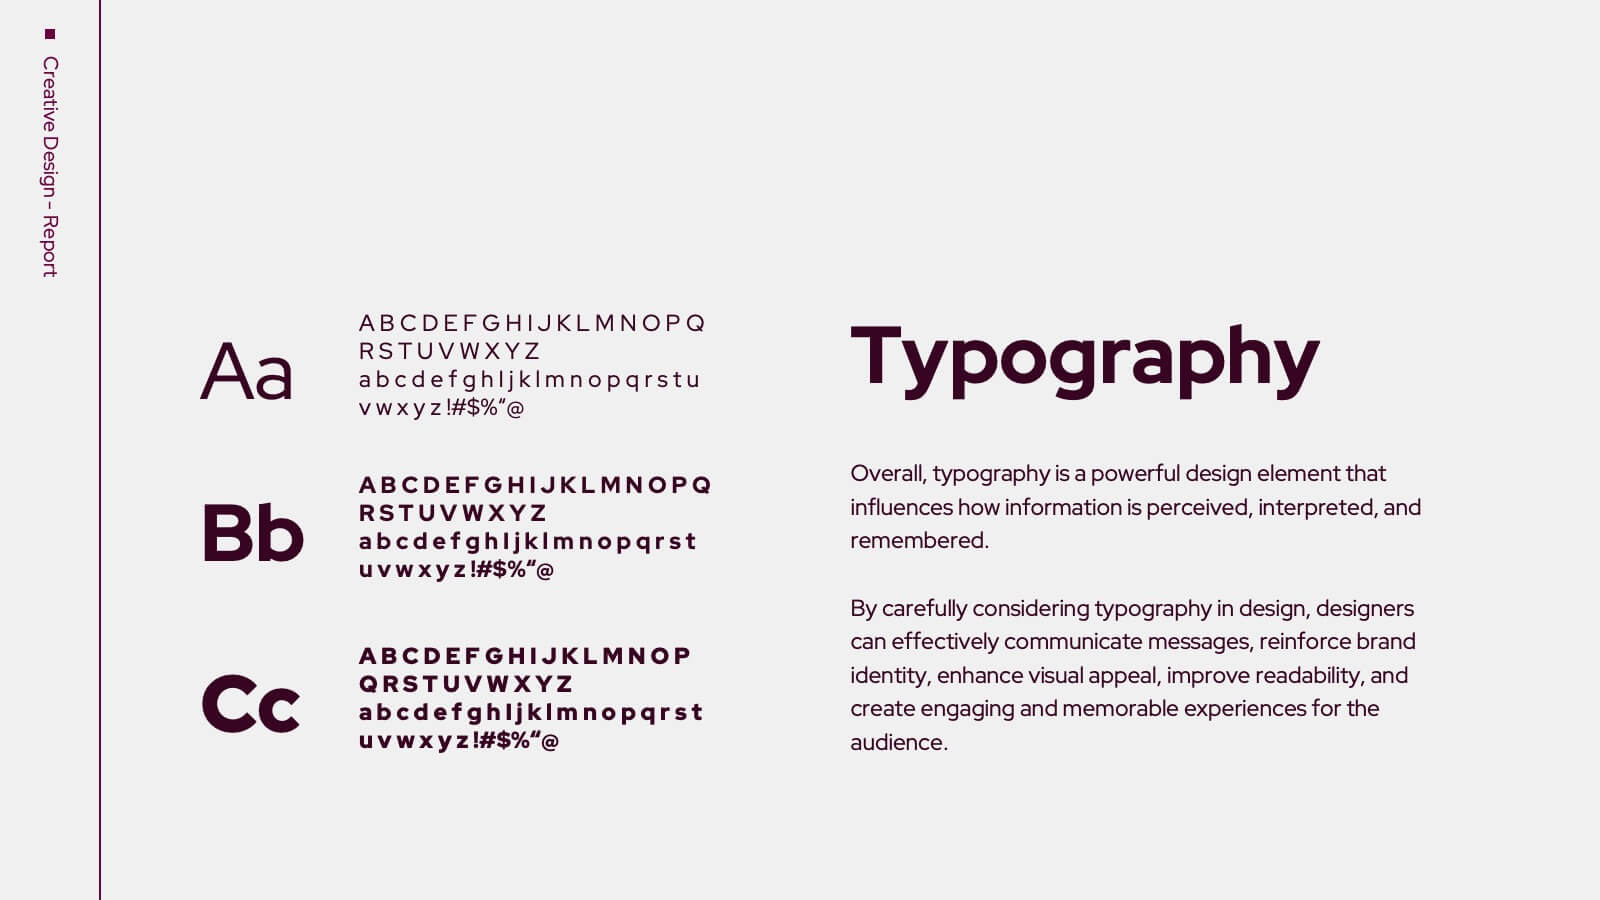
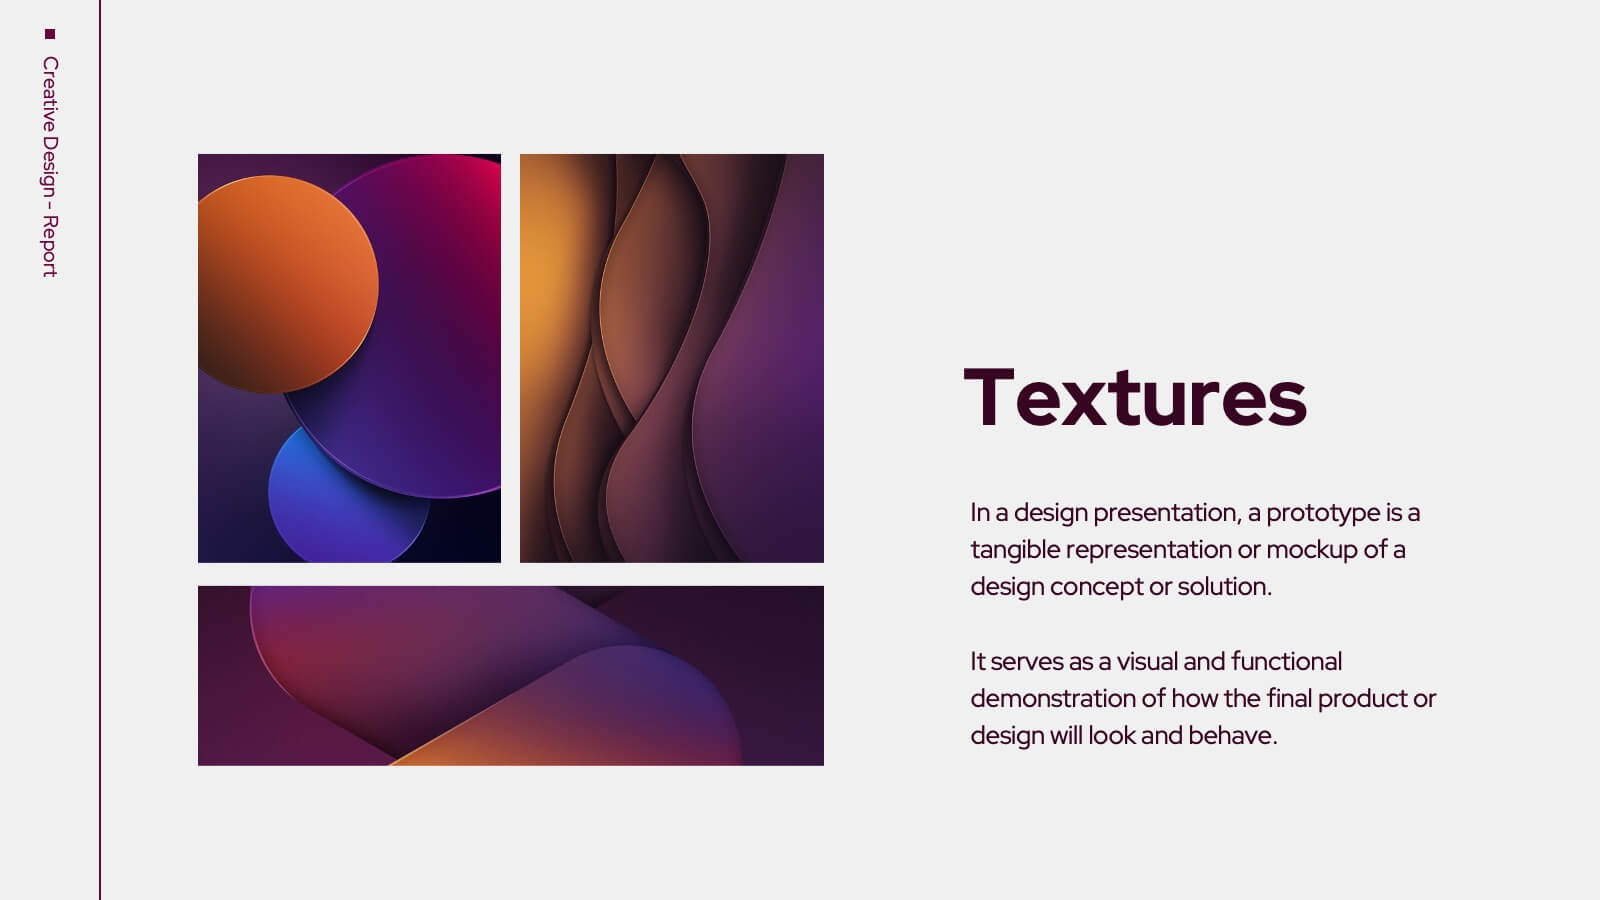
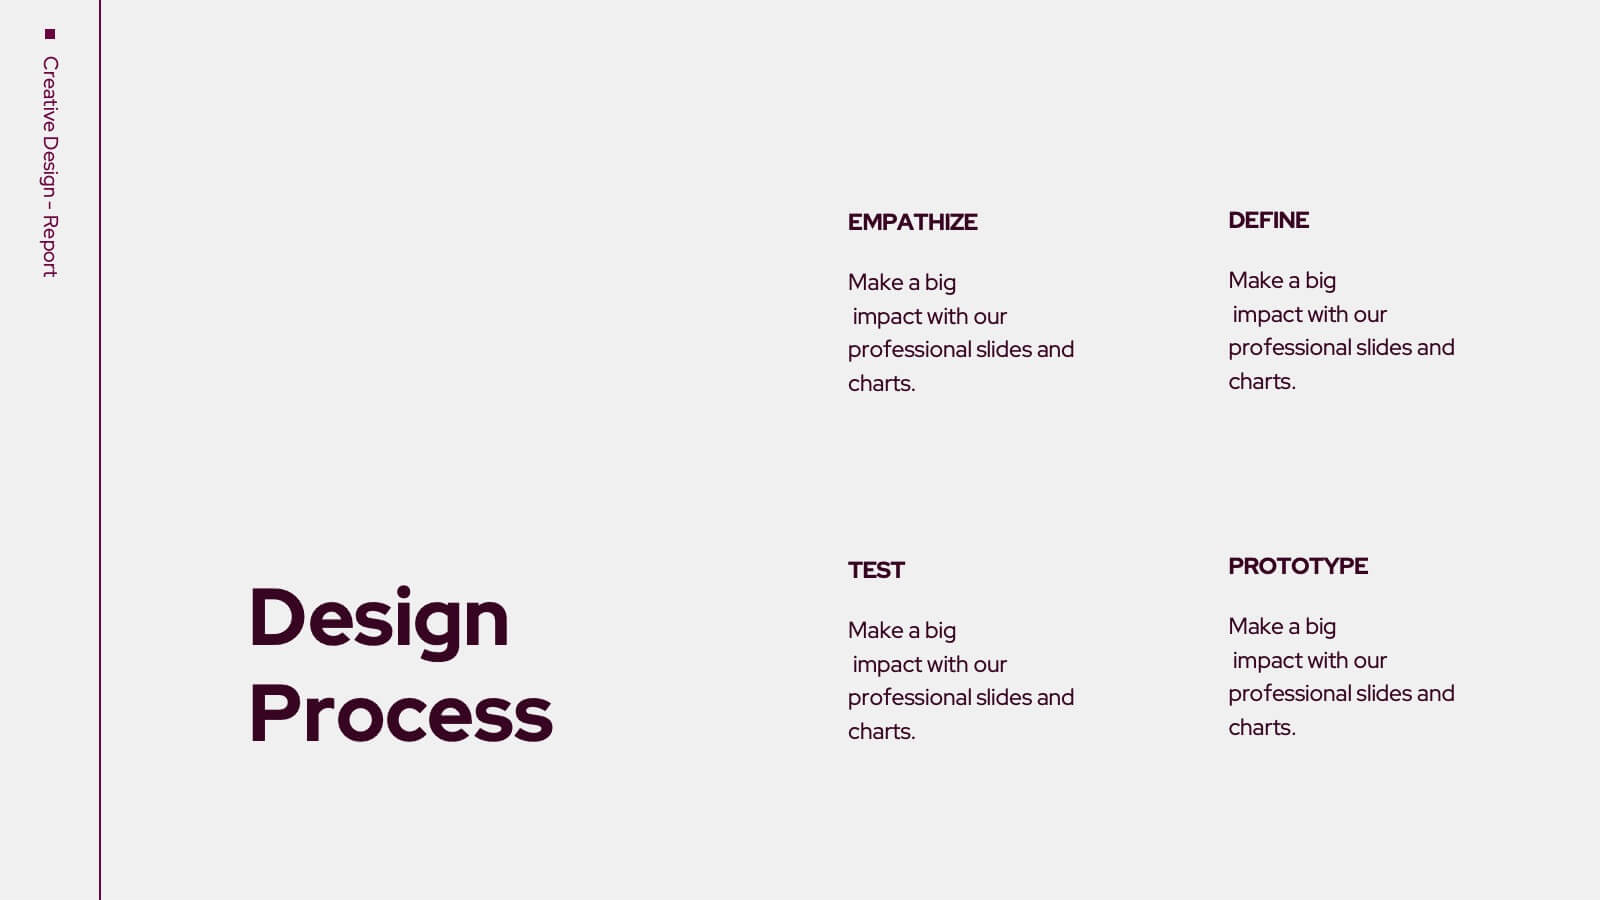
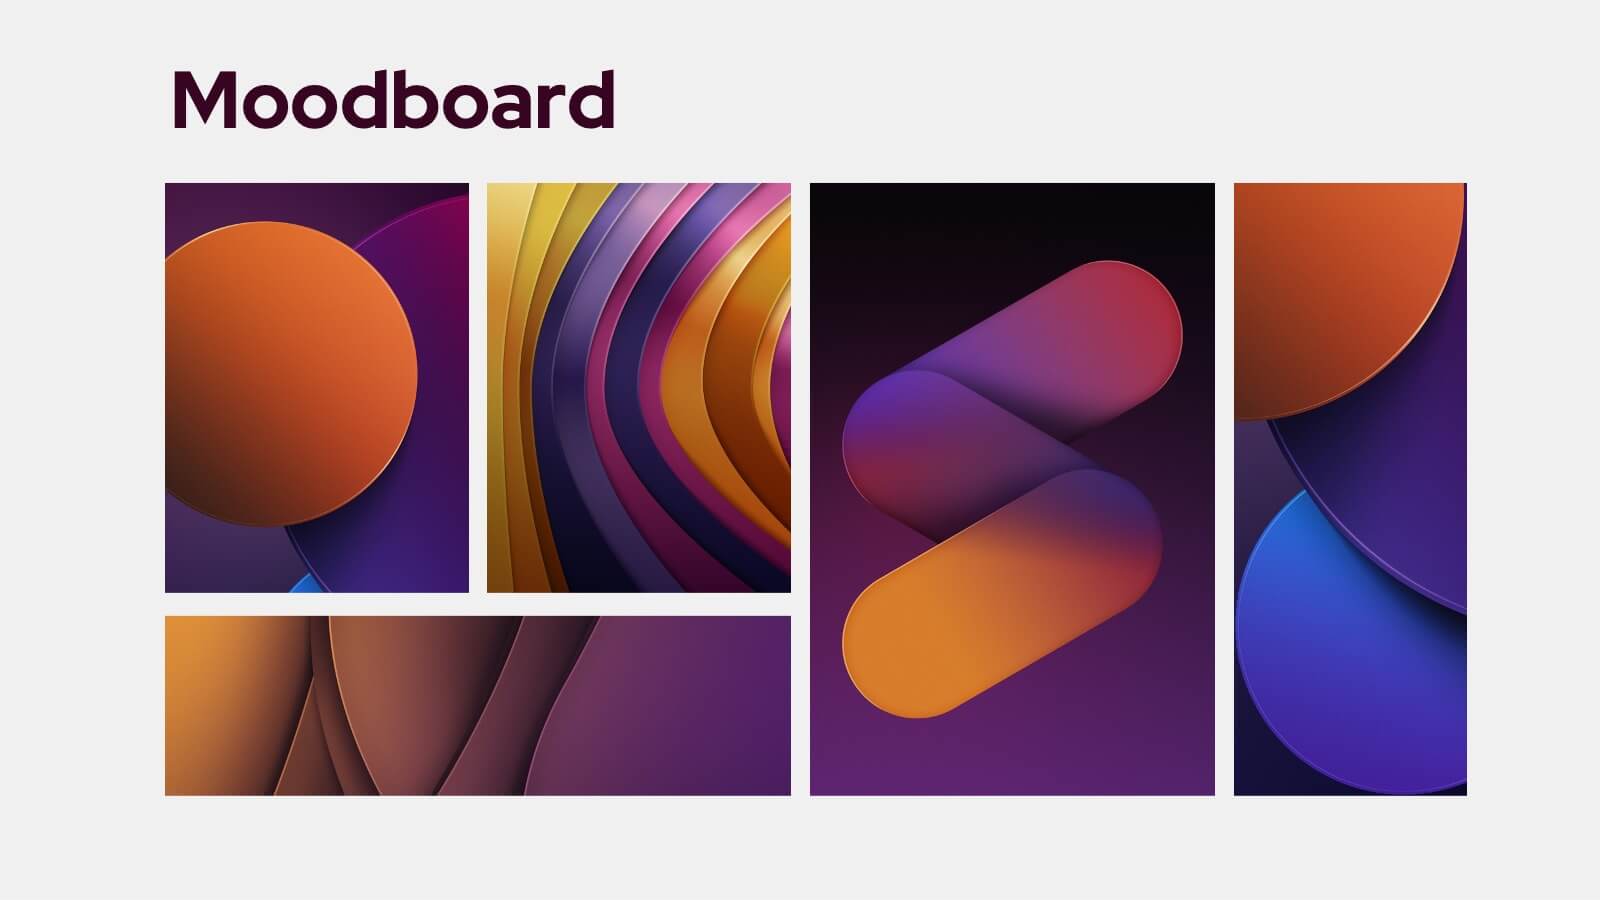
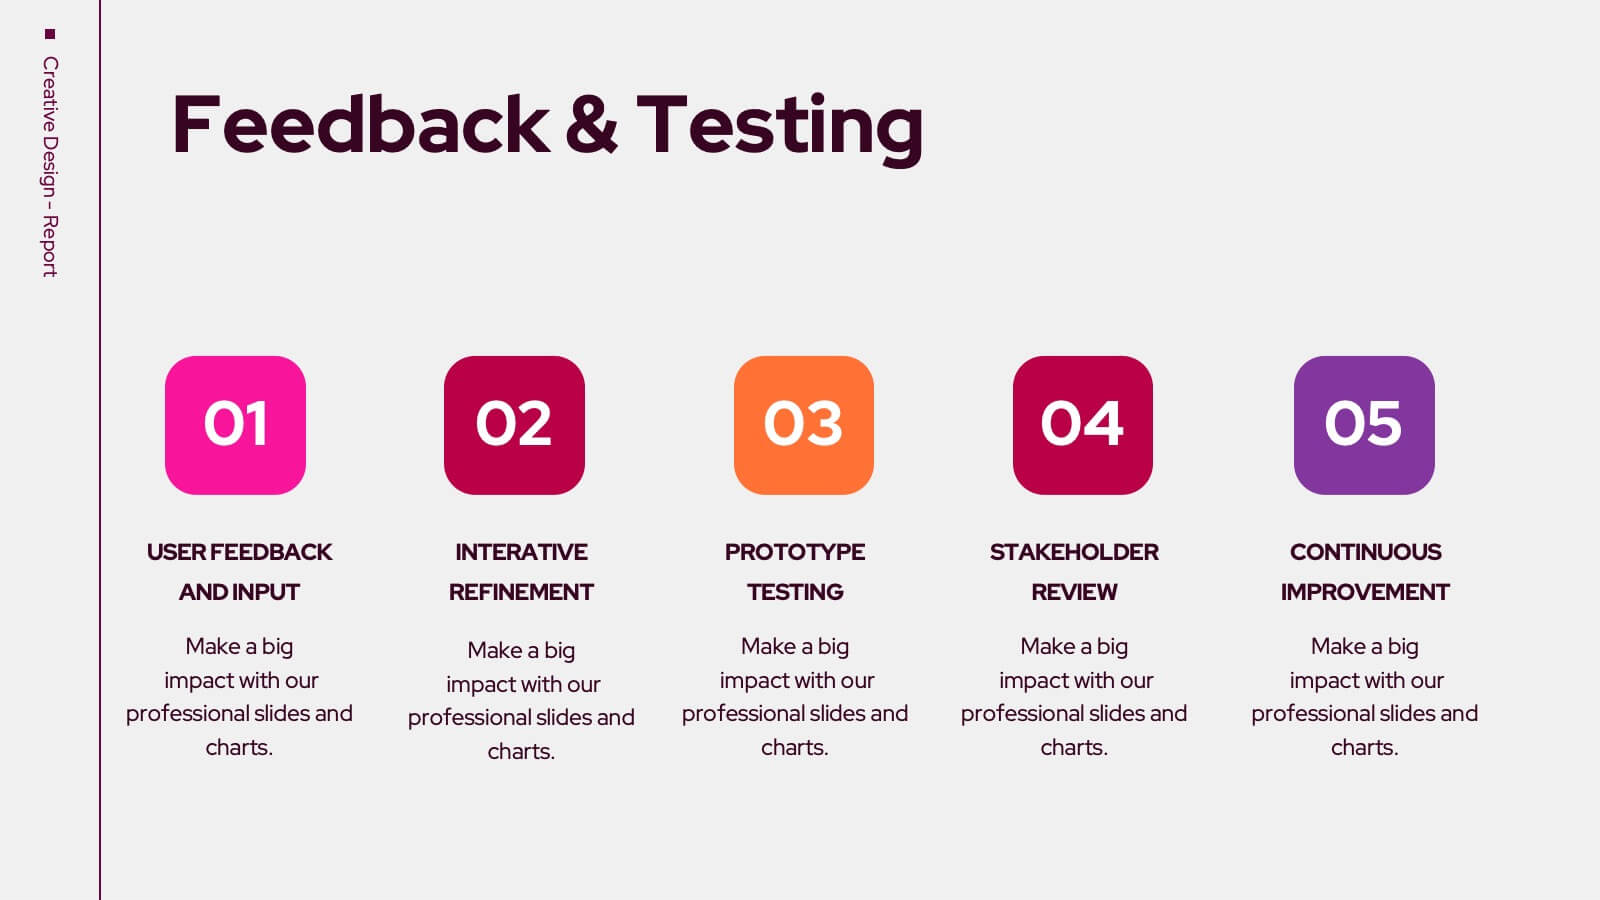
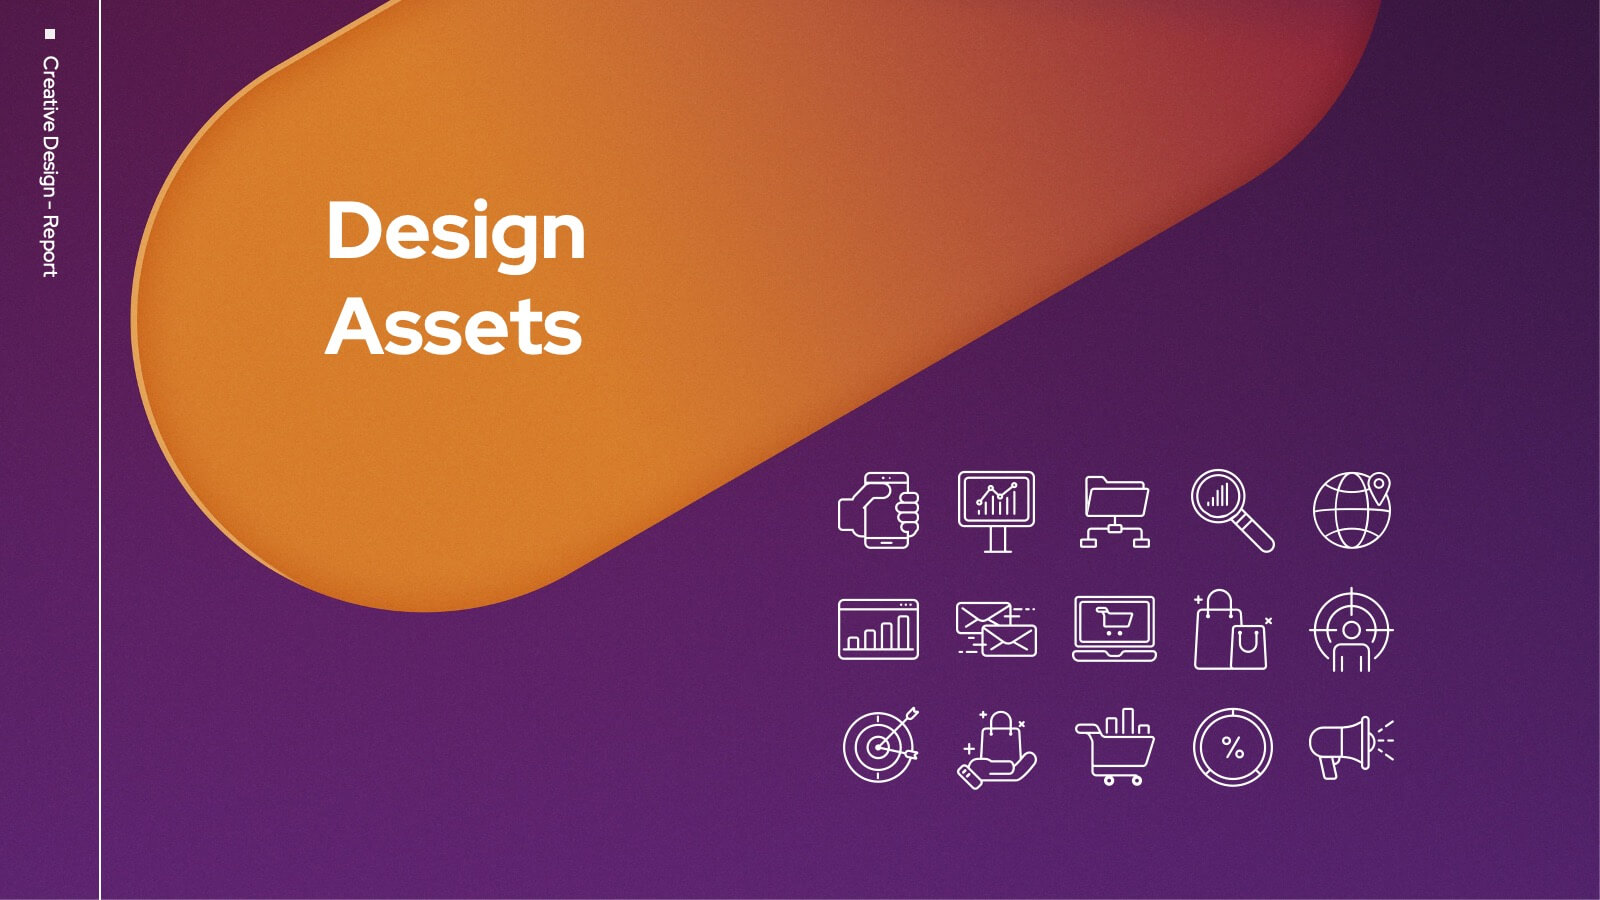
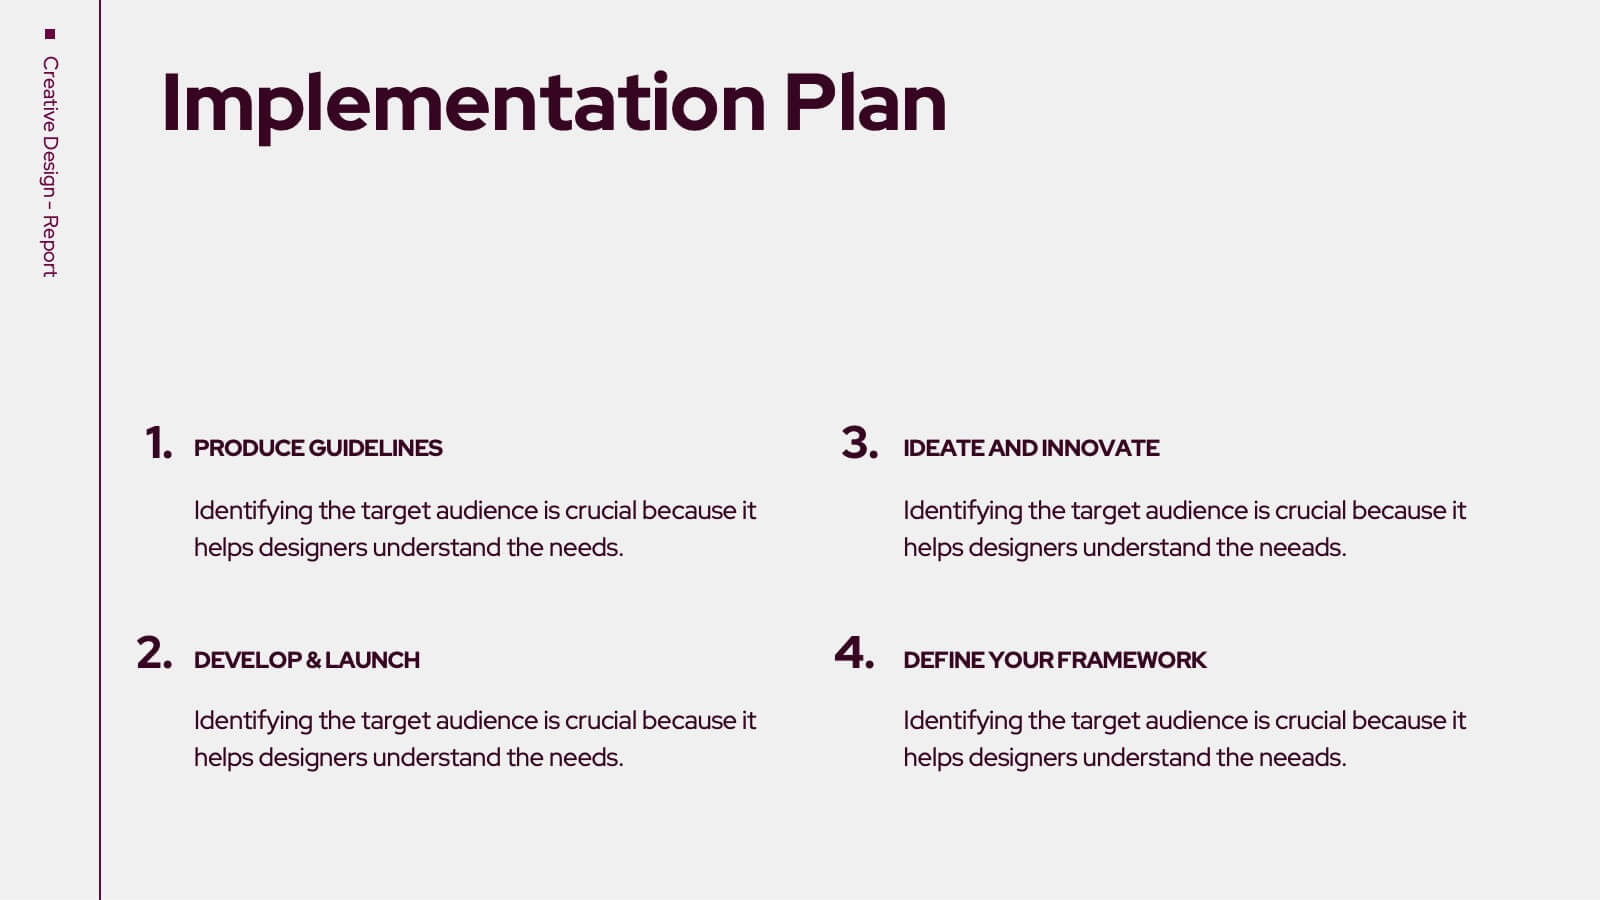
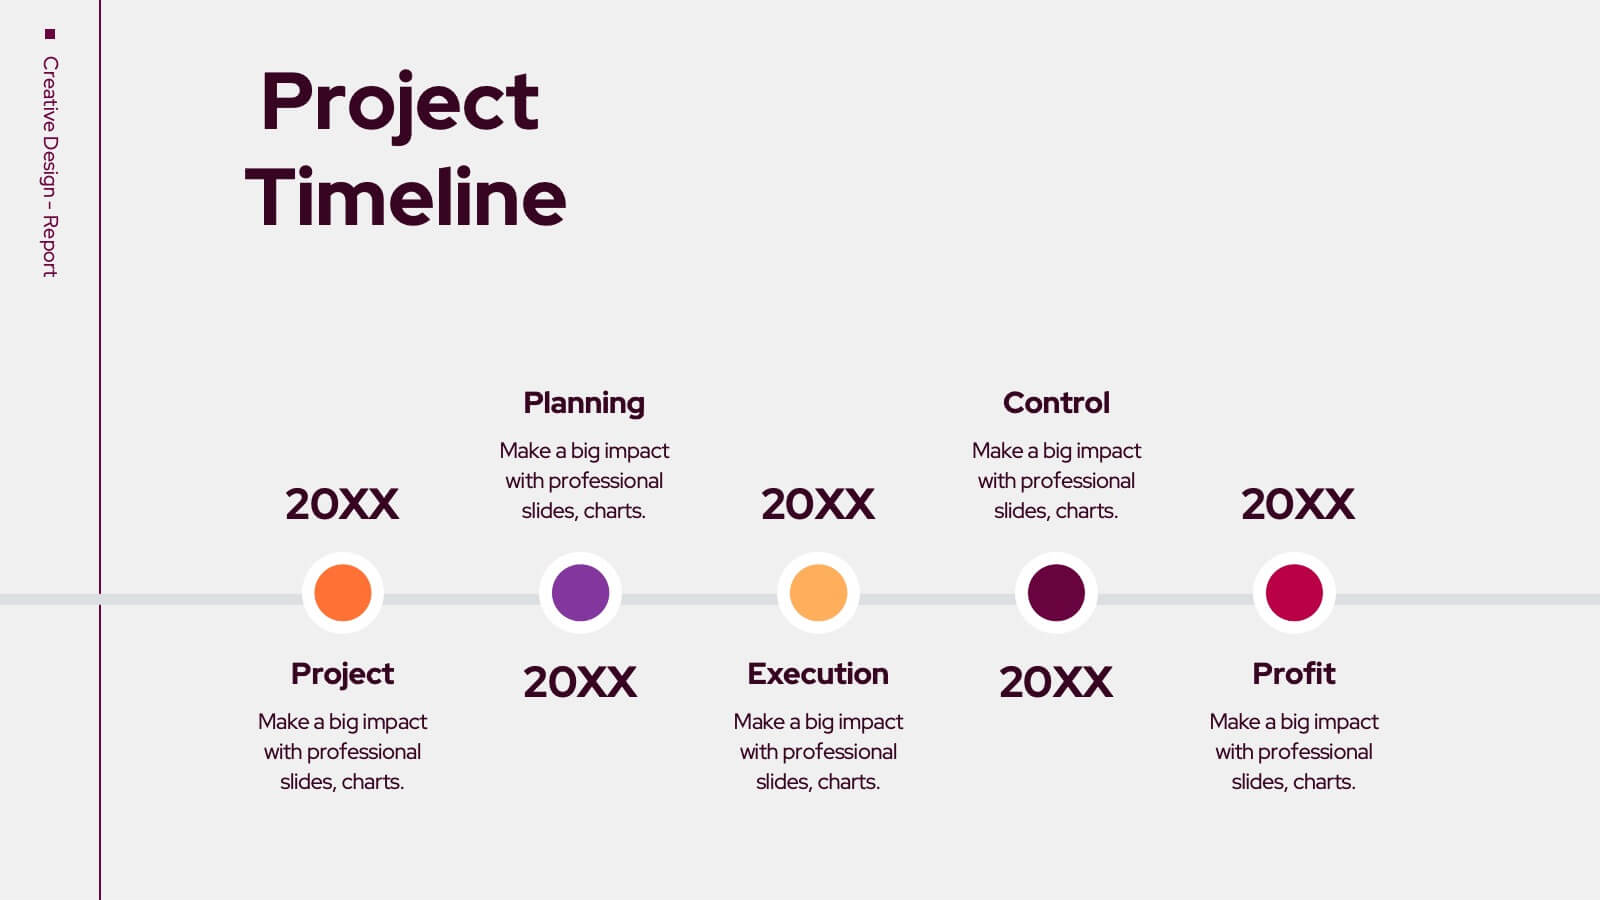
Trojan Creative Design Report Presentation
Unleash your creativity with this striking Trojan-inspired presentation template! Ideal for showcasing your design projects, this presentation enables you to highlight key concepts, inspirations, and visual elements effectively. Its engaging layout ensures your ideas shine through, captivating your audience. Compatible with PowerPoint, Keynote, and Google Slides for seamless presentations.


5 slides
Hierarchical Pyramid Chart Presentation
Bring structure to your ideas with a clean, layered visual that makes complexity feel easy to navigate. This presentation helps you explain levels, priorities, and organizational breakdowns with clarity and flow. Ideal for planning, strategy, and reporting. Fully compatible with PowerPoint, Keynote, and Google Slides.


5 slides
RAPID Framework for Business Strategy
Clarify decision-making roles with confidence using this vibrant business strategy framework. This template visualizes the RAPID model—Recommend, Agree, Perform, Input, Decide—in a clear flow that simplifies collaboration and speeds up strategy execution. Ideal for leadership teams and cross-functional planning. Works seamlessly in PowerPoint, Keynote, and Google Slides.


19 slides
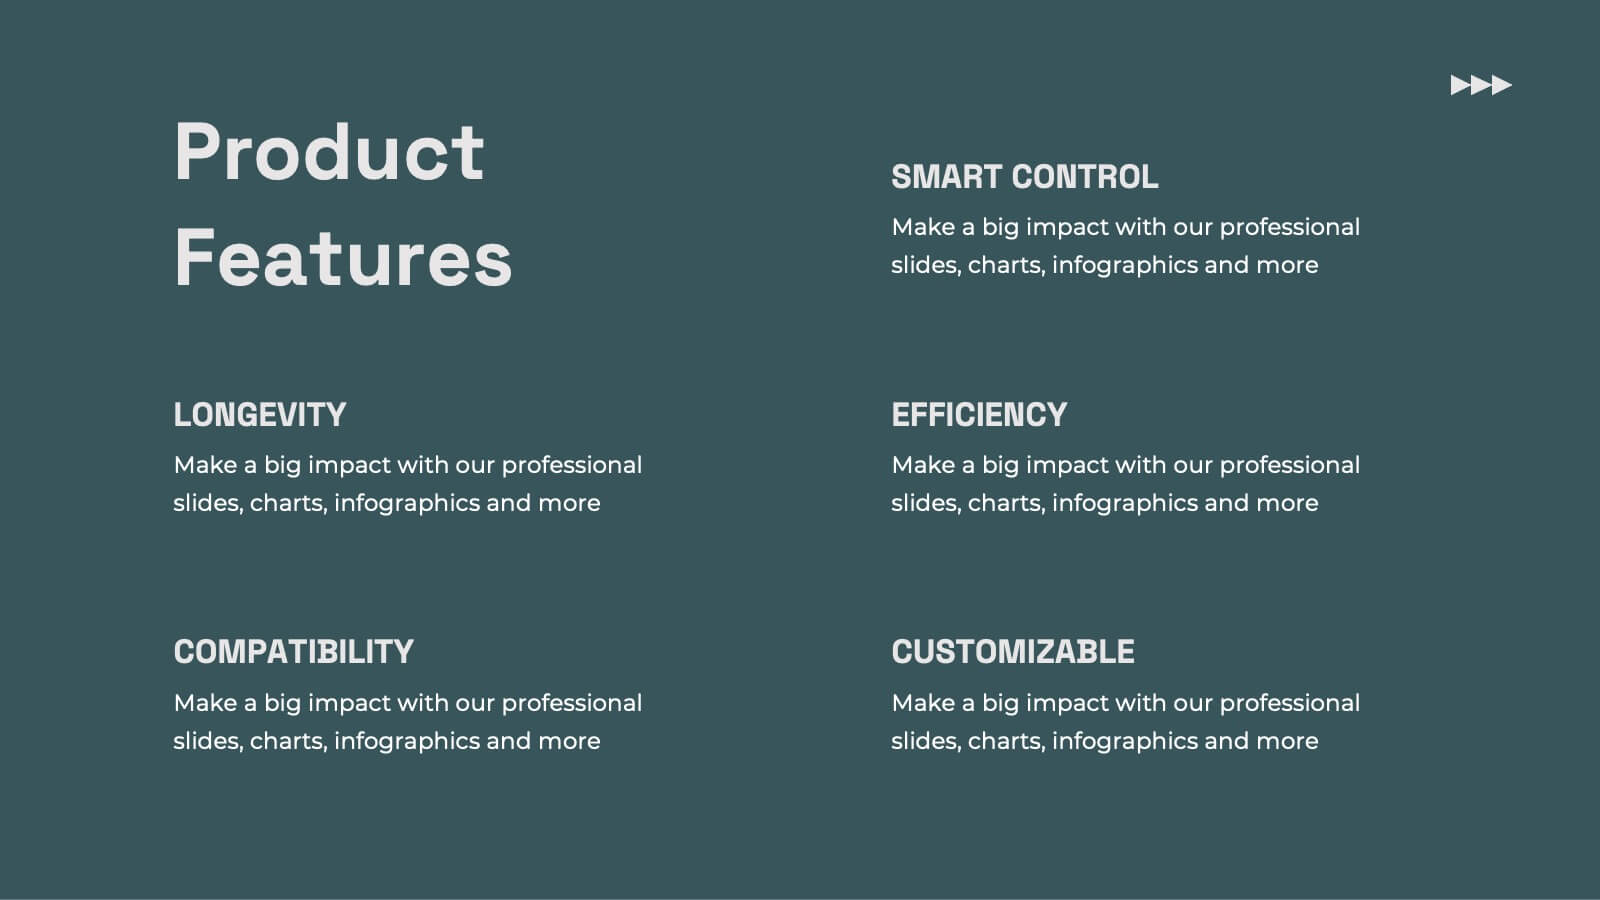
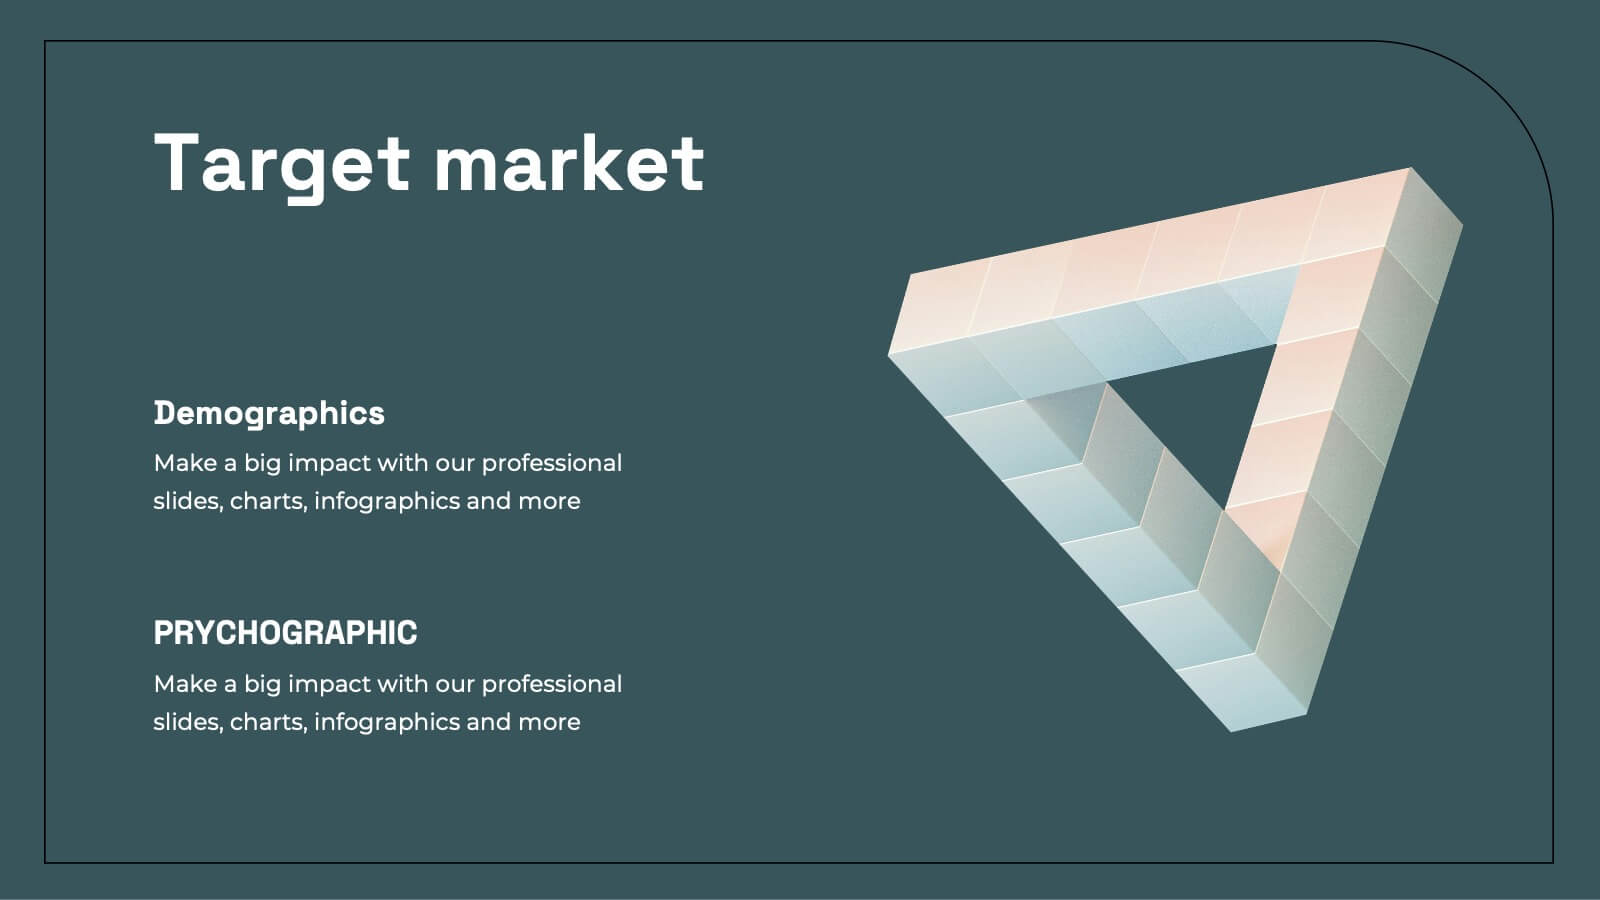
Kale Product Strategy Report Presentation
Unleash the power of your product with this bold and dynamic product strategy report template! Elevate your presentation with eye-catching designs that showcase product features, competitive analysis, and pricing strategies like never before. Captivate your audience from start to finish and leave a lasting impression. Fully compatible with PowerPoint, Keynote, and Google Slides!


6 slides
Creating Effective Buyer Persona Strategies Presentation
Present your audience research with clarity using this buyer persona strategy slide. Designed with a radial layout of five icons leading to a central profile, this template helps communicate key traits, behaviors, and preferences. Ideal for marketing teams, branding workshops, and product strategy sessions. Easily customizable in PowerPoint, Keynote, and Google Slides.


26 slides
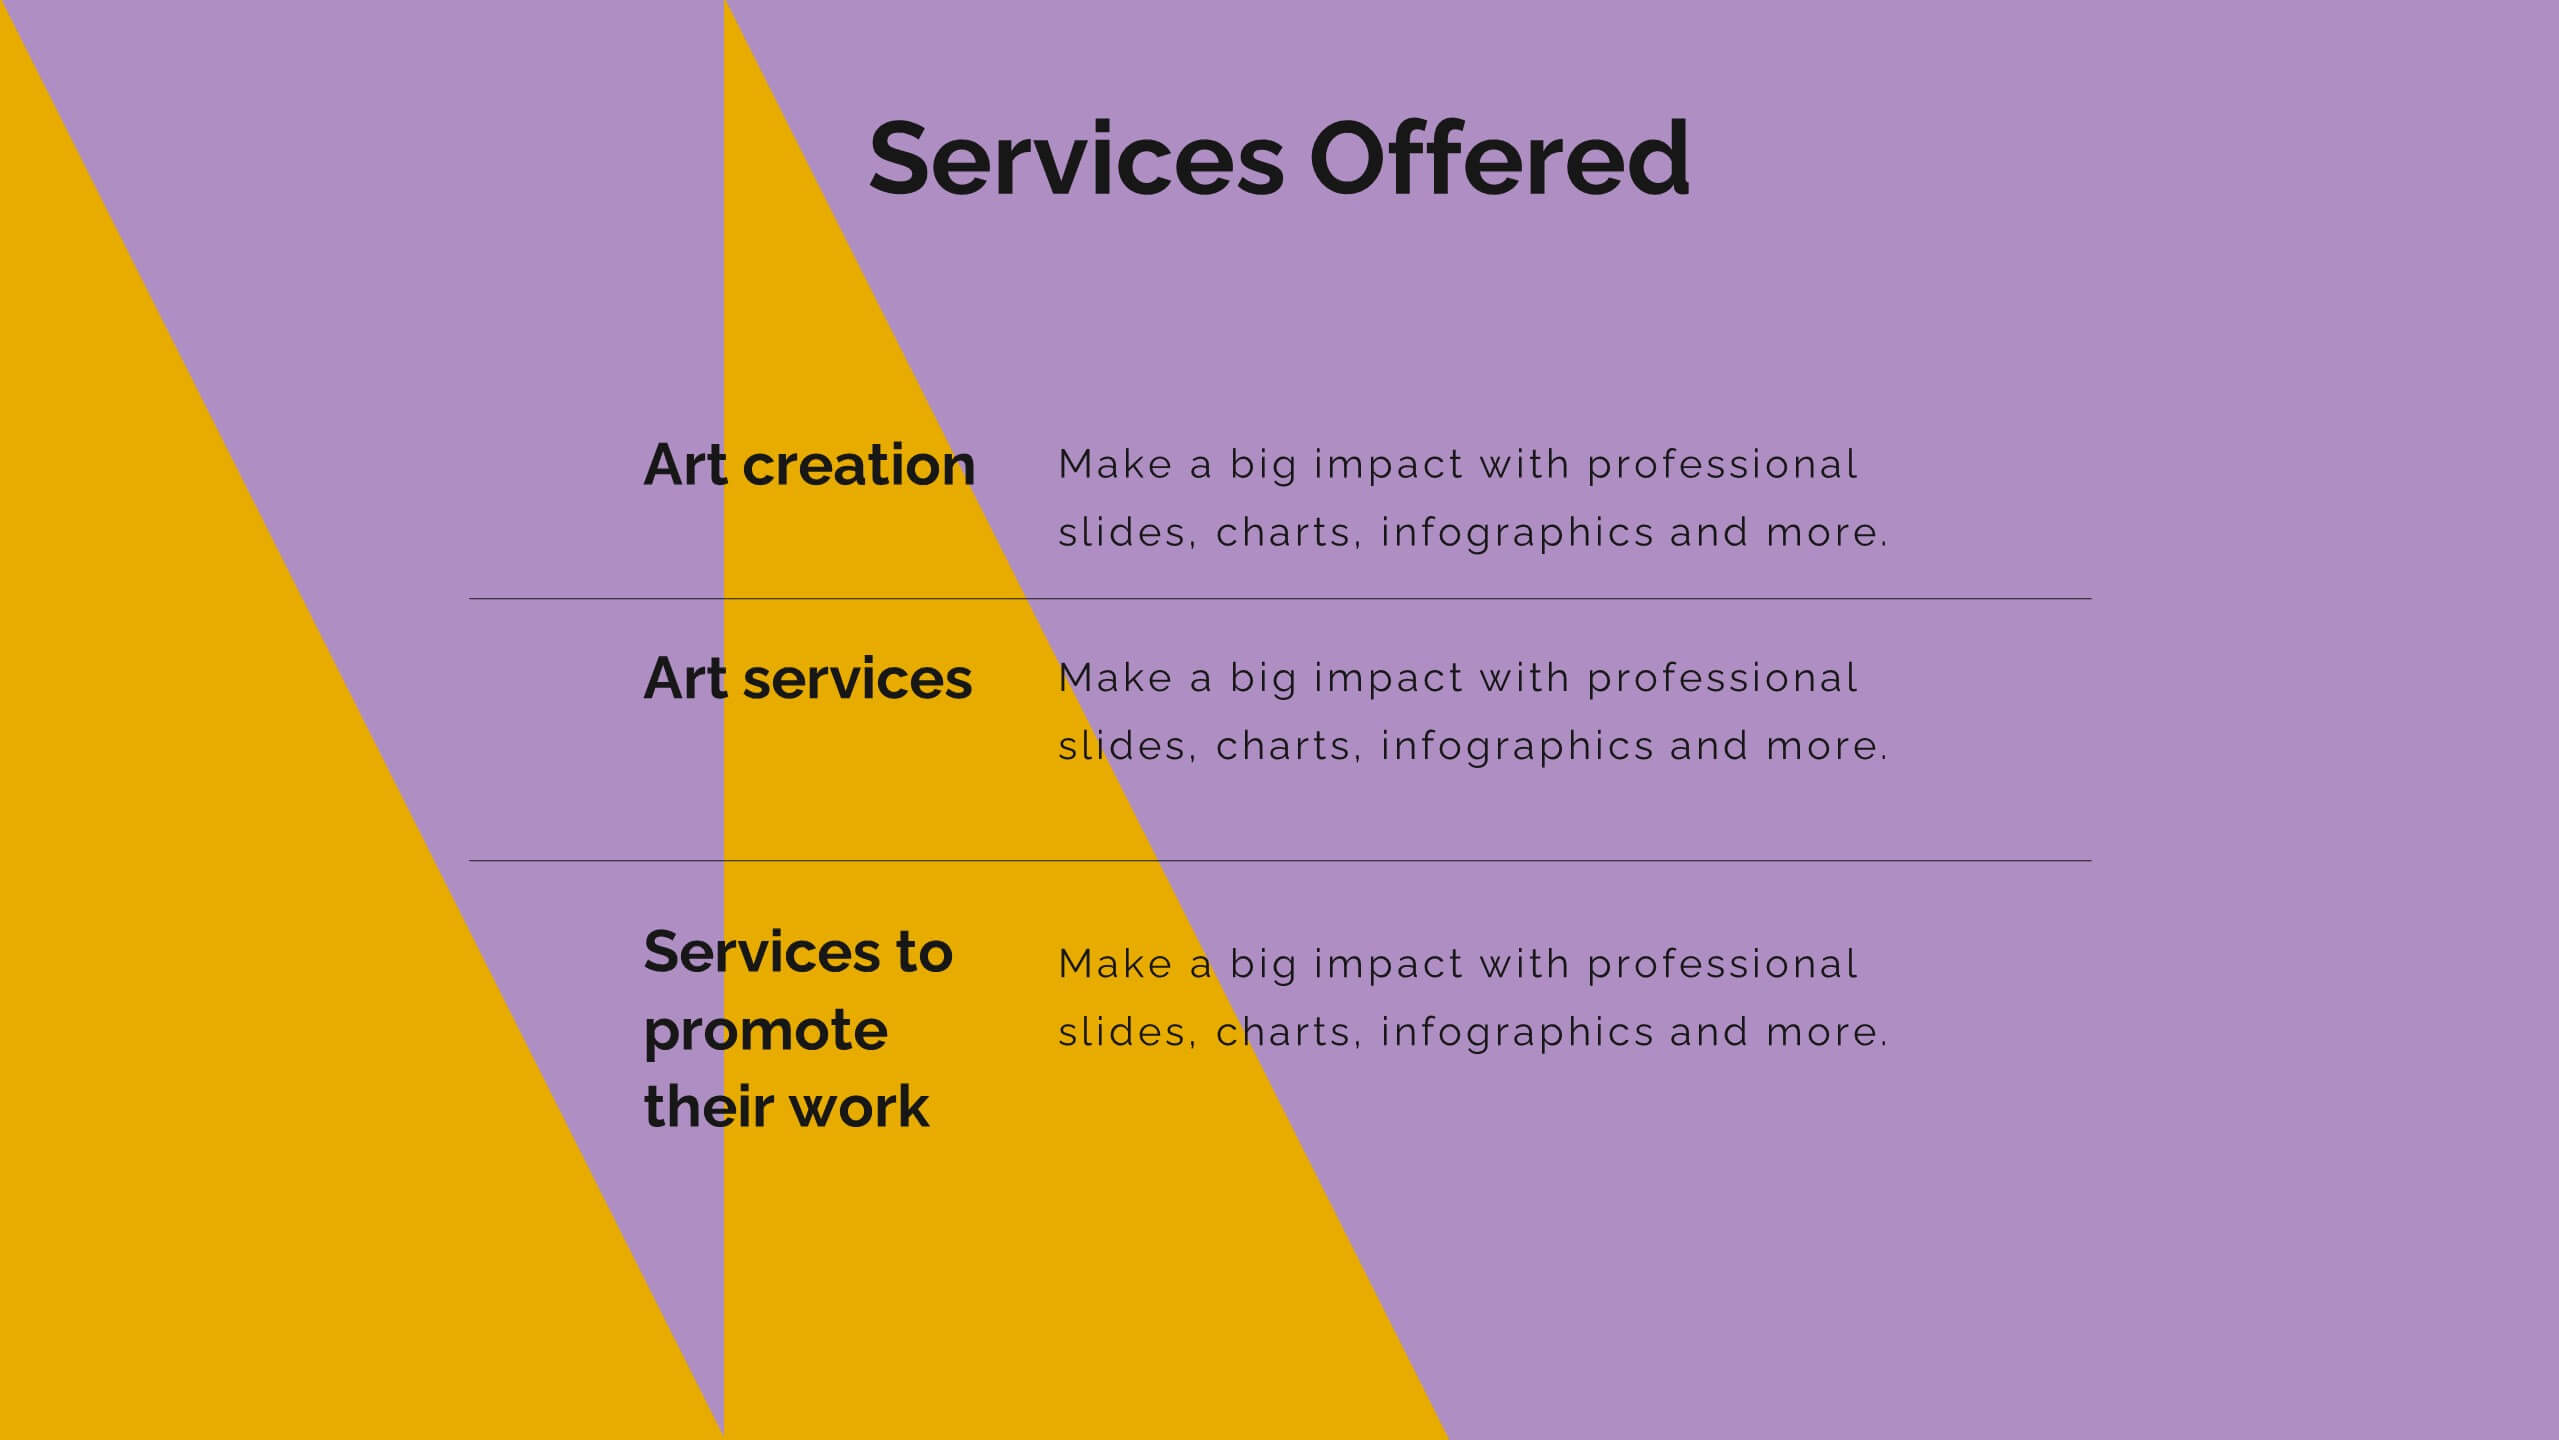
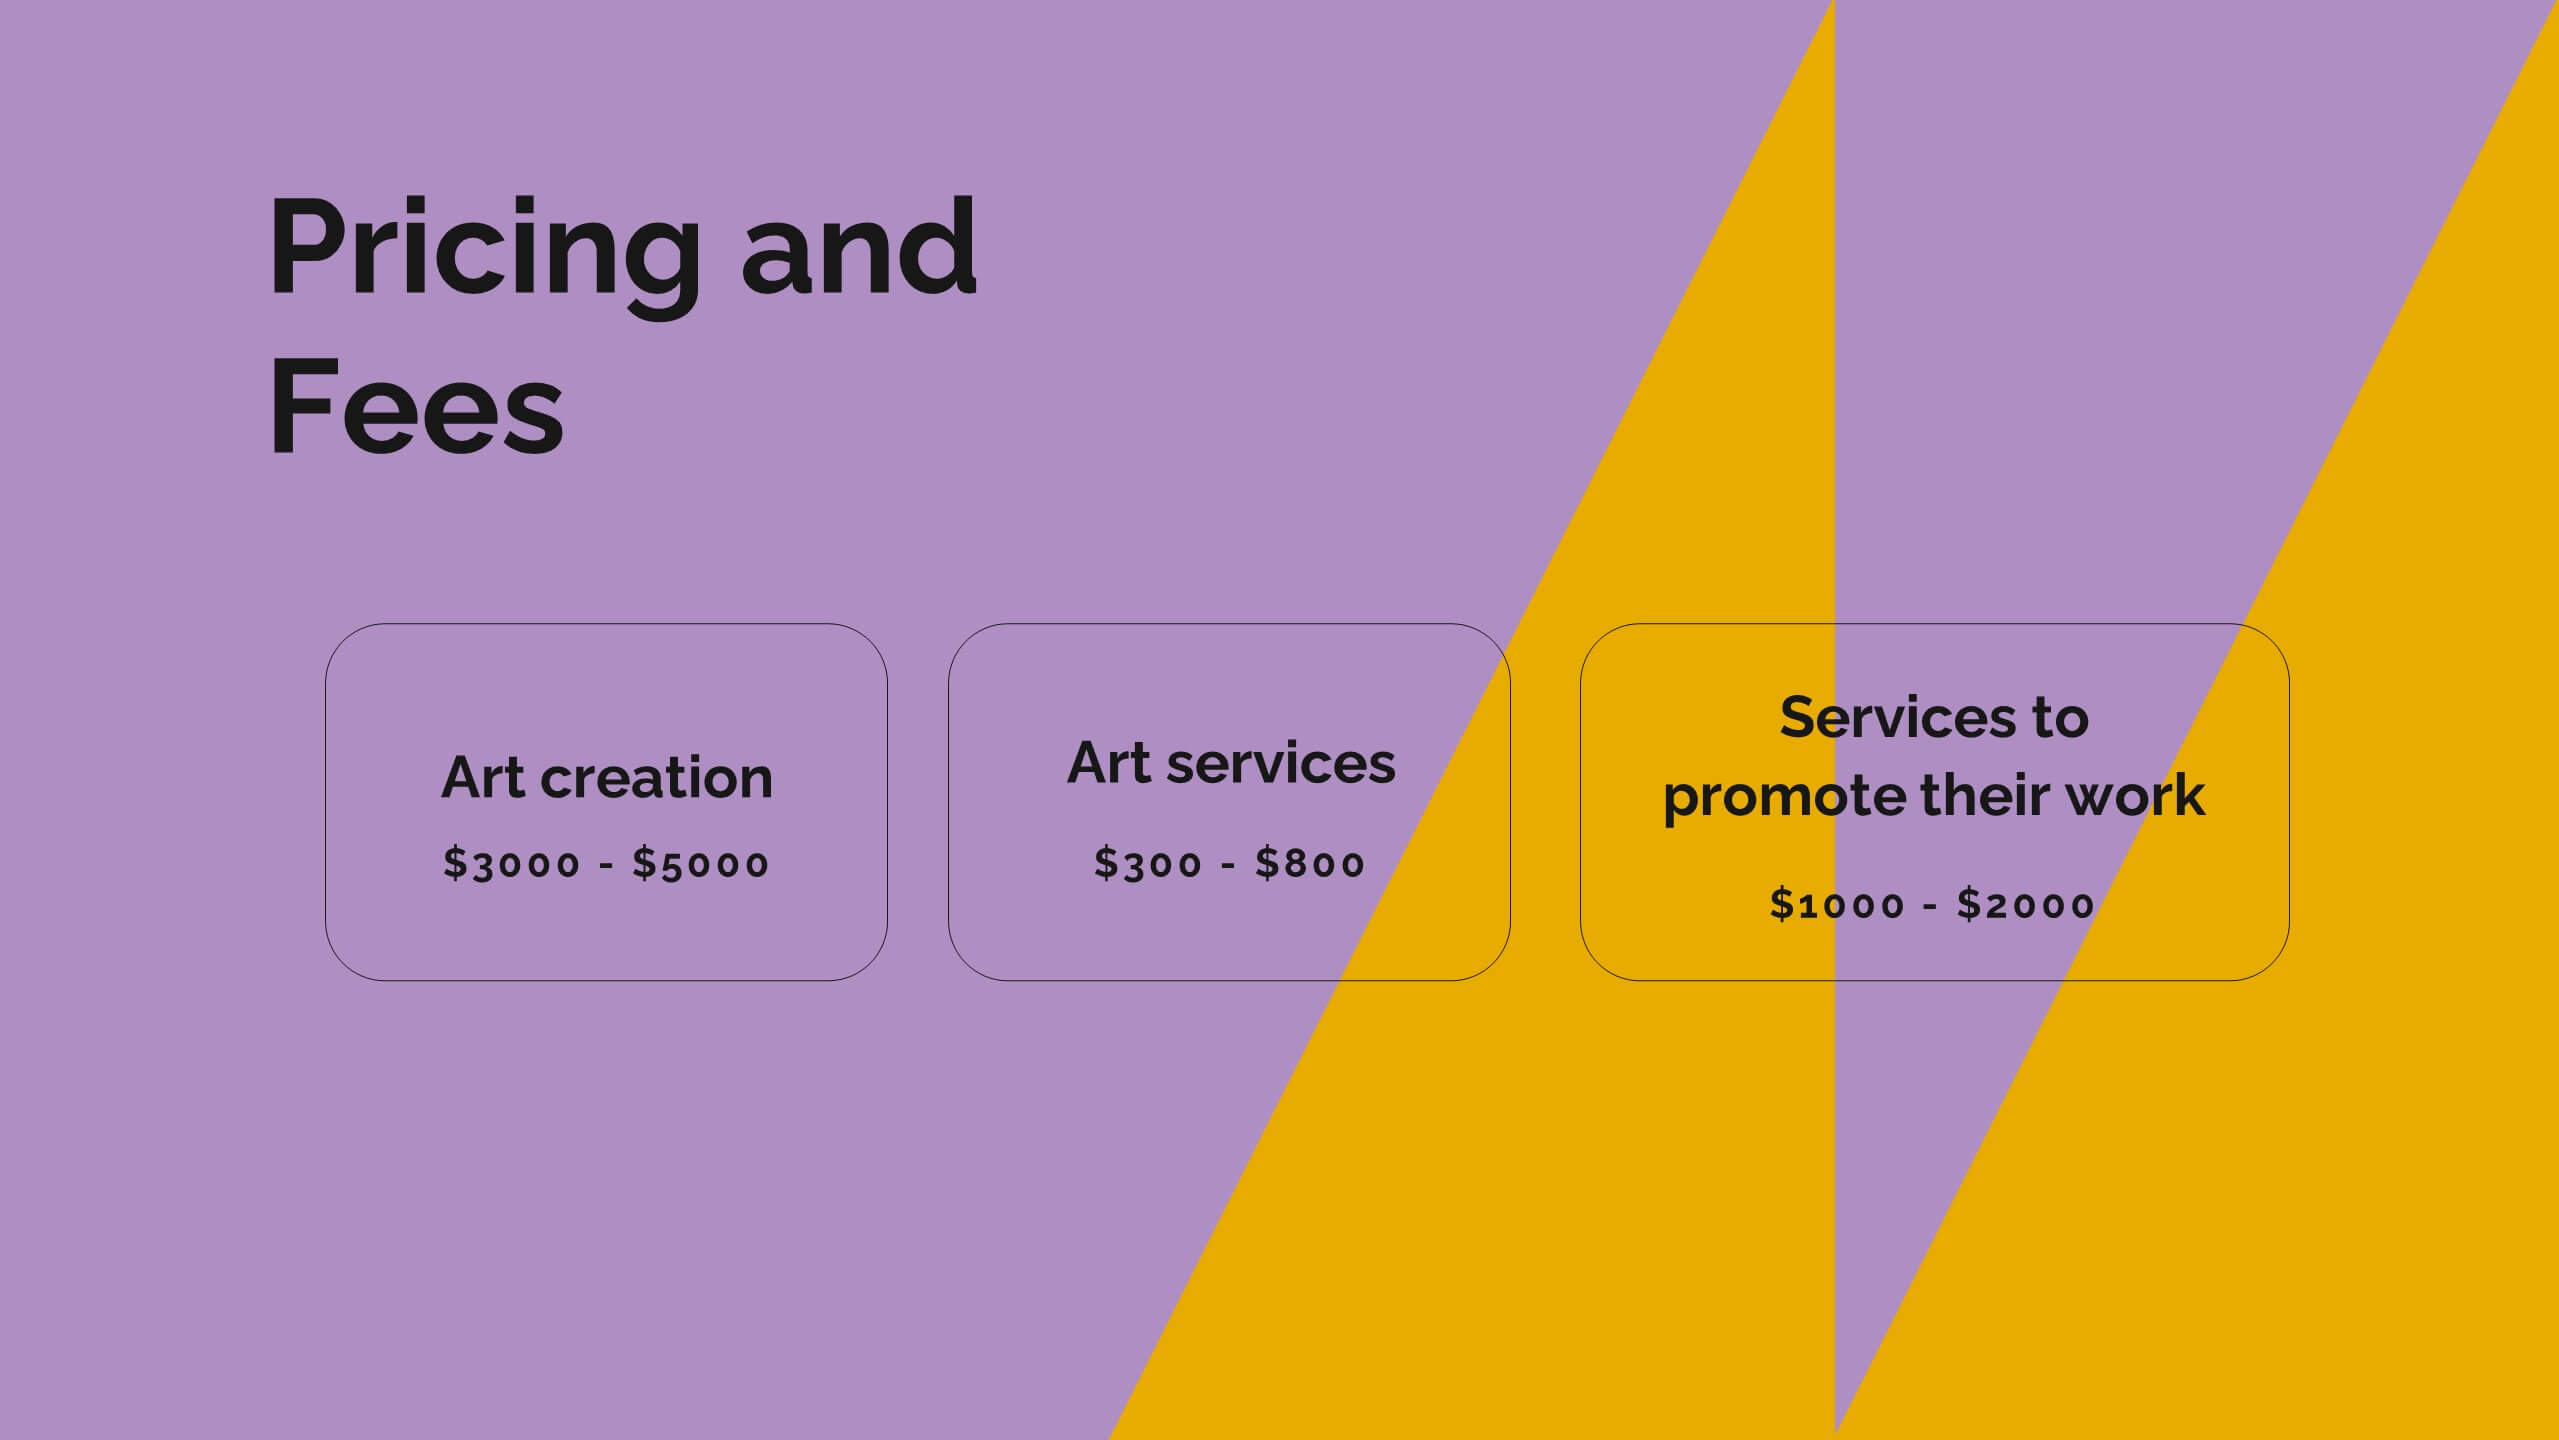
Azahar Presentation Template
Azahar is a perfect modern template with a clean and professional feel. This theme can help your business connect with clients through an easy to understand template. Azahar was designed by professionals to help businesses connect with their audience. It has a modern, chic aesthetic and very detailed look. The colors are fresh which help keep the look clean and easy to read. The theme comes packed with features to target your audience and get your message across. Charts, timelines and easy to edit text, this template is perfect for businesses seeking to make an impression on their audience.


8 slides
Interactive Digital Learning Experience Presentation
Make your content more engaging with the Interactive Digital Learning Experience Presentation. This layout blends quiz-style visuals and educational icons, helping you present learning modules, assessments, or training checkpoints in a fun and intuitive way. Use it to simplify information, boost audience interaction, or highlight multiple-choice content. Fully editable in Canva, PowerPoint, Keynote, and Google Slides.


6 slides
Bubble Chart Data Visualization Presentation
Make your data pop with visuals that tell a story at a glance. This modern presentation transforms raw numbers into clear, engaging bubble charts that simplify complex insights and comparisons. Fully editable and compatible with PowerPoint, Keynote, and Google Slides for effortless customization and professional results.


7 slides
Implementation Models and Frameworks Slide Presentation
Visualize your entire process clearly with the Implementation Models and Frameworks Slide Presentation. This sleek arrow-based timeline features six distinct stages, each with icons and text placeholders to highlight key milestones, actions, or phases. Ideal for showcasing workflows, strategic initiatives, or rollout plans, this slide ensures your audience follows the journey from start to finish. Fully editable in PowerPoint, Keynote, and Google Slides, it’s perfect for project managers, consultants, and team leads aiming for clarity and impact.


4 slides
Crypto Investment and Trading Strategies Presentation
Visualize your crypto strategy with clarity using this modern, step-by-step slide. Featuring a rising arrow graph, coin icon, and shopping cart illustration, this layout is ideal for explaining investment phases, trading tactics, or market entry strategies. Editable in PowerPoint, Keynote, and Google Slides for maximum flexibility.


20 slides
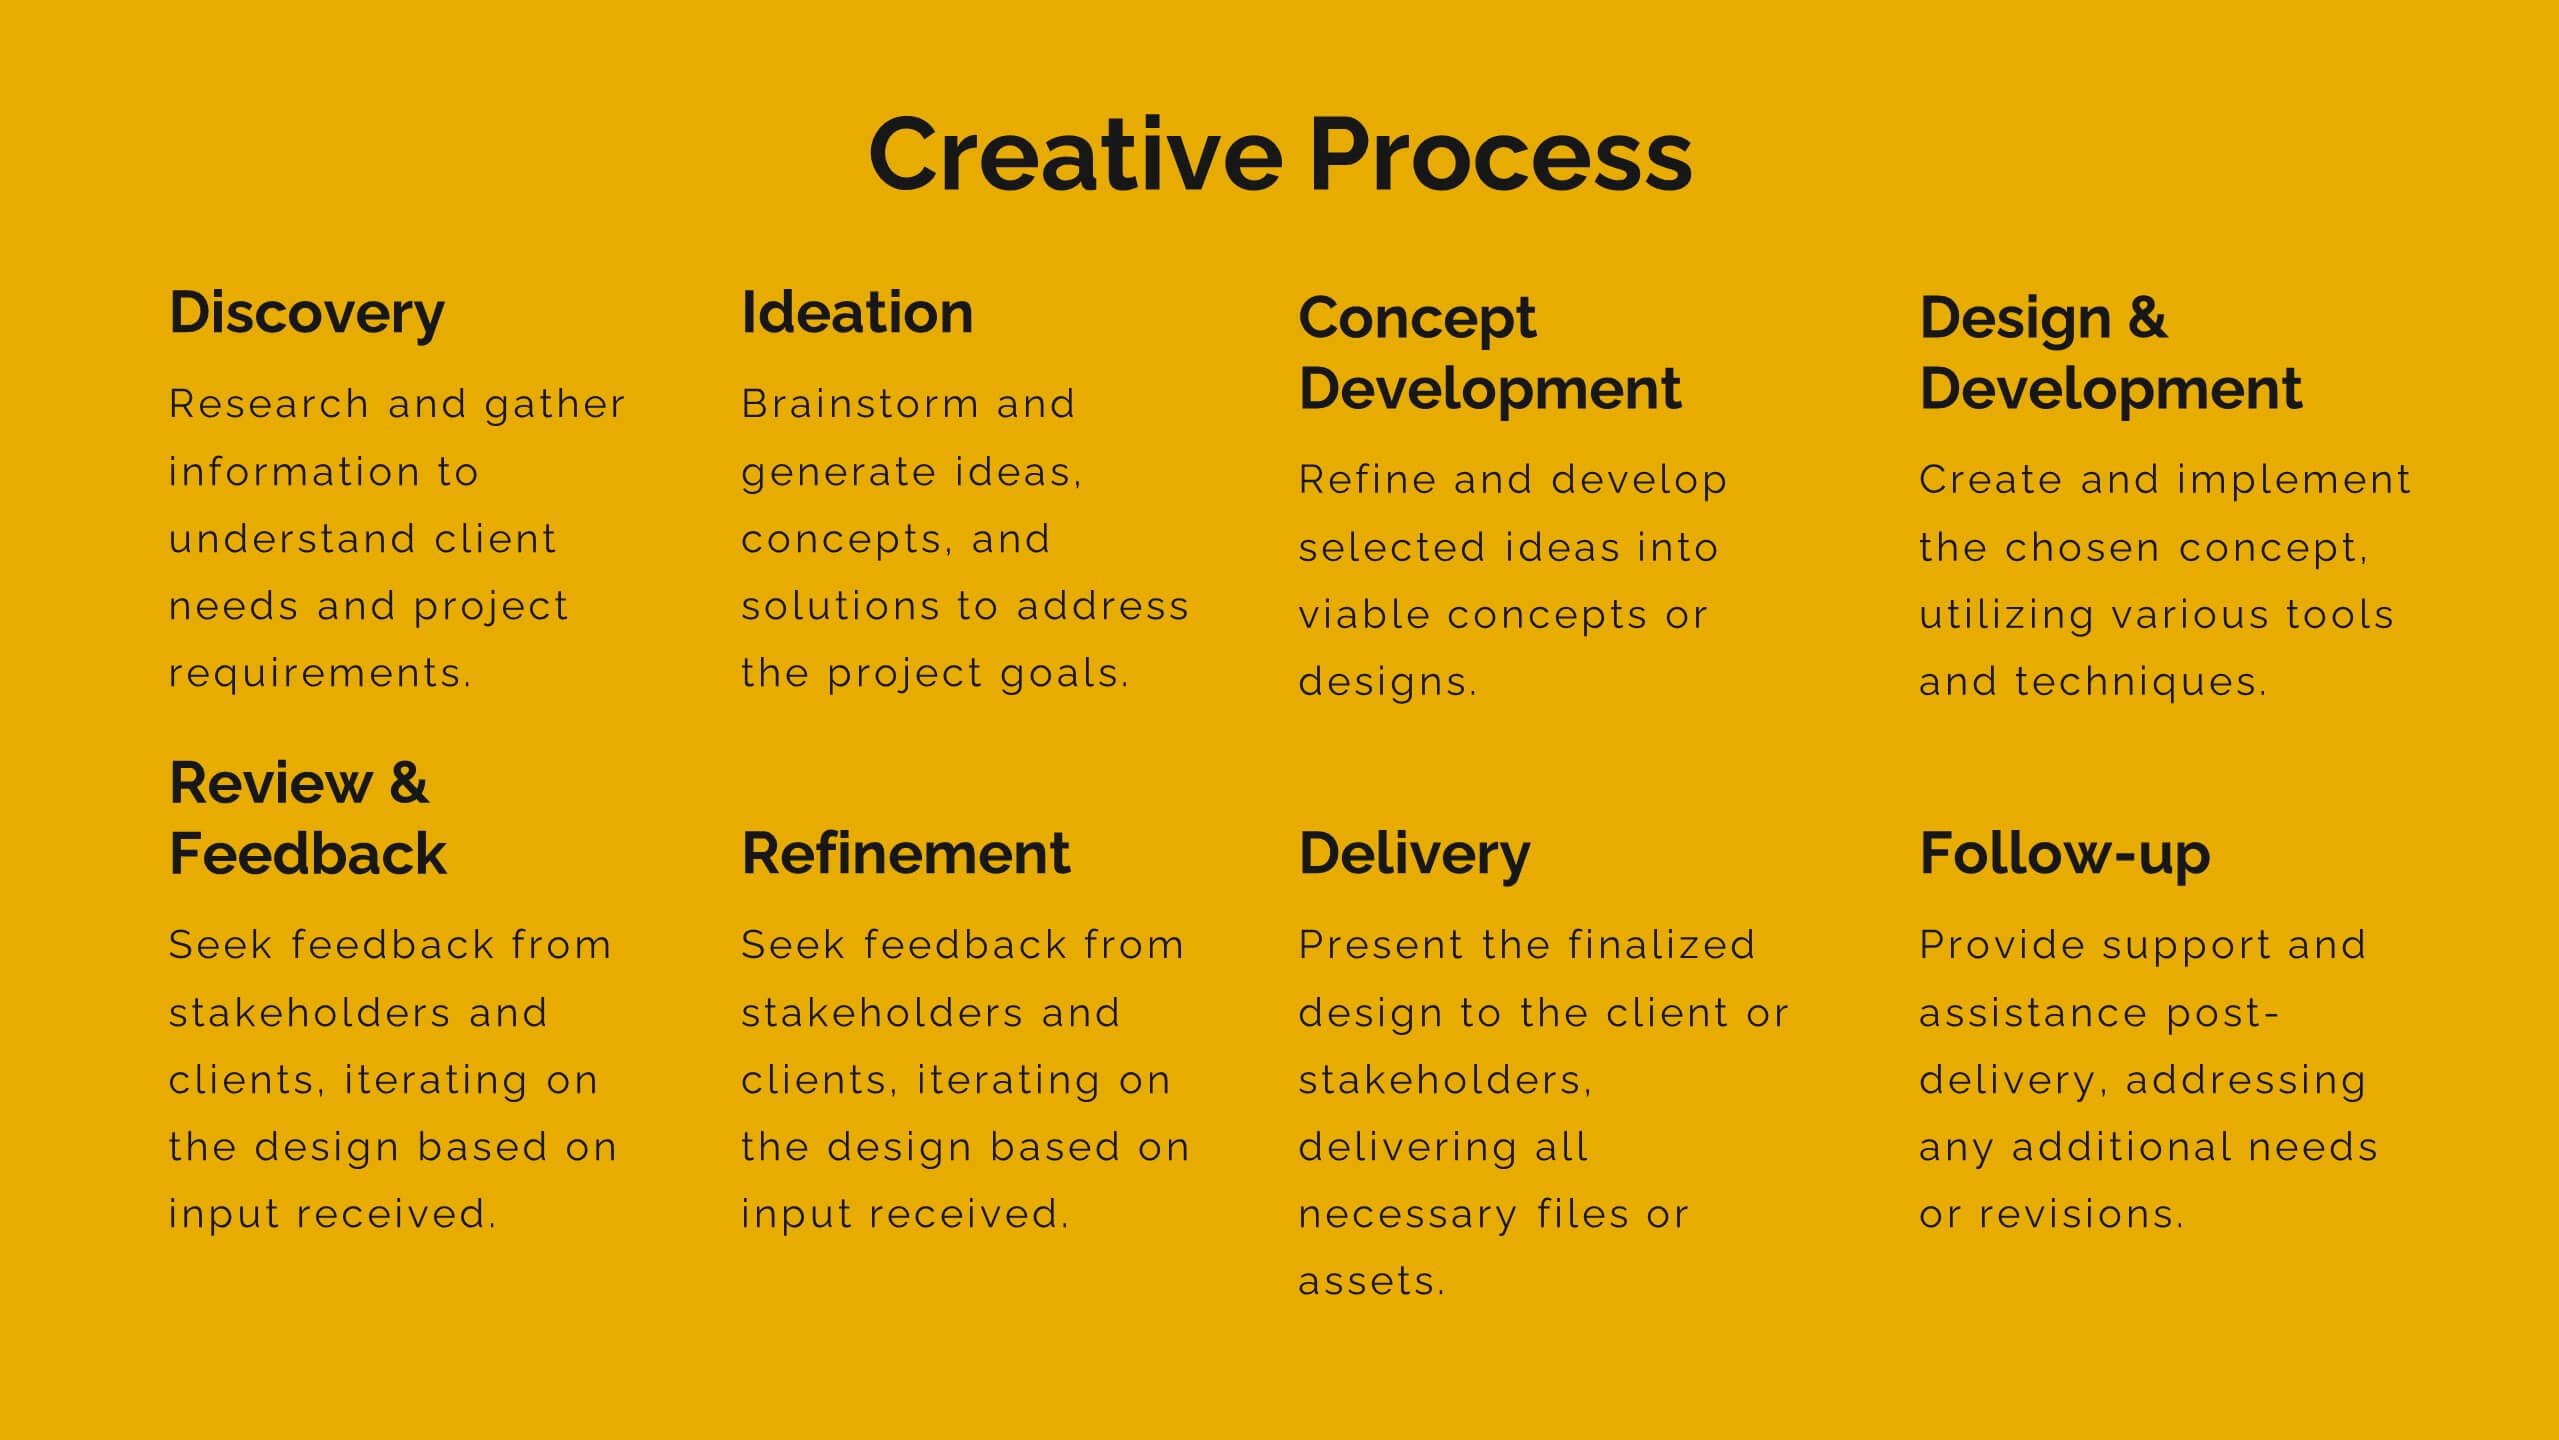
Vortex Artist Portfolio Template Presentation
Showcase your artistic brilliance with this eye-catching portfolio presentation template! Perfect for highlighting your projects, creative process, and awards, it features vibrant slides for your philosophy, collaborations, and client testimonials. Impress potential clients and collaborators with a stunning, well-organized portfolio. Compatible with PowerPoint, Keynote, and Google Slides for seamless presentations on any platform.


6 slides
Company Expansion Timeline Presentation
Show your company’s growth story in a way that’s both professional and visually captivating. This presentation template helps you outline milestones, future goals, and expansion phases with clarity and style. Fully customizable and compatible with PowerPoint, Keynote, and Google Slides for effortless editing and polished results.


5 slides
Customer Behavior and Demographics Presentation
Break down customer segments with clarity using this behavior and demographics infographic set. Featuring colorful cylinder diagrams and intuitive labels, these slides are ideal for presenting consumer insights, age groups, behavior trends, and buyer types. Fully editable in PowerPoint, Keynote, and Google Slides—perfect for marketers, analysts, and business development teams.


5 slides
Management Framework Structure Presentation
Bring your ideas to life with a dynamic slide that maps out clear stages of leadership, planning, and execution. This layout helps you break down complex management structures into simple, visual steps that any audience can follow. Fully editable and easy to customize in PowerPoint, Keynote, and Google Slides.


4 slides
3-Circle Venn Diagrams Presentation
Unlock clarity with a bold visual that highlights how ideas, data, or teams connect at key intersection points. This presentation makes complex relationships easy to explain with clean circles, labels, and structured insights. Fully editable and compatible with PowerPoint, Keynote, and Google Slides.


4 slides
Corporate Networking Flow Presentation
Simplify complex communication systems with this dynamic and easy-to-follow presentation design. Perfect for visualizing workflow connections, team collaboration, or IT infrastructure, it brings clarity to multi-level processes with a clean and structured layout. Fully editable and compatible with PowerPoint, Keynote, and Google Slides for professional results.