


Features
- 6 Unique slides
- Fully editable and easy to edit in Microsoft Powerpoint, Keynote and Google Slides
- 16:9 widescreen layout
- Clean and professional designs
- Export to JPG, PDF or send by email


Do you have any questions?
Recommend


5 slides
Nutrition & Health Infographics
Nutrition & Health are essential aspects of a person's well-being. Good nutrition habits provide the nutrients that the body needs to function optimally. These infographics are visual representations of information related to the relationship between diet, exercise, and overall health. They are designed to provide concise, easily digestible information that can help people make informed decisions about their diet and lifestyle choices. Nutrition and health infographics can serve as a valuable tool for individuals looking to improve their overall health and well-being through informed dietary choices.


5 slides
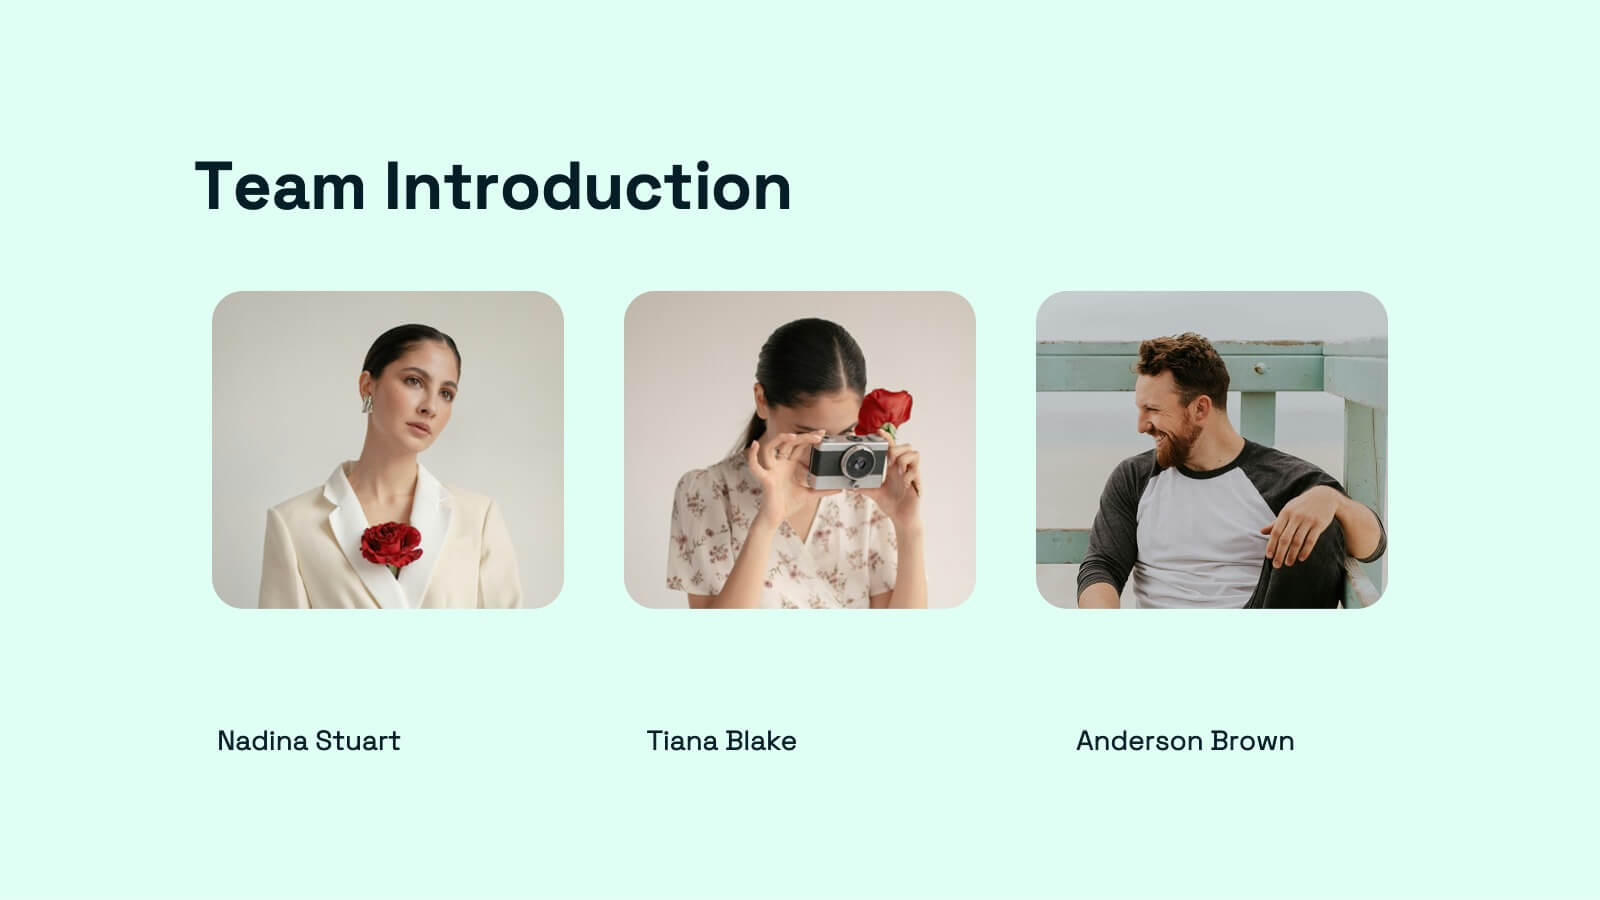
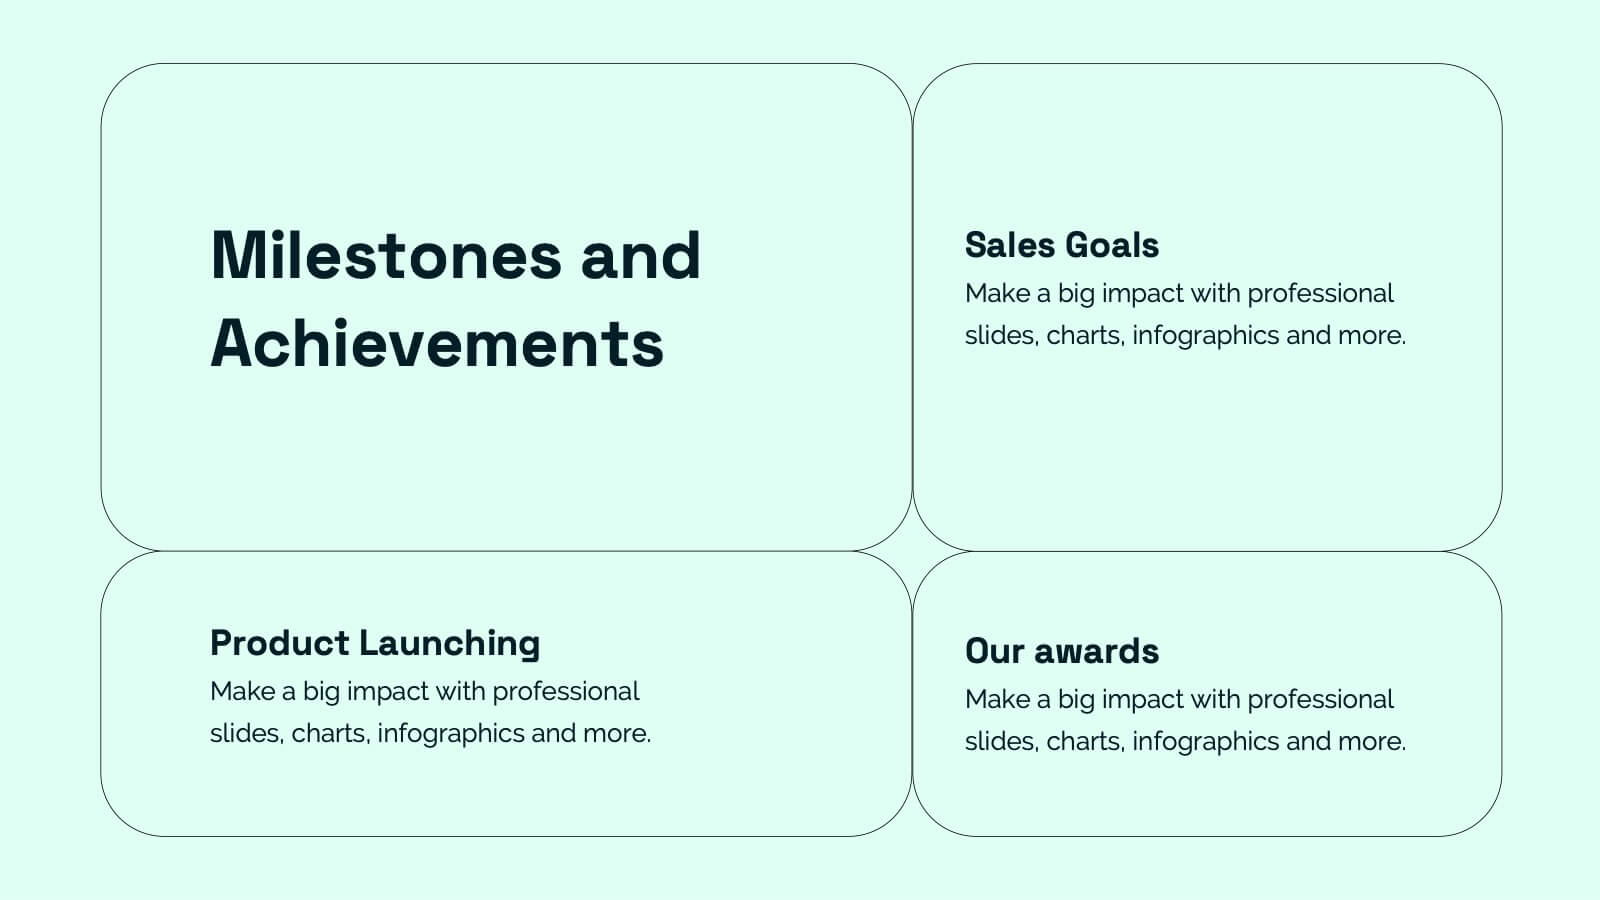
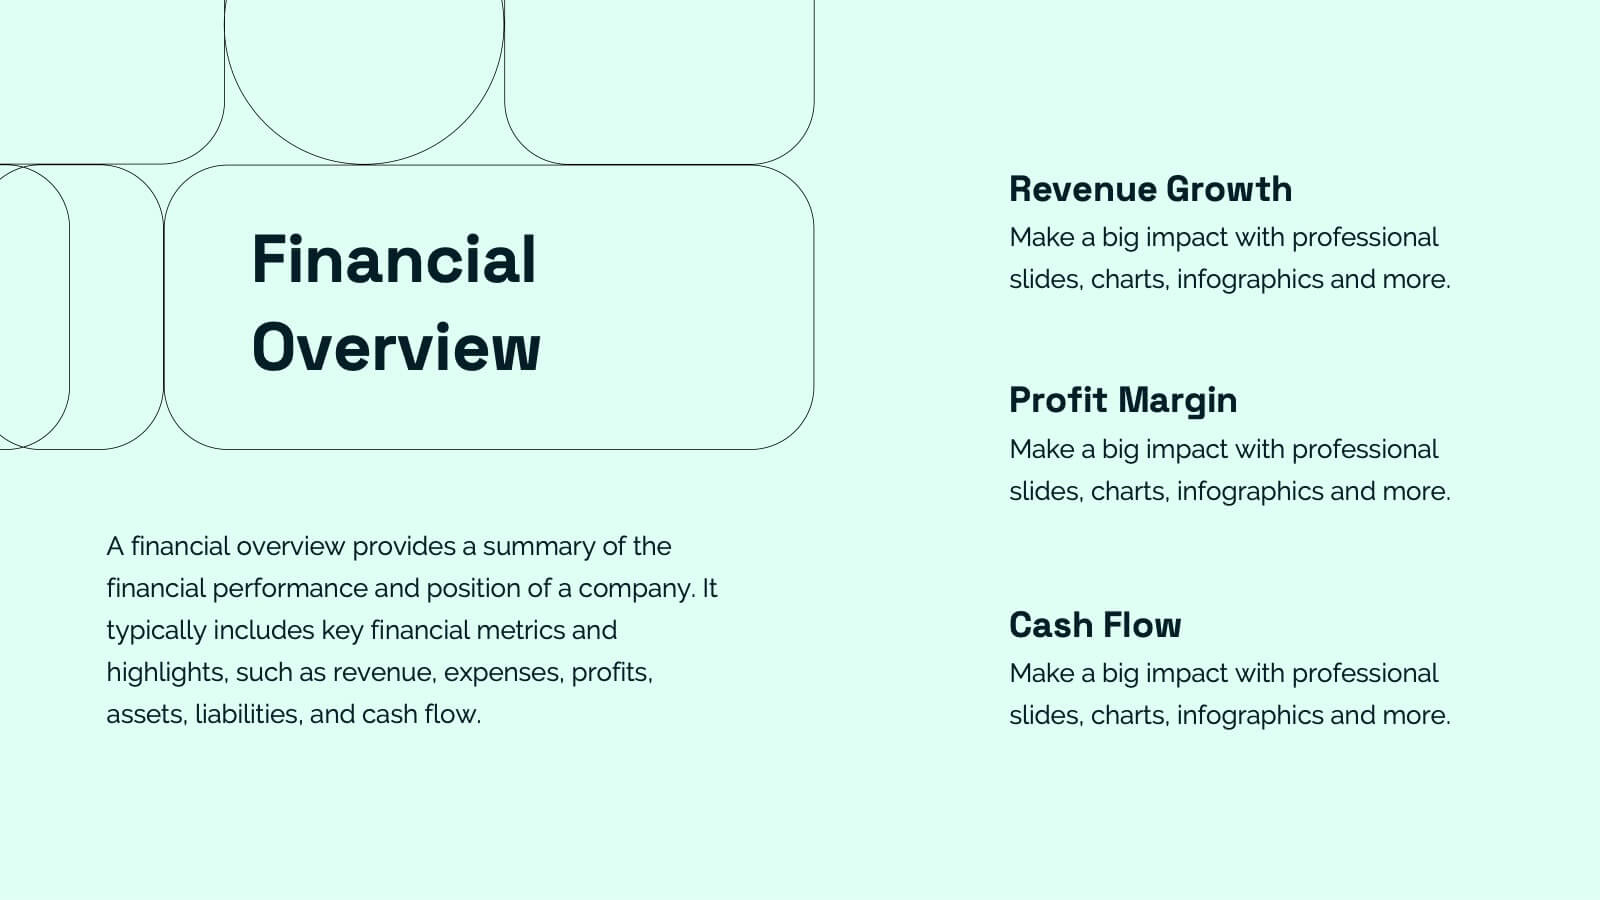
Modern Business Pitch Presentation
Stand out in any meeting with a sharp, minimalist design that brings your business story to life. This presentation is perfect for outlining goals, showcasing data, and pitching ideas with confidence. Fully editable and compatible with PowerPoint, Keynote, and Google Slides for easy, professional customization.


4 slides
Healthcare Impact on Breast Cancer Day Presentation
Educate and inspire with the Healthcare Impact on Breast Cancer Day Presentation. This thoughtfully designed layout uses meaningful visuals to highlight data, awareness efforts, and key messages around breast cancer healthcare. Ideal for awareness campaigns, health reports, or nonprofit presentations. Fully editable in PowerPoint, Google Slides, Keynote, and Canva.


8 slides
Cloud Data Storage and Security Presentation
Visualize cloud security effortlessly with this Cloud Data Storage and Security template. Designed for IT teams, cybersecurity professionals, and cloud architects, this slide simplifies complex data protection strategies, storage models, and access controls. Featuring a modern cloud-based layout with clear, structured elements, it ensures easy interpretation of key security components. Fully editable and compatible with PowerPoint, Keynote, and Google Slides for seamless presentations.


5 slides
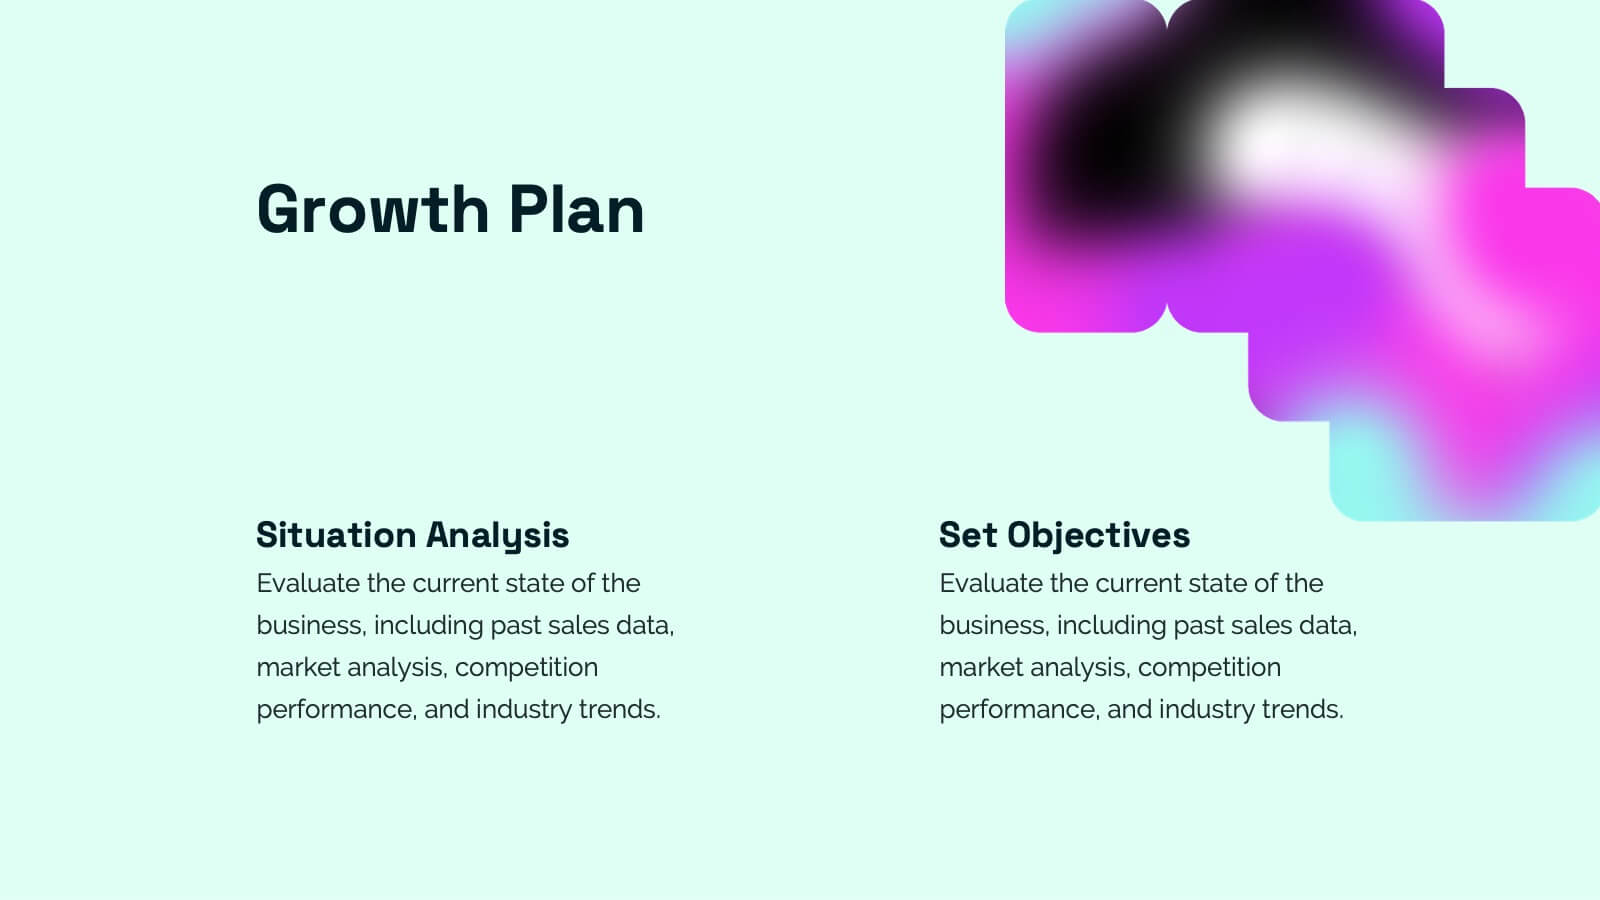
SMART Objectives Slide Presentation
Kick your planning into gear with a bold, structured layout that makes goal-setting feel energetic and achievable. This presentation helps you outline clear objectives, track progress, and communicate strategy with a clean, organized flow designed for teams and leaders. Fully compatible with PowerPoint, Keynote, and Google Slides.


4 slides
Value Creation Strategy Presentation
Develop impactful strategies with this Value Creation Strategy template. Designed to visualize key business components, it presents a structured approach to innovation, growth, and market positioning. Ideal for corporate planning and investor presentations, this template is fully compatible with PowerPoint, Keynote, and Google Slides for effortless customization.


5 slides
Clean Water Access and Sustainability Goals Presentation
Visually track progress with the Clean Water Access and Sustainability Goals Presentation. This intuitive slide design uses water-filled glasses to represent four stages of development, making it perfect for sustainability metrics, public health initiatives, or project benchmarks. Fully customizable and compatible with PowerPoint, Keynote, Google Slides, and Canva.


10 slides
Watercolor Texture Infographic
Watercolor texture refers to the visual and tactile effect created by the application of watercolor paint on paper or any other porous surface. This infographic template is a creative representation that incorporates watercolor textures and elements to convey information or data. This infographic is designed to engage viewers with its artistic and unique aesthetic while effectively presenting complex information in a simplified manner. This infographic features a white with watercolor background that sets the tone for the entire design. The soft, flowing, and colorful watercolor patterns create a visually appealing backdrop for the content.


6 slides
Optimizing Business Through Value Chain Presentation
Improve operational efficiency and gain competitive advantage with the Optimizing Business Through Value Chain Presentation. This template breaks down each segment of your business activities—from inbound logistics to service delivery—using a modern chain-style visual layout. Perfect for strategy meetings, operational planning, or business model analysis. Fully editable in PowerPoint, Keynote, Canva, and Google Slides.


10 slides
Cloud Computing IT Architecture
Showcase your cloud infrastructure with this layered circular diagram designed to highlight core services, storage, and computing components. Ideal for IT teams, SaaS providers, or tech consultants, these slides simplify complex cloud systems into 5 customizable sections. Fully editable in PowerPoint, Keynote, and Google Slides.


23 slides
Echo Startup Pitch Deck Template Presentation
This sleek pitch deck template is perfect for showcasing your startup’s potential. Highlight your problem, solutions, revenue model, and unique value proposition in a professional format. It's fully customizable, easy to use, and compatible with PowerPoint, Keynote, and Google Slides, making it ideal for impressing investors.


26 slides
Managing Work-Life Balance Presentation
Find harmony between career and personal life with this insightful presentation on managing work-life balance. Covering key strategies like time management, stress reduction, remote work efficiency, and self-care practices, this template helps promote productivity and well-being. Fully customizable and compatible with PowerPoint, Keynote, and Google Slides for a seamless and engaging presentation experience.
23 slides
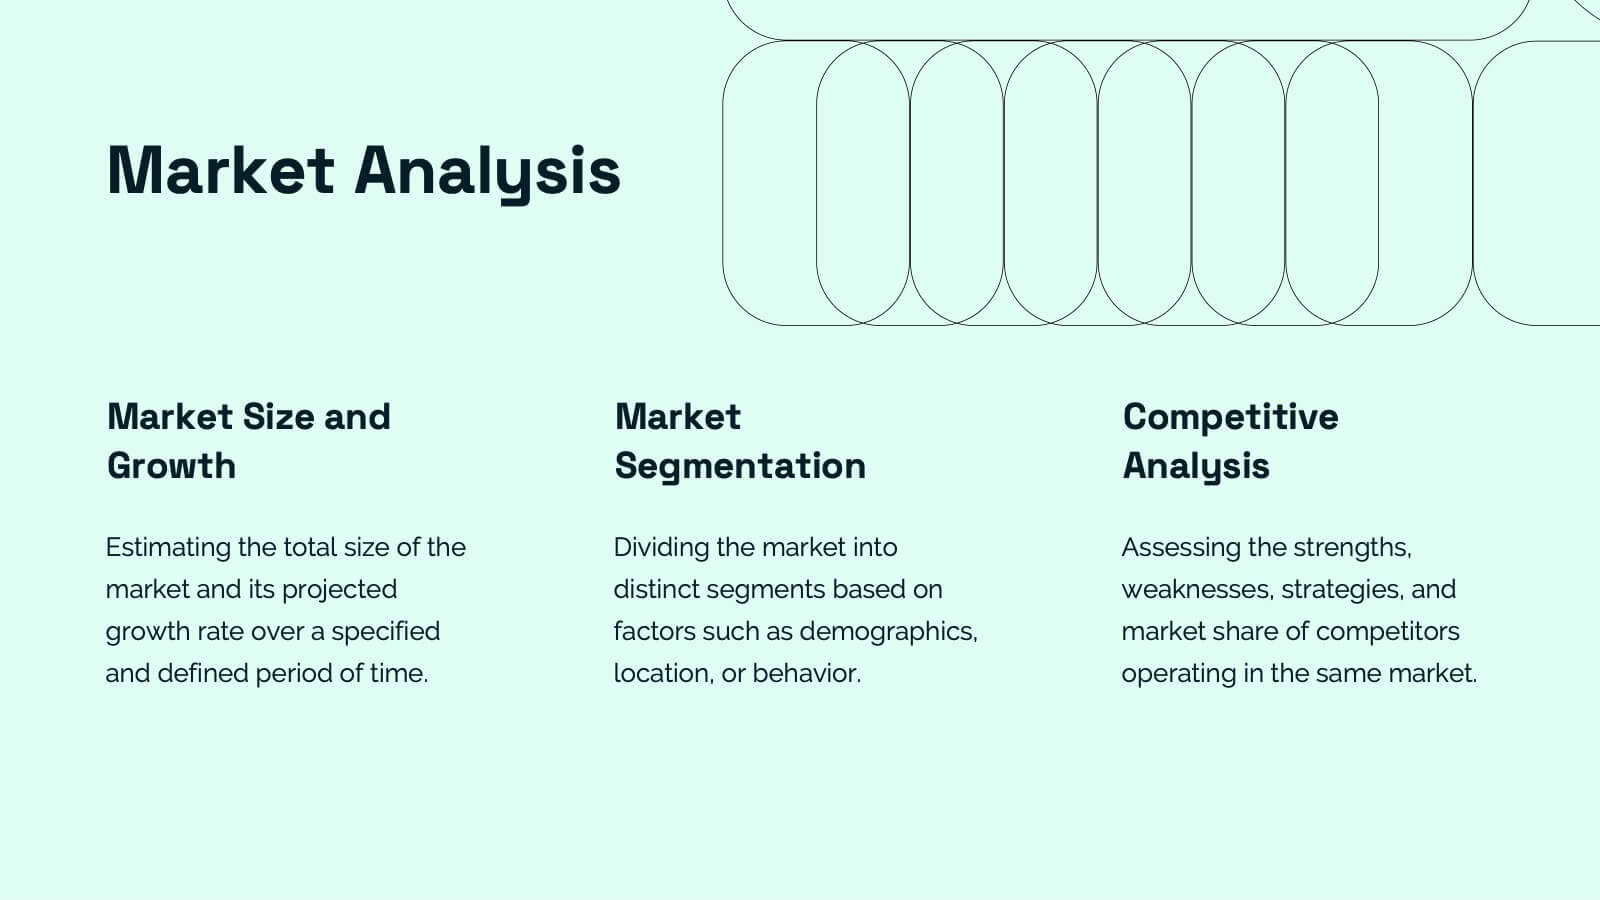
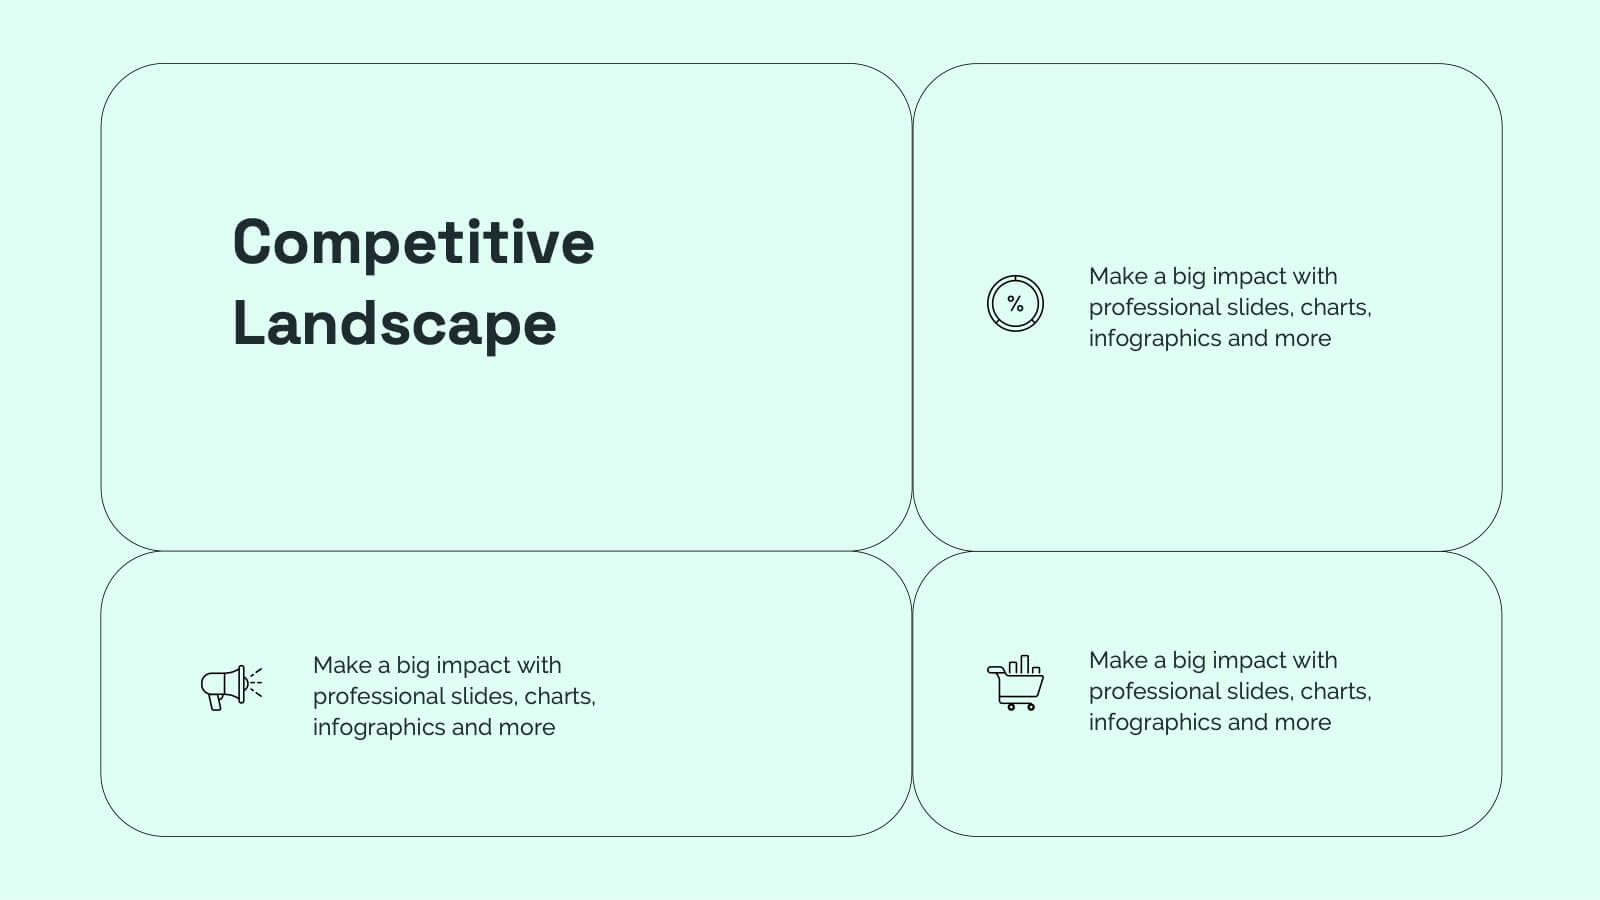
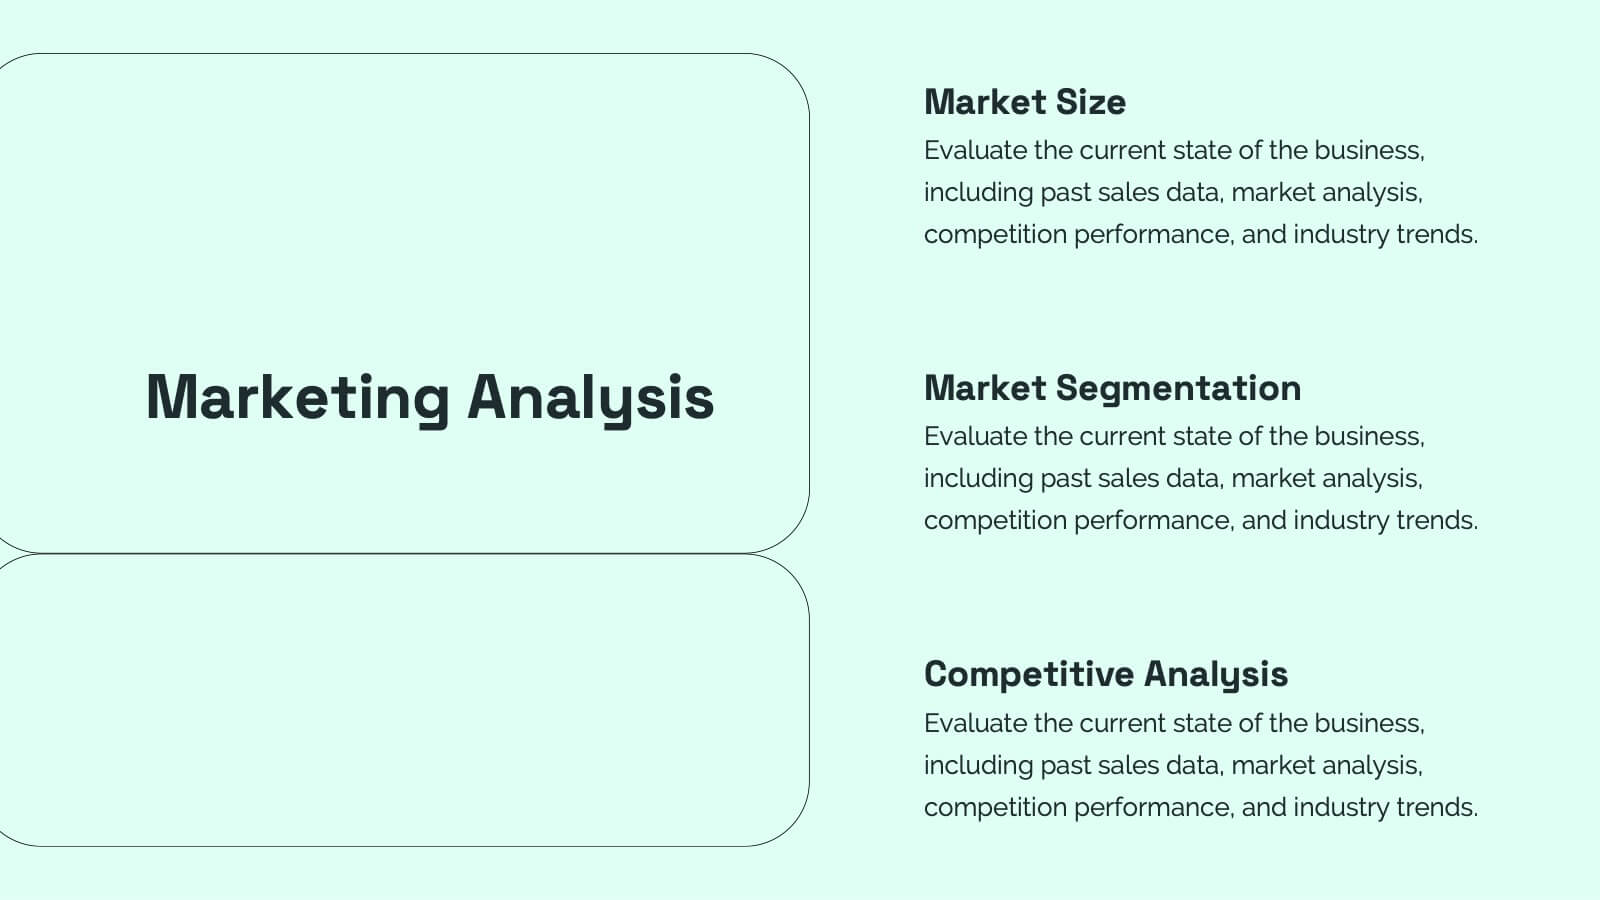
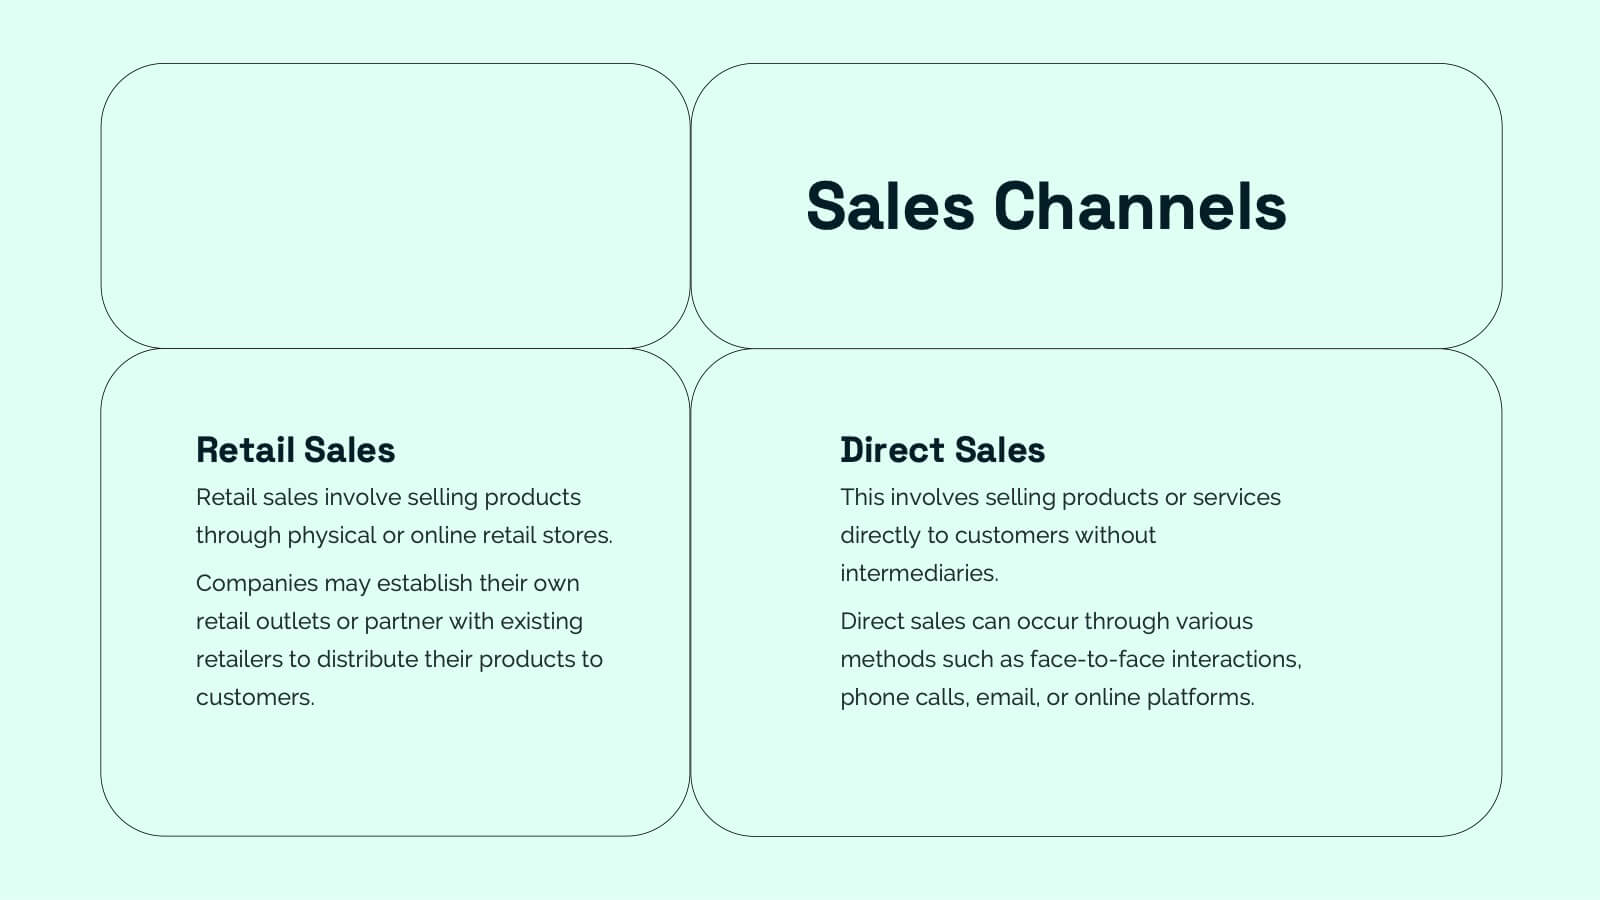
Nymph Startup Pitch Deck Presentation
This startup pitch deck template covers all the essentials for presenting a business. It includes slides for mission and vision, business model, market analysis, value proposition, and financial overview. Easily customizable for any startup industry, this modern design makes presenting your ideas a breeze. Compatible with PowerPoint, Keynote, and Google Slides.


3 slides
Medical Report Summary and Review Deck Presentation
Present health data clearly with this Medical Report Summary and Review Deck. Designed for healthcare professionals, this layout features checklist icons, charts, and clinical visuals to highlight reports or patient insights. Fully editable in PowerPoint, Keynote, and Google Slides, it ensures your medical updates remain professional, concise, and easy to follow.


6 slides
Environmental Scanning with PESTEL Model Presentation
Spot risks and opportunities early with the Environmental Scanning with PESTEL Model Presentation. Visually break down Political, Economic, Social, Technological, Environmental, and Legal factors using a modern, tree-style layout. Ideal for business forecasting, competitive analysis, or market entry reports. Easily customizable in PowerPoint, Canva, and Google Slides.


6 slides
Business Flow Chart Design Presentation
Bring clarity and momentum to your process with a clean, visual layout that turns complex steps into an easy-to-follow flow. This presentation helps teams map stages, responsibilities, and progress with confidence, making it perfect for planning, strategy, and operations. Fully compatible with PowerPoint, Keynote, and Google Slides.


5 slides
Fashion Design Infographics
Fashion Design is the art of creating clothing and accessories, incorporating elements of style, aesthetics, and functionality. These infographic templates offer a visually captivating and informative way to present key concepts, trends, and insights in the world of fashion design. This template is ideal for fashion designers, students, industry professionals, or anyone interested in sharing knowledge about fashion design principles, fashion history, or emerging trends. Featuring a stylish design that reflects the creative and dynamic nature of the fashion industry. This allows for easy customization and seamless integration of your fashion-related content.