


Features
- 6 Unique slides
- Fully editable and easy to edit in Microsoft Powerpoint, Keynote and Google Slides
- 16:9 widescreen layout
- Clean and professional designs
- Export to JPG, PDF or send by email


Do you have any questions?
Recommend


4 slides
Team and Department Setup Structure Presentation
Organize your team with clarity using the Team and Department Setup Structure Presentation. This template is perfect for showcasing internal team hierarchies, departmental layouts, or functional groupings in a clean and professional layout. Each slide is fully customizable, allowing you to edit icons, titles, and structure to suit your organization. Compatible with Canva, PowerPoint, Keynote, and Google Slides.


5 slides
Closing Slide with Key Takeaways Presentation
Conclude your presentation with impact using the Closing Slide with Key Takeaways Presentation. This streamlined design features a bold visual flow to emphasize up to five main points, ensuring your audience walks away with clear, memorable insights. Ideal for summarizing findings, next steps, or action items. Fully customizable and works seamlessly with PowerPoint, Keynote, and Google Slides.


5 slides
Multi-Level Concentric Circles Framework Presentation
Visualize relationships and layered strategies with the Multi-Level Concentric Circles Framework Presentation. This template uses interlinked circular nodes to represent multi-tier systems, process flows, or strategic components in an intuitive layout. Easily editable in PowerPoint, Keynote, and Google Slides for seamless integration into your presentations.


7 slides
Project Gantt Charts Infographic Presentation
A Gantt chart is a graphical representation of project activities in a table format, where time is represented on the horizontal axis and work on the vertical axis. Gantt charts are useful for project workflow, but if you don’t know how to create them, finding alternatives can be time consuming. Our template makes it easy to create your own in minutes! This infographic template will ensure that your milestones and critical tasks are completed by deadlines, and help you track progress towards your overall project goals. Just download and edit in PowerPoint, Keynote, or Google Sheets.


6 slides
Network Security Infographics
Strengthen your understanding of Network Security with our customizable infographic template. This template is fully compatible with popular presentation software like PowerPoint, Keynote, and Google Slides, allowing you to easily customize it to illustrate and communicate various aspects of network security. The Network Security infographic template offers a visually engaging platform to explore and explain the importance of protecting digital information, securing networks, and preventing cyber threats. Whether you're an IT professional, business owner, or simply interested in cybersecurity, this template provides a user-friendly canvas to create informative presentations and educational materials. Enhance your knowledge of Network Security with this SEO-optimized infographic template, thoughtfully designed for clarity and ease of use. Customize it to highlight key concepts, security measures, best practices, and the evolving landscape of cybersecurity, ensuring that your audience gains valuable insights into this critical field. Start crafting your personalized infographic today to fortify your understanding of Network Security.


26 slides
Coffee Shop Warm Company Profile Presentation
Coffee shops have become an important part of modern culture, especially in urban areas, and they come in various styles and themes. This presentation template is designed to bring the essence of your coffee haven to life. From the first sip to the last drop, let this presentation showcase the soul-warming experience your coffee shop provides. Fully customizable and compatible with Powerpoint, Keynote, and Google Slides. Utilize warm colors like browns, oranges, and yellows to evoke a cozy, comforting atmosphere. The template integrates coffee cup icons, latte art, and coffee bean graphics for a coffee-centric theme.


7 slides
Customer Service Profile Infographic Presentation
A Customer Profile infographic is a visual representation of a target customer or customer segment that provides important information about their demographics, behavior, preferences, and needs. This template can help businesses and organizations understand their customers better, tailor their products or services to meet their needs, and develop effective marketing strategies. This template can be used for various purposes, such as to guide product development, to inform marketing campaigns, or to improve customer service. This template is compatible with Powerpoint, keynote and google slides.
22 slides
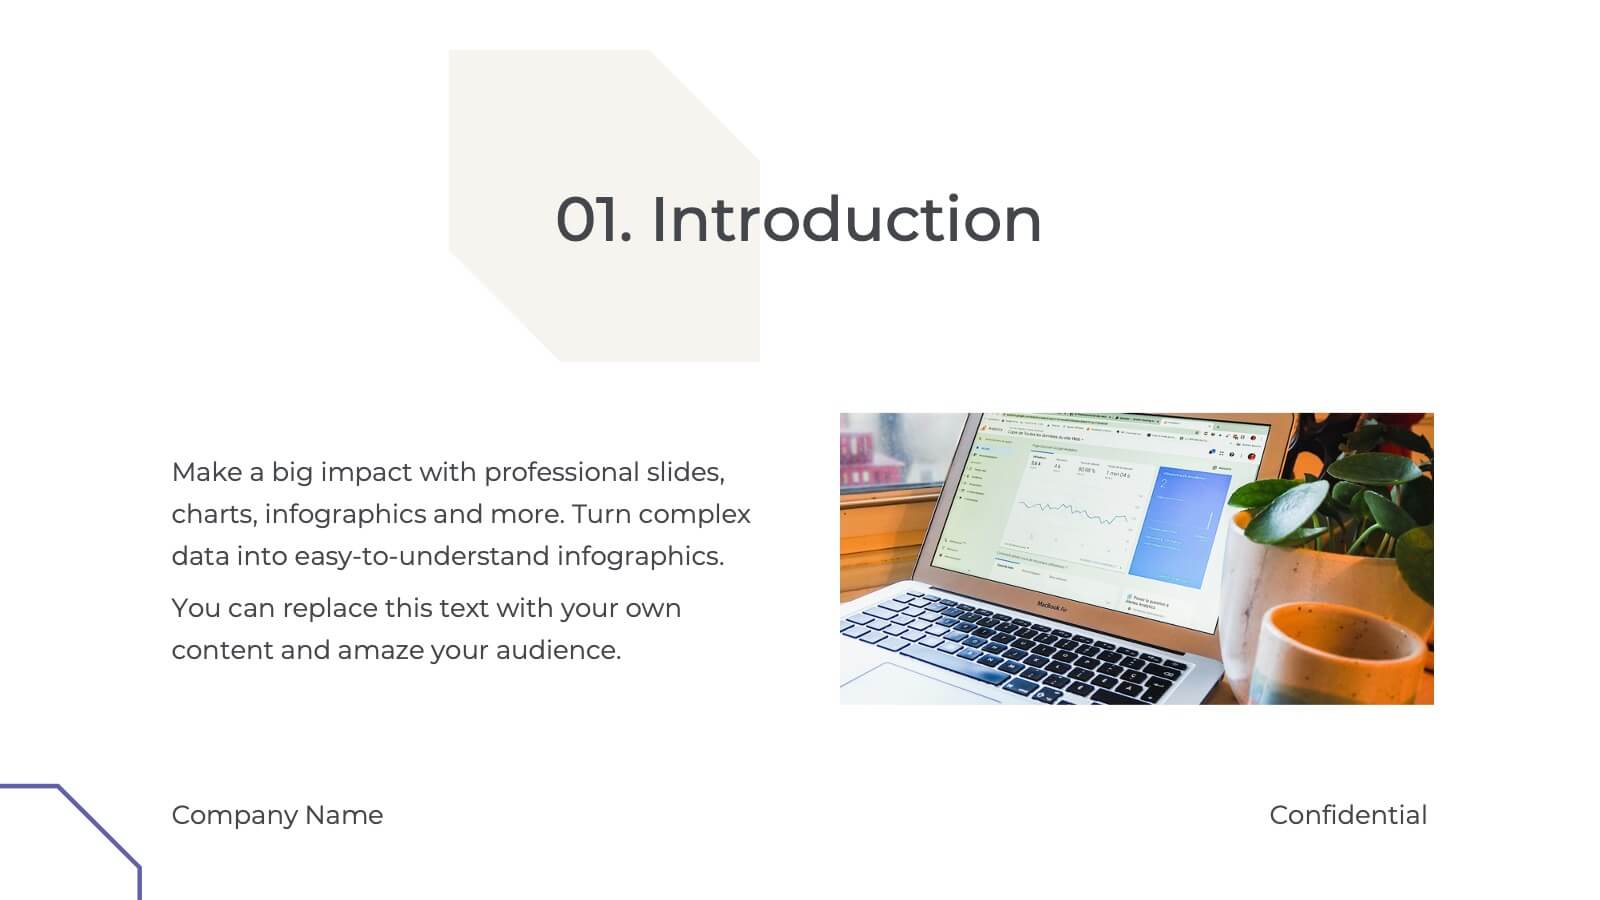
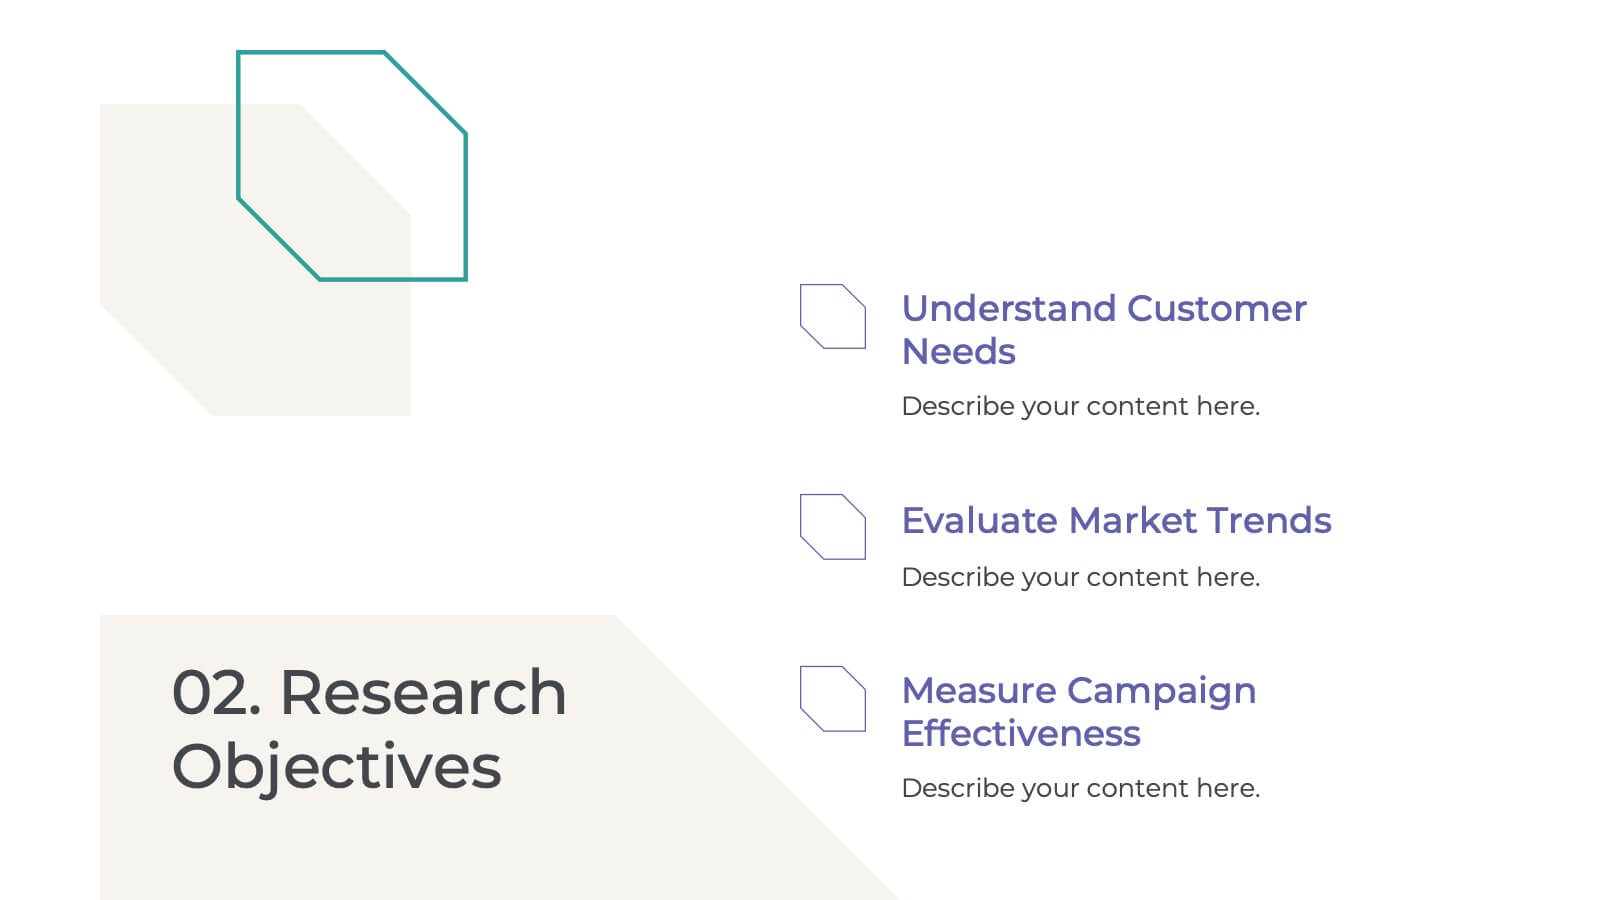
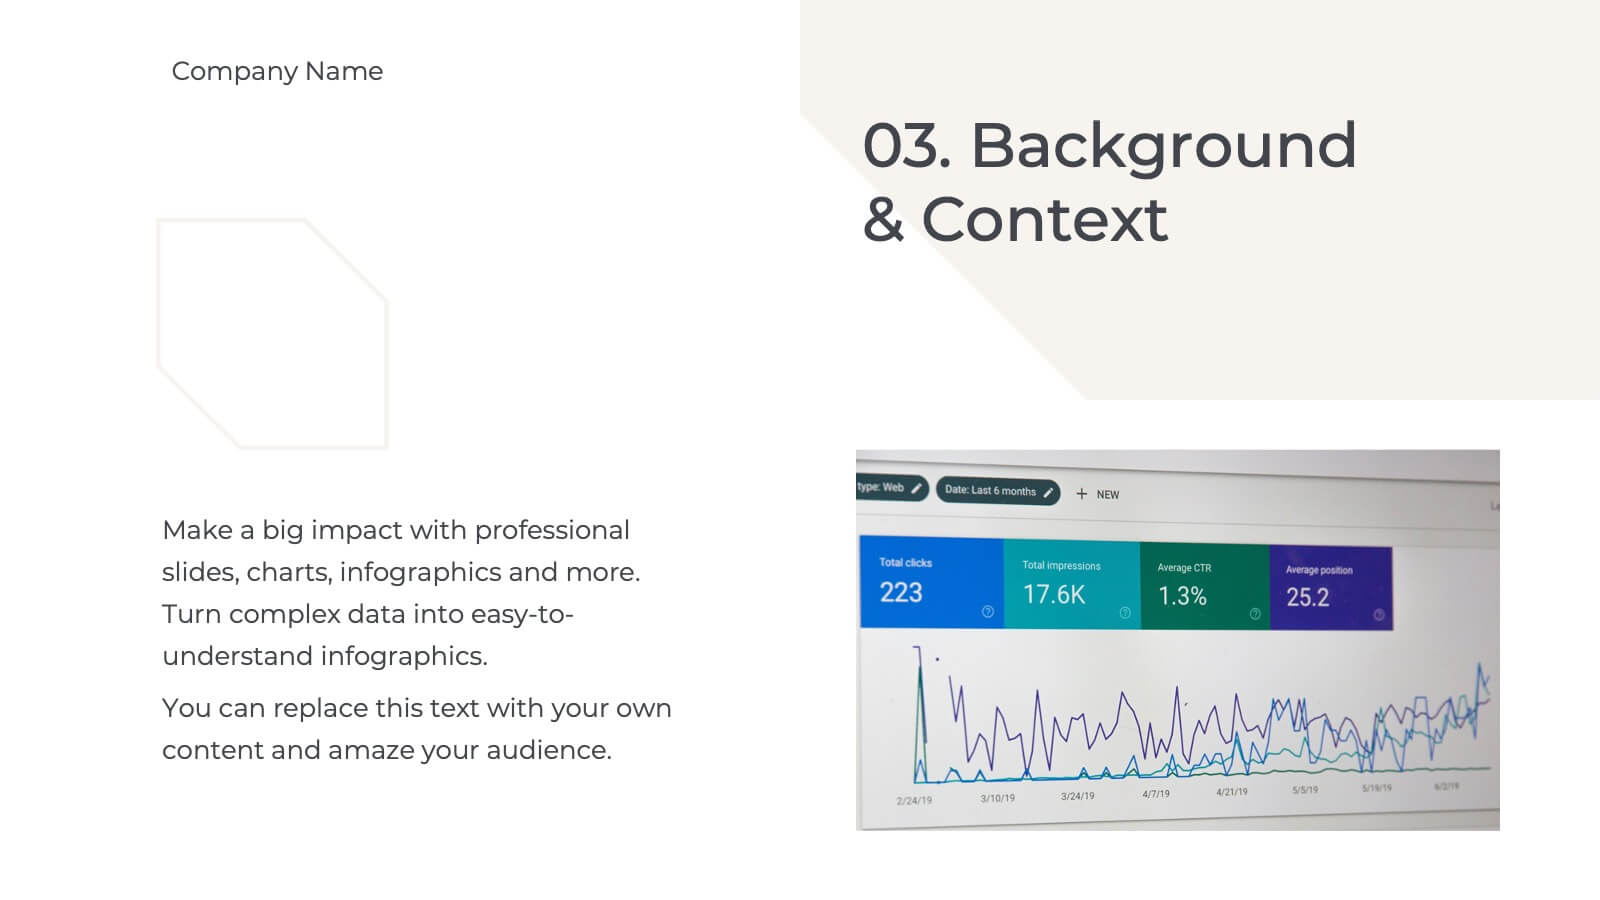
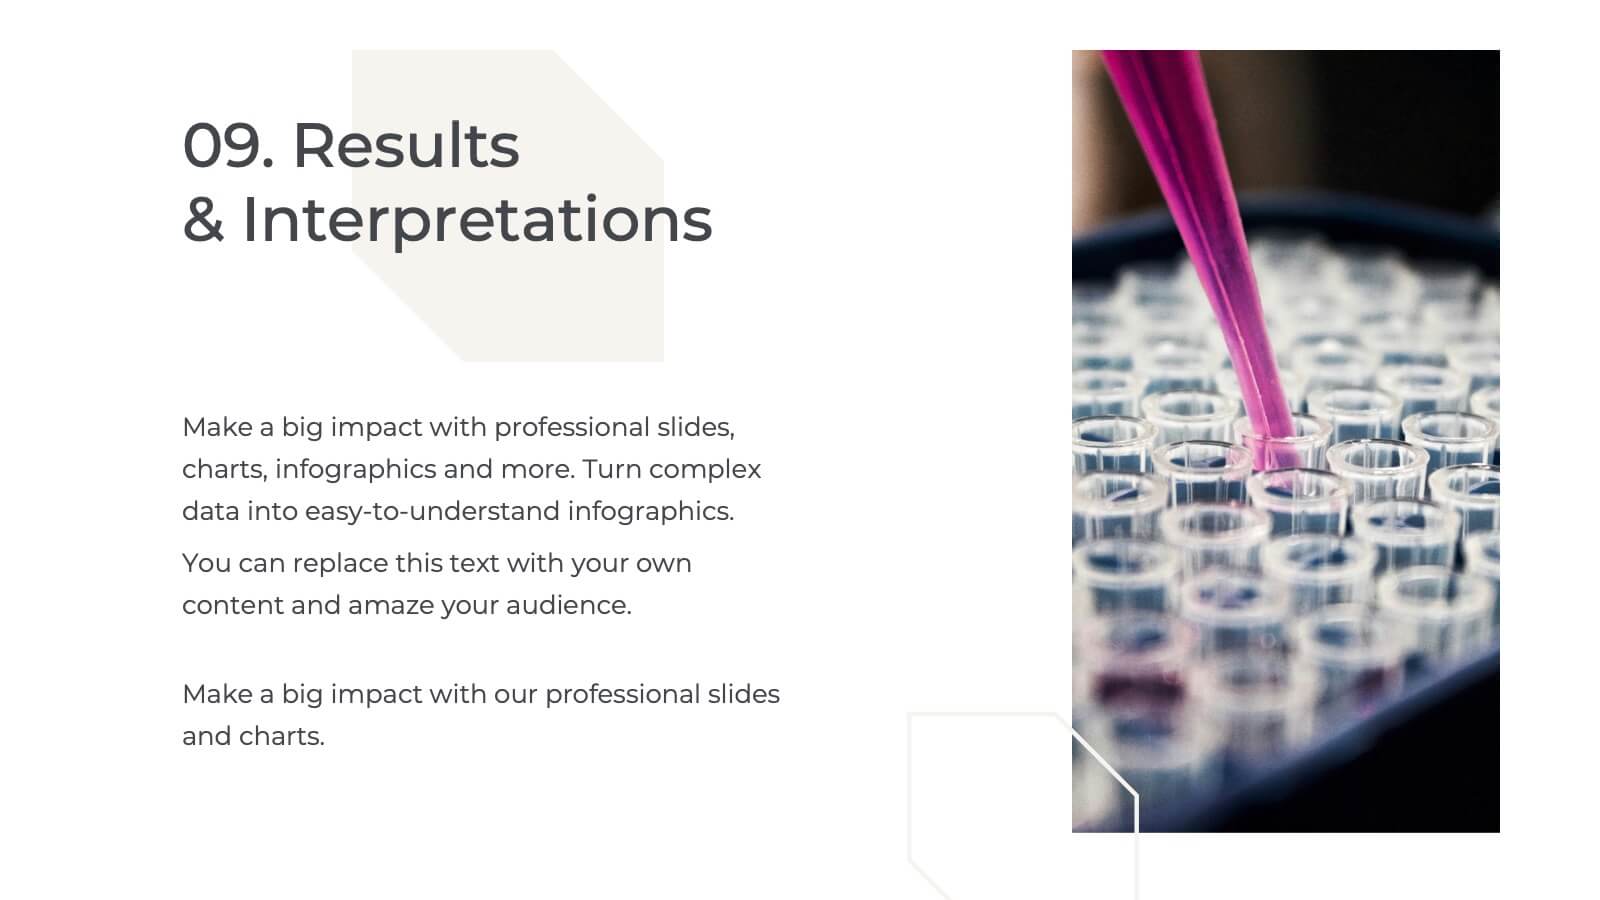
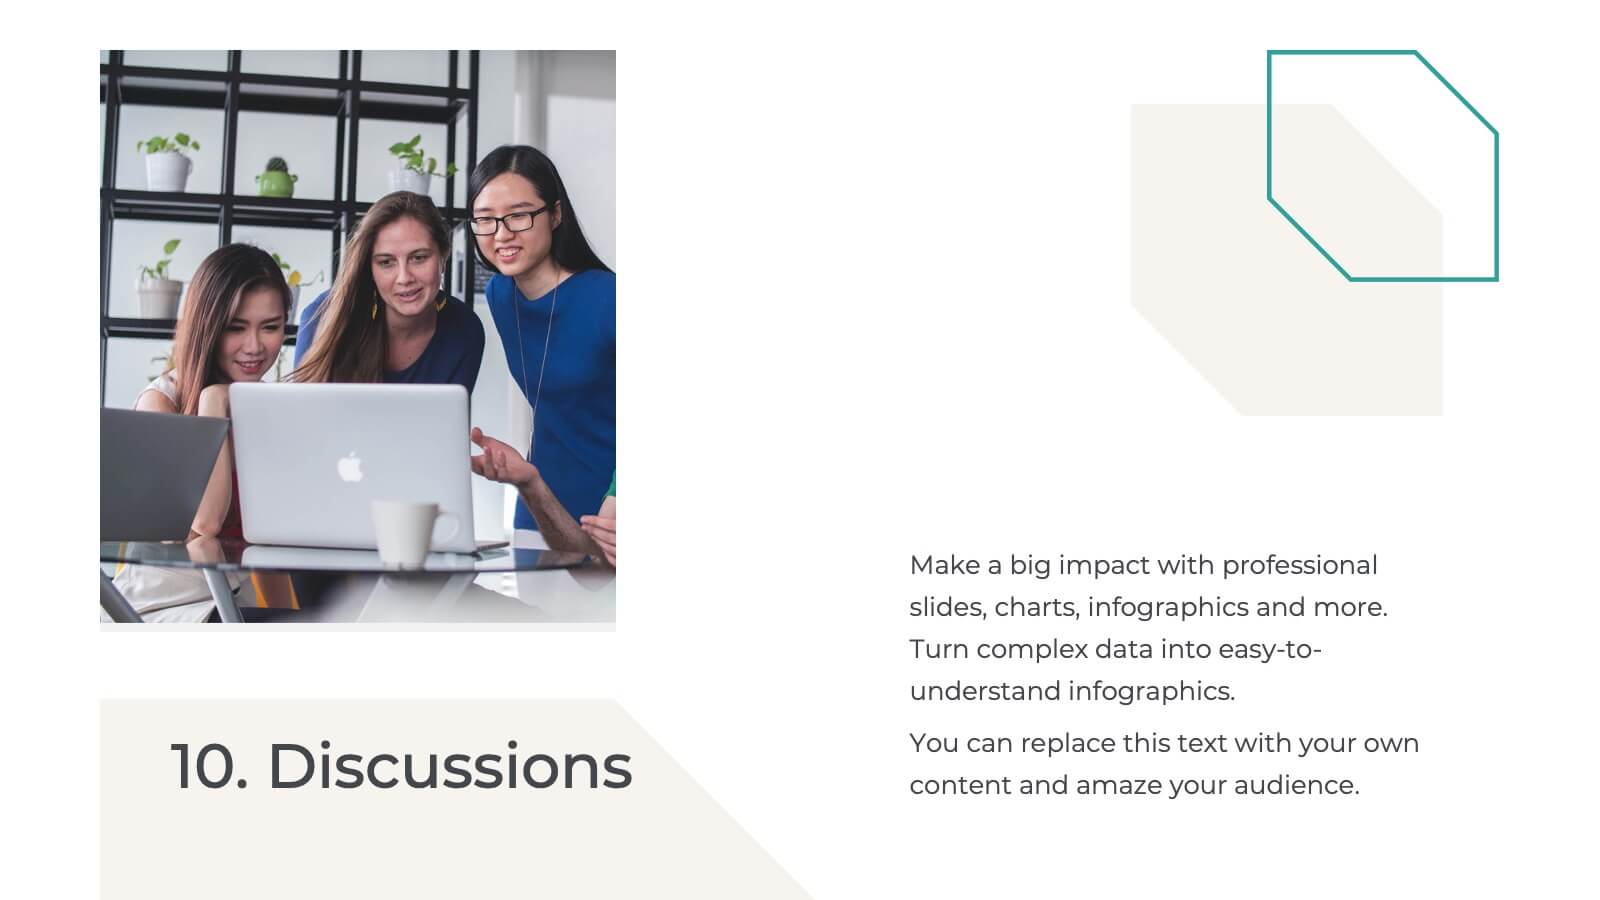
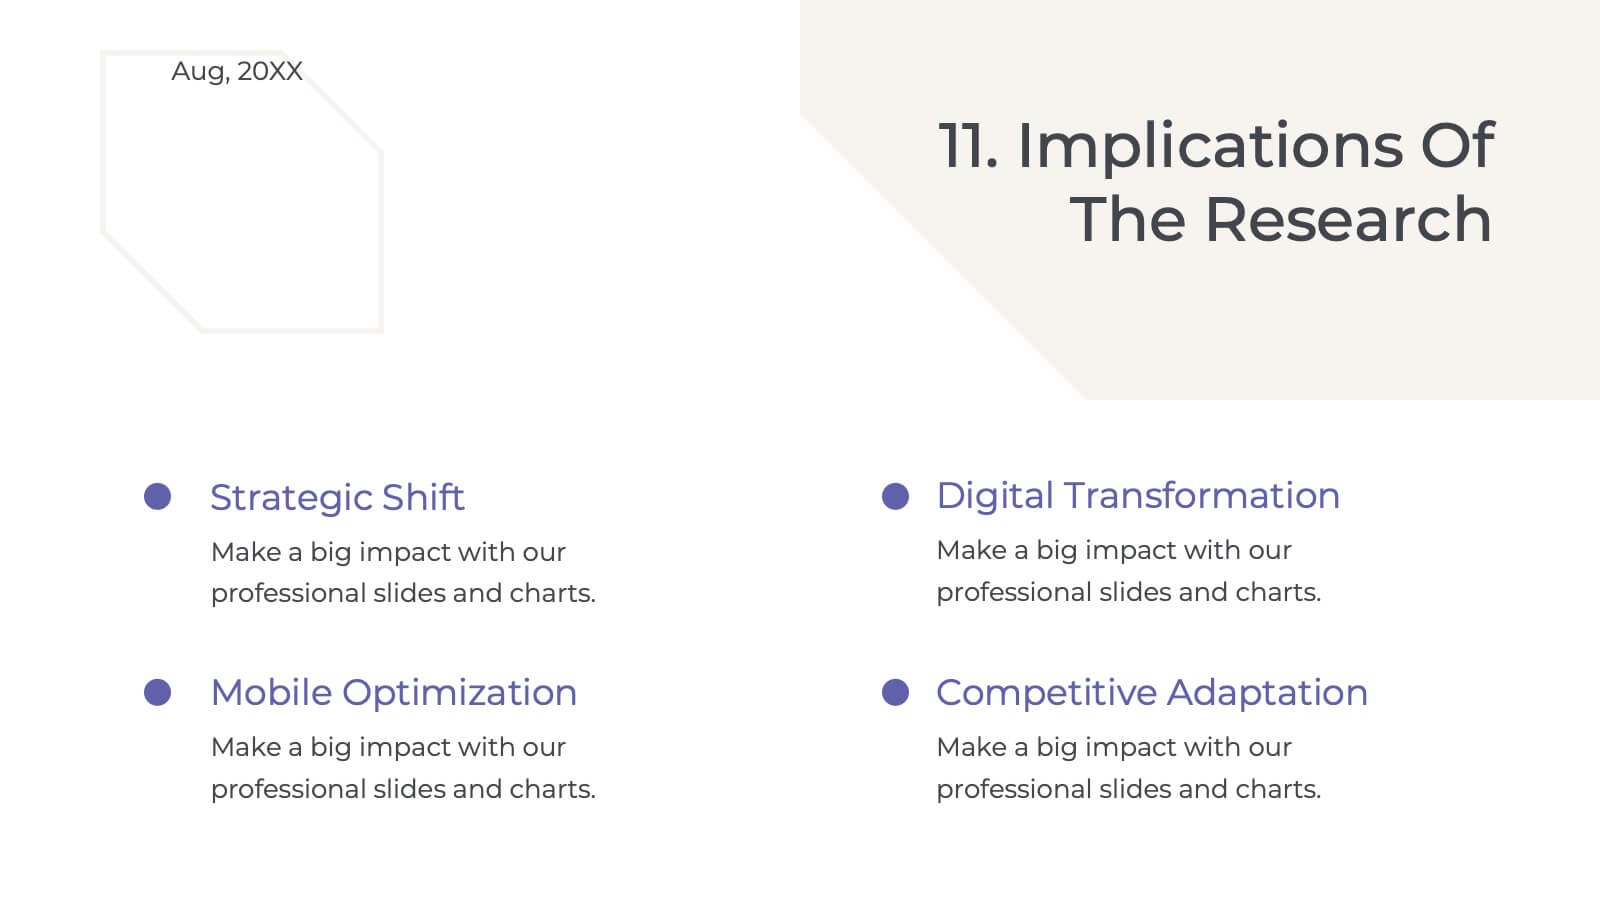
Palladium Qualitative Research Findings Presentation
Present your qualitative research findings effectively with this sleek, professional template. It includes sections for objectives, data analysis, key findings, and recommendations. Ideal for organizing research insights clearly, it's customizable and compatible with PowerPoint, Keynote, and Google Slides, ensuring smooth collaboration and impactful presentations for your audience.


22 slides
Quantum Scientific Research Presentation
Present your scientific research with this comprehensive and professional template! Perfect for detailing research objectives, methodology, and key findings. Ideal for researchers and academics aiming to share their work clearly and effectively. Compatible with PowerPoint, Keynote, and Google Slides, this template ensures your scientific presentations are thorough, engaging, and visually appealing.


6 slides
Pillar Foundation Infographics
Gain insights into Pillar Foundation construction with our customizable infographic template. This template is fully compatible with popular presentation software like PowerPoint, Keynote, and Google Slides, allowing you to easily customize it to illustrate and communicate the key aspects and principles of pillar foundation construction. The Pillar Foundation infographic template offers a visually engaging platform to explore and explain the construction process, types of pillars, materials used, and the significance of pillars in building stability. Whether you're a construction professional, architect, engineer, or simply interested in construction techniques, this template provides a user-friendly canvas to create informative presentations and educational materials. Deepen your knowledge of Pillar Foundation construction with this SEO-optimized infographic template, thoughtfully designed for clarity and ease of use. Customize it to showcase foundation types, construction steps, reinforcement methods, and the role of pillars in supporting structures, ensuring that your audience gains valuable insights into this crucial aspect of construction. Start crafting your personalized infographic today to delve into the world of Pillar Foundation construction.


5 slides
SWOT Matrix Diagram Presentation
Showcase key business insights with this SWOT Matrix Diagram Presentation. This clear 4-quadrant layout helps visualize your organization's Strengths, Weaknesses, Opportunities, and Threats, making it ideal for strategic planning, competitor analysis, or internal reviews. Each section includes icons and editable text placeholders for easy customization. Fully compatible with PowerPoint, Keynote, and Google Slides.


4 slides
KPI and Business Performance Dashboard
Drive strategic insights with this sleek KPI and business dashboard template. Highlight key metrics, trends, and performance results using easy-to-read graphs and organized data sections. Perfect for management reports, executive summaries, and project tracking. Fully editable in PowerPoint, Keynote, and Google Slides.


5 slides
Global Warming Impacts Infographics
Global Warming refers to the long-term increase in Earth's average surface temperature due to human activities, primarily the emission of greenhouse gases. This is a visually engaging infographic template that highlights the impacts of global warming on the environment, ecosystems, and human societies. This template is made to create an understanding of the consequences of climate change and raise awareness about the urgent need for action. The eye-catching visuals and impactful messaging, make these infographics ideal for presentations, educational material, or awareness campaigns related to global warming and environmental sustainability.


6 slides
Customer Feedback Insights Chart Presentation
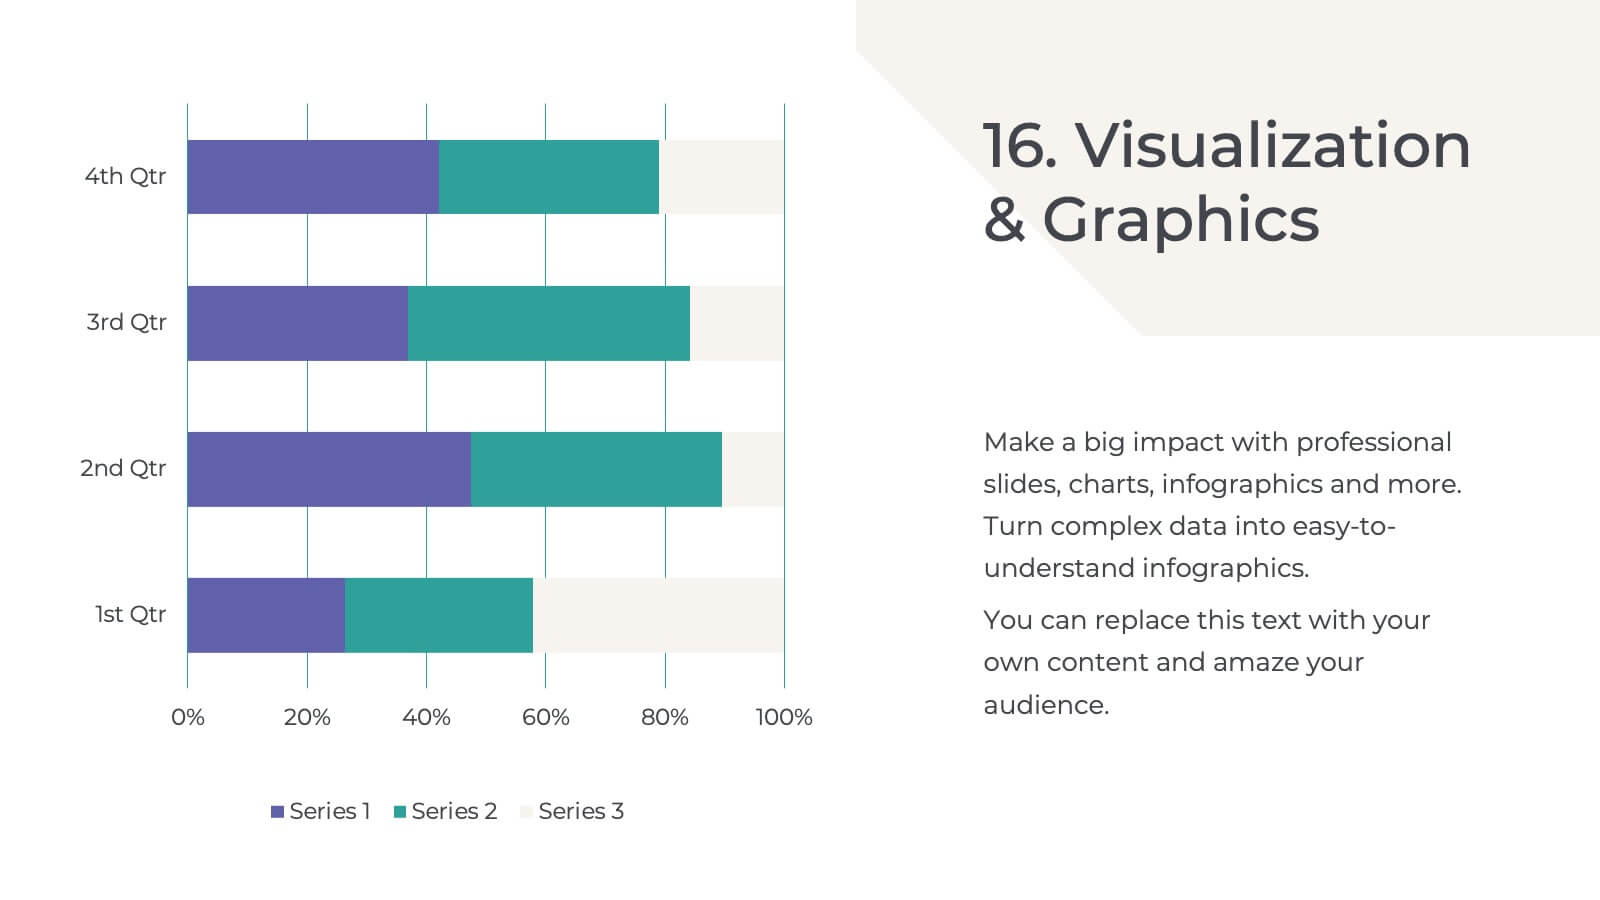
Visualize feedback data effectively with this sleek, horizontal bar chart layout. Highlight percentages per category with bold labels and color accents to emphasize results. Ideal for surveys, product reviews, or satisfaction ratings. Fully customizable in Canva, PowerPoint, or Google Slides for a professional, easy-to-read presentation experience.


5 slides
Hierarchical Pyramid Diagram Presentation
The "Hierarchical Pyramid Diagram Presentation" template is designed to effectively represent organizational structures, data hierarchies, or step-by-step processes. This versatile template features a layered pyramid structure, enabling clear visualization of relationships and dependencies between different levels or components within a system. Ideal for business presentations, strategy discussions, and educational materials, this template aids in conveying complex information in a straightforward and visually appealing manner. The use of distinct colors for each level enhances readability, making it easier to identify and discuss each segment in detail during presentations.


6 slides
Simple Horizontal Timeline Design Presentation
Bring your story to life with a smooth, step-by-step visual that guides viewers through key events with clarity and ease. This presentation helps you outline timelines, processes, or project stages in a clean horizontal flow that’s simple to follow and easy to customize. Fully compatible with PowerPoint, Keynote, and Google Slides.


20 slides
Nightshade Design Portfolio Presentation
The Design Portfolio Presentation Template offers 20 slides to showcase your creative work, including design briefs, elements, processes, and feedback. Perfect for professionals to highlight projects with a modern, vibrant layout. Fully editable and compatible with PowerPoint, Keynote, and Google Slides.