


Features
- 4 Unique slides
- Fully editable and easy to edit in Microsoft Powerpoint, Keynote and Google Slides
- 16:9 widescreen layout
- Clean and professional designs
- Export to JPG, PDF or send by email


Do you have any questions?
Recommend


7 slides
Business Model Canvas Segments Infographic Presentation
The Business Model Canvas is a strategic management and entrepreneurial tool that helps businesses to visualize, analyze, and develop their business models. This template gives you the ability to create a visually attractive infographic while presenting your business model in a professional format. This eye-catching template is made to help your audience visualize the business model you are presenting and easily follow it with the instructive text slides. Customize this template in just a couple of minutes. Simple and easy to use, ready to be edited with colors and graphics of your choice.


4 slides
Service Plan Pricing Matrix Presentation
Present your pricing options clearly with this Service Plan Pricing Matrix Presentation. Designed for easy comparison, this layout highlights four tiers—Basic, Standard, Professional, and Expert—with bold pricing, checklists, and CTA buttons. Ideal for service providers, SaaS, and agencies. Fully editable in Canva, PowerPoint, Keynote, and Google Slides.


4 slides
ABC Learning Slide Deck Presentation
Kickstart your ideas with a playful, rocket-shaped layout that turns simple ABC steps into a clear, engaging story. This presentation helps break down processes, lessons, or concepts in a way that feels intuitive and dynamic. Fully customizable and compatible with PowerPoint, Keynote, and Google Slides.


5 slides
Human Resource Functions Infographics
Illuminate the complexities of people management with our human resource functions infographics template. Cast in the professional yet warm palette of black, orange, pink, and red, this template is an essential tool for HR professionals, corporate trainers, and business leaders. It elegantly dissects various HR realms with its sleek graphics, intuitive icons, and dedicated image placeholders, making it perfect for showcasing recruitment processes, employee engagement strategies, or organizational culture principles. Its creative, vertical style is designed to hold the attention and fuel the imagination, turning any HR presentation into a compelling narrative.


6 slides
Digital Mockup Infographic
This collection of digital mockup templates is expertly designed to showcase your digital products and services with clarity and impact. Whether you are presenting an app, website, or any other digital interface, these templates provide the perfect backdrop, illustrating how your designs perform across different devices such as smartphones, tablets, and desktop computers. The clean, modern aesthetic of each mockup is coupled with a user-friendly layout that emphasizes ease of use and visual appeal. The subtle color palettes and strategic use of space ensure that your product stands out, making these mockups a valuable tool for professionals in software development, digital marketing, and graphic design. Customizable elements allow you to adapt each template to fit your specific project needs, making it straightforward to insert your own screenshots and text. Use these mockups in client presentations, marketing materials, or portfolio showcases to communicate the functionality and aesthetics of your digital products effectively.


4 slides
Simple Title Page Design Presentation
Make a memorable first impression with a clean, modern title design that instantly draws attention. Ideal for creative portfolios, business reports, or marketing decks, this layout combines strong typography with sleek visuals for a professional look. Fully editable in PowerPoint, Keynote, and Google Slides for complete flexibility.


3 slides
Stock Market Performance Overview Presentation
Showcase financial growth like a pro with this clean, data-driven layout designed to visualize performance, market activity, and business progress over time. Ideal for professionals presenting key financial trends, metrics, or strategies. Fully compatible with PowerPoint, Keynote, and Google Slides for easy customization and professional presentation results.


8 slides
3-Layered Circular Logic Presentation
Visualize layered processes with this 3-step circular logic diagram. Perfect for illustrating progressive systems, tiered strategies, or interrelated components. Each ring represents a distinct phase, complete with editable icons and text. Compatible with PowerPoint, Keynote, and Google Slides—ideal for business models, strategic frameworks, or simplified logic breakdowns.


8 slides
Green Business Sustainability Strategy Presentation
Promote eco-friendly business strategies with the Green Business Sustainability Strategy infographic. Featuring a circular flow diagram, this template highlights key sustainable initiatives, resource management, and environmental impact strategies. Fully editable and compatible with PowerPoint, Keynote, and Google Slides.


5 slides
Public Health Data Presentation
Bright visuals and clean data blocks make this slide an energizing way to present key insights, instantly pulling viewers into the story behind your metrics. It helps simplify complex information while keeping everything clear, structured, and easy to follow. Fully compatible with PowerPoint, Keynote, and Google Slides.


21 slides
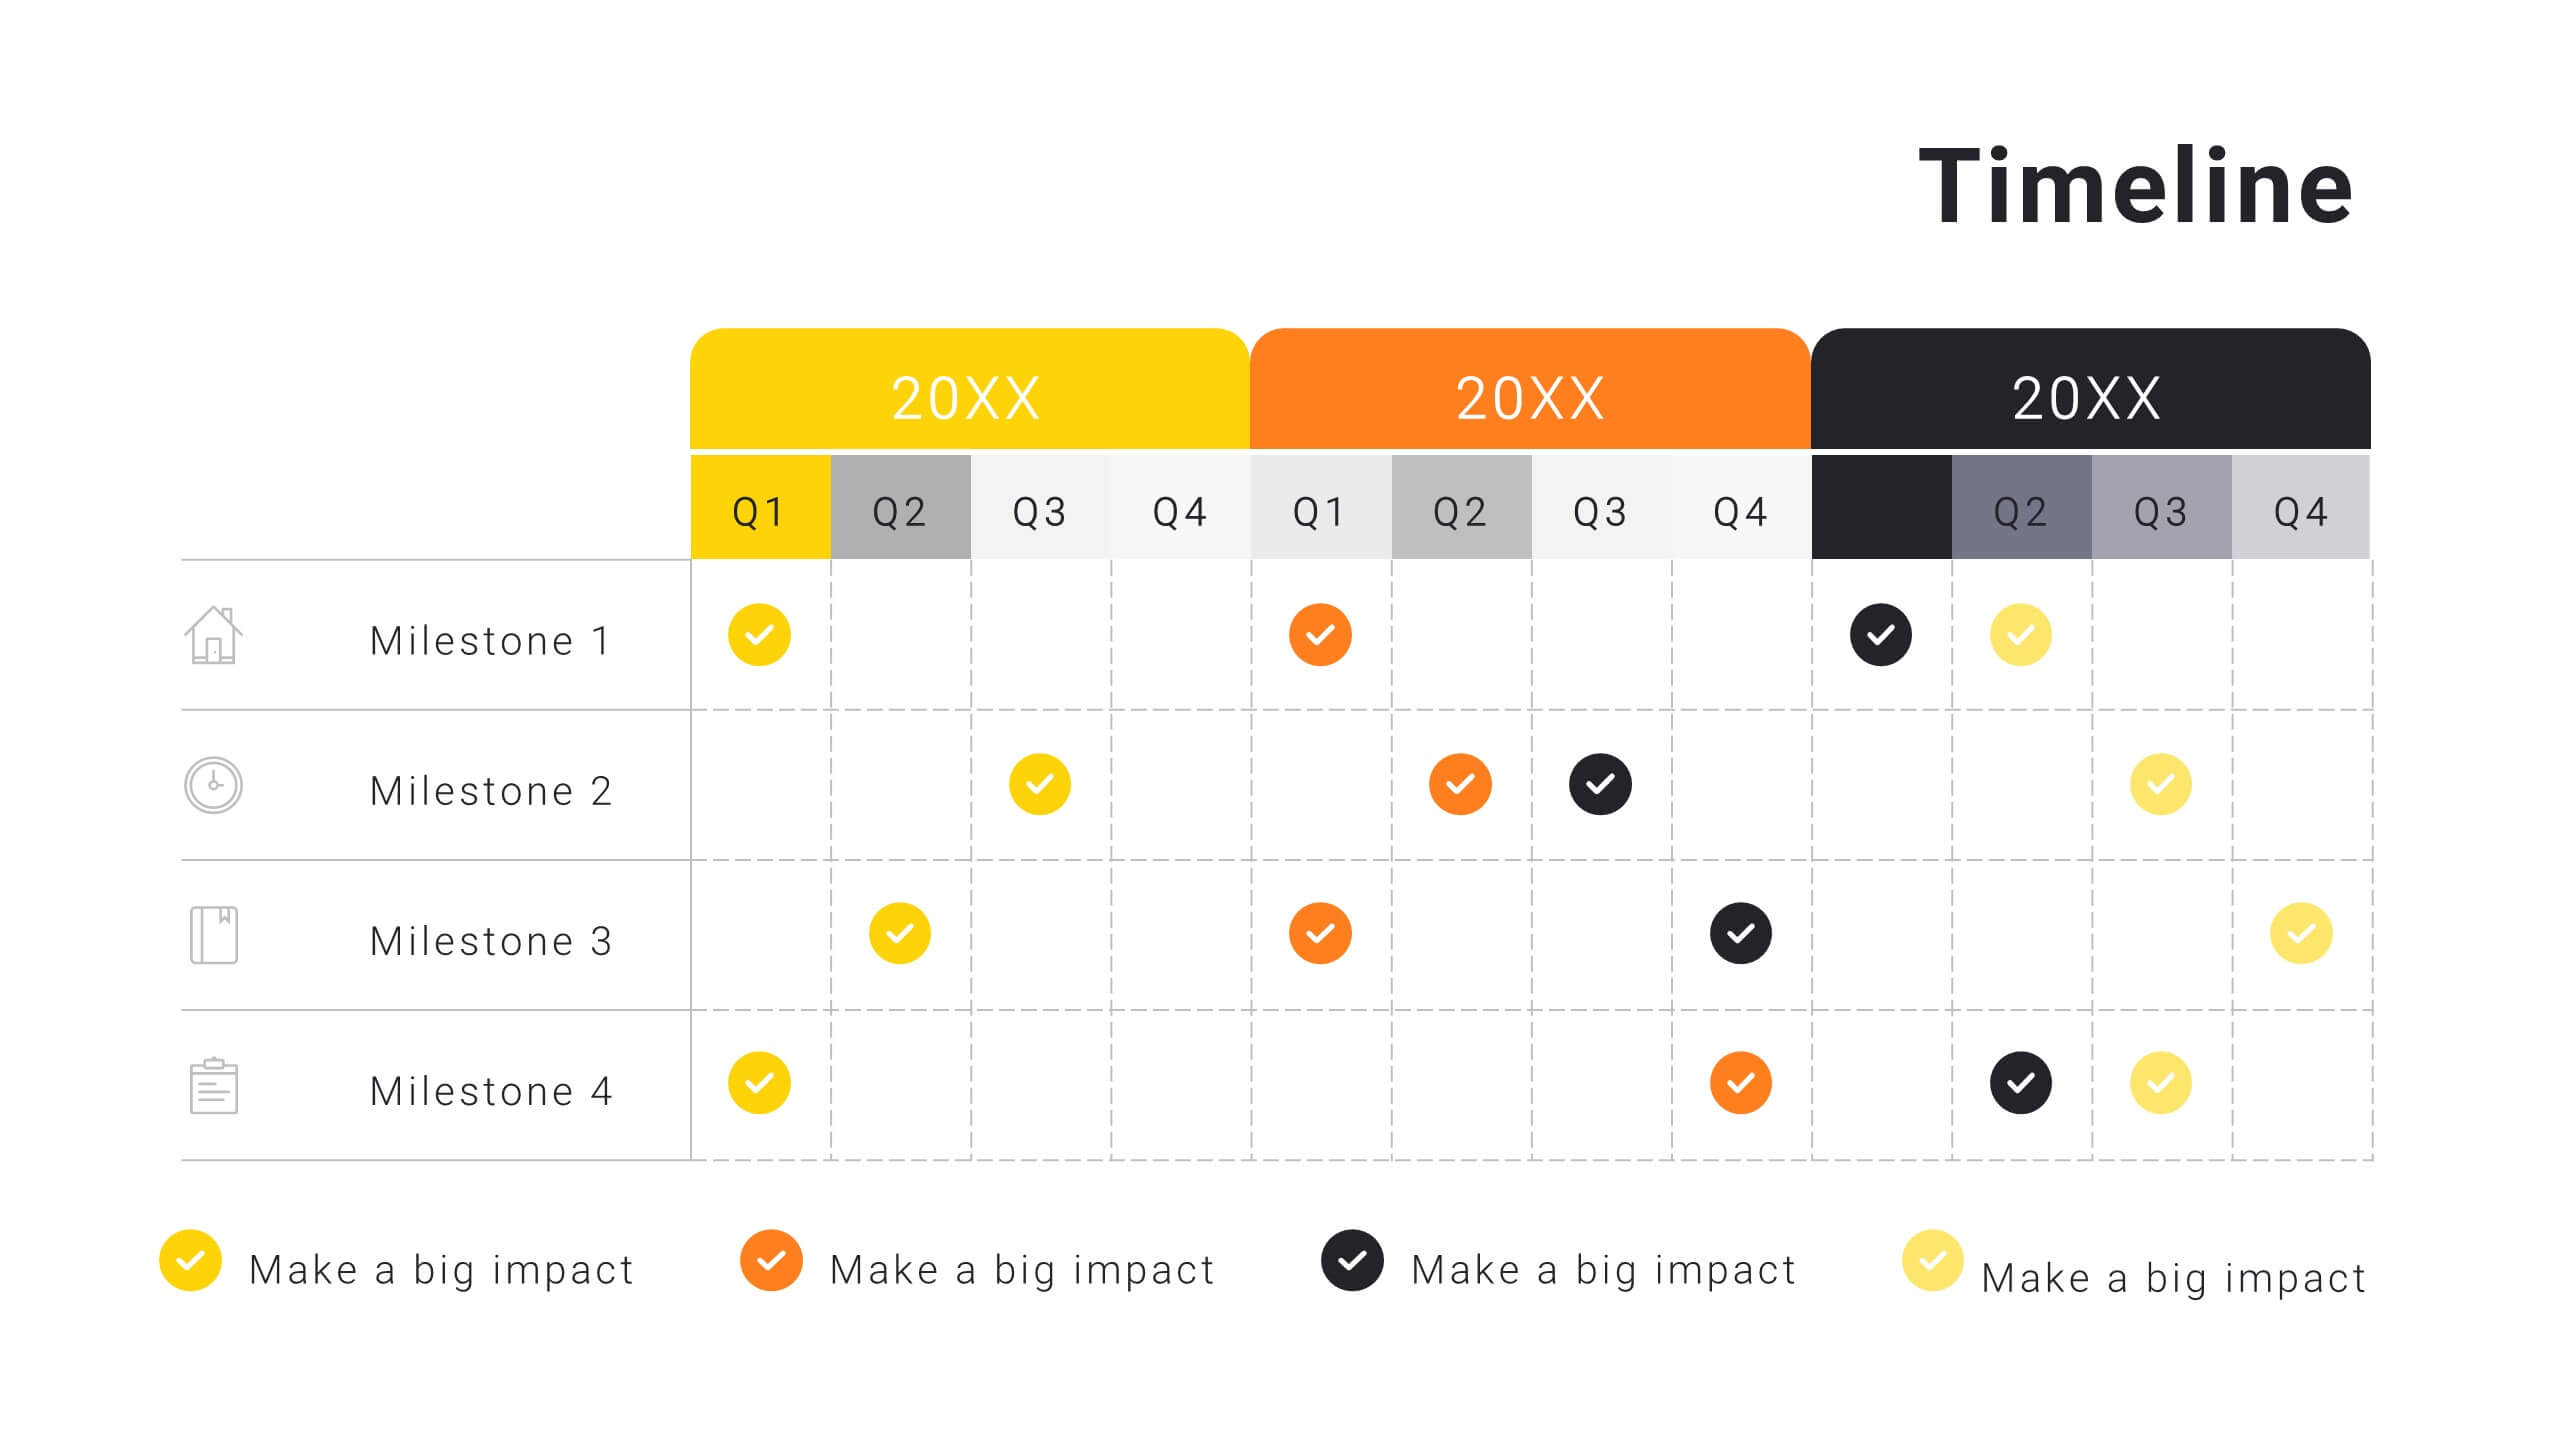
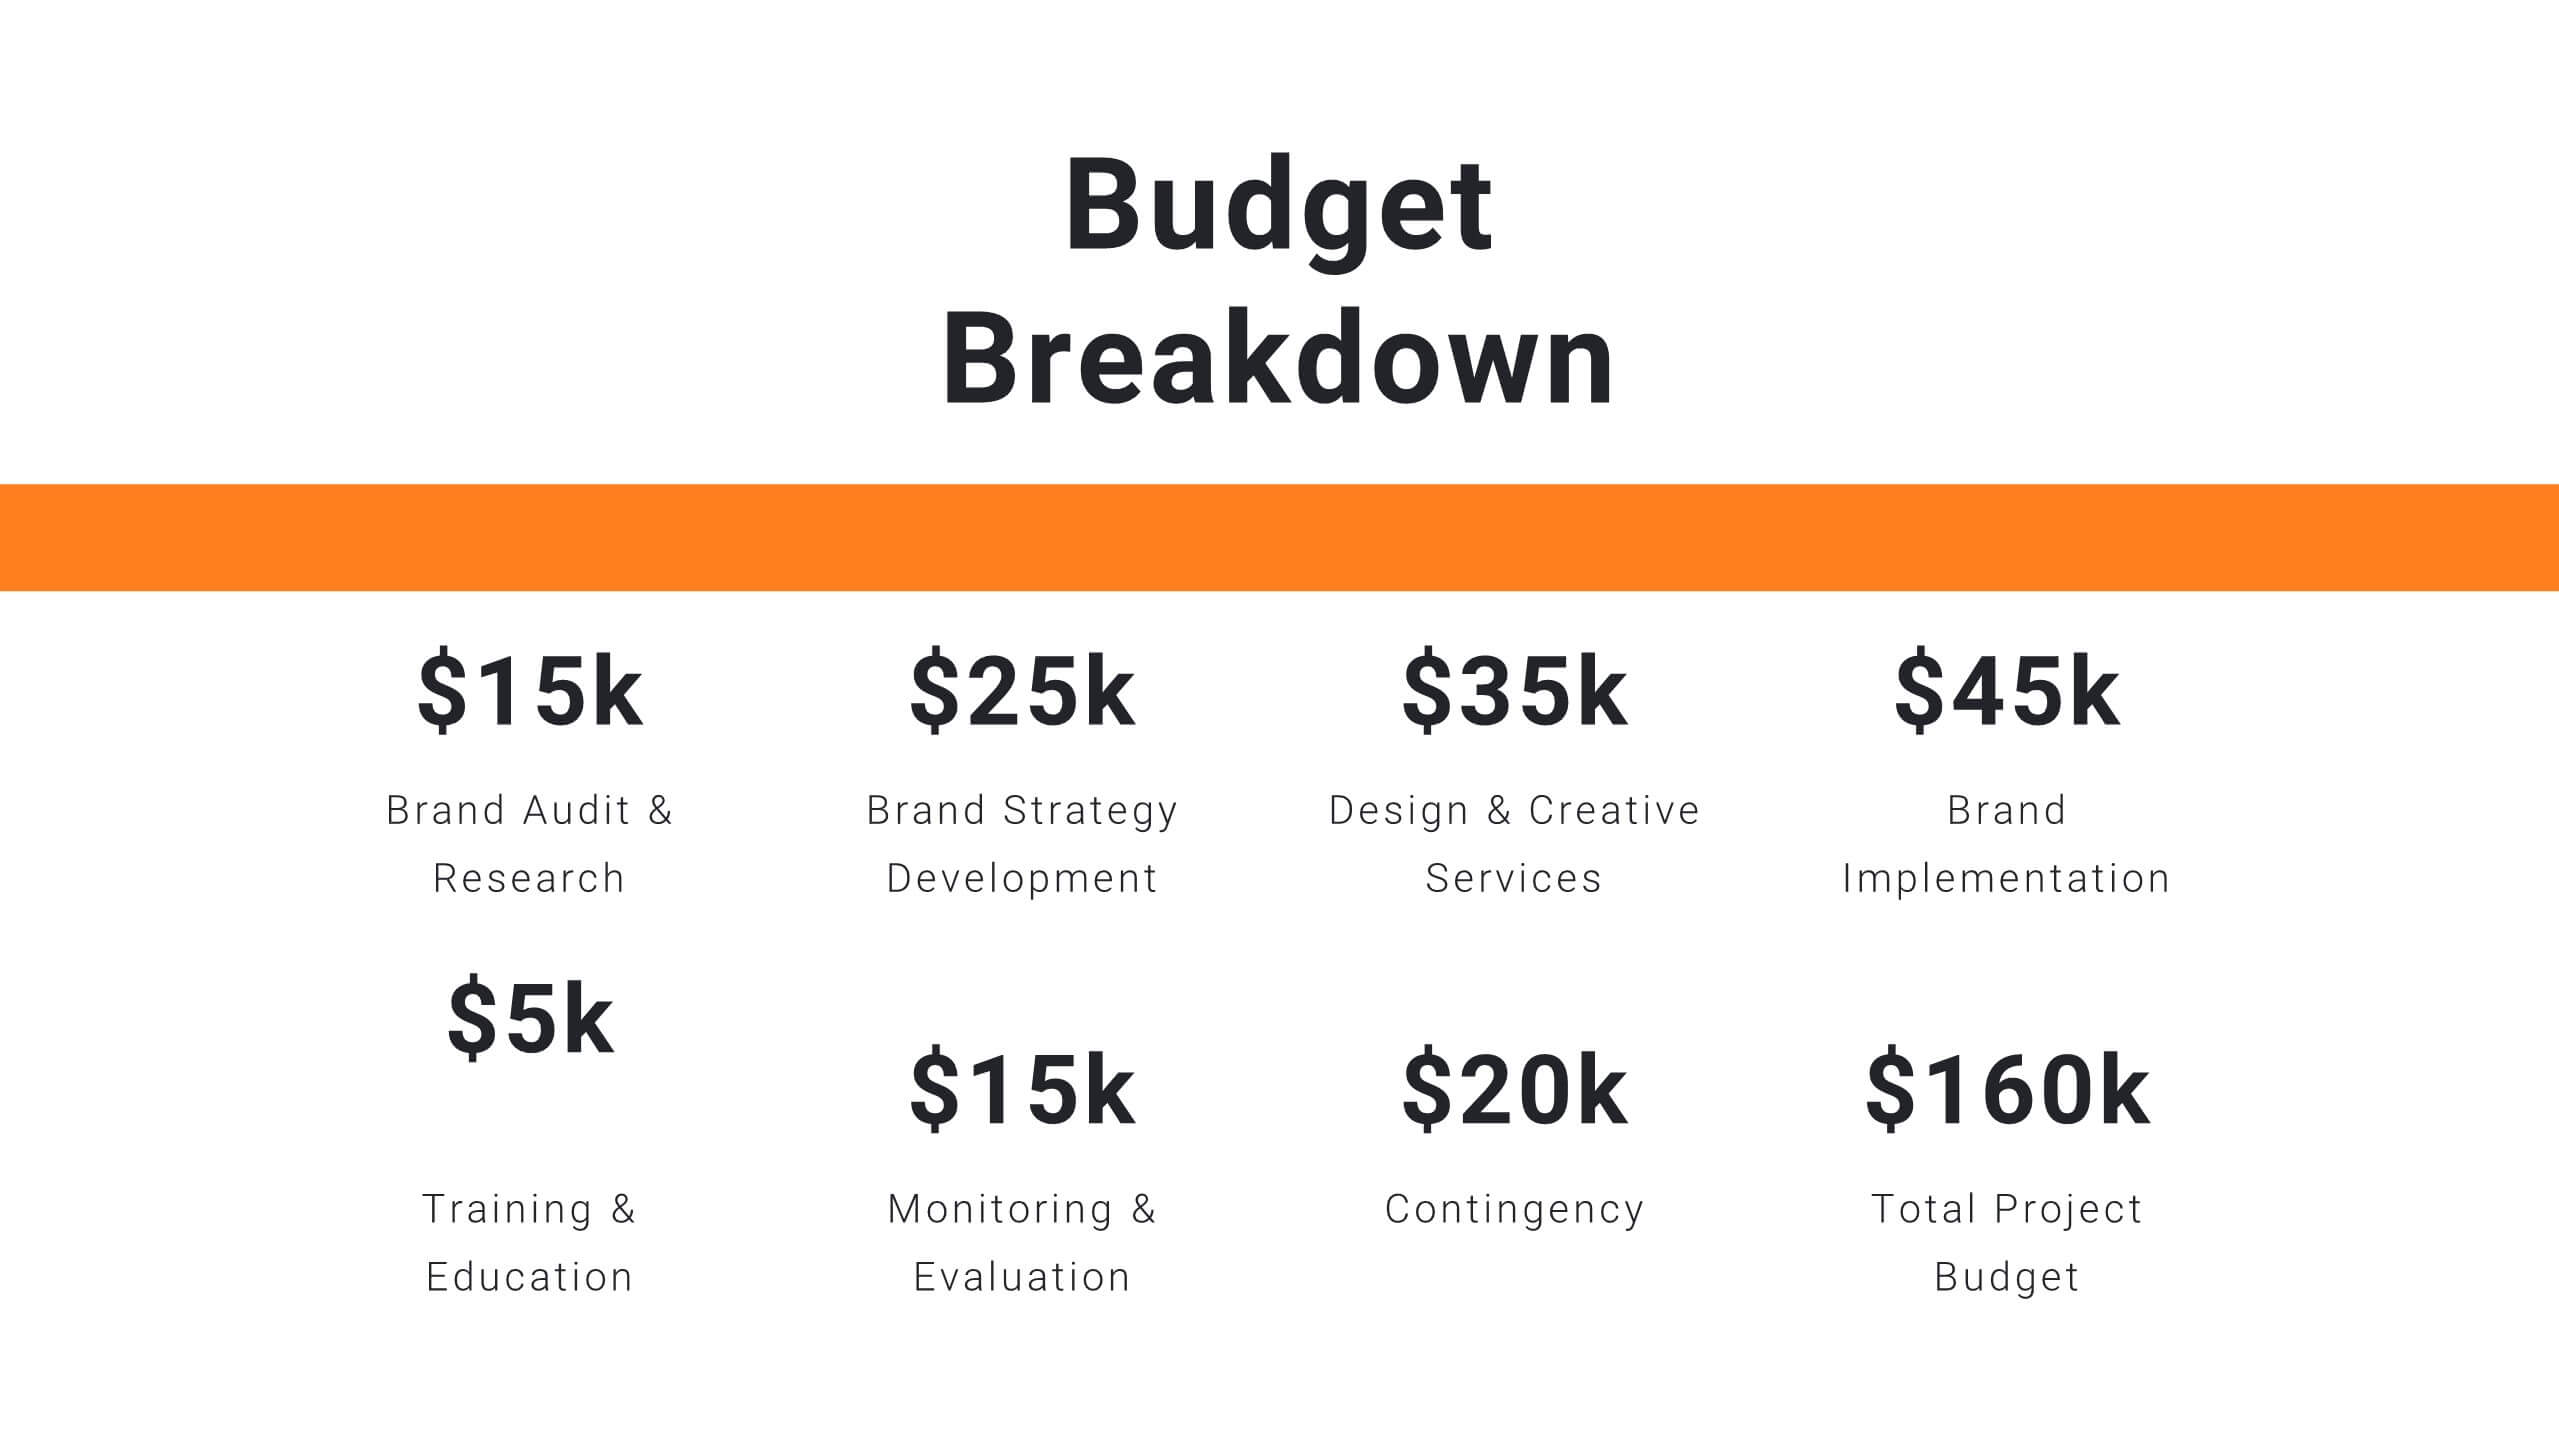
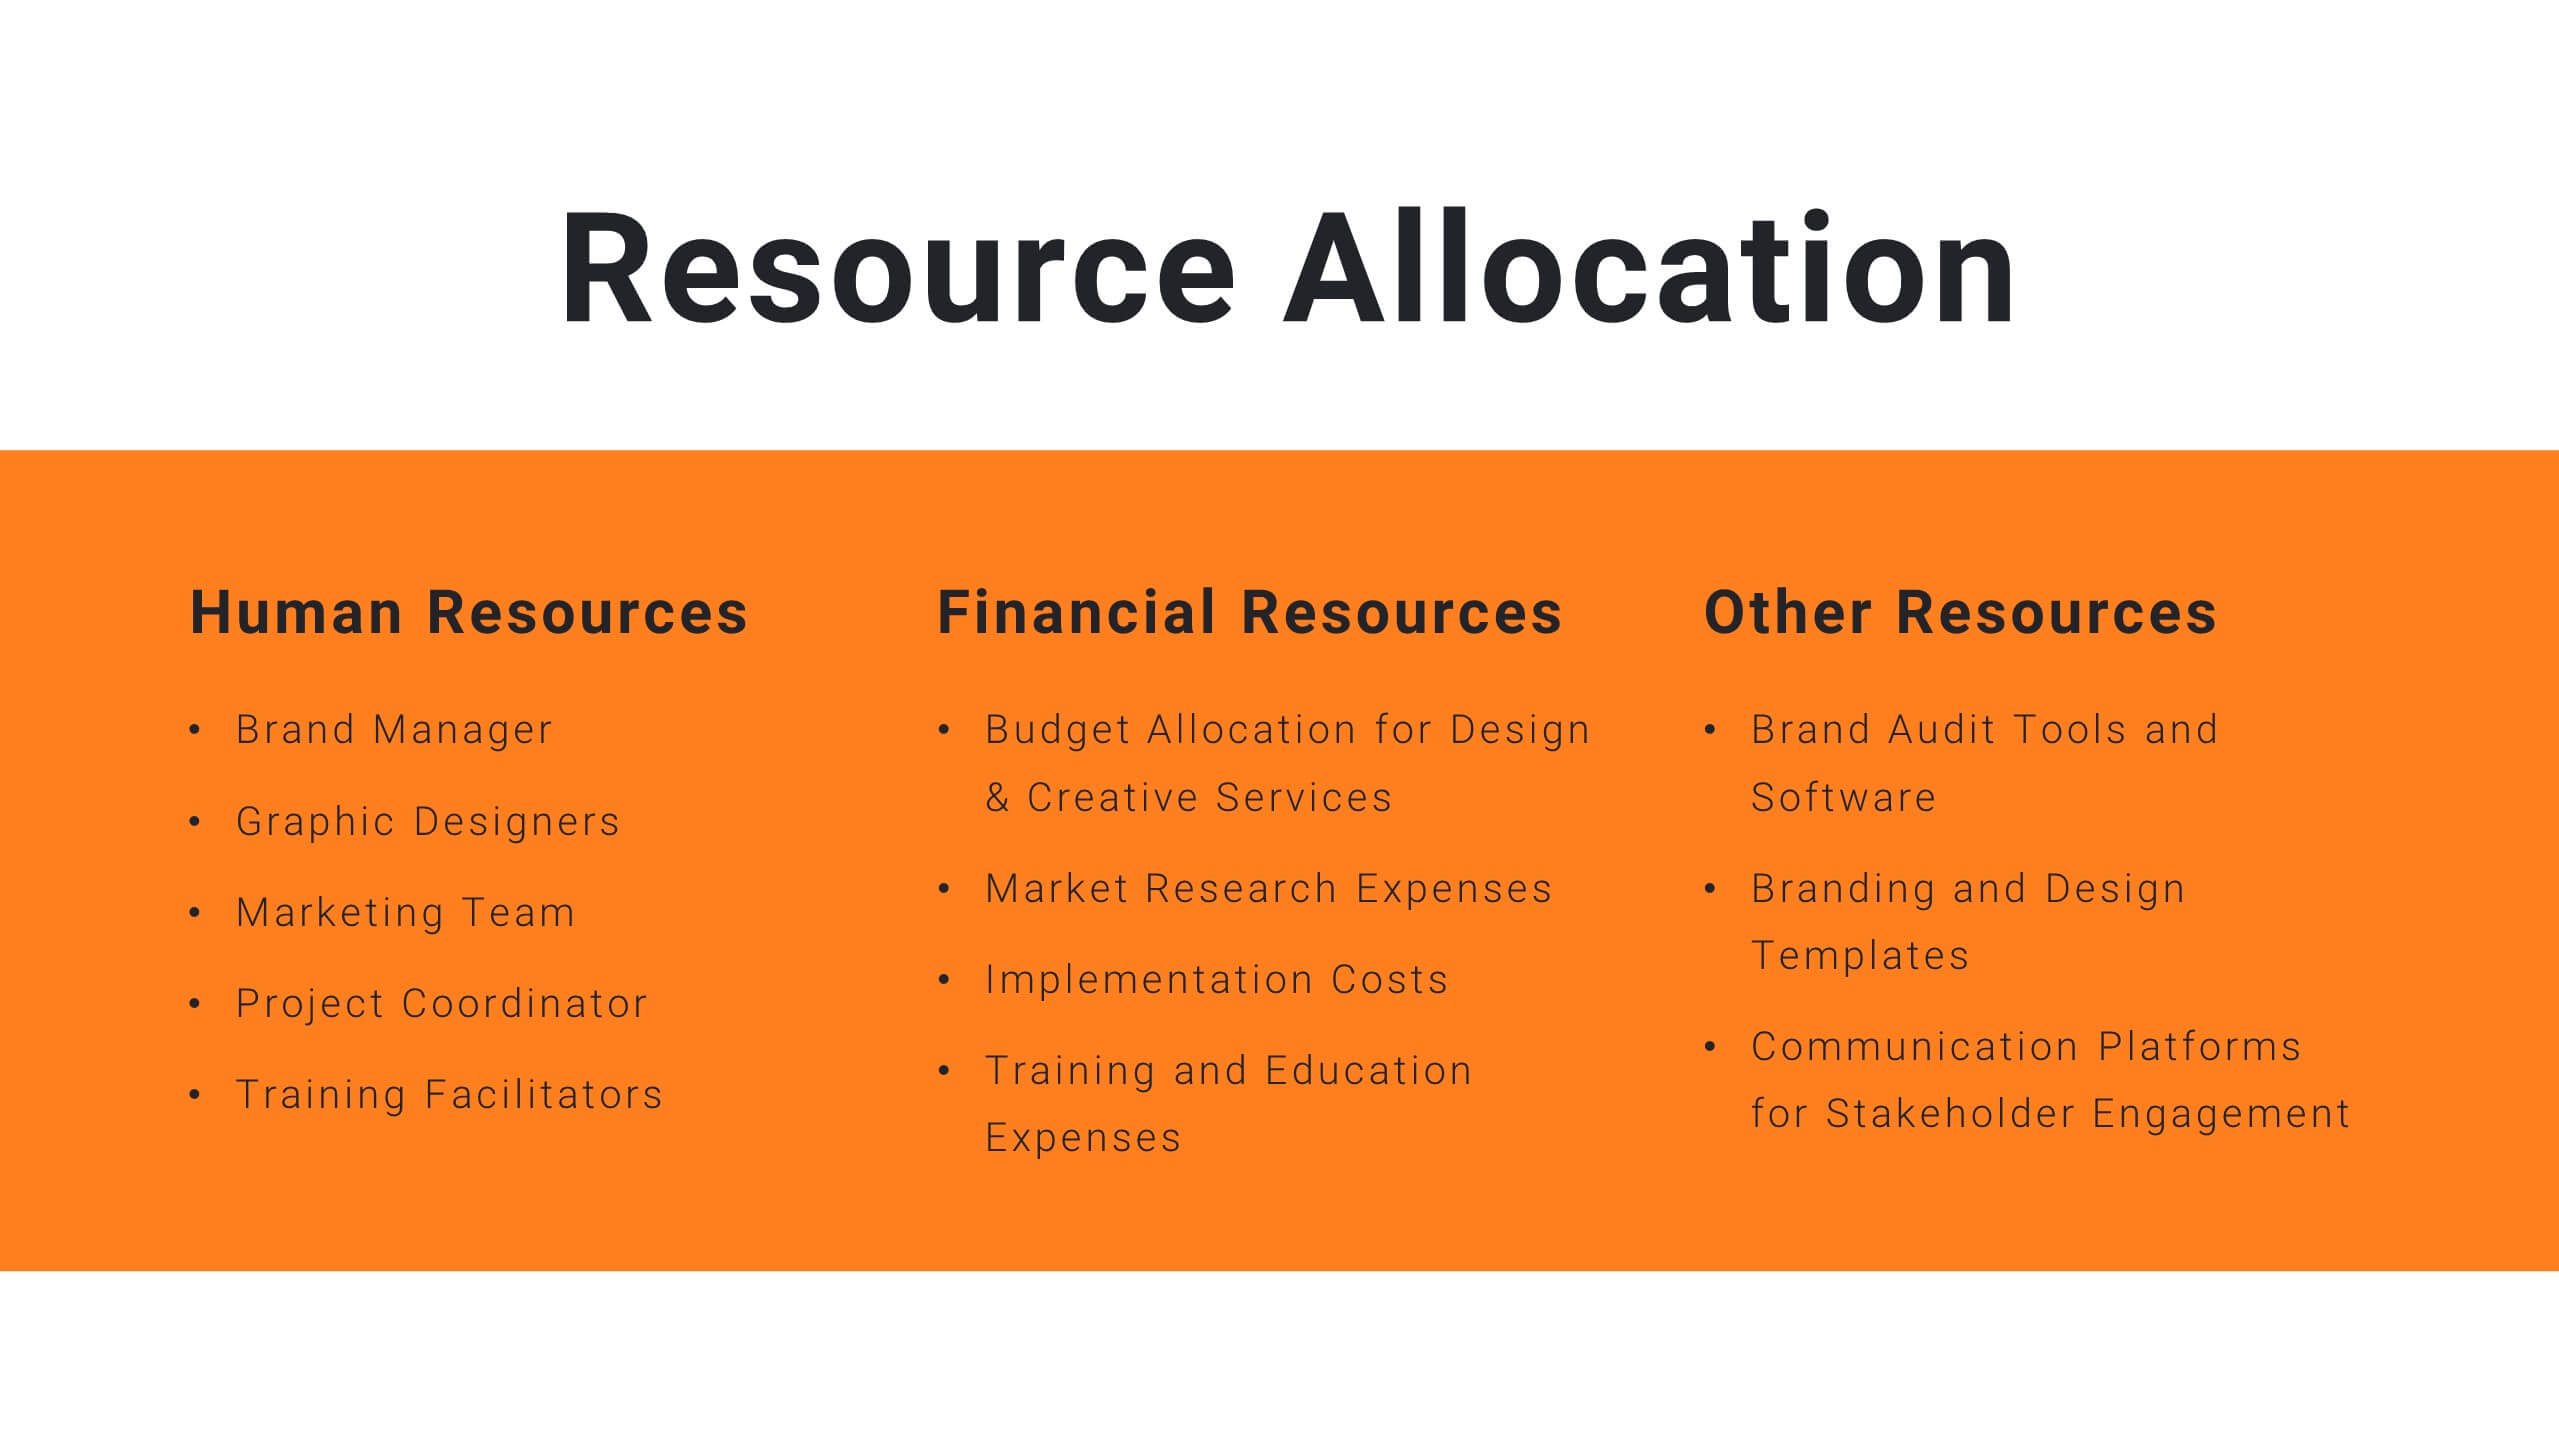
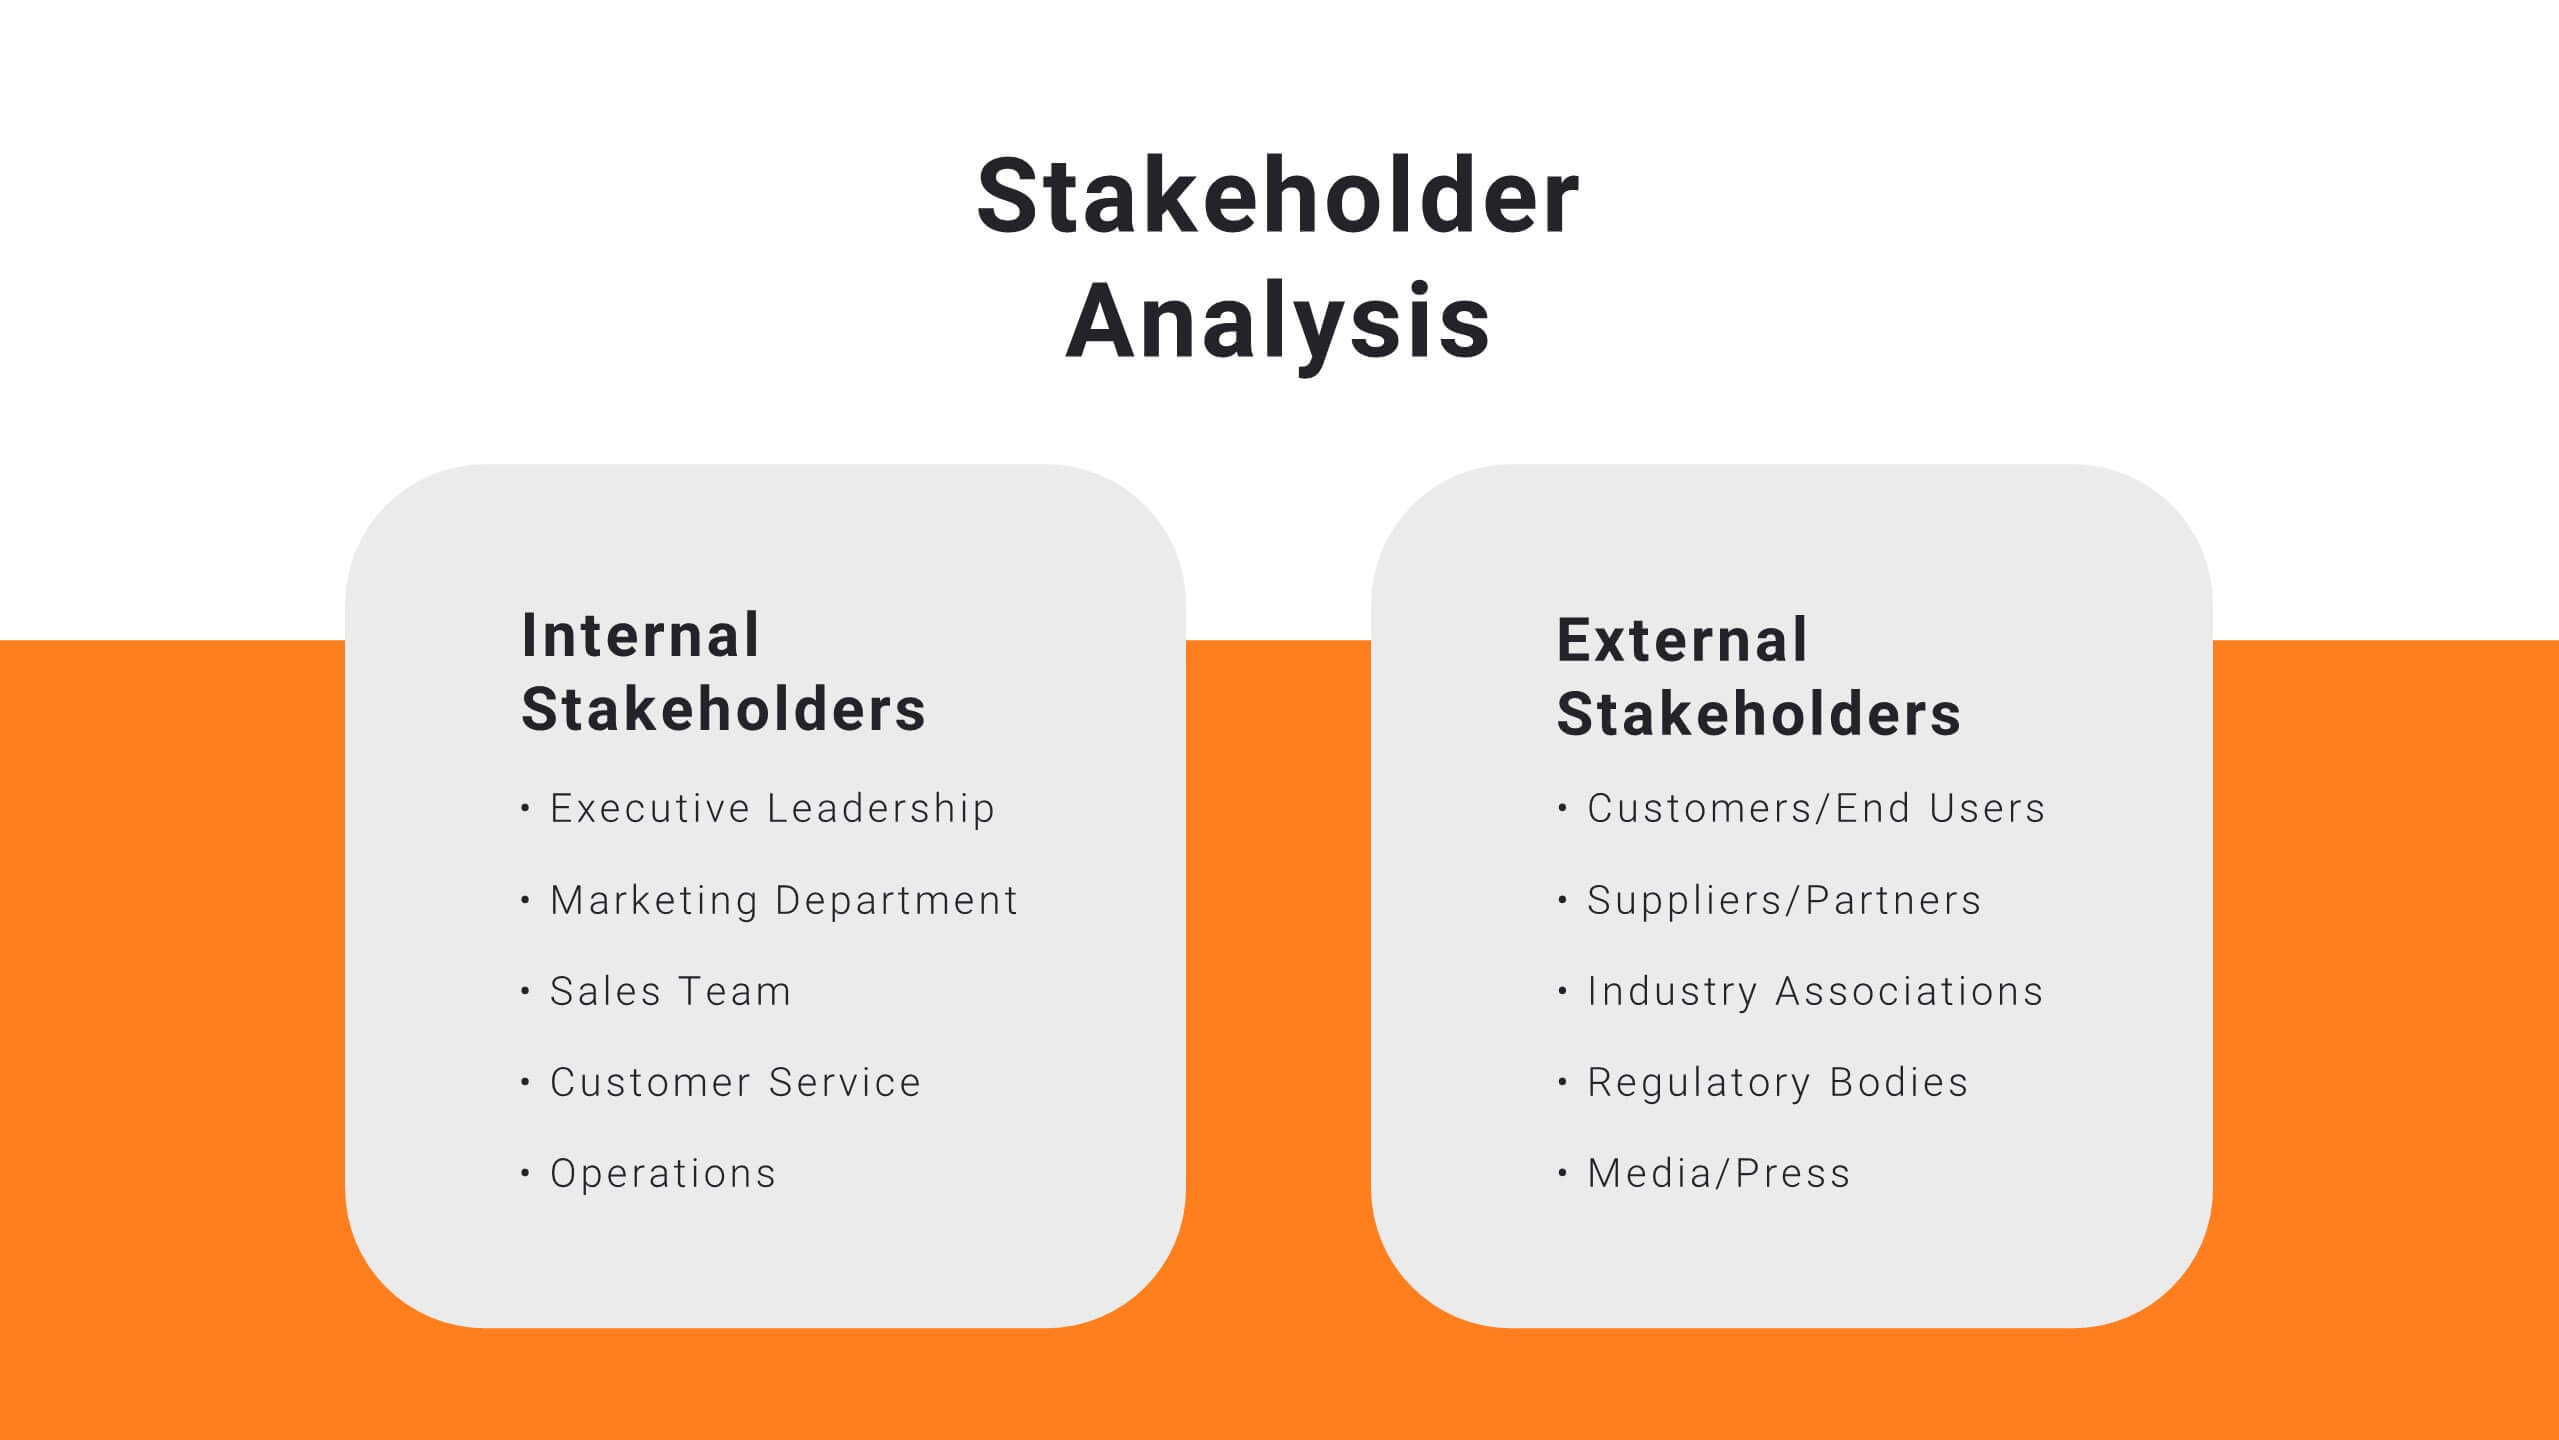
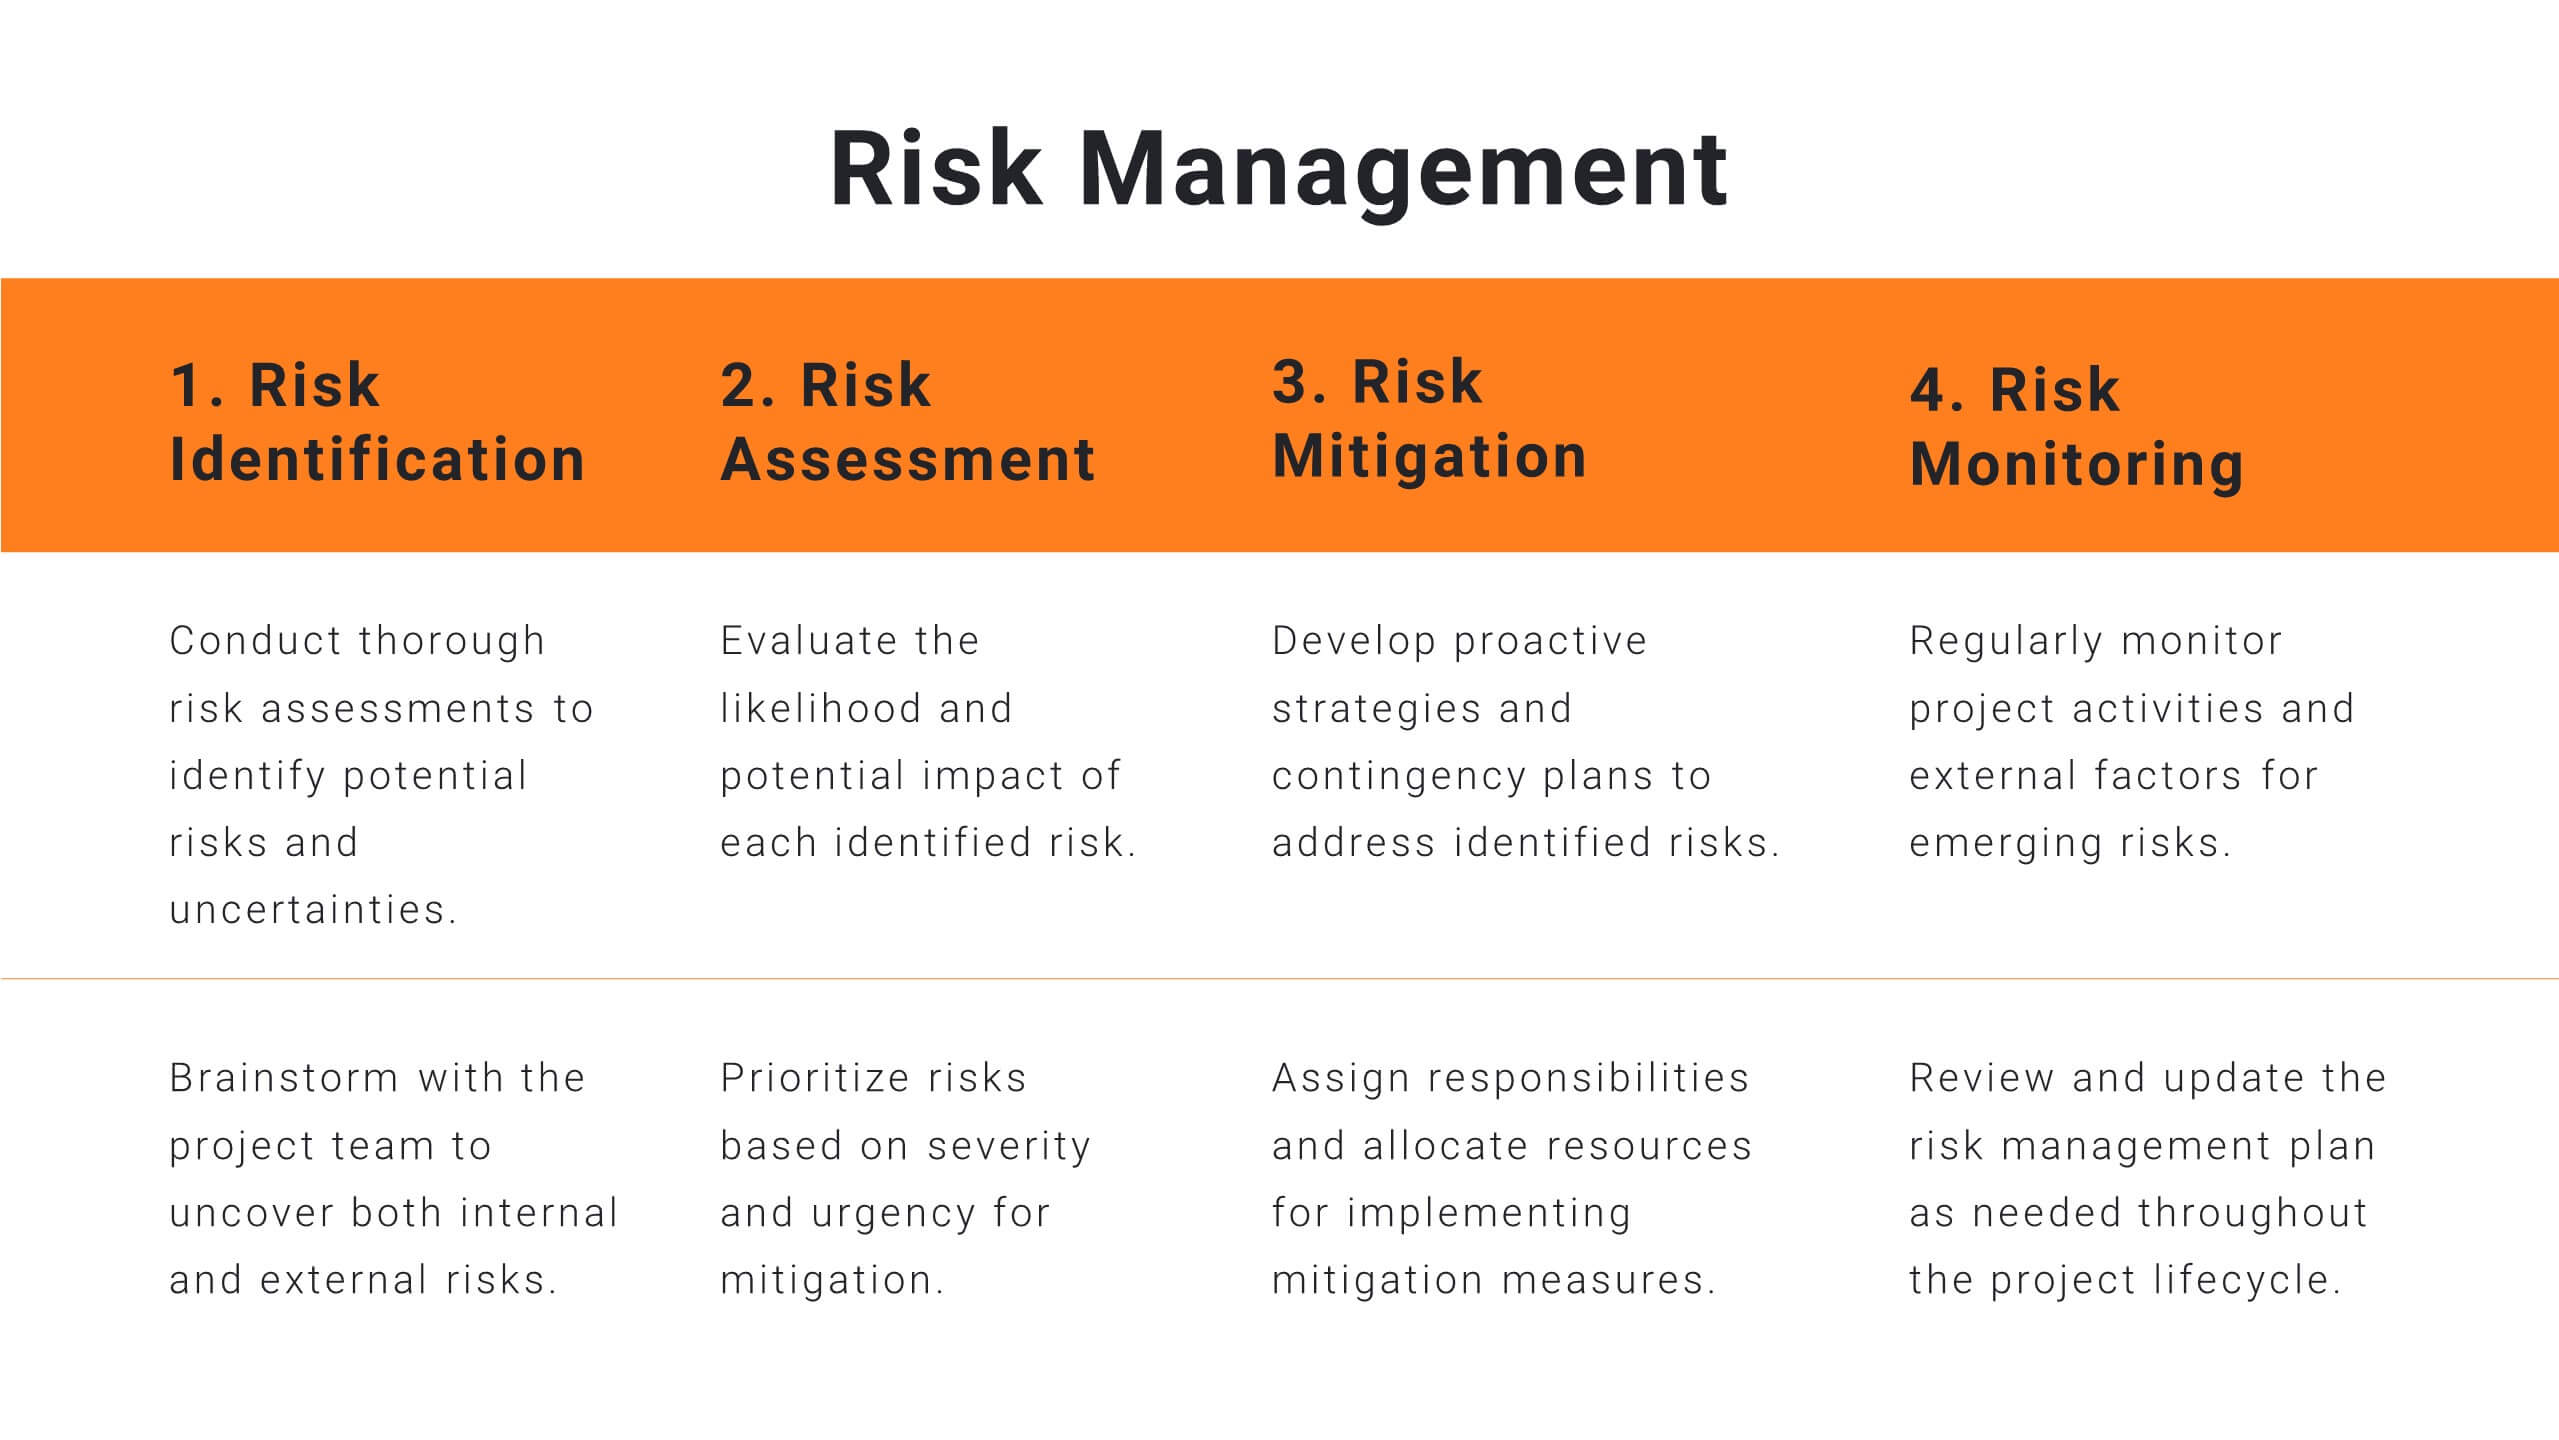
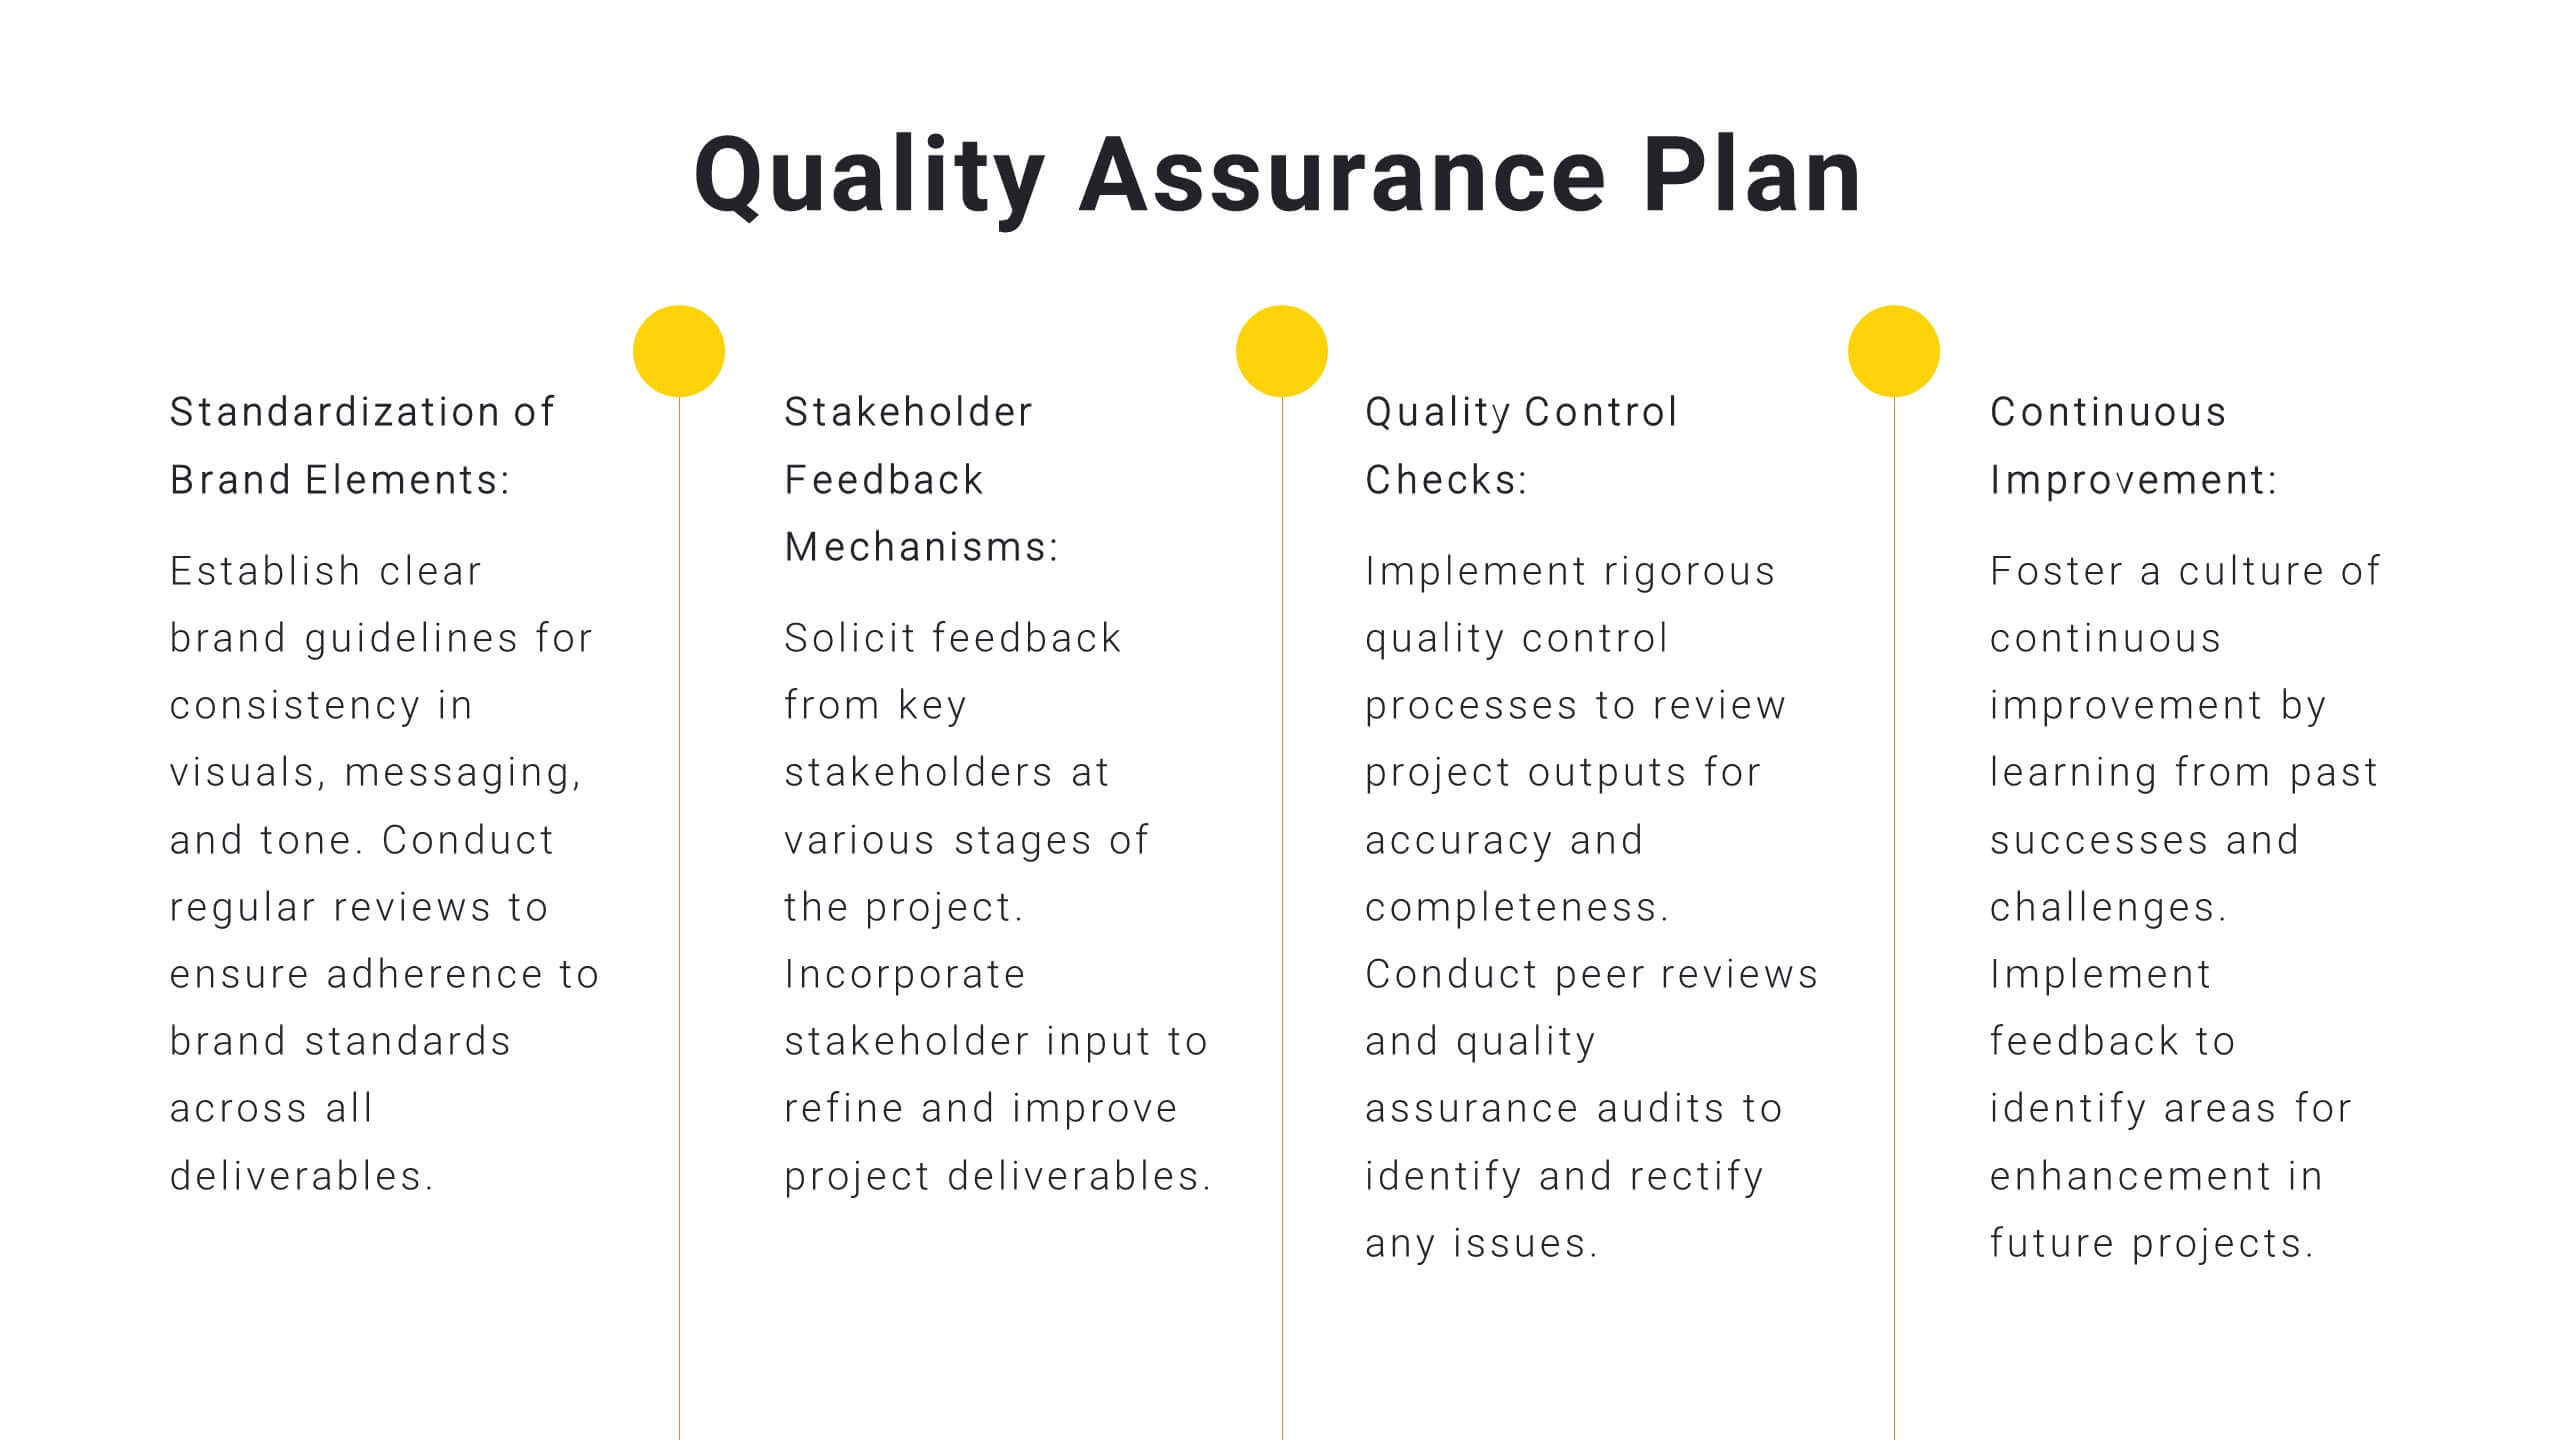
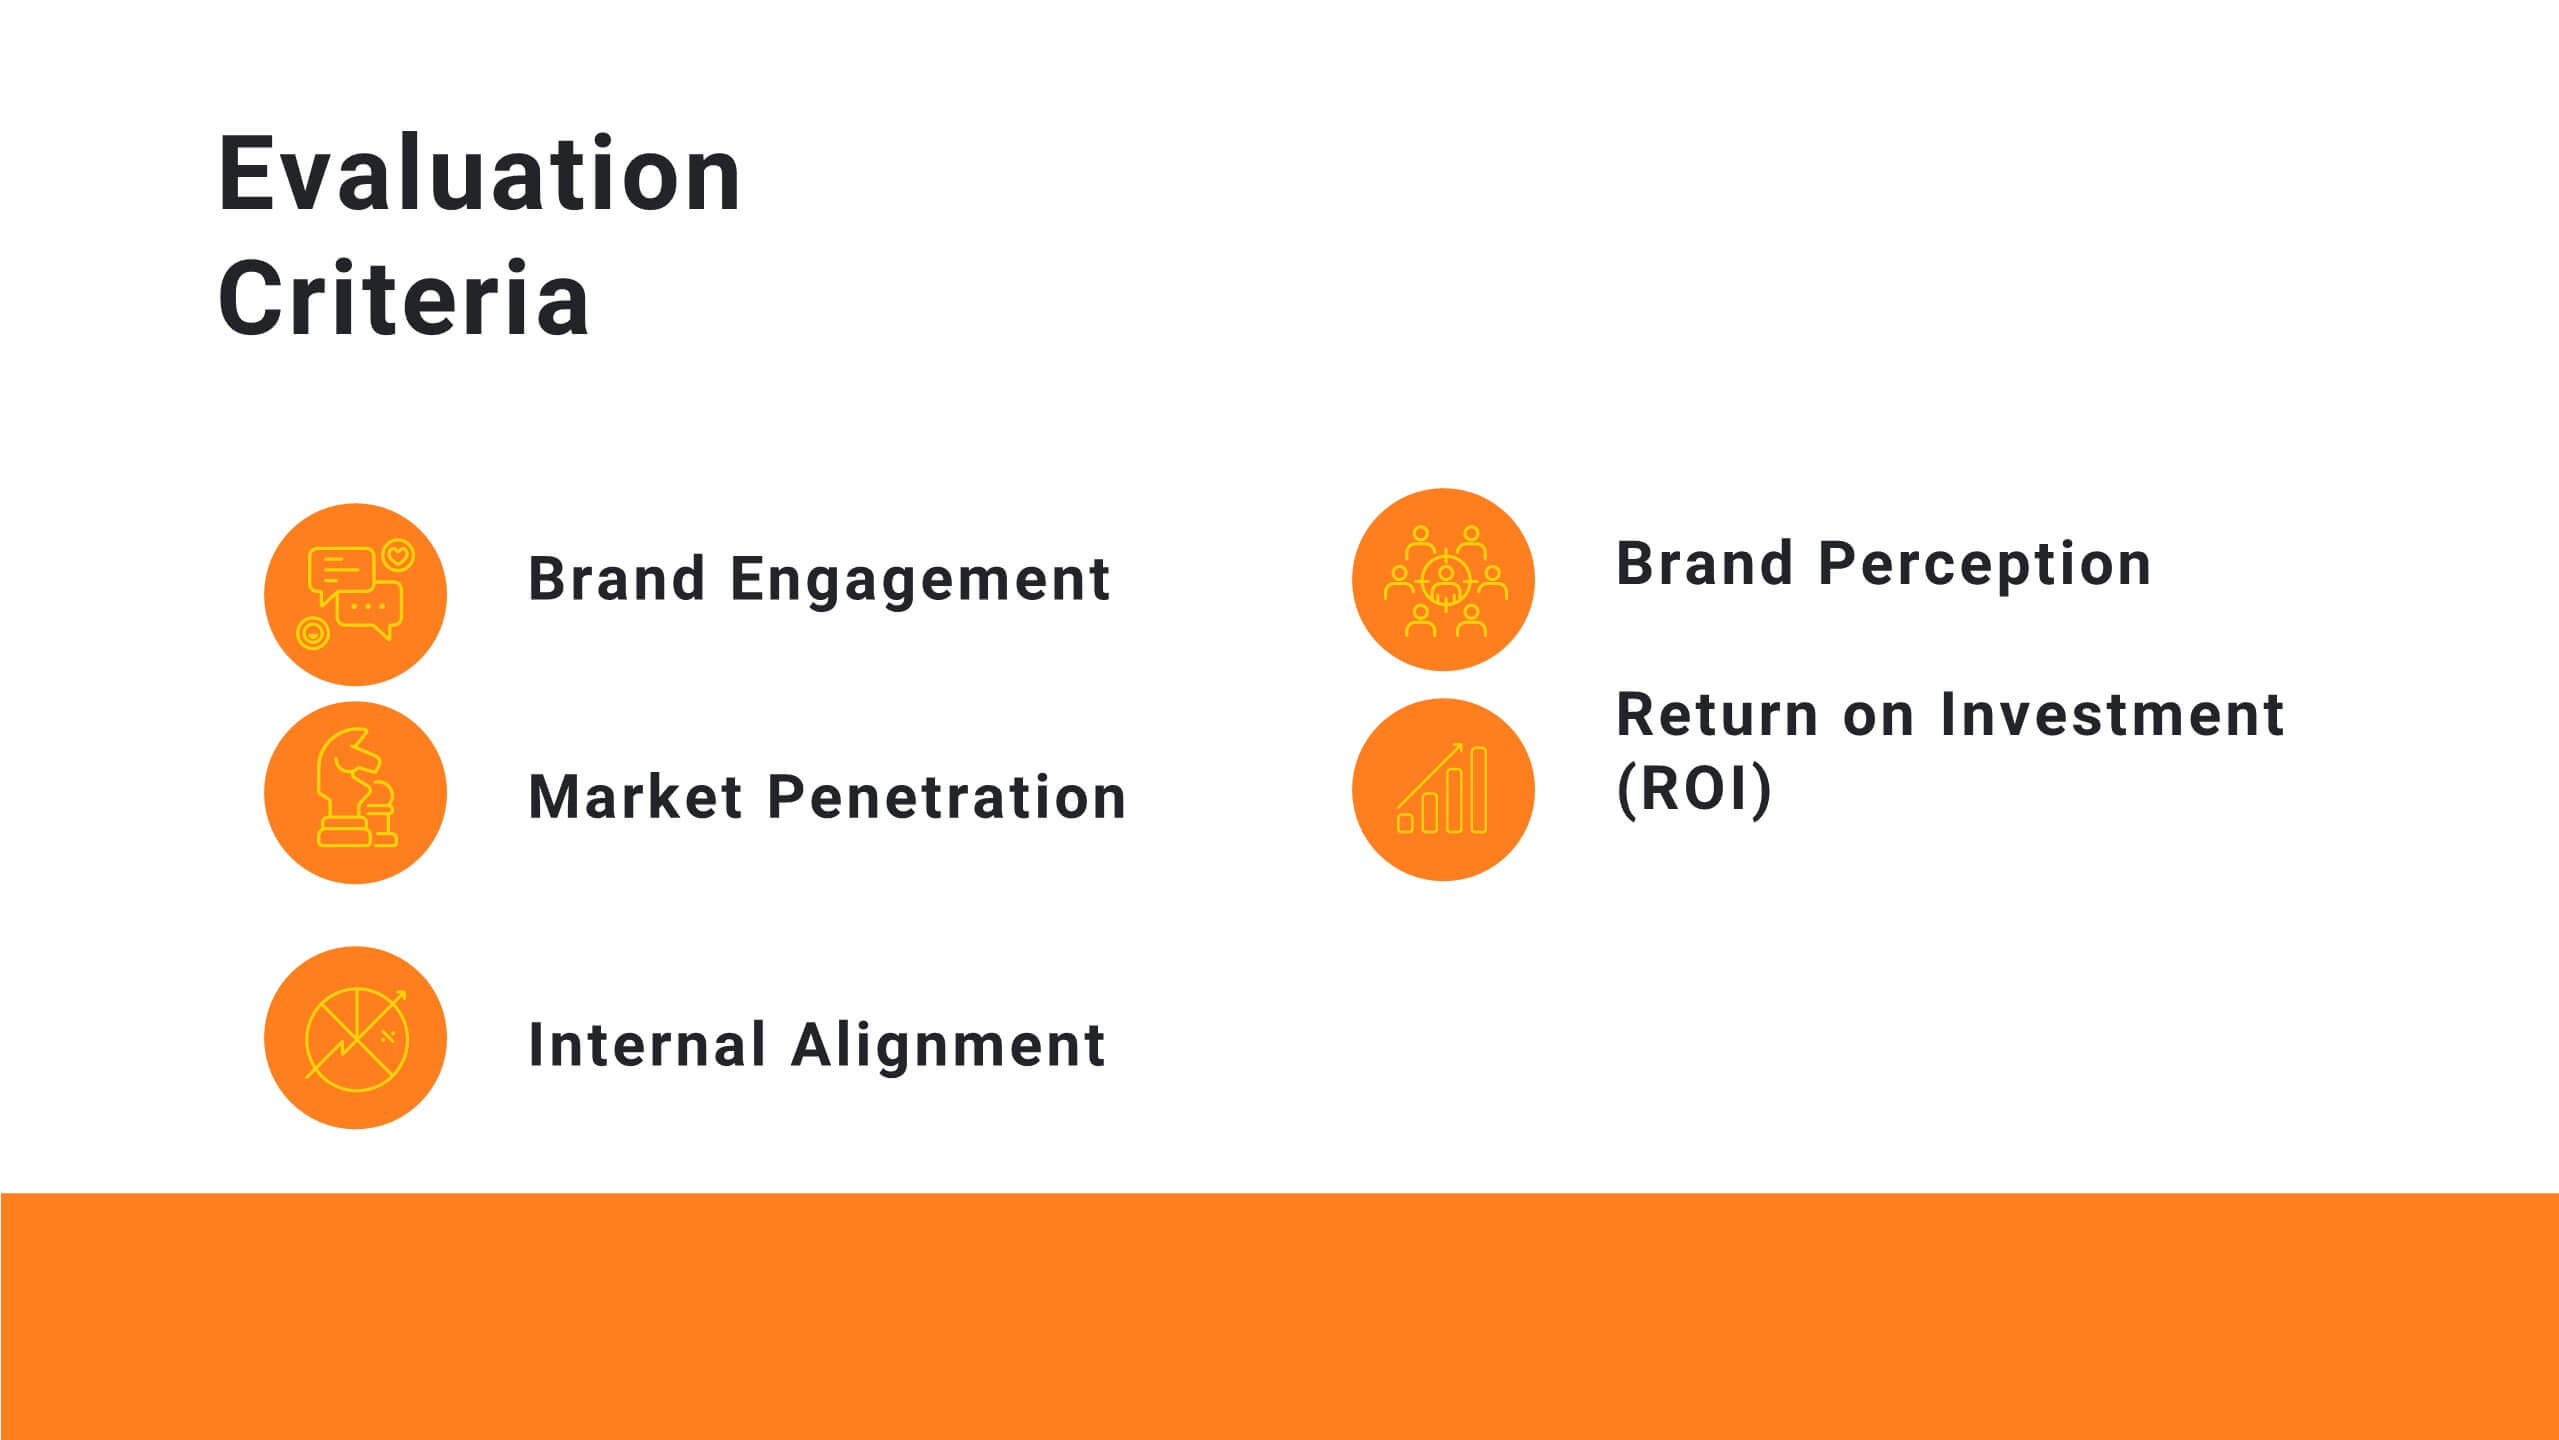
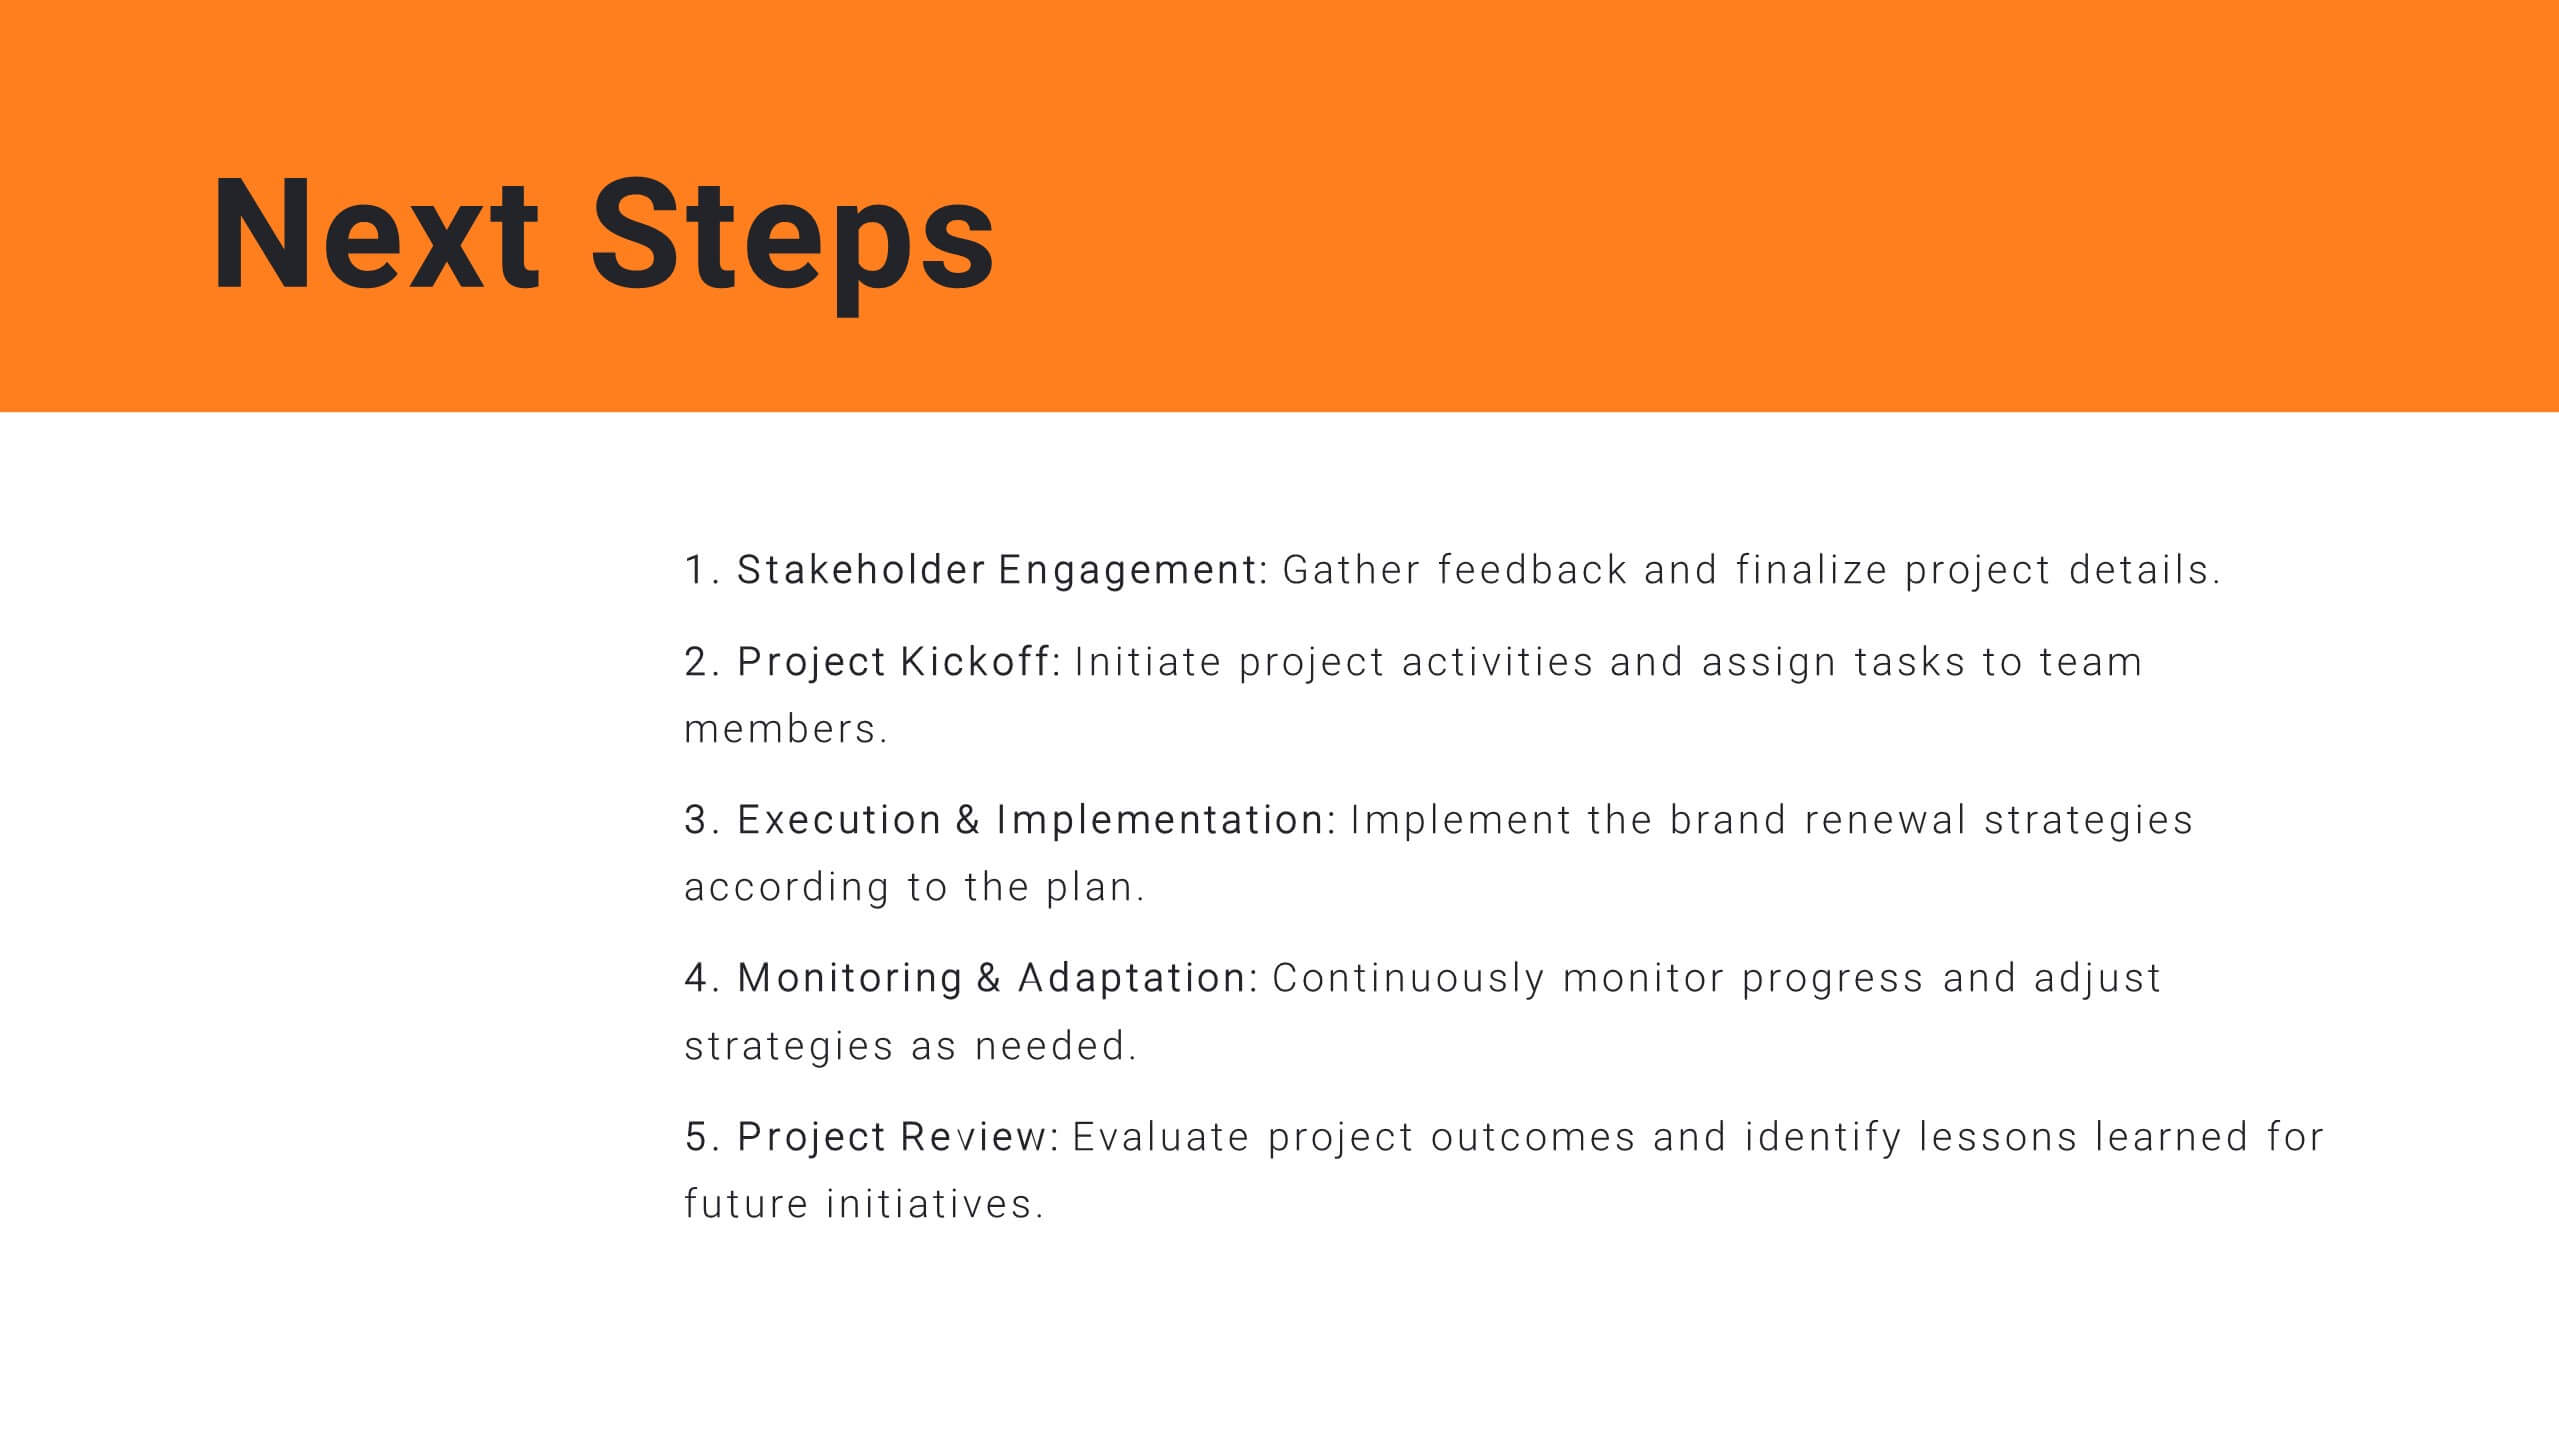
Harmony Project Management Plan Presentation
Plan your project efficiently with this comprehensive project management plan template! It covers all essential aspects including timeline, budget, resource allocation, and risk management. Ensure smooth project execution and achieve your objectives. Compatible with PowerPoint, Keynote, and Google Slides, it's designed to streamline your project planning and management process.


6 slides
Technology Education Infographic
Technology education refers to the teaching and learning of skills, knowledge, and concepts related to technology. This infographic template is designed to present key information about technology education in a concise manner. It aims to educate and inform the audience about the importance of technology education and its impact on students' learning and future careers. The template utilizes visually appealing icons, illustrations, and graphics to enhance understanding and engagement. It includes images of computers, coding symbols, robots, and other technology-related visuals that help to reinforce the information presented.


4 slides
Oceania Business Growth Opportunities Map Presentation
Highlight key business locations across Oceania with this clean and modern map slide. Featuring pinpoint icons and four customizable title areas, it’s ideal for showcasing market entry points, regional offices, or investment zones. Fully editable in PowerPoint, Keynote, and Google Slides for seamless business planning and strategic presentations.


7 slides
Aviation Infographic Presentation Template
Featuring our light, vibrant and eye-catching aviation infographic template compatible with PowerPoint. The theme is designed to show you the key facts and figures about your topic, so you can easily produce a stunning presentation. This infographic is a visual representation of information related to aviation, presented in a clear and visually appealing way. With this template cover topics such as aviation history or the economic impact of the aviation industry. The information in the template can be in the form of statistics, data visualizations, timelines, maps, or other graphical elements.


6 slides
Efficient Scheduling and Time Management Presentation
Stay on time and on target with the Efficient Scheduling and Time Management presentation slide. Designed with smartwatch graphics showing time progression, this layout visually emphasizes planning, deadlines, and time-based tasks. Ideal for outlining agendas, productivity methods, or resource allocation strategies. Each time block includes editable text fields for key milestones or steps. Compatible with PowerPoint, Keynote, and Google Slides.


4 slides
Circular Data Flow in Systems Presentation
Visualize relationships and flow within your systems using the Circular Data Flow in Systems Presentation. Ideal for showcasing input-output dynamics, data loops, or stakeholder interaction, this diagram presents centralized nodes with surrounding connectors for clarity. Each element is editable and works seamlessly in PowerPoint, Google Slides, and Canva.


6 slides
IT Security Policy Presentation
A bold, clean layout brings your message to life with clarity and confidence. This presentation helps you outline essential guidelines, communicate security expectations, and explain key protective measures in a way your audience can easily follow. Designed for professionalism and simplicity, it works seamlessly in PowerPoint, Keynote, and Google Slides.