


Features
- 7 Unique slides
- Fully editable and easy to edit in Microsoft Powerpoint, Keynote and Google Slides
- 16:9 widescreen layout
- Clean and professional designs
- Export to JPG, PDF or send by email


Do you have any questions?
Recommend


6 slides
Milestones Technologies Infographics
Highlight significant milestones in technology with our Milestones Technologies infographic template. This template is fully compatible with popular presentation software like PowerPoint, Keynote, and Google Slides, allowing you to easily customize it to showcase pivotal moments and achievements in the world of technology. The Milestones Technologies infographic template offers a visually engaging platform to chronicle and celebrate key technological advancements, innovations, and breakthroughs throughout history. Whether you're a tech enthusiast, educator, or simply interested in technological progress, this template provides a user-friendly canvas to create informative presentations and educational materials. Deepen your appreciation for the impact of technology with this SEO-optimized Milestones Technologies infographic template, thoughtfully designed for clarity and ease of use. Customize it to highlight milestones across various fields, from computing and telecommunications to space exploration and biotechnology, making it a valuable resource for sharing the history of technology with your audience. Start crafting your personalized infographic today to explore the remarkable journey of technological progress.


6 slides
Preventative Healthcare and Fitness Presentation
Promote wellness and proactive care with this colorful and clean slide layout. Featuring a clipboard-style design with stacked icons and aligned descriptions from A to E, it’s perfect for presenting fitness tips, health programs, or preventative strategies. The vibrant sections help guide viewers through key points at a glance. Fully editable and compatible with PowerPoint, Keynote, and Google Slides.


4 slides
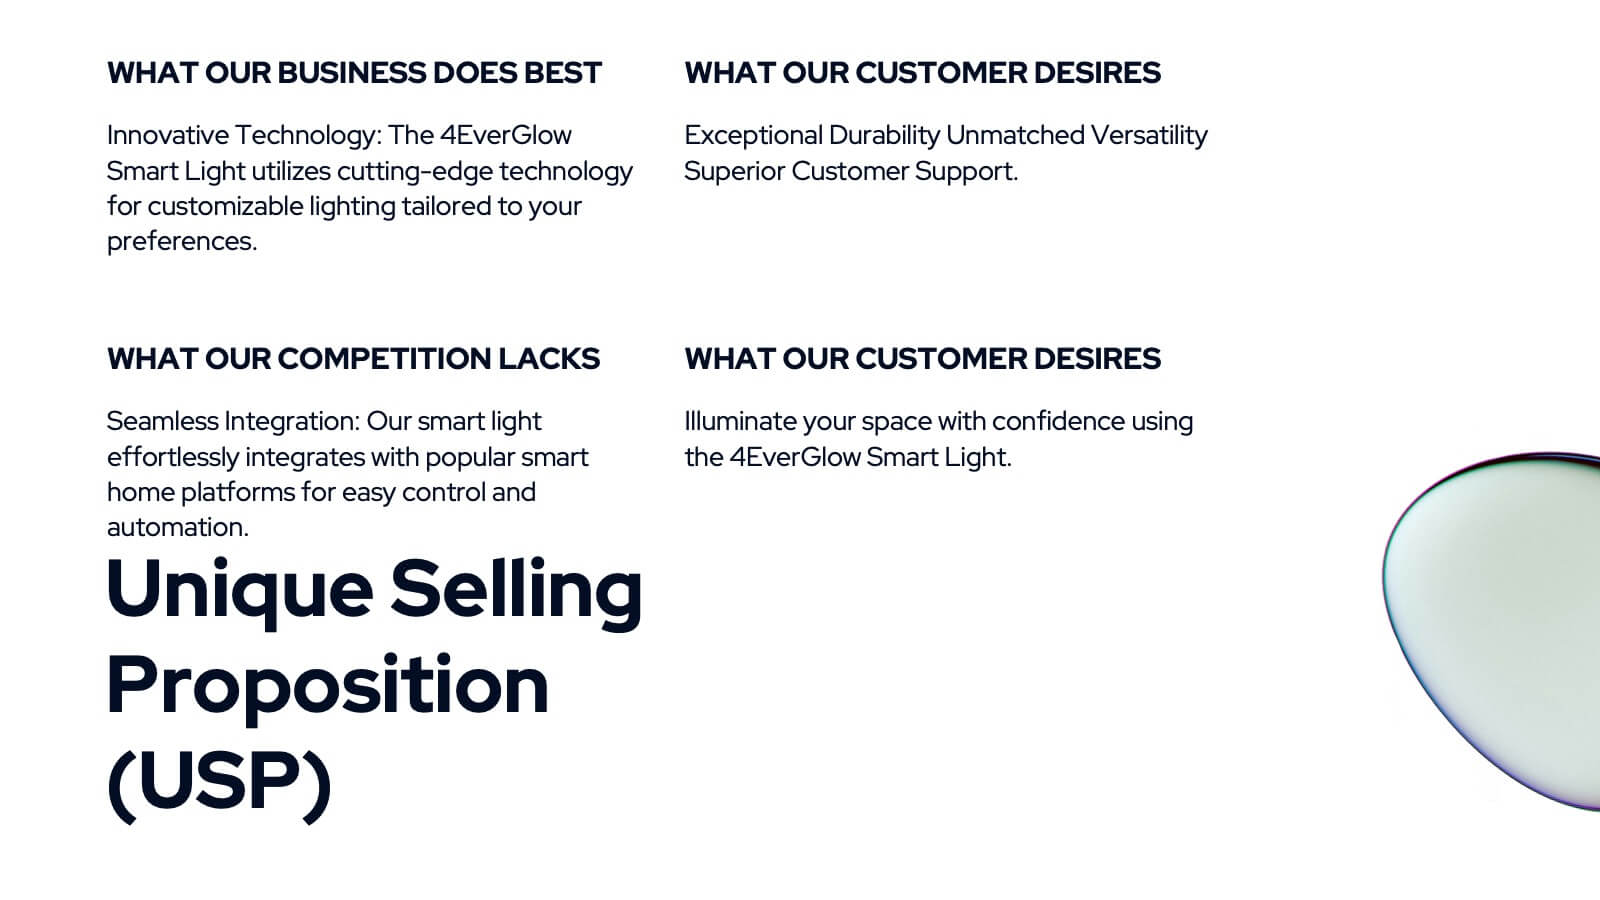
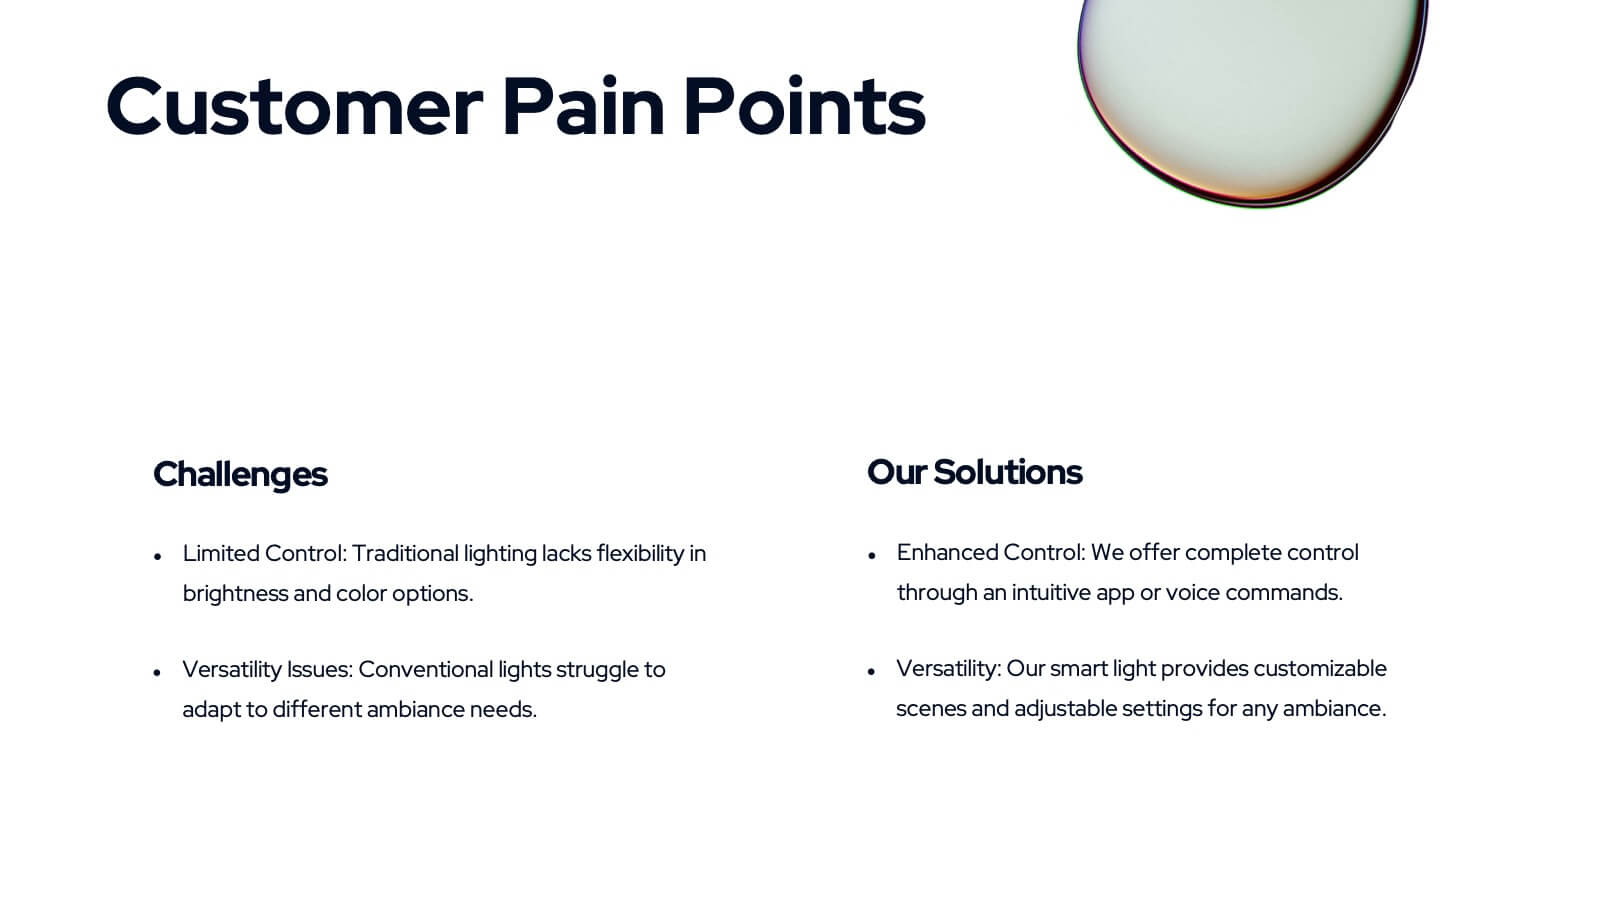
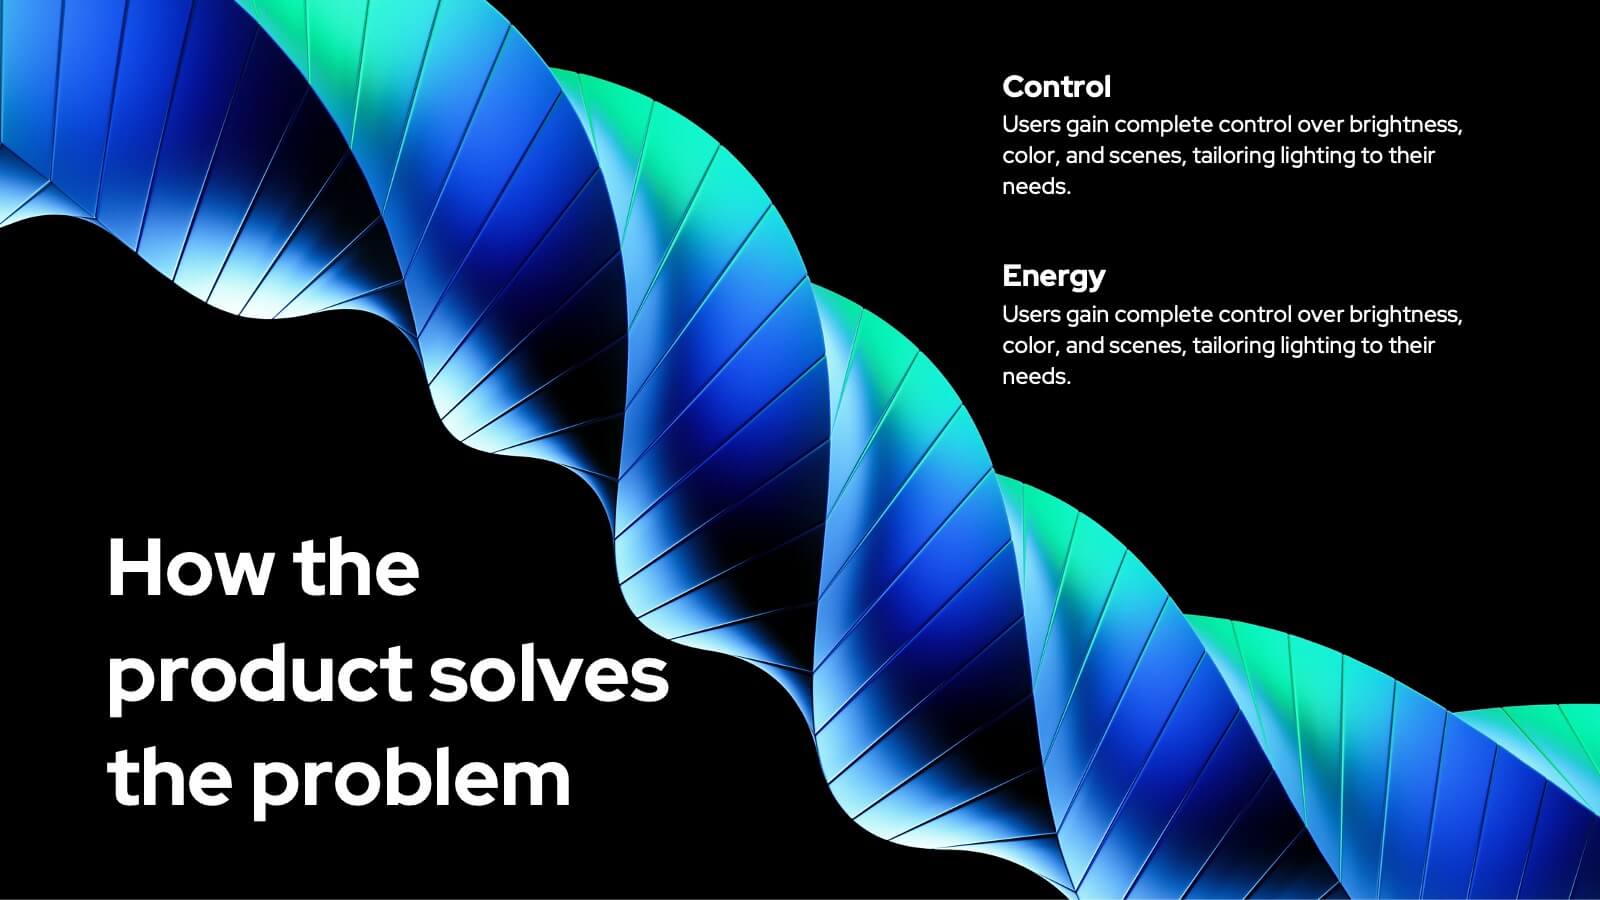
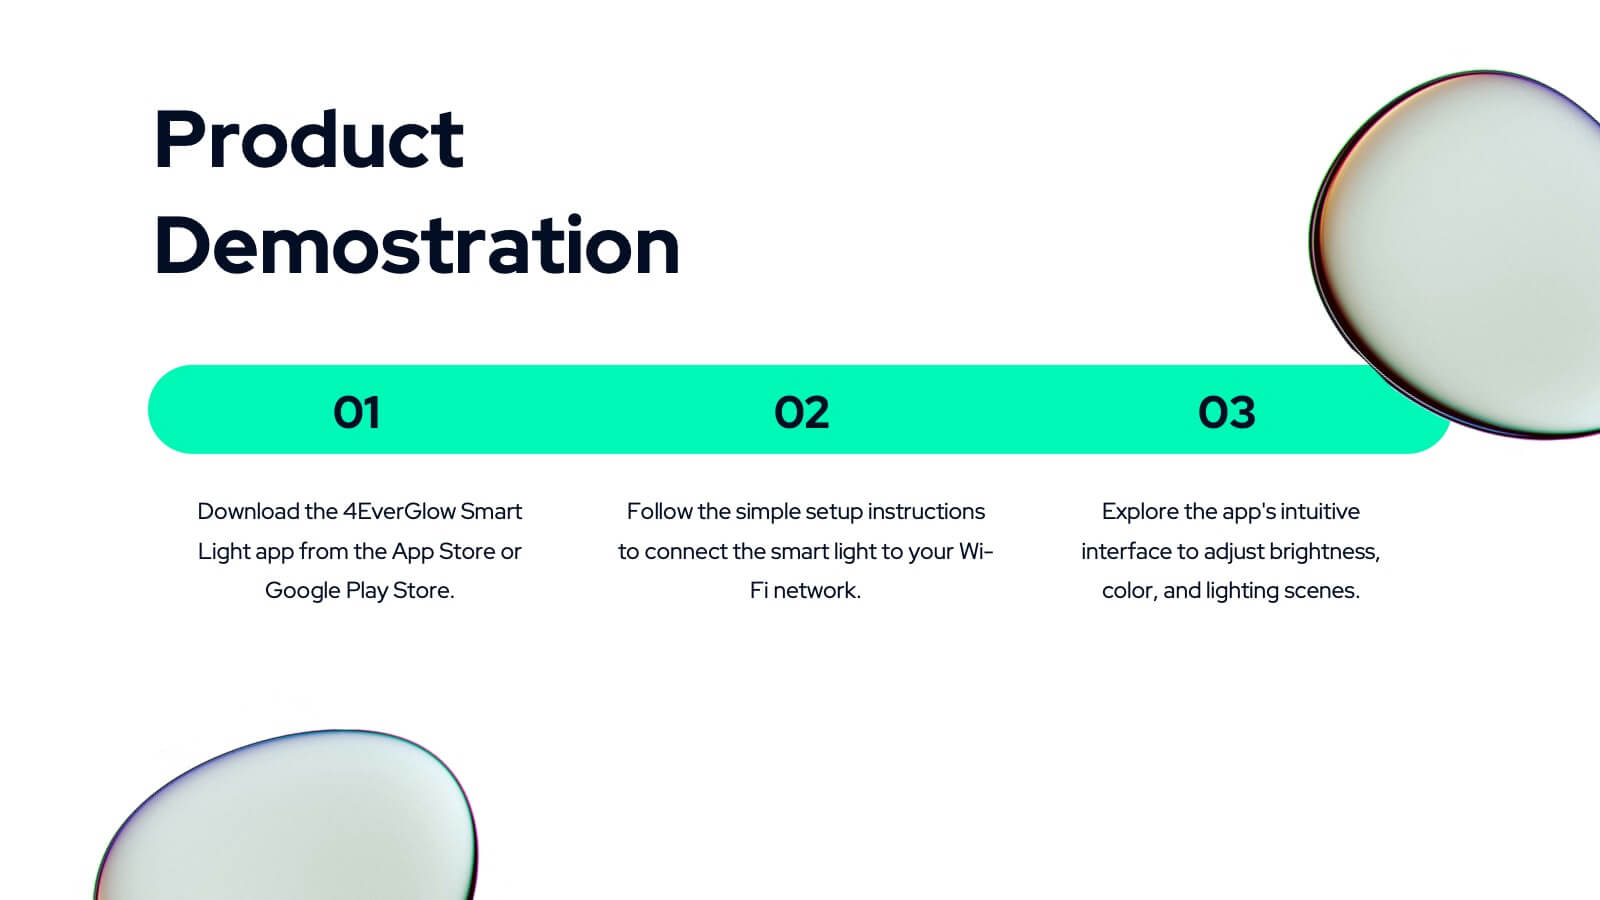
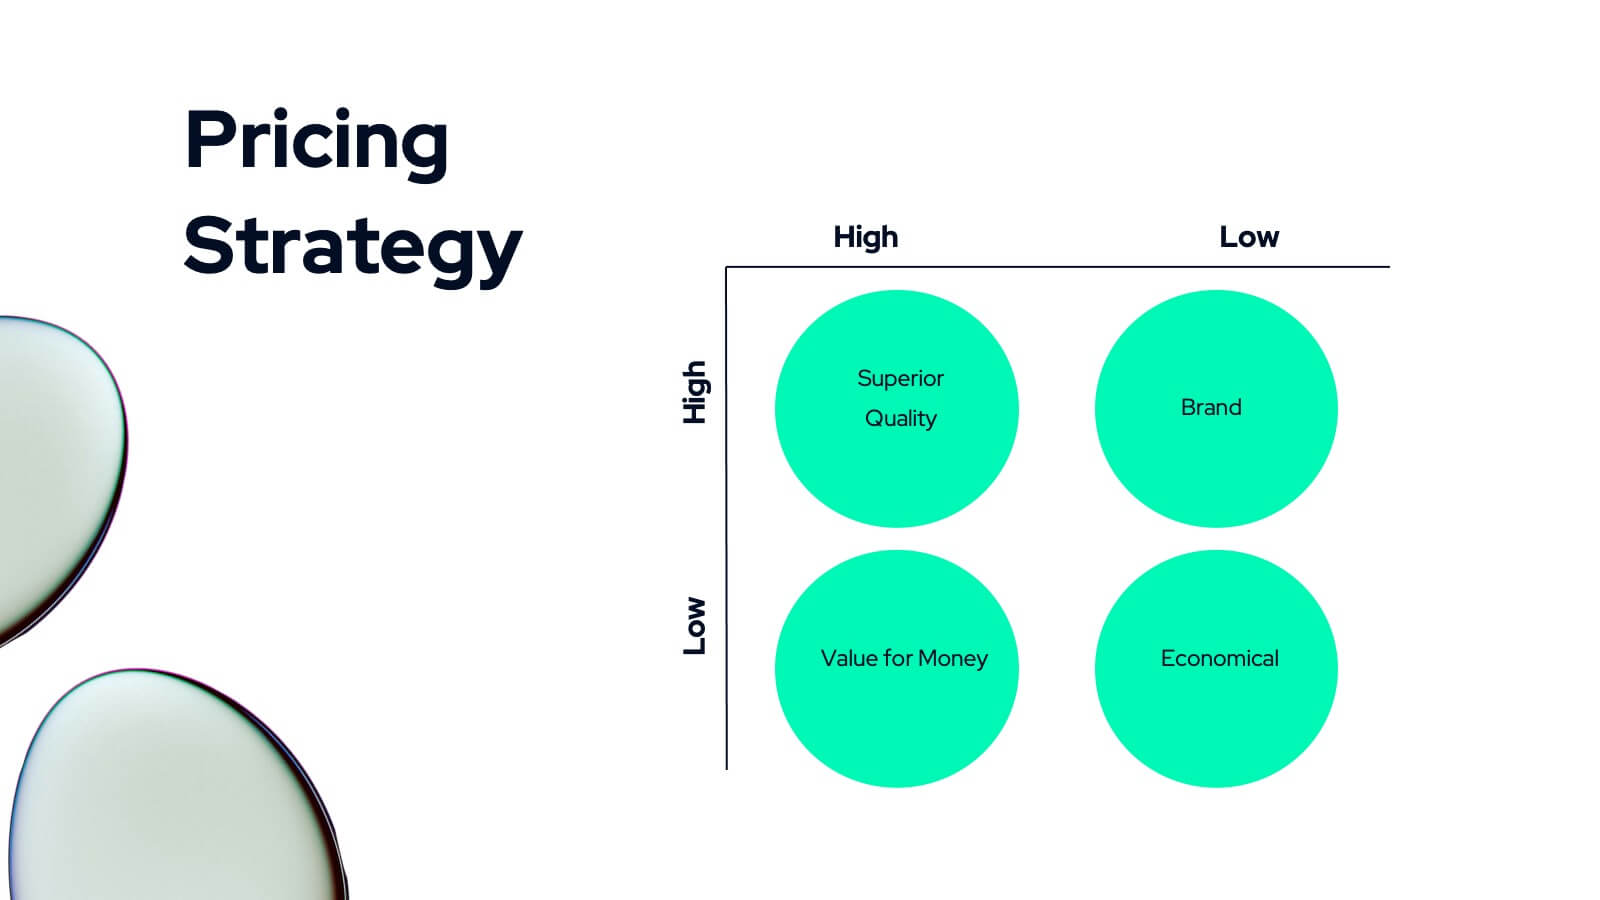
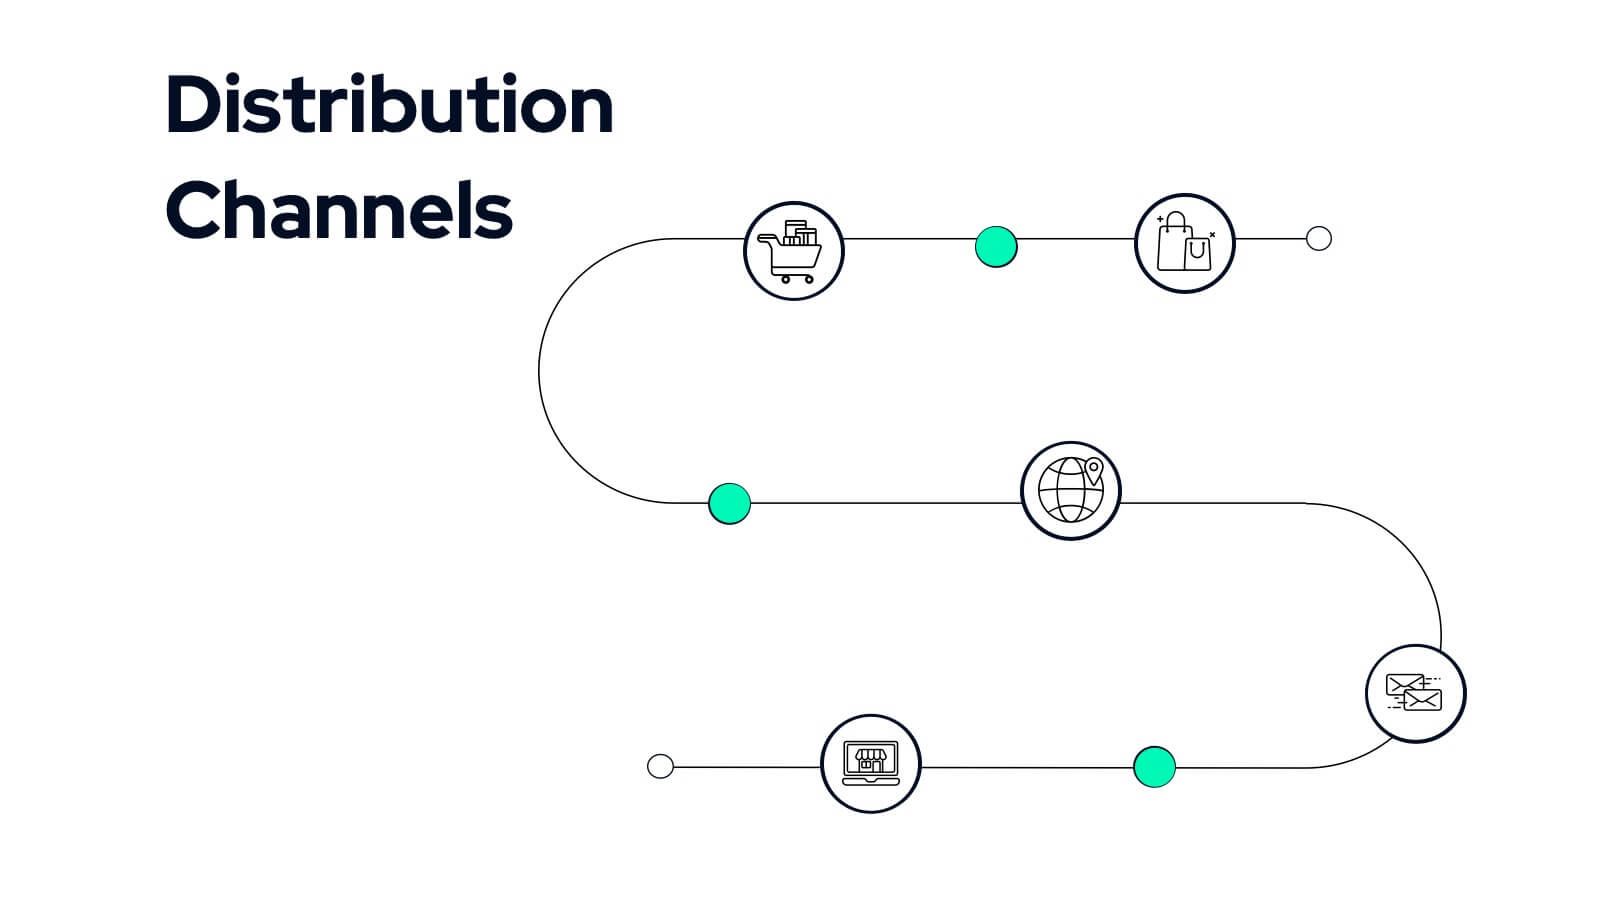
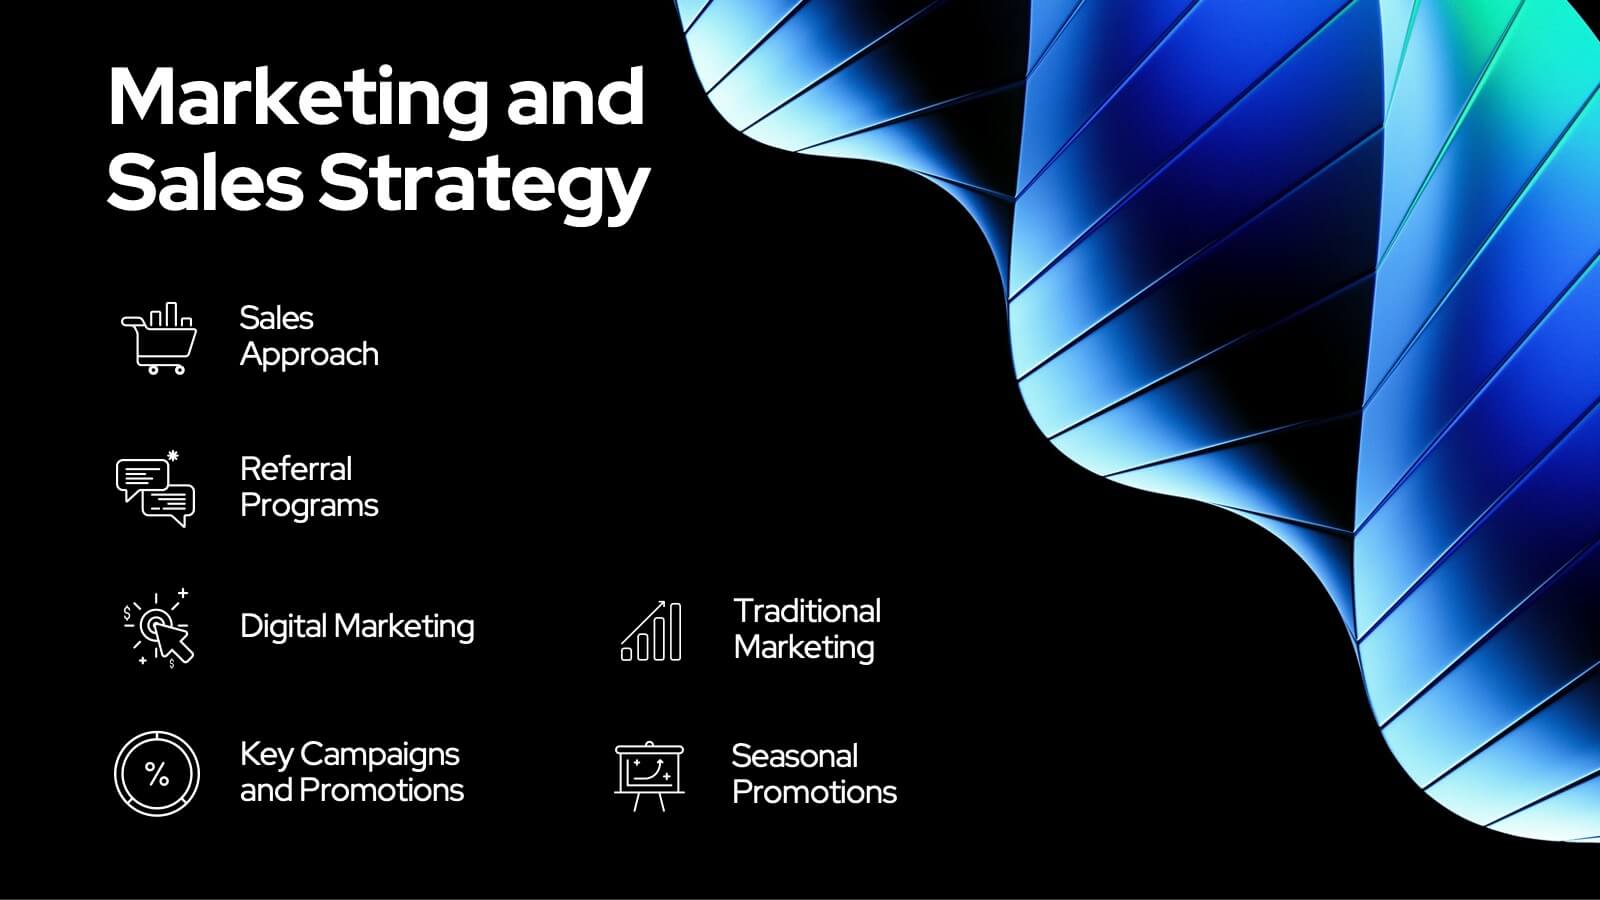
Competitive Advantage Blue Ocean Strategy
Highlight strategic positioning with this Competitive Advantage Blue Ocean template. Designed with clear flow visuals and modern iconography, it’s perfect for showcasing unique value propositions, competitive edges, and market leadership strategies. Easy to edit in PowerPoint, Keynote, and Google Slides for seamless customization.


10 slides
SEO and Content Marketing Plan
Highlight your SEO and content strategy with a modern magnifying glass-themed design. This slide makes it easy to break down key phases like keyword research, content creation, optimization, and analytics. Fully customizable and compatible with PowerPoint, Keynote, and Google Slides.


7 slides
Business Process Checklist
Simplify workflow tracking with this visual business process checklist slide. Featuring circular progress bars and bold letter labels (A–C), this template helps visualize task completion percentages for up to six steps. Perfect for audits, quality checks, or operational reviews. Fully customizable in PowerPoint, Keynote, and Google Slides.


6 slides
Mind Map Ideas Infographic
A Mind Map is a visual representation of ideas, concepts, and relationships, often created around a central topic or theme. This infographic mind map template offer a versatile and effective method for organizing, analyzing, and visualizing information, making them valuable tools for learning, problem-solving, and creative exploration. The structure of this template consists of the central idea or topic placed at the center of the map. This template provides a structured way to showcase and organize ideas using the mind mapping technique. Compatible with Powerpoint, Keynote, and Google Slides.


8 slides
Geographic Heat Map Analysis Presentation
Bring your data to life with a vibrant map that instantly reveals regional patterns and performance differences. Ideal for presenting location-based insights, sales metrics, or demographic trends, this presentation combines clarity with visual impact. Fully compatible with PowerPoint, Keynote, and Google Slides for easy editing and professional results.


6 slides
Business Tree Diagram Layout Presentation
Bring your ideas to life with a dynamic visual flow that connects every stage of your business strategy. Perfect for mapping growth, processes, or team structures, this clean and modern layout keeps your data clear and engaging. Fully compatible with PowerPoint, Keynote, and Google Slides for effortless customization.


5 slides
Long-Term Business Strategy Framework
Outline your roadmap to sustainable growth with the Long-Term Business Strategy Framework Presentation. This slide features a bold, horizontal arrow layout divided into four segments—each representing a core phase of your strategic plan. It includes icons and space for key insights under each step, making it perfect for visualizing vision alignment, operational planning, or organizational milestones. Fully customizable in PowerPoint, Keynote, and Google Slides.


6 slides
Touchpoint-Based Customer Journey Map Presentation
Visualize each stage of the user experience with this Touchpoint-Based Customer Journey Map presentation. Perfect for tracking interactions across the customer lifecycle—from awareness to loyalty—this layout helps pinpoint strengths and gaps at every phase. Clean columns and color-coded touchpoints ensure quick analysis. Fully compatible with PowerPoint, Canva, and Google Slides.


5 slides
Project Scope Management Structure Presentation
Zoom in on every critical stage with the Project Scope Management Structure Presentation. This visual template uses magnifying glass graphics to represent five key project phases, helping you highlight detailed scope elements clearly. Fully editable in PowerPoint, Keynote, and Google Slides, it's perfect for structured planning and reporting presentations.


20 slides
Solar Beam Sales Proposal Presentation
Supercharge your sales presentation with the Solar Beam Sales Proposal template! This vibrant and dynamic template is designed to capture attention and drive home your key points with flair. Start with a bold introduction, then seamlessly guide your audience through your company overview, product/service details, and target market analysis. Highlight your sales objectives, showcase your team, and provide compelling customer testimonials. With dedicated slides for pricing strategies, sales collateral, and performance metrics, you’ll have all the tools you need to make a persuasive pitch. The template also includes sections for discussing future opportunities, action plans, and a Q&A session to address any final questions. Its modern, professional design ensures that your proposal stands out in any setting. Fully customizable and compatible with PowerPoint, Keynote, and Google Slides, this template is your go-to for creating impactful sales presentations that leave a lasting impression.


21 slides
Selkie New Product Proposal Presentation
Dive into your next big idea with this sleek, Selkie-inspired presentation template, designed for presenting a new product proposal! Highlight key features, market opportunities, and potential growth in a visually captivating format that flows effortlessly. Engage your audience and make an impact. Compatible with PowerPoint, Keynote, and Google Slides for easy customization.


7 slides
Regular Smile Rating Infographic
In the age of customer feedback and reviews, understanding satisfaction levels is paramount. Our regular smile rating infographic, bursting with vibrant shades of green, red, yellow, and orange, offers a visually engaging method to gauge emotions and sentiments. Designed with expressive faces, it showcases a range of sentiments from displeasure to sheer joy. This template is an indispensable tool for businesses, educators, and surveyors eager to capture genuine responses and sentiments. With compatibility across PowerPoint, Keynote, and Google Slides, this infographic is poised to make your presentations more interactive and insightful.


7 slides
Consecutive Numbers Infographic
Dive into the world of mathematics with our Consecutive Numbers Infographic! Employing an array of serene blues and greens, this visually appealing tool breaks down the concept of consecutive numbers in a fun and comprehensible manner. It's an educator's dream, designed to captivate and engage, making the topic accessible for students of various age groups. Beyond the classroom, it's a handy reference for professionals and enthusiasts alike. With compatibility spanning PowerPoint, Keynote, and Google Slides, this infographic is poised to elevate any presentation, workshop, or lecture it graces.


7 slides
Remote Work Guidelines and Setup Presentation
Bring clarity to your remote work setup with this sleek visual guide—designed to communicate processes, tools, and best practices in one easy-to-follow layout. Whether you're onboarding a team or streamlining operations, this slide helps break it all down step by step. Fully compatible with PowerPoint, Keynote, and Google Slides.


4 slides
Agile Workflow Presentation
Bring energy and motion to your process overview with a clean, loop-based flow that makes each stage easy to follow. This presentation is designed to clarify steps, illustrate iterations, and support clear decision-making for any project. Fully customizable and compatible with PowerPoint, Keynote, and Google Slides.