


Features
- 5 Unique slides
- Fully editable and easy to edit in Microsoft Powerpoint, Keynote and Google Slides
- 16:9 widescreen layout
- Clean and professional designs
- Export to JPG, PDF or send by email


Do you have any questions?
Recommend


5 slides
Rival Strategy Review Presentation
Bring competitive insights to life with a modern, circular layout that highlights rival strategies, key strengths, and market positioning. Perfect for analyzing competitors and identifying growth opportunities, this presentation combines clarity with style. Fully compatible with PowerPoint, Keynote, and Google Slides for effortless customization and professional delivery.


7 slides
Enforcement Law Infographic Presentation
A Law Enforcement Infographic is a visual representation of key concepts, statistics, and procedures related to law enforcement. This template can be used to provide an overview of various aspects of law enforcement, such as crime rates, policing strategies, and legal procedures. This infographic includes a variety of icons, illustrations, and other design elements law themed to enhance the visual appeal and make it more appealing for your viewers. This template is compatible with Powerpoint, Keynote and Google Slides making it easy to customize and edit with your own text and information.


7 slides
Chart Comparison Infographic Presentation
Chart Comparison is the process of comparing different charts or graphs to identify similarities. It involves analyzing multiple sets of data by visually presenting them in charts. Use this template to show the comparison of various charts and how things look when they are compared. This template will help you create a professional Infographic presentation that highlights the key differences between data sets. Each chart can have it's own color, so you can use any color you want. You can also add text in the chart with your own content, and edit in Powerpoint, Keynote, or Google Slides.


8 slides
Machine Learning Overview Presentation
The "Machine Learning Overview" presentation template features a central circular design that effectively illustrates the interconnectedness of various components in machine learning processes. Each segment of the circle is dedicated to a key area such as data acquisition, algorithm development, model training, validation, and deployment, which are critical to understanding and executing machine learning projects. This visual arrangement makes it easy to follow and is ideal for educational environments or professional settings where clarity and concise information delivery are essential.


10 slides
Business Expansion and Growth Path Presentation
Illustrate your company’s strategic milestones with the Business Expansion and Growth Path Presentation. This step-by-step layout is perfect for showcasing phases of development, scaling goals, or startup growth trajectories. Fully customizable in PowerPoint, Keynote, and Google Slides—ideal for business plans, pitch decks, and strategic reviews.


7 slides
Business 3D Infographic
Bring a new dimension to your business presentations with our 3D Business Infographics. These dynamic visuals are perfect for professionals and educators who want to add depth to their data representation and make complex information more accessible. Our 3D Business Infographics collection features a range of formats, from layered pyramids to multidimensional bar graphs, allowing for innovative depictions of hierarchies, relationships, and progressions. Whether you're illustrating strategic frameworks, financial analysis, or project milestones, these graphics can enhance understanding and engagement. Customizable for any business context, these infographics are designed to stand out in reports, presentations, or educational materials. Their SEO-friendly nature ensures that your content is more likely to be seen and shared, extending your reach. Use these 3D infographics to make a strong visual impact that communicates your business concepts with clarity and creativity.


20 slides
Whisper Creative Portfolio Presentation
The Creative Portfolio Presentation Template is a visually striking 20-slide design, ideal for showcasing your professional work or services. It features slides for introductions, about us, portfolio overviews, and individual project highlights. Key sections include philosophy, style, creative process, client testimonials, awards, and pricing structures. The vibrant yellow and pink gradient elements provide a modern, creative flair that grabs attention. Fully customizable and compatible with PowerPoint, Keynote, and Google Slides, this template is perfect for designers, agencies, and freelancers aiming to present their work professionally and uniquely.


4 slides
AIDA Marketing Funnel Slide Presentation
Capture attention from the very first slide with a bold, structured layout that turns each stage of your message into a clear, engaging flow. This presentation helps simplify complex decision paths and guide viewers through each step with ease. Fully editable and compatible with PowerPoint, Keynote, and Google Slides.


21 slides
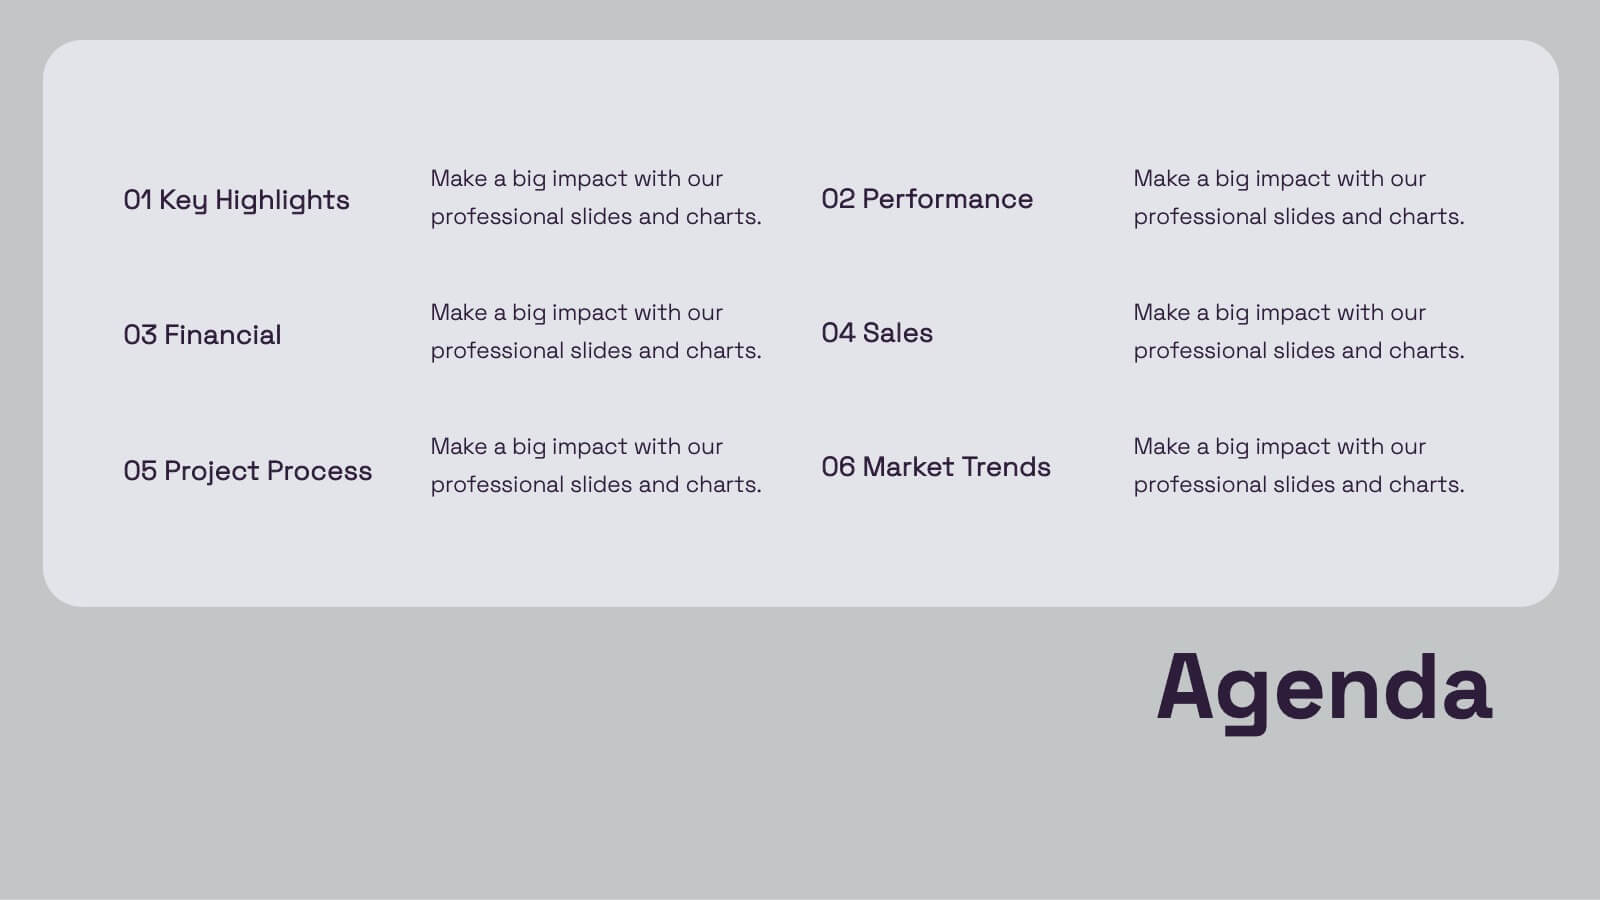
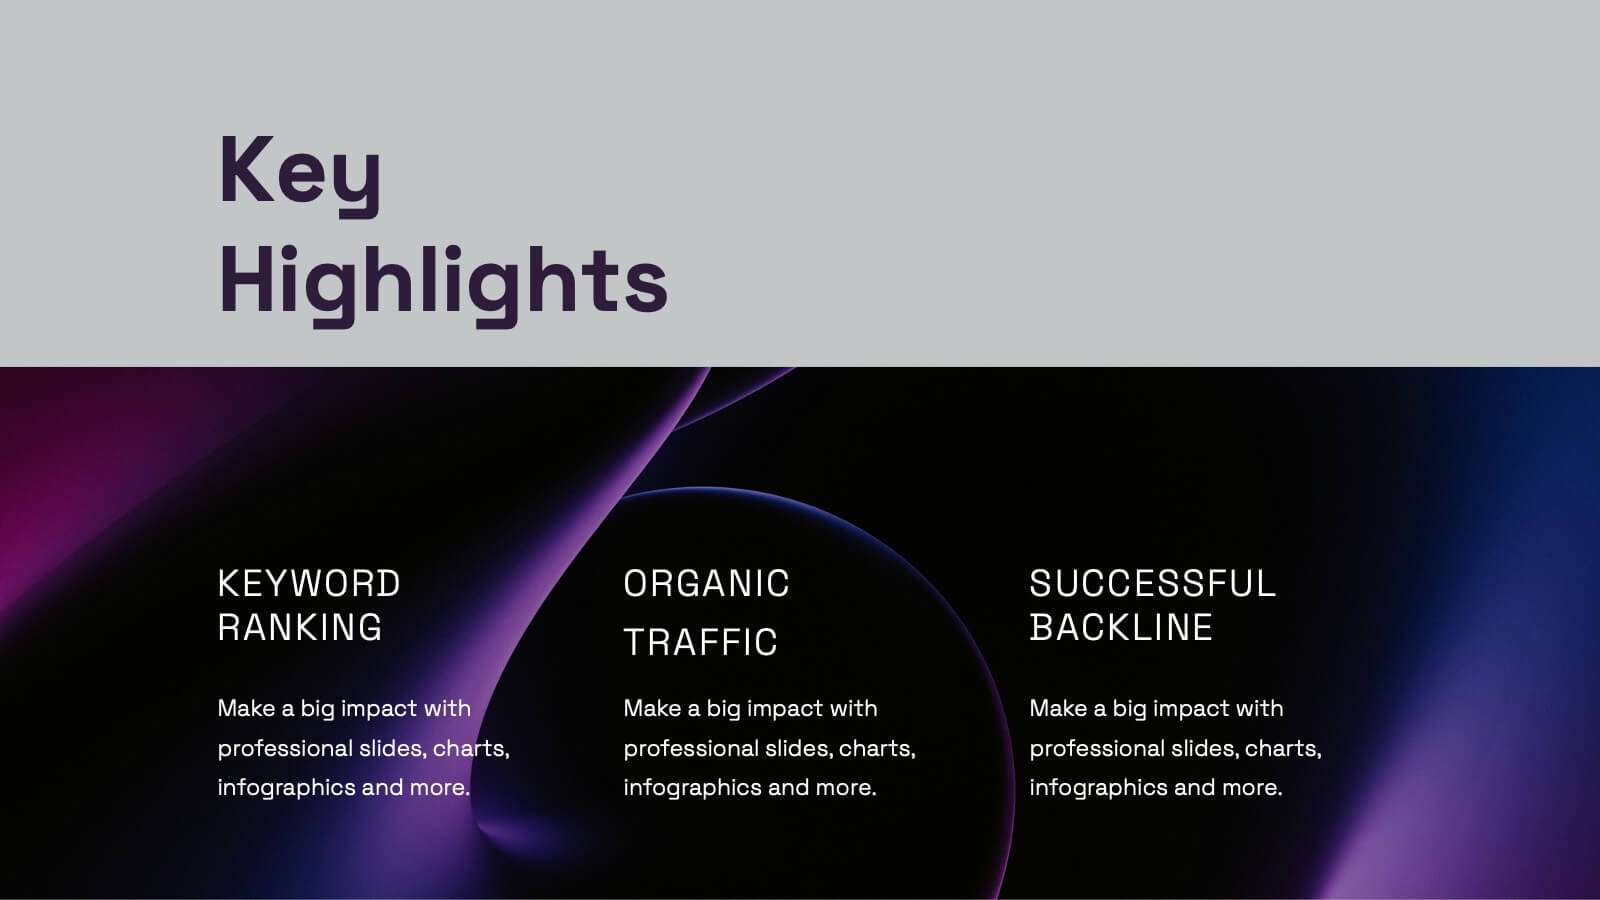
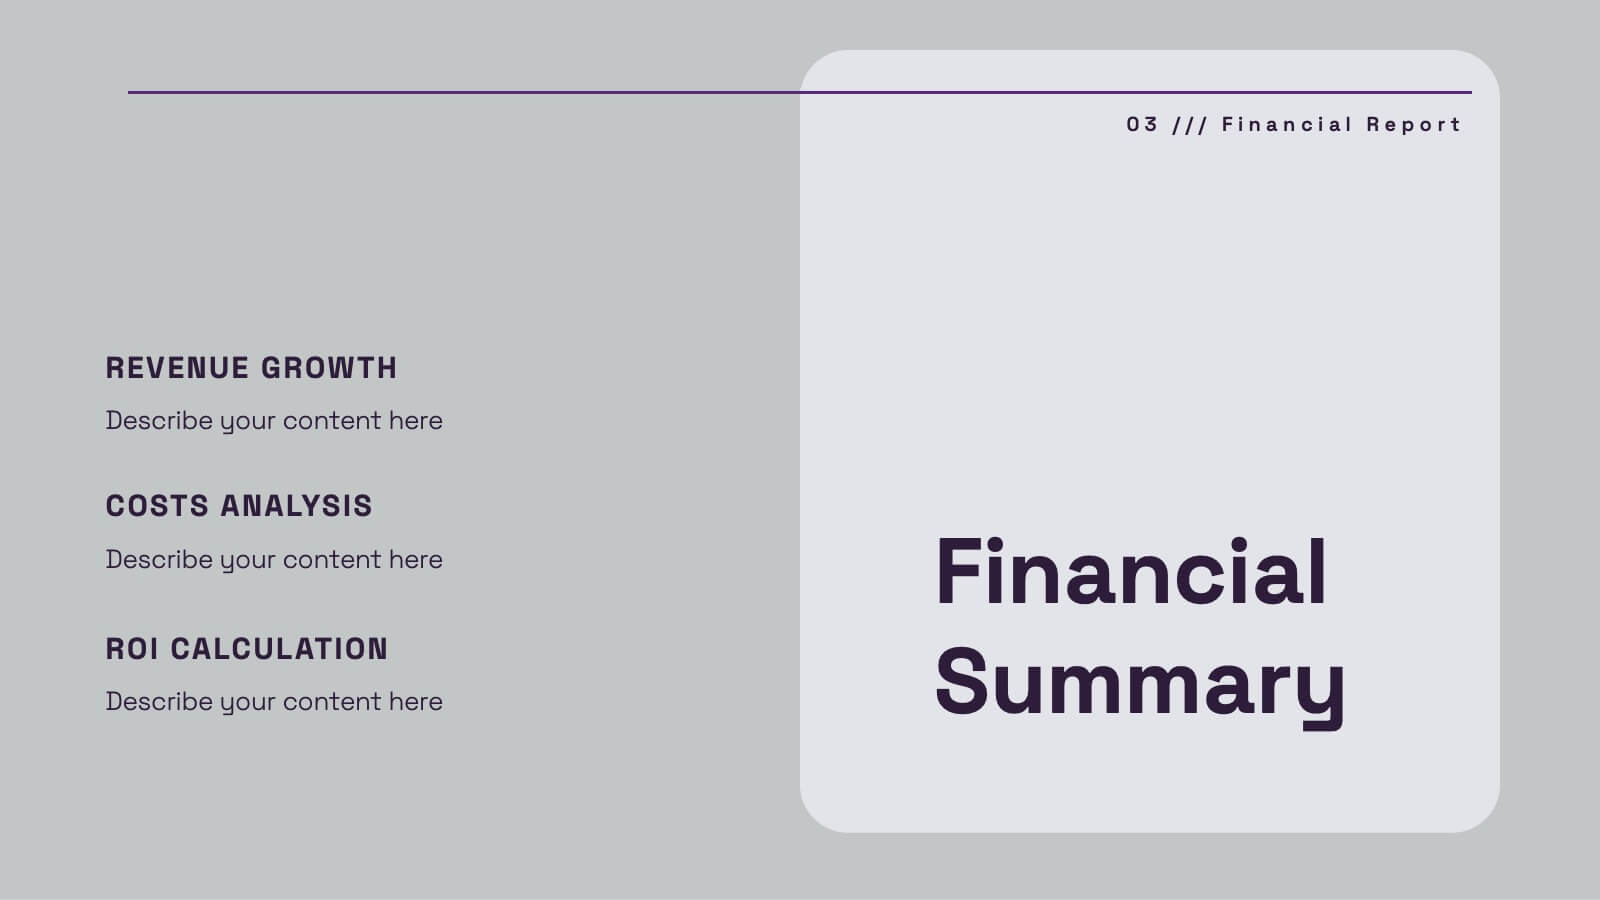
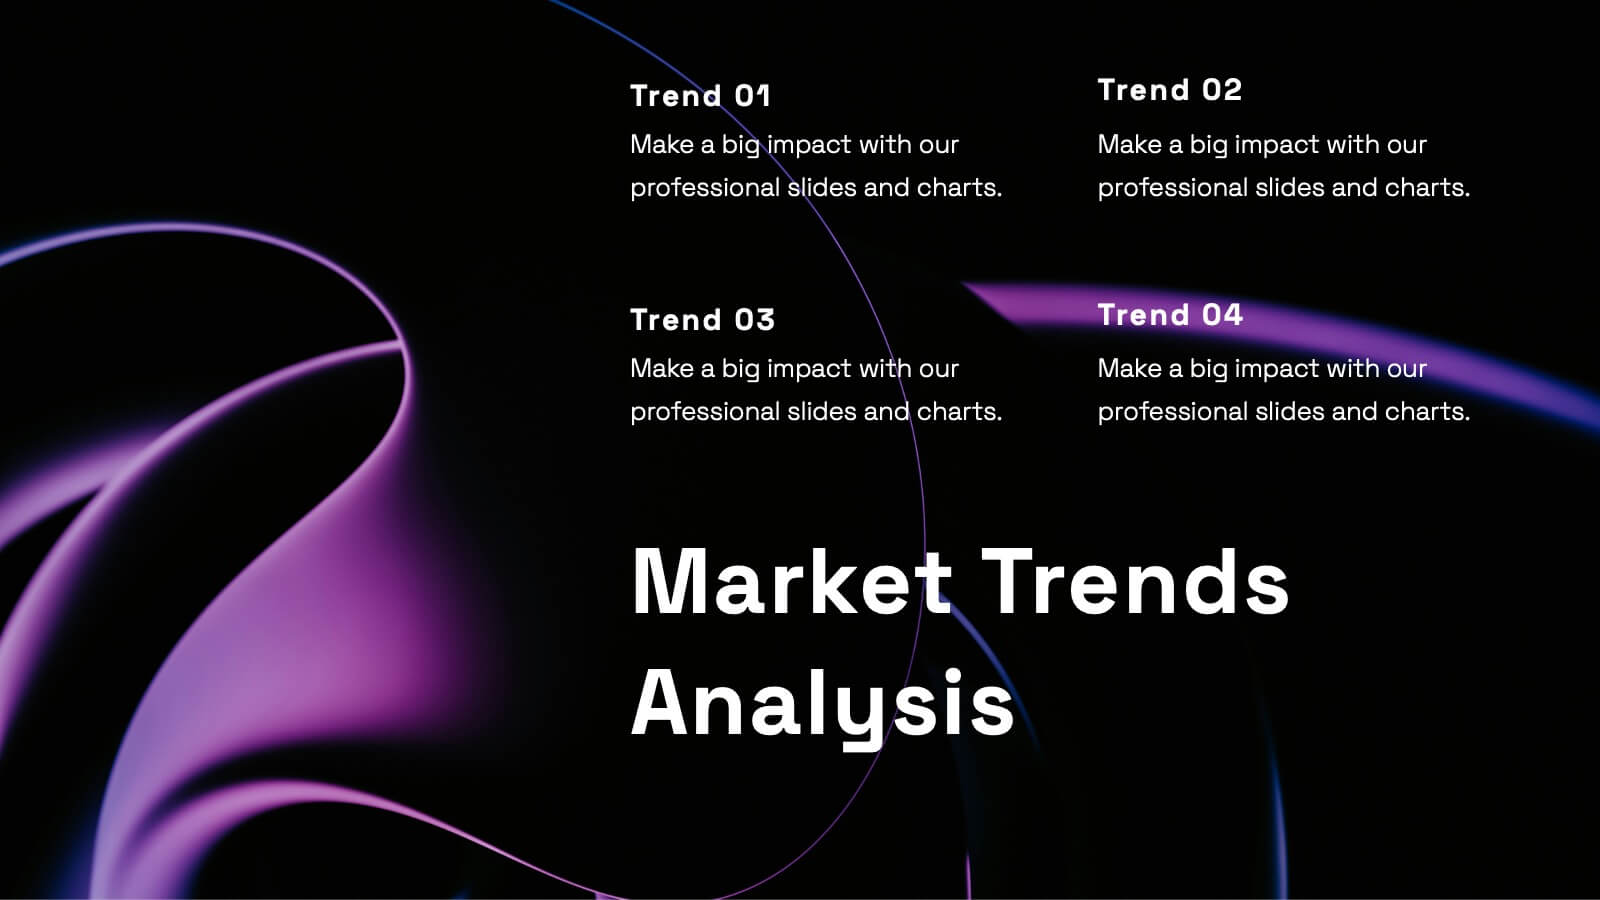
Uplift Financial Report Presentation
Present your financial or business report with this sleek and modern presentation template! It includes essential sections such as performance metrics, financial summaries, project progress, and market trends analysis, ensuring a comprehensive overview. Whether you're discussing key achievements or competitor insights, this template is perfect for delivering a professional and polished report. Compatible with PowerPoint, Keynote, and Google Slides for easy use and customization.


4 slides
Business Growth through AIDA Model Presentation
Visualize the buyer’s journey with this engaging AIDA model slide. Featuring rounded 3D-style shapes and clear progression from Attention to Action, this layout is ideal for marketing plans, customer engagement strategies, or sales funnels. Each stage is color-coded and icon-enhanced for clarity. Easily customizable in PowerPoint, Keynote, and Google Slides.


7 slides
Structure Infographic Presentation Template
A structure infographic is a visual aid that is designed to help present information about the structural components of a particular topic. This template can be used to create presentations on a variety of subjects, such as education, business, buildings, machines, or organisms, and can help to break down complex information. Use this PowerPoint template to structure your most important ideas and impress your audience with more than just a bullet point list. Take a look at our infographic presentation templates if you want to add a bit of personality to your next presentation design!


5 slides
Business Strategy Planning Puzzle Presentation
Visualize interconnected initiatives with this Business Strategy Planning Puzzle Presentation. The magnifying glass design and five-piece puzzle format help you break down complex strategy components into digestible segments. Ideal for highlighting core objectives, key performance drivers, and strategic focus areas. Fully customizable with editable text boxes and icons. Compatible with PowerPoint, Keynote, and Google Slides.


5 slides
Myths & Facts About Cases Of Mass Hysteria Infographics
Delve into the intriguing world of collective human psychology with myths & facts about cases of mass hysteria infographics. Set against an engaging purple backdrop, these infographics are designed to captivate, educate, and debunk misconceptions surrounding mass hysteria events. Ideal for historians, educators, psychologists, and students. The creative use of vibrant colors and compelling icons help in breaking down complex psychological phenomena into understandable content, making it easier to spark discussion on this fascinating subject. Whether it's for academic purposes, or informational content, this template stands out by blending education with intriguing storytelling.


26 slides
Understanding the Stock Market Presentation
Step into the exciting world of finance with our dynamic and sleek presentation template, perfect for understanding the stock market! This comprehensive guide simplifies complex financial concepts, making it an ideal resource for beginners, students, and professionals. Featuring a sophisticated collection of slides, this template covers key topics such as market trends, investment strategies, and financial analysis. The design integrates bold colors, sharp graphics, and well-organized layouts to keep your audience engaged and informed. Infographics and charts break down intricate data, while mockups offer realistic previews of stock market tools. Fully customizable and versatile, this template can be adapted to suit various presentation needs and styles. It is compatible with PowerPoint, Keynote, and Google Slides, ensuring smooth and professional presentations across different platforms. Perfect for financial workshops, educational seminars, or anyone looking to deepen their understanding of the stock market.


6 slides
Company Value Proposition Presentation
Bring your brand’s promise to life with a clean, engaging visual flow that highlights what makes your business stand out. This presentation is perfect for showcasing your mission, vision, and key differentiators with clarity and impact. Fully compatible with PowerPoint, Keynote, and Google Slides for seamless editing.


7 slides
Mental Agility Training Infographic
Embark on the enlightening path of training with our intricately designed mental agility training infographic. Illuminated by the motivation of yellow, the growth of green, and the depth of blue, our template effectively outlines training methodologies and outcomes. Adorned with precision-focused infographics, intuitive icons, and adaptable image placeholders, it renders complex training data into an easily digestible format. Expertly sculpted for Powerpoint, Keynote, or Google Slides. A quintessential tool for trainers, HR professionals, or any organization aiming to elevate its training regimen. Enlighten your audience; let every slide be a step towards mastery.


7 slides
Alphabet Infographic Presentation Template
Our Alphabet Infographic features a well-designed set of icons, letters and numbers. This template is perfect for PowerPoint presentations and will allow you to enhance your business/school design. Make your data sets easily readable, attractive and concise with this template. This Alphabet Infographic template is perfect for making your pitch stand out, with a bold and catchy design. It features a modern look that captures viewer's attention, but also contains plenty of details for them to explore. The colors are bright and vibrant, so you know the message won't be forgotten easily.