


Features
- 4 Unique slides
- Fully editable and easy to edit in Microsoft Powerpoint, Keynote and Google Slides
- 16:9 widescreen layout
- Clean and professional designs
- Export to JPG, PDF or send by email


Do you have any questions?
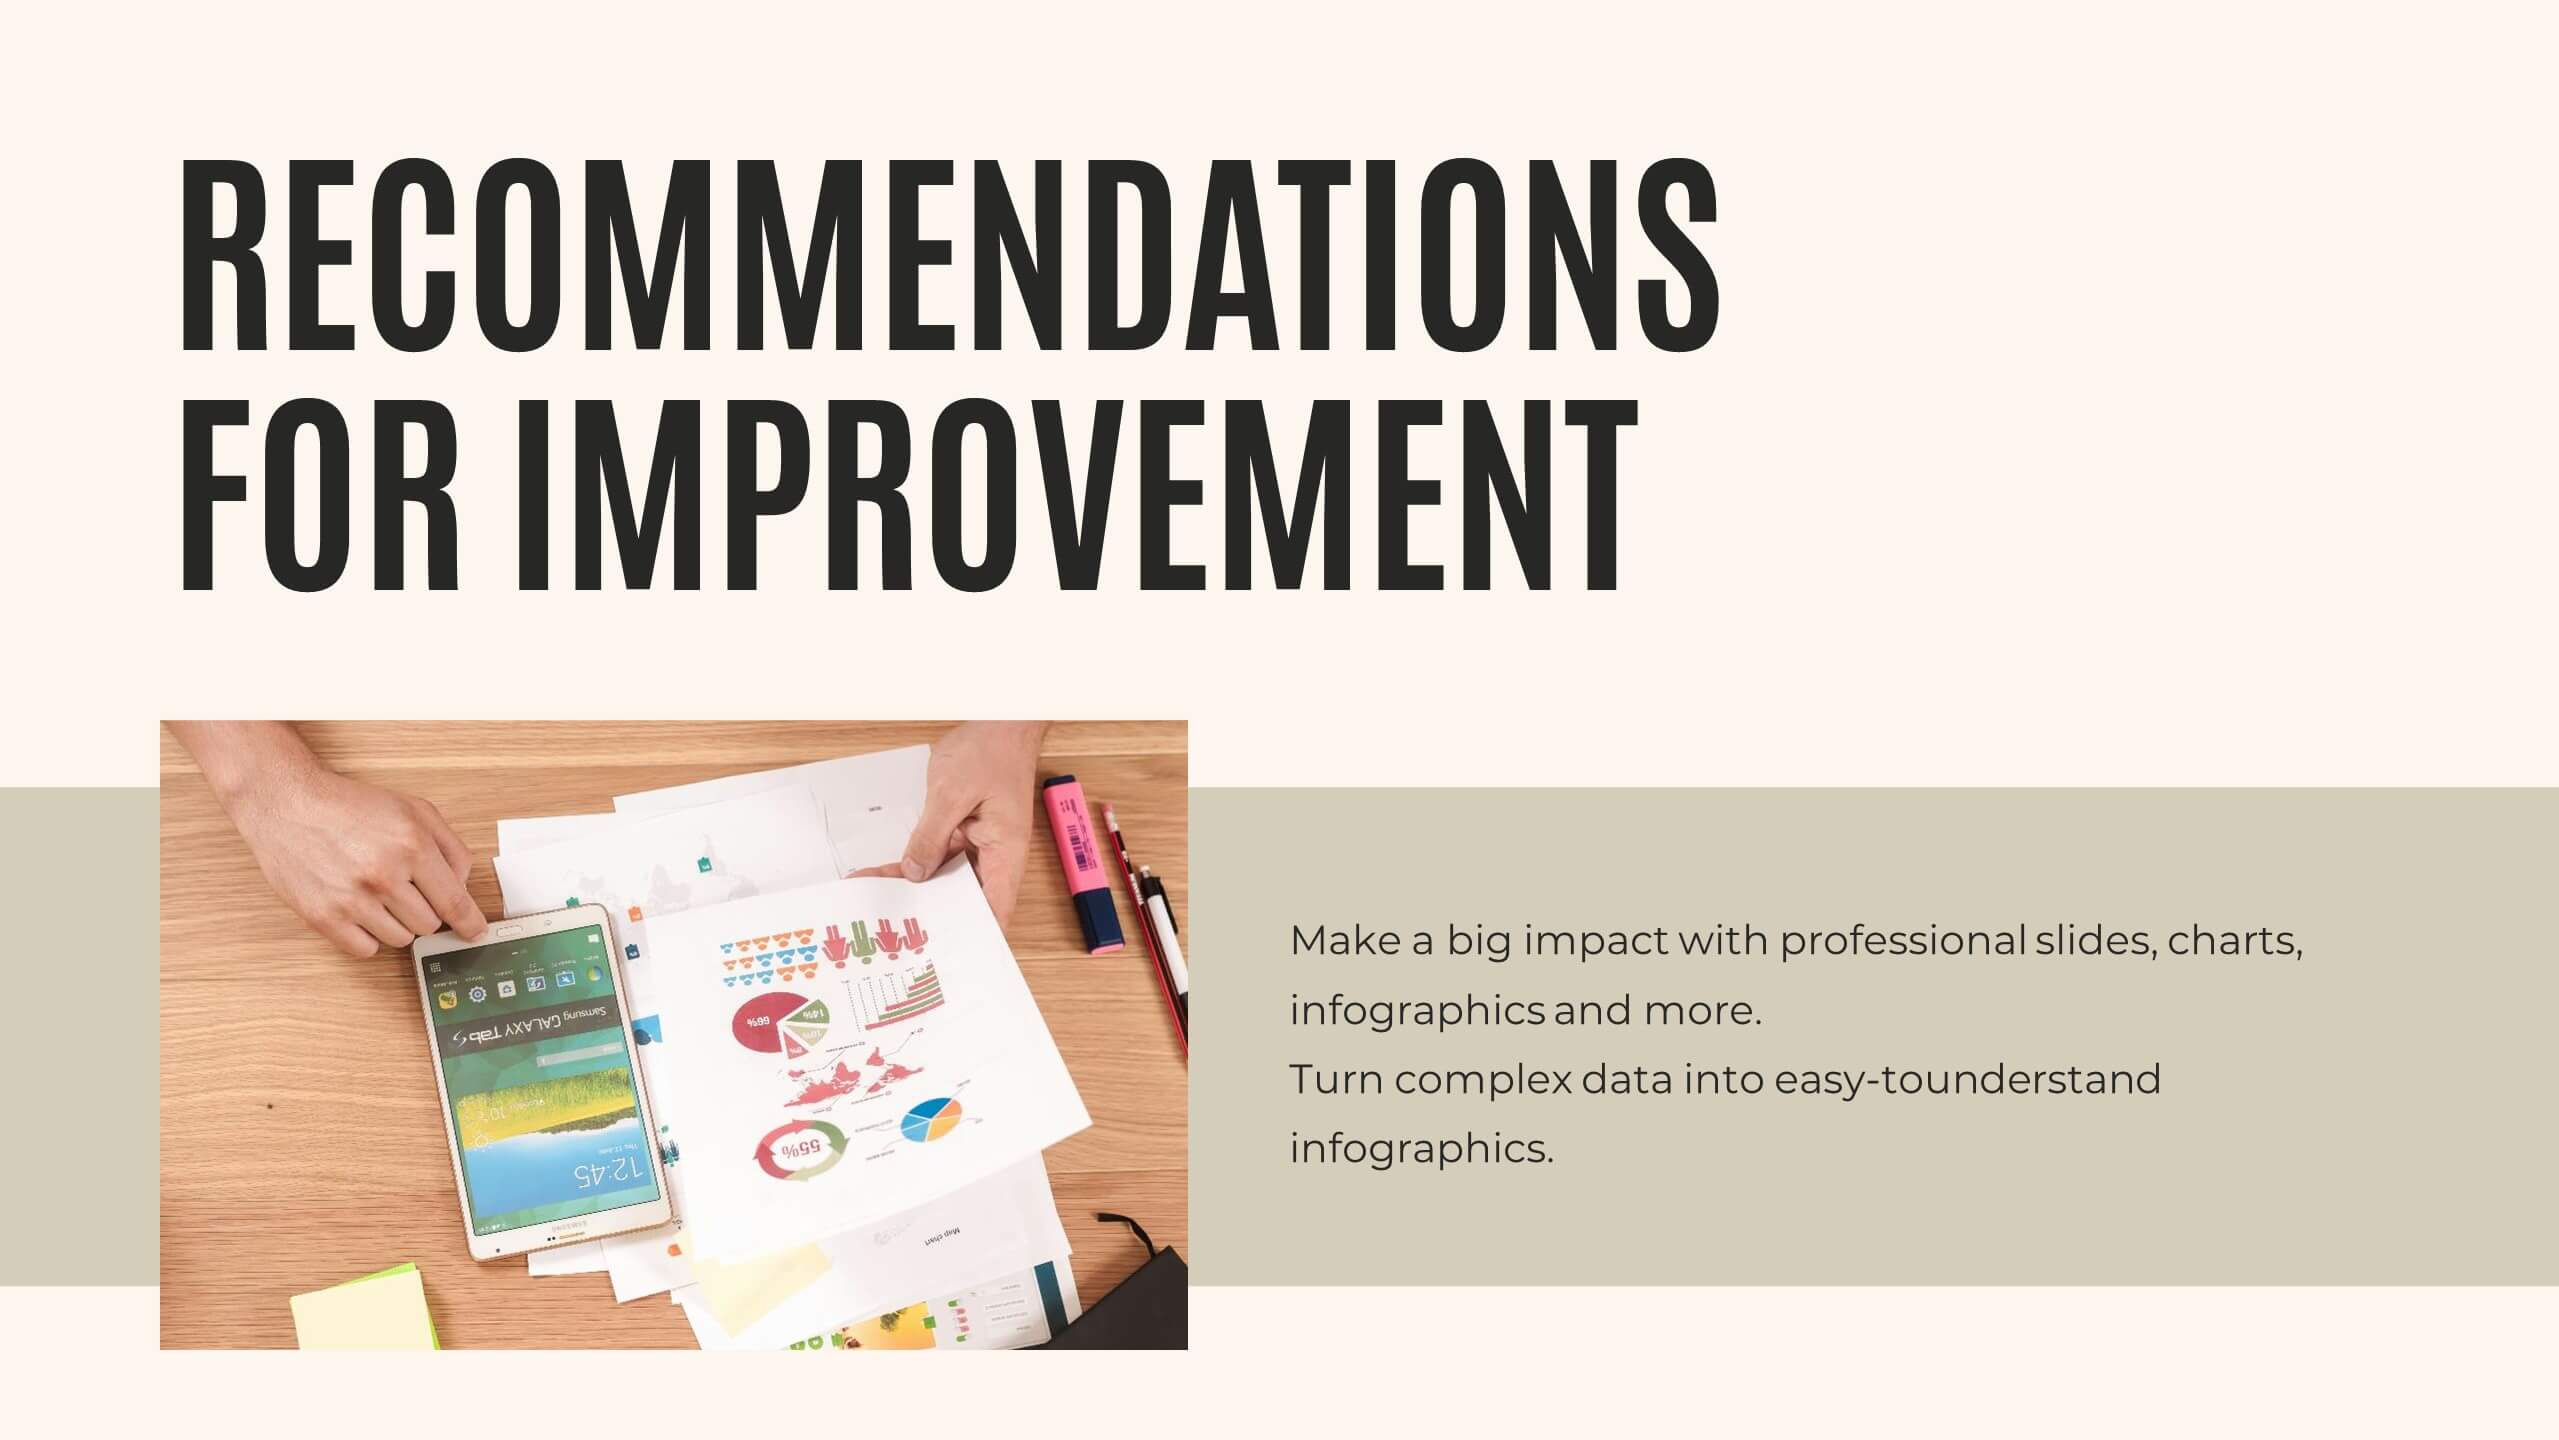
Recommend


7 slides
Goals Infographic Presentation Template
A goals infographic is a set of goals, objectives, or plans, often used for personal or organizational planning and development. This template allows you to include information about your specific goals, the steps required to achieve them, the timeline for completion, and any relevant metrics or targets. The purpose of our goals infographic is to help you provide a clear and concise overview of what is to be accomplished, and help you keep focus on achieving those goals. This well-designed infographic can help you prioritize and track progress, and can serve as a visual reminder.


4 slides
End Slide with Strategic Reflection Presentation
Wrap up your presentation with purpose using the End Slide with Strategic Reflection Presentation. Designed to highlight final insights, priorities, or key outcomes, this template features a visual pyramid layout ideal for summarizing growth, goals, or performance tiers. Fully editable in Canva, PowerPoint, and Google Slides for easy customization.


5 slides
Scrum Team Roles Presentation
A clear, engaging layout brings this presentation to life, making it easy to explain how each role contributes to a productive, collaborative workflow. Designed to simplify complex team structures, it helps you communicate responsibilities with confidence and clarity. Fully compatible with PowerPoint, Keynote, and Google Slides.


23 slides
Sunstone Investor Pitch Presentation
Captivate investors with this professionally crafted pitch deck, showcasing sections for company overview, problem and solution, market opportunity, revenue model, competitive landscape, and growth projections. Present your team, financials, milestones, and funding requirements effectively. Ideal for securing investment and support. Fully customizable for PowerPoint, Keynote, and Google Slides.


6 slides
Title Hierarchy Infographic
The collection of slides is designed to efficiently convey key themes with a striking visual appeal, ensuring that crucial topics are presented with clarity and emphasis. Each slide utilizes bold typography and a unique color palette to draw attention and maintain viewer engagement. The designs incorporate dynamic shapes and minimalist layouts, enhancing the presentation's readability while emphasizing important content. This set is ideal for professionals aiming to present complex ideas in a clear and memorable way during meetings or in corporate documents. It supports various communicative goals, such as introducing concepts, outlining challenges, or promoting organizational initiatives, making it a versatile tool for enhancing message delivery in any professional setting.


8 slides
Achievements and Goals Milestone
Illustrate your team's journey with this visually engaging milestone roadmap. Featuring a step-by-step block design with space for five key accomplishments, it's perfect for goal tracking, progress reviews, or roadmap presentations. Fully editable in PowerPoint, Keynote, and Google Slides.


7 slides
Tree Branch Diagram Infographic
The Tree Branch Diagram Infographic is a versatile template designed to showcase hierarchical information and relationships between different categories or levels of data. Its tree-like structure branches out from a central idea, making it ideal for visualizing organizational structures, decision trees, or classification systems. Each branch represents a unique segment of information, which can be further divided into sub-categories, providing a clear and comprehensive view of complex data. The design is user-friendly and adaptable, suitable for use in PowerPoint, Google Slides, and Keynote presentations.


7 slides
Trading Cryptocurrency Infographic
The world of cryptocurrency is ever-evolving, and keeping track of trading insights is crucial. The trading cryptocurrency infographic offers a dynamic visualization of this digital currency realm. Using a vivid palette of white, red, and blue, it deciphers complex trading data into comprehensible visuals. Ideal for traders, financial analysts, and those new to the crypto market, this infographic serves as an essential guide to navigate the digital finance landscape. Its compatibility with PowerPoint, Keynote, and Google Slides ensures that presenting your trading insights has never been easier or more stylish.


2 slides
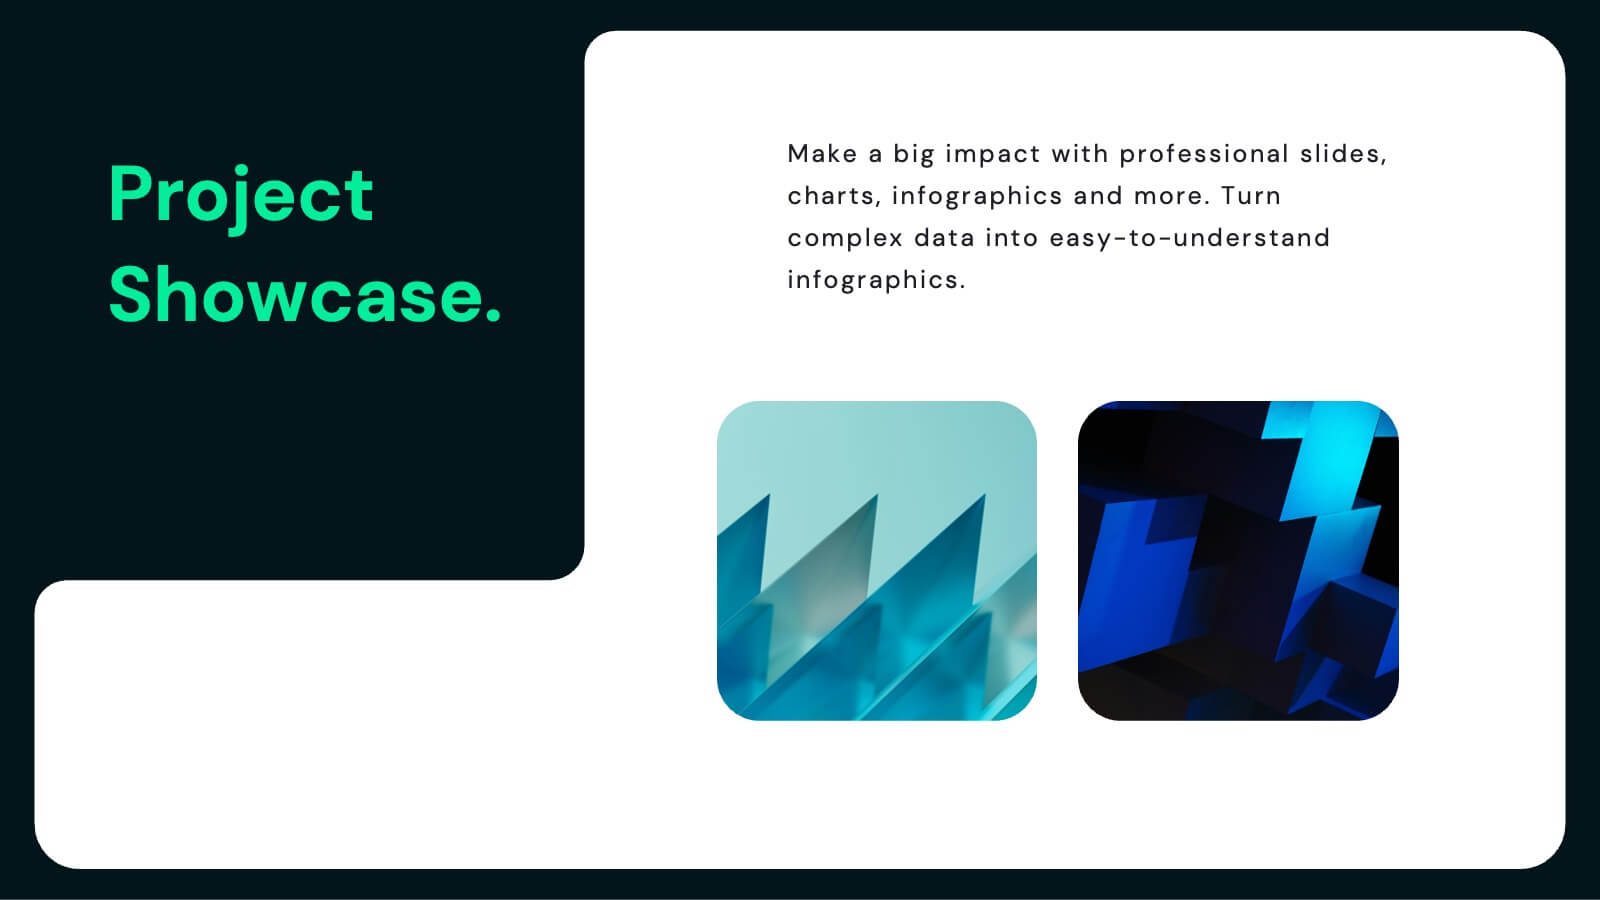
Digital Mockup Screens for Apps Presentation
Showcase your app in action with the Digital Mockup Screens for Apps Presentation. This bold and modern slide layout centers your mobile UI on colorful abstract shapes, drawing attention to your product. Ideal for startup demos, app features, or UI/UX portfolios. Fully editable in PowerPoint, Keynote, Canva, and Google Slides.


7 slides
Loves Travel Infographic Presentation
Travel is an opportunity to get out of our comfort zones and be inspired to try new things, it changes our perspective on the world. Use this template to give your audience an overview of a trip and prepare them for what they will be experiencing. This template features an infographic style design, with plenty of room to describe the locations and activities as well as instructions and tips. Build your own infographic with this template, and add it to your presentations. You can easily add your own content in PowerPoint, Keynote, or Google slides and turn it into a fun presentation in minutes.


6 slides
Constructive Review and Feedback Loop
Illustrate continuous improvement with the Constructive Review and Feedback Loop Presentation. This dynamic slide showcases a circular double-loop format, perfect for highlighting stages in review cycles, team input, and process refinement. Fully editable in PowerPoint, Keynote, and Google Slides for seamless integration into your workflow.


6 slides
Porter's Five Forces Management Infographic
Porter's Five Forces is a framework, that helps businesses understand the attractiveness and profitability of an industry by examining five key forces that shape its competitive landscape. These infographic templates provide a visually appealing and concise overview of Porter's Five Forces framework. They are designed to help businesses and professionals analyze the competitive dynamics of an industry and make informed strategic decisions. By using this to help your audience understand the forces that shape industry competitiveness, they can identify potential threats and opportunities to make informed decisions, and gain a competitive edge.


6 slides
Internal and External Communication Plan
Visualize your communication strategy with this dual-channel megaphone infographic, perfect for showcasing internal and external messaging flows. Ideal for corporate updates, PR plans, or stakeholder communications. Fully editable in PowerPoint, Keynote, and Google Slides.


21 slides
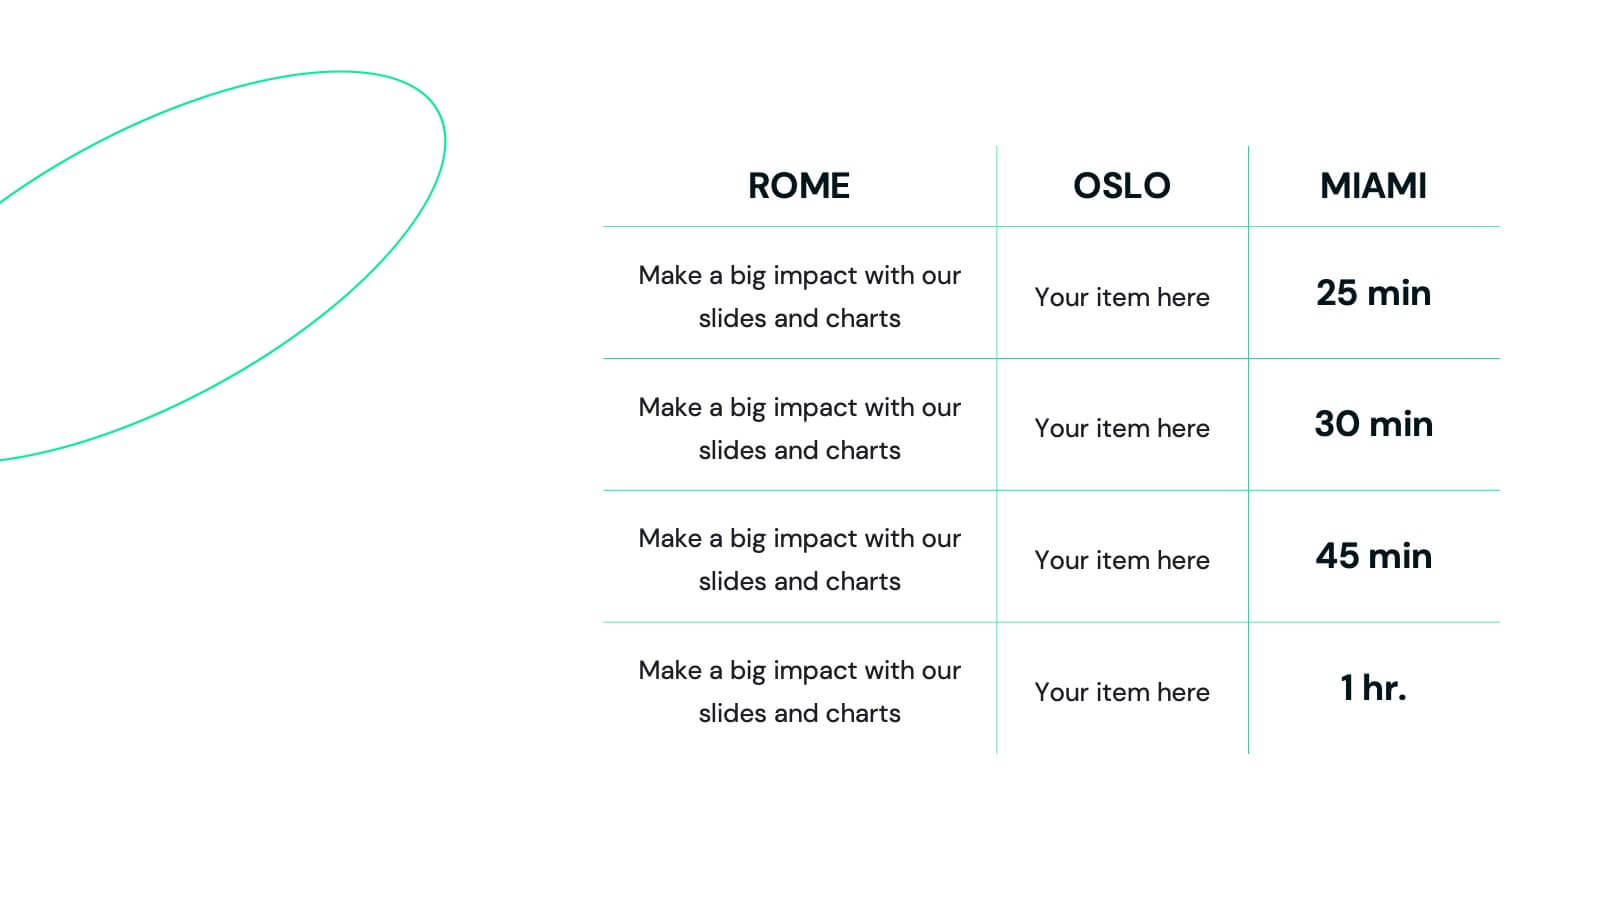
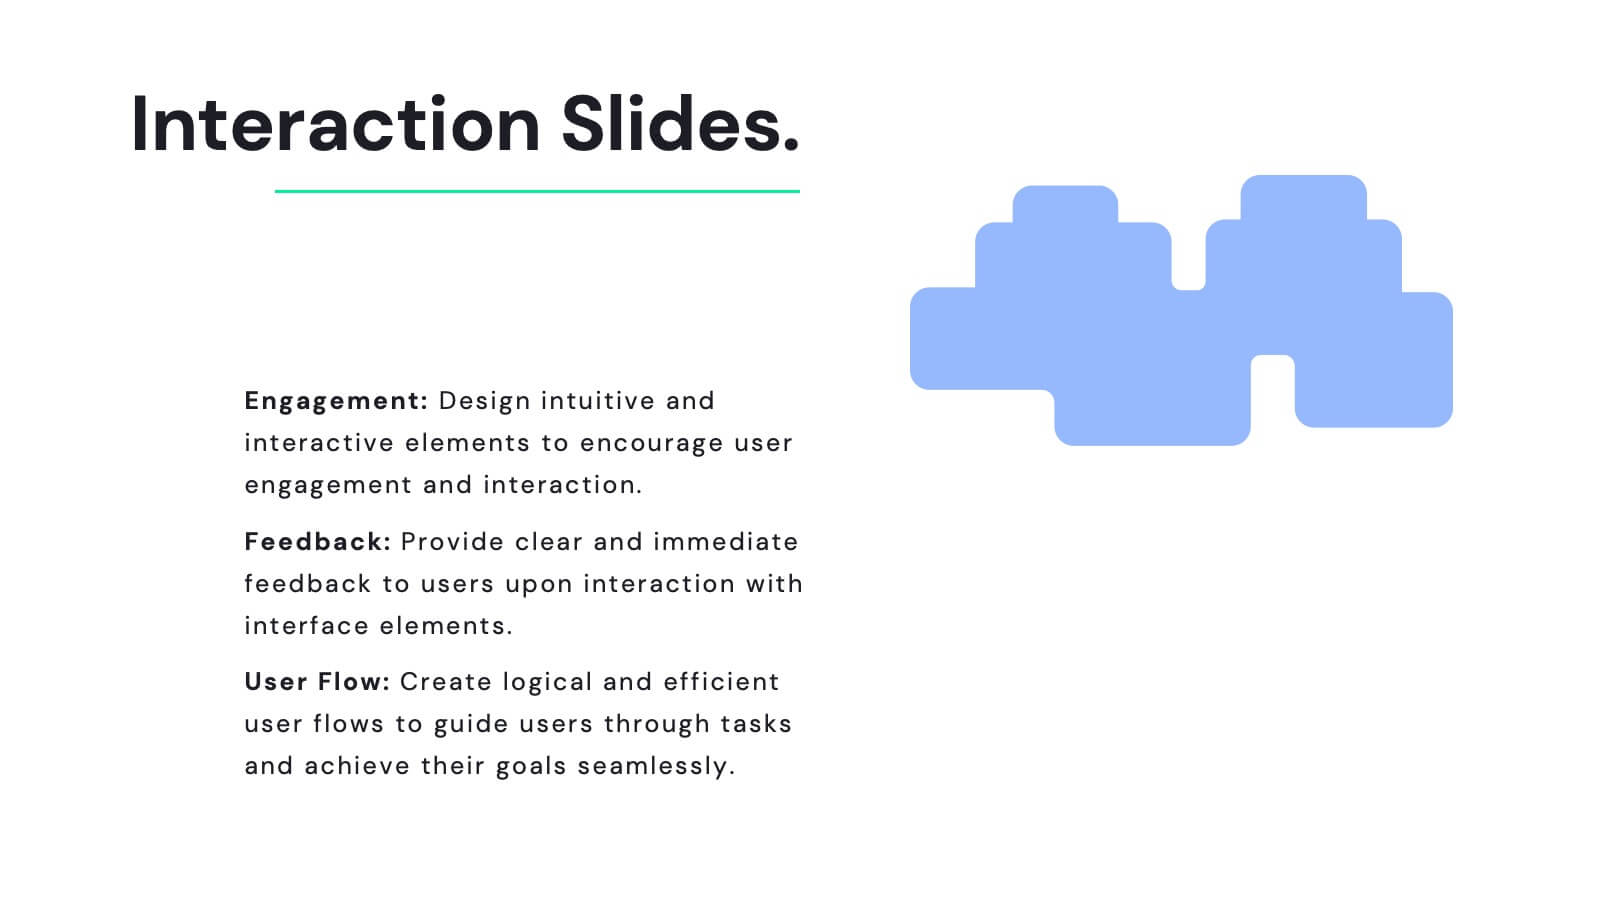
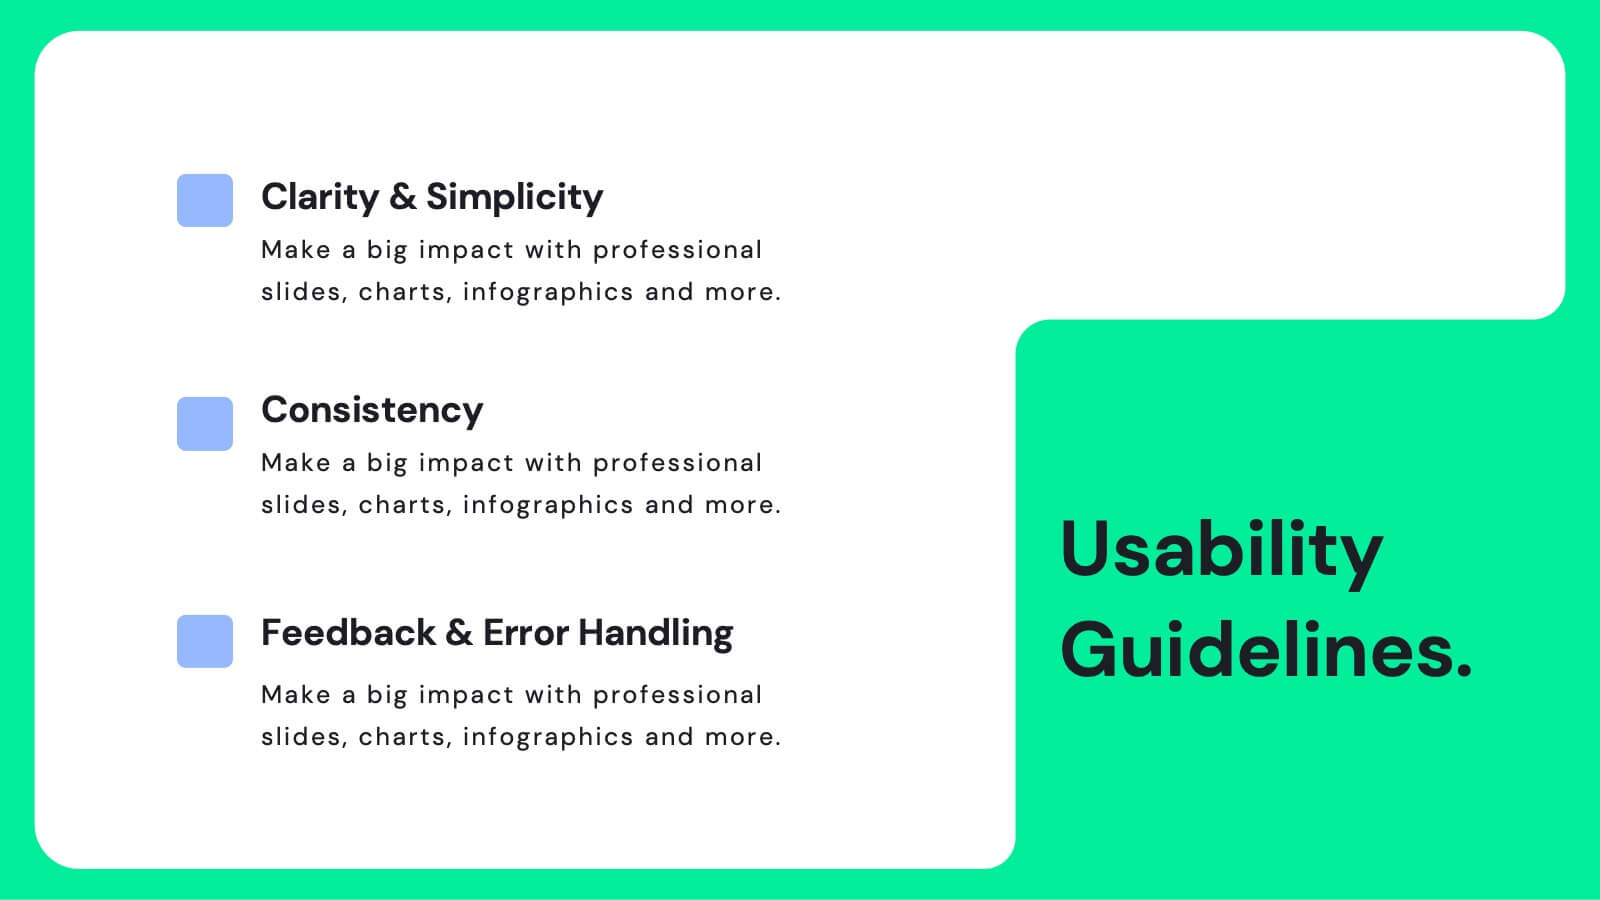
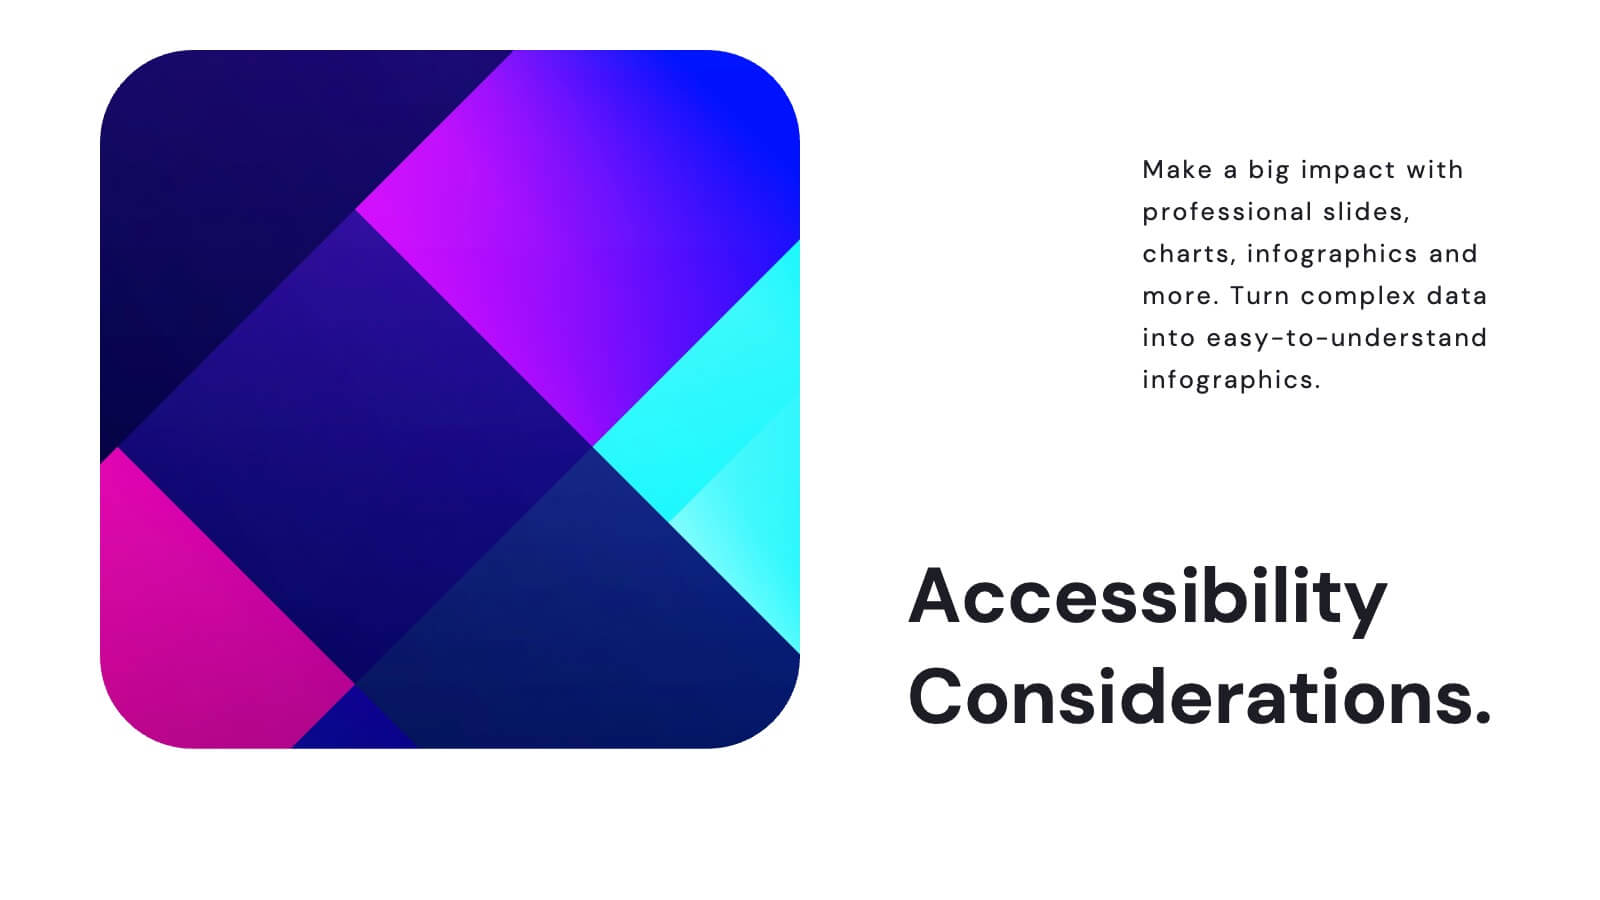
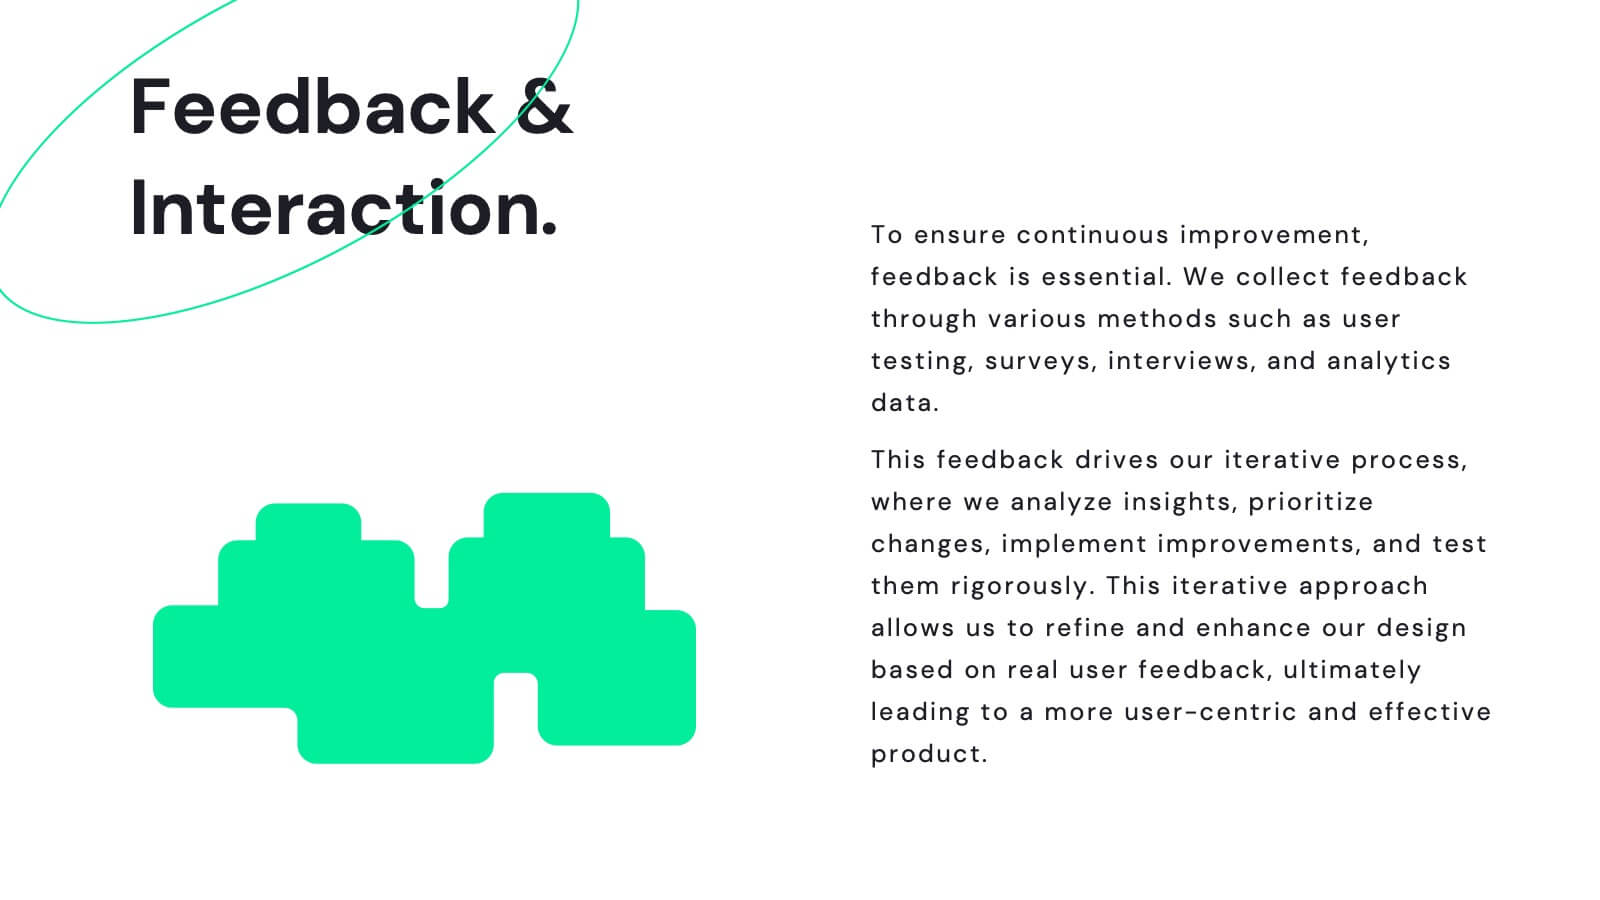
Juno UX Case Study Presentation
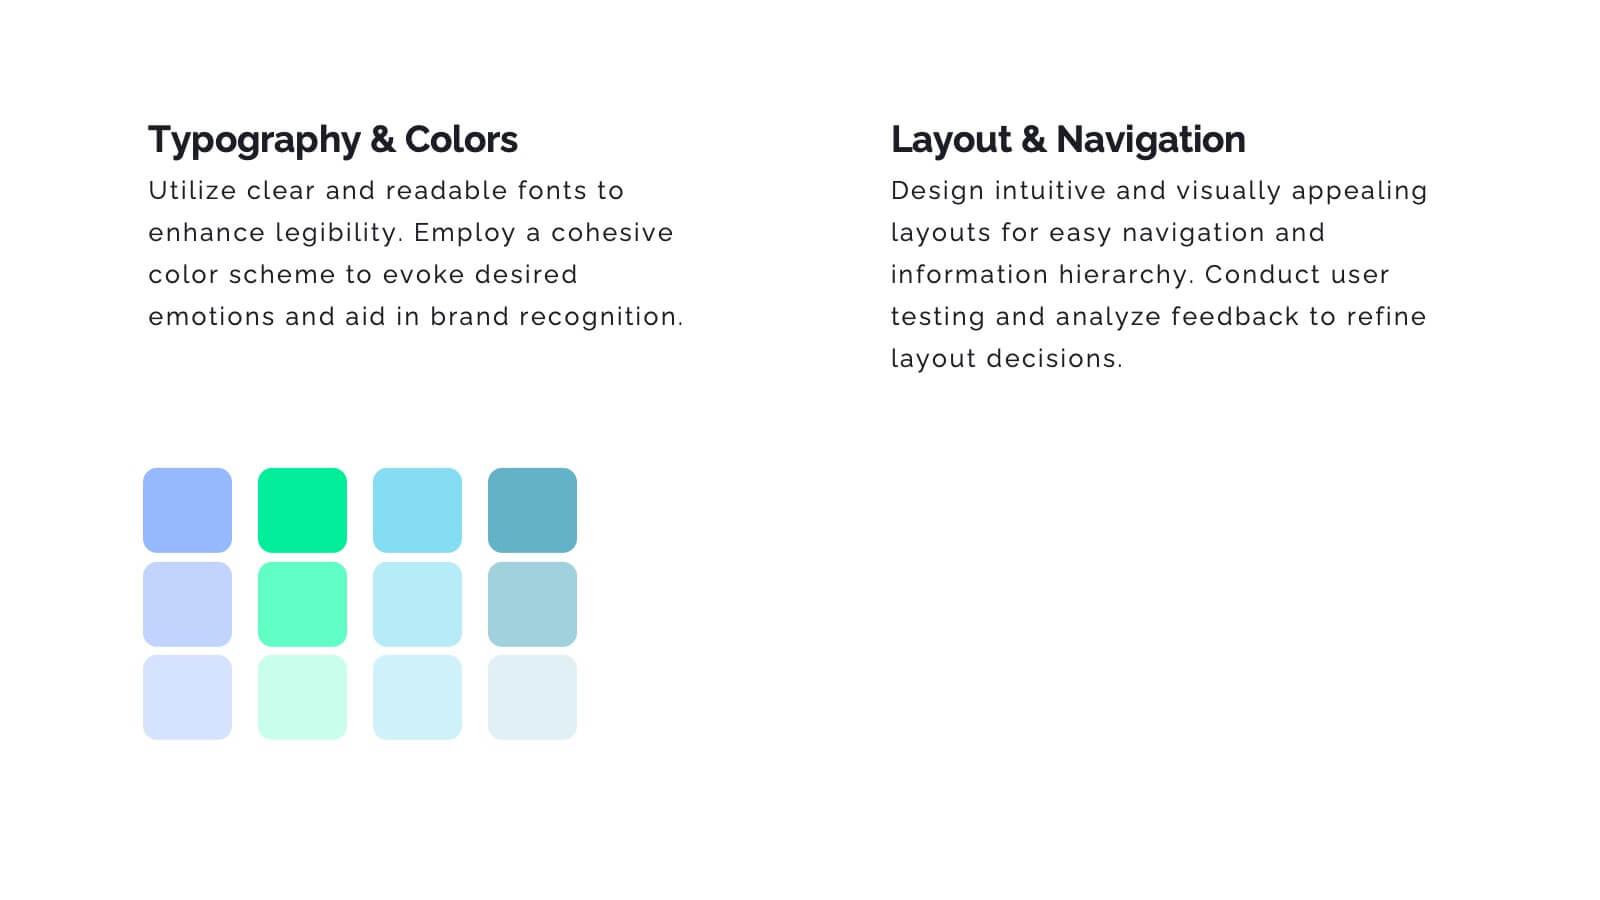
Enhance your UX presentations with this sleek, user-friendly template designed for showcasing detailed case studies and user research. With a modern layout and clear sections for user journey mapping, prototyping, and usability guidelines, this template ensures a professional and engaging presentation. Compatible with PowerPoint, Keynote, and Google Slides, it's perfect for any platform.


10 slides
Business Growth and Market Statistics Presentation
Showcase key business growth trends and market insights with the "Business Growth and Market Statistics" presentation templates. These visuals are crafted to enhance clarity in communicating growth drivers, market dynamics, and performance metrics effectively. Ideal for corporate presentations, they're compatible with PowerPoint, Keynote, and Google Slides, ensuring a professional look across all platforms.


21 slides
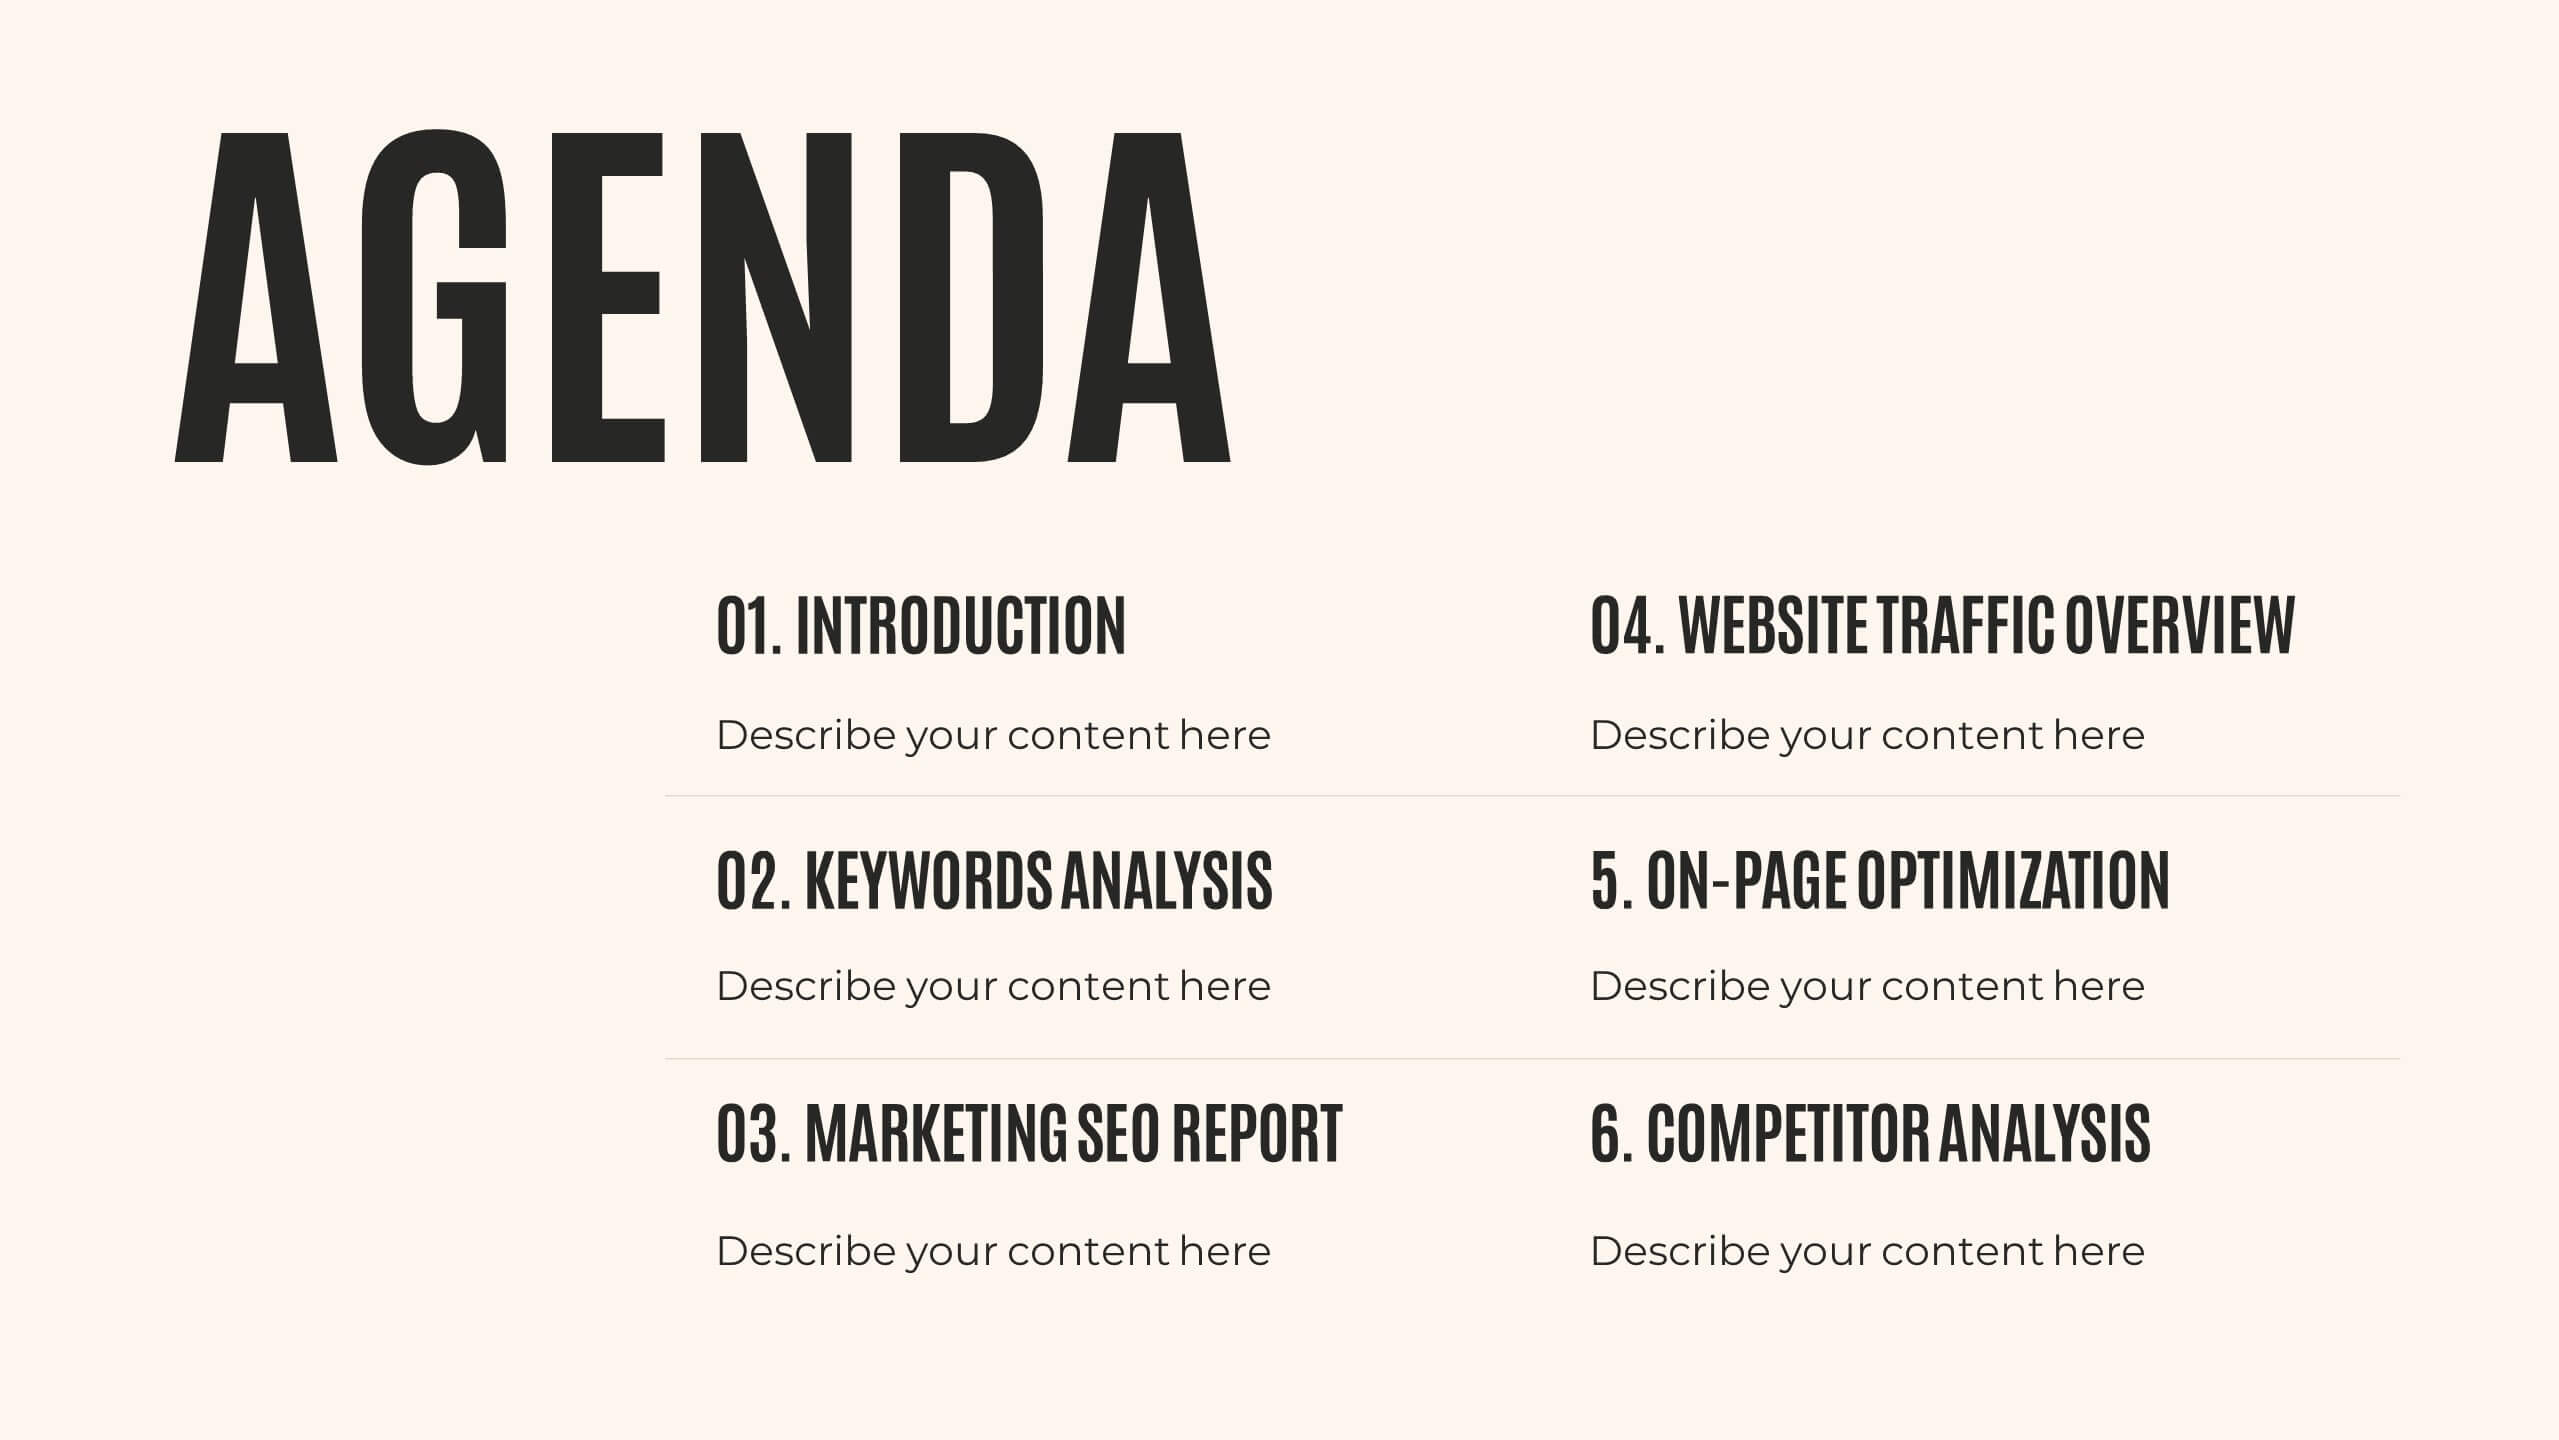
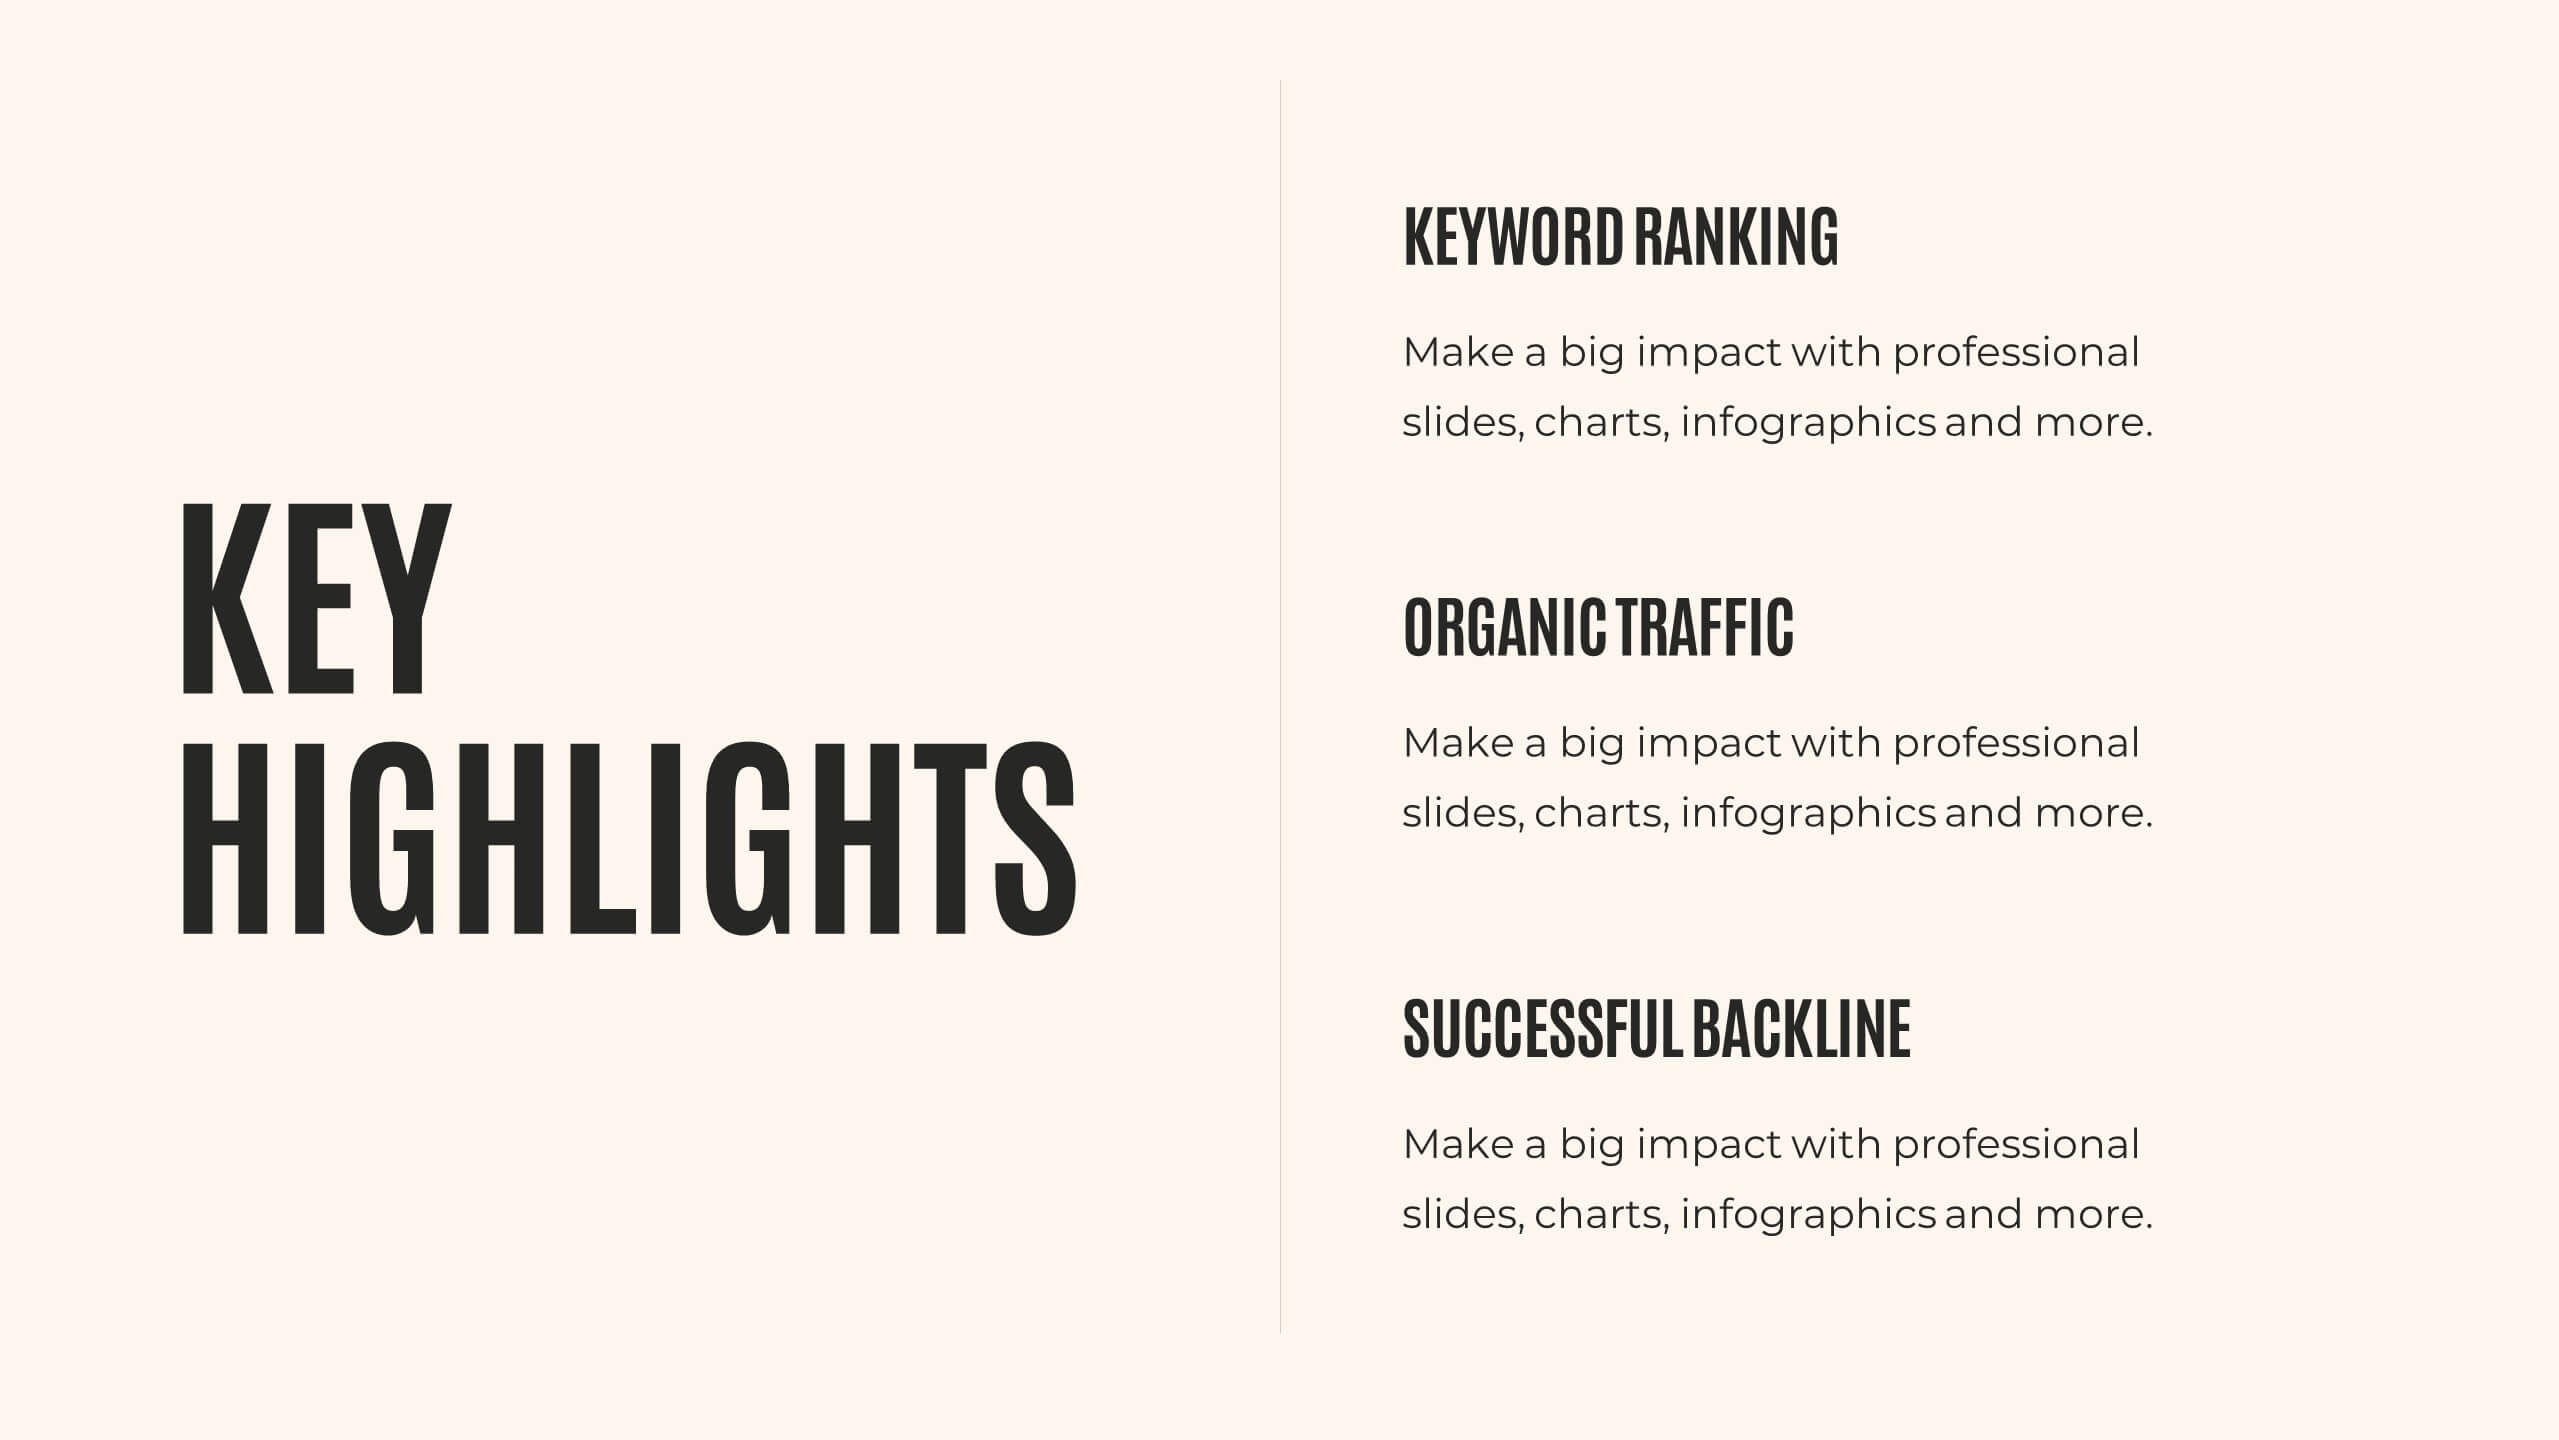
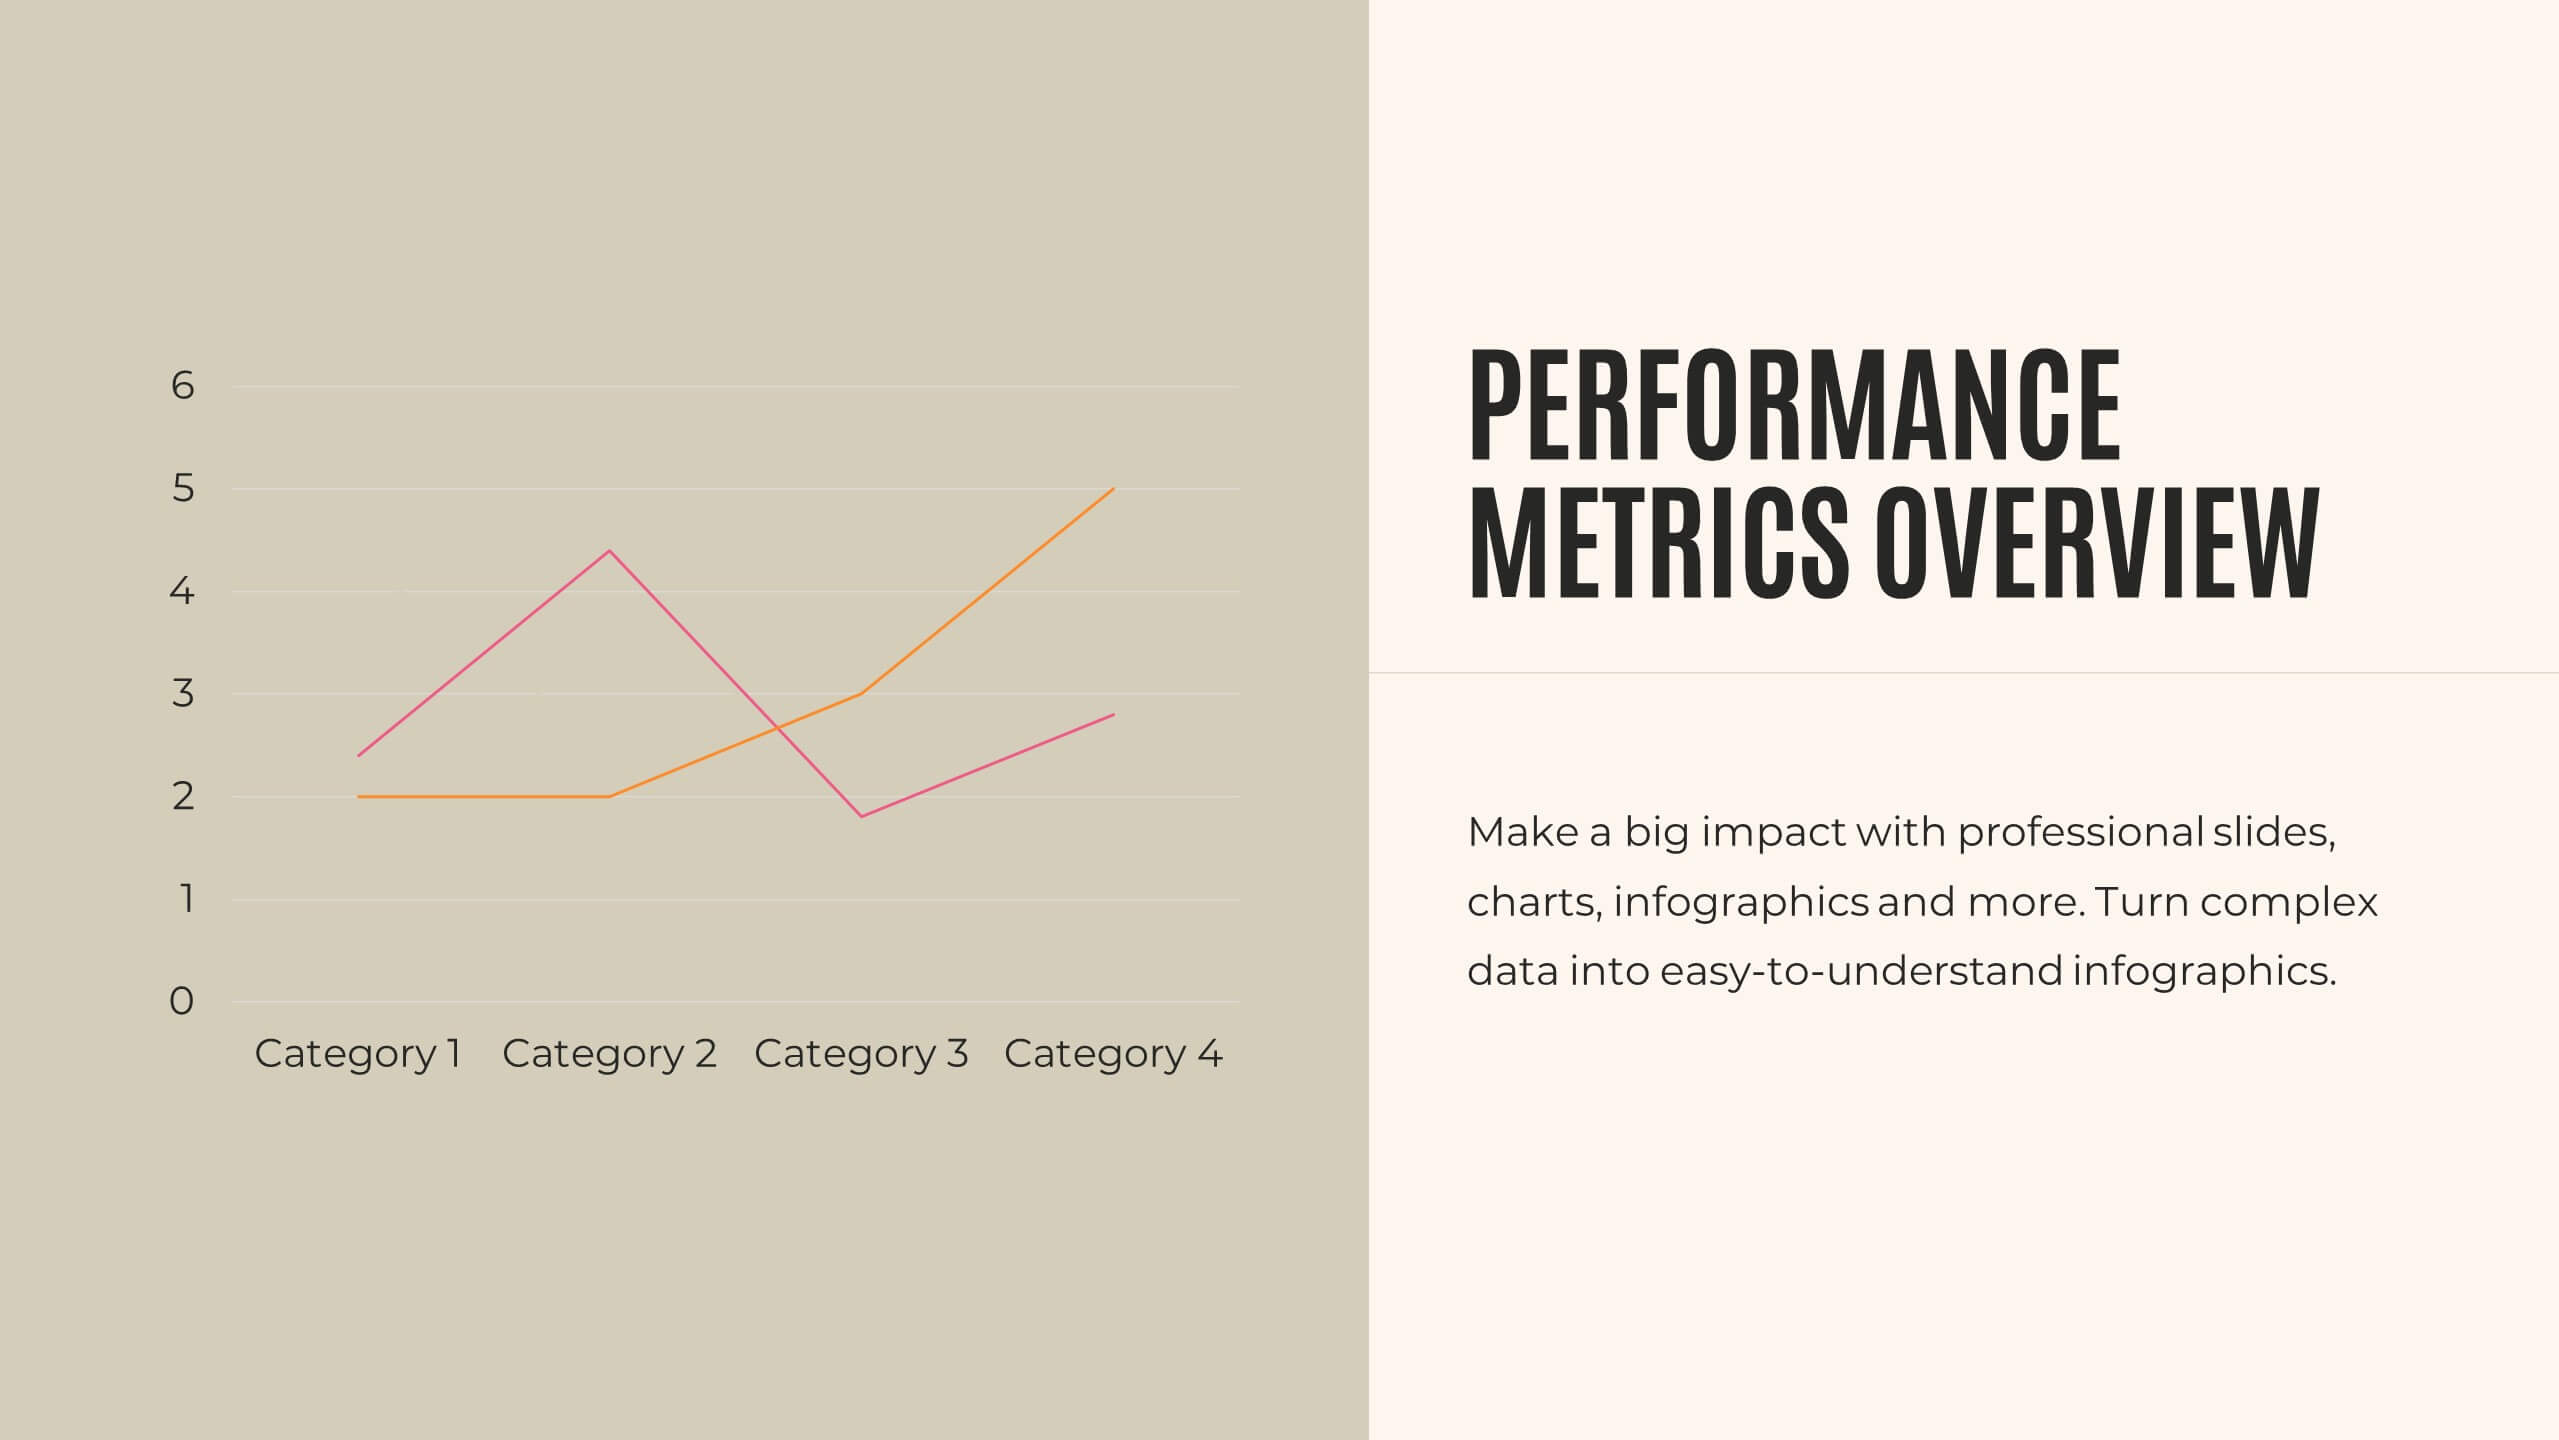
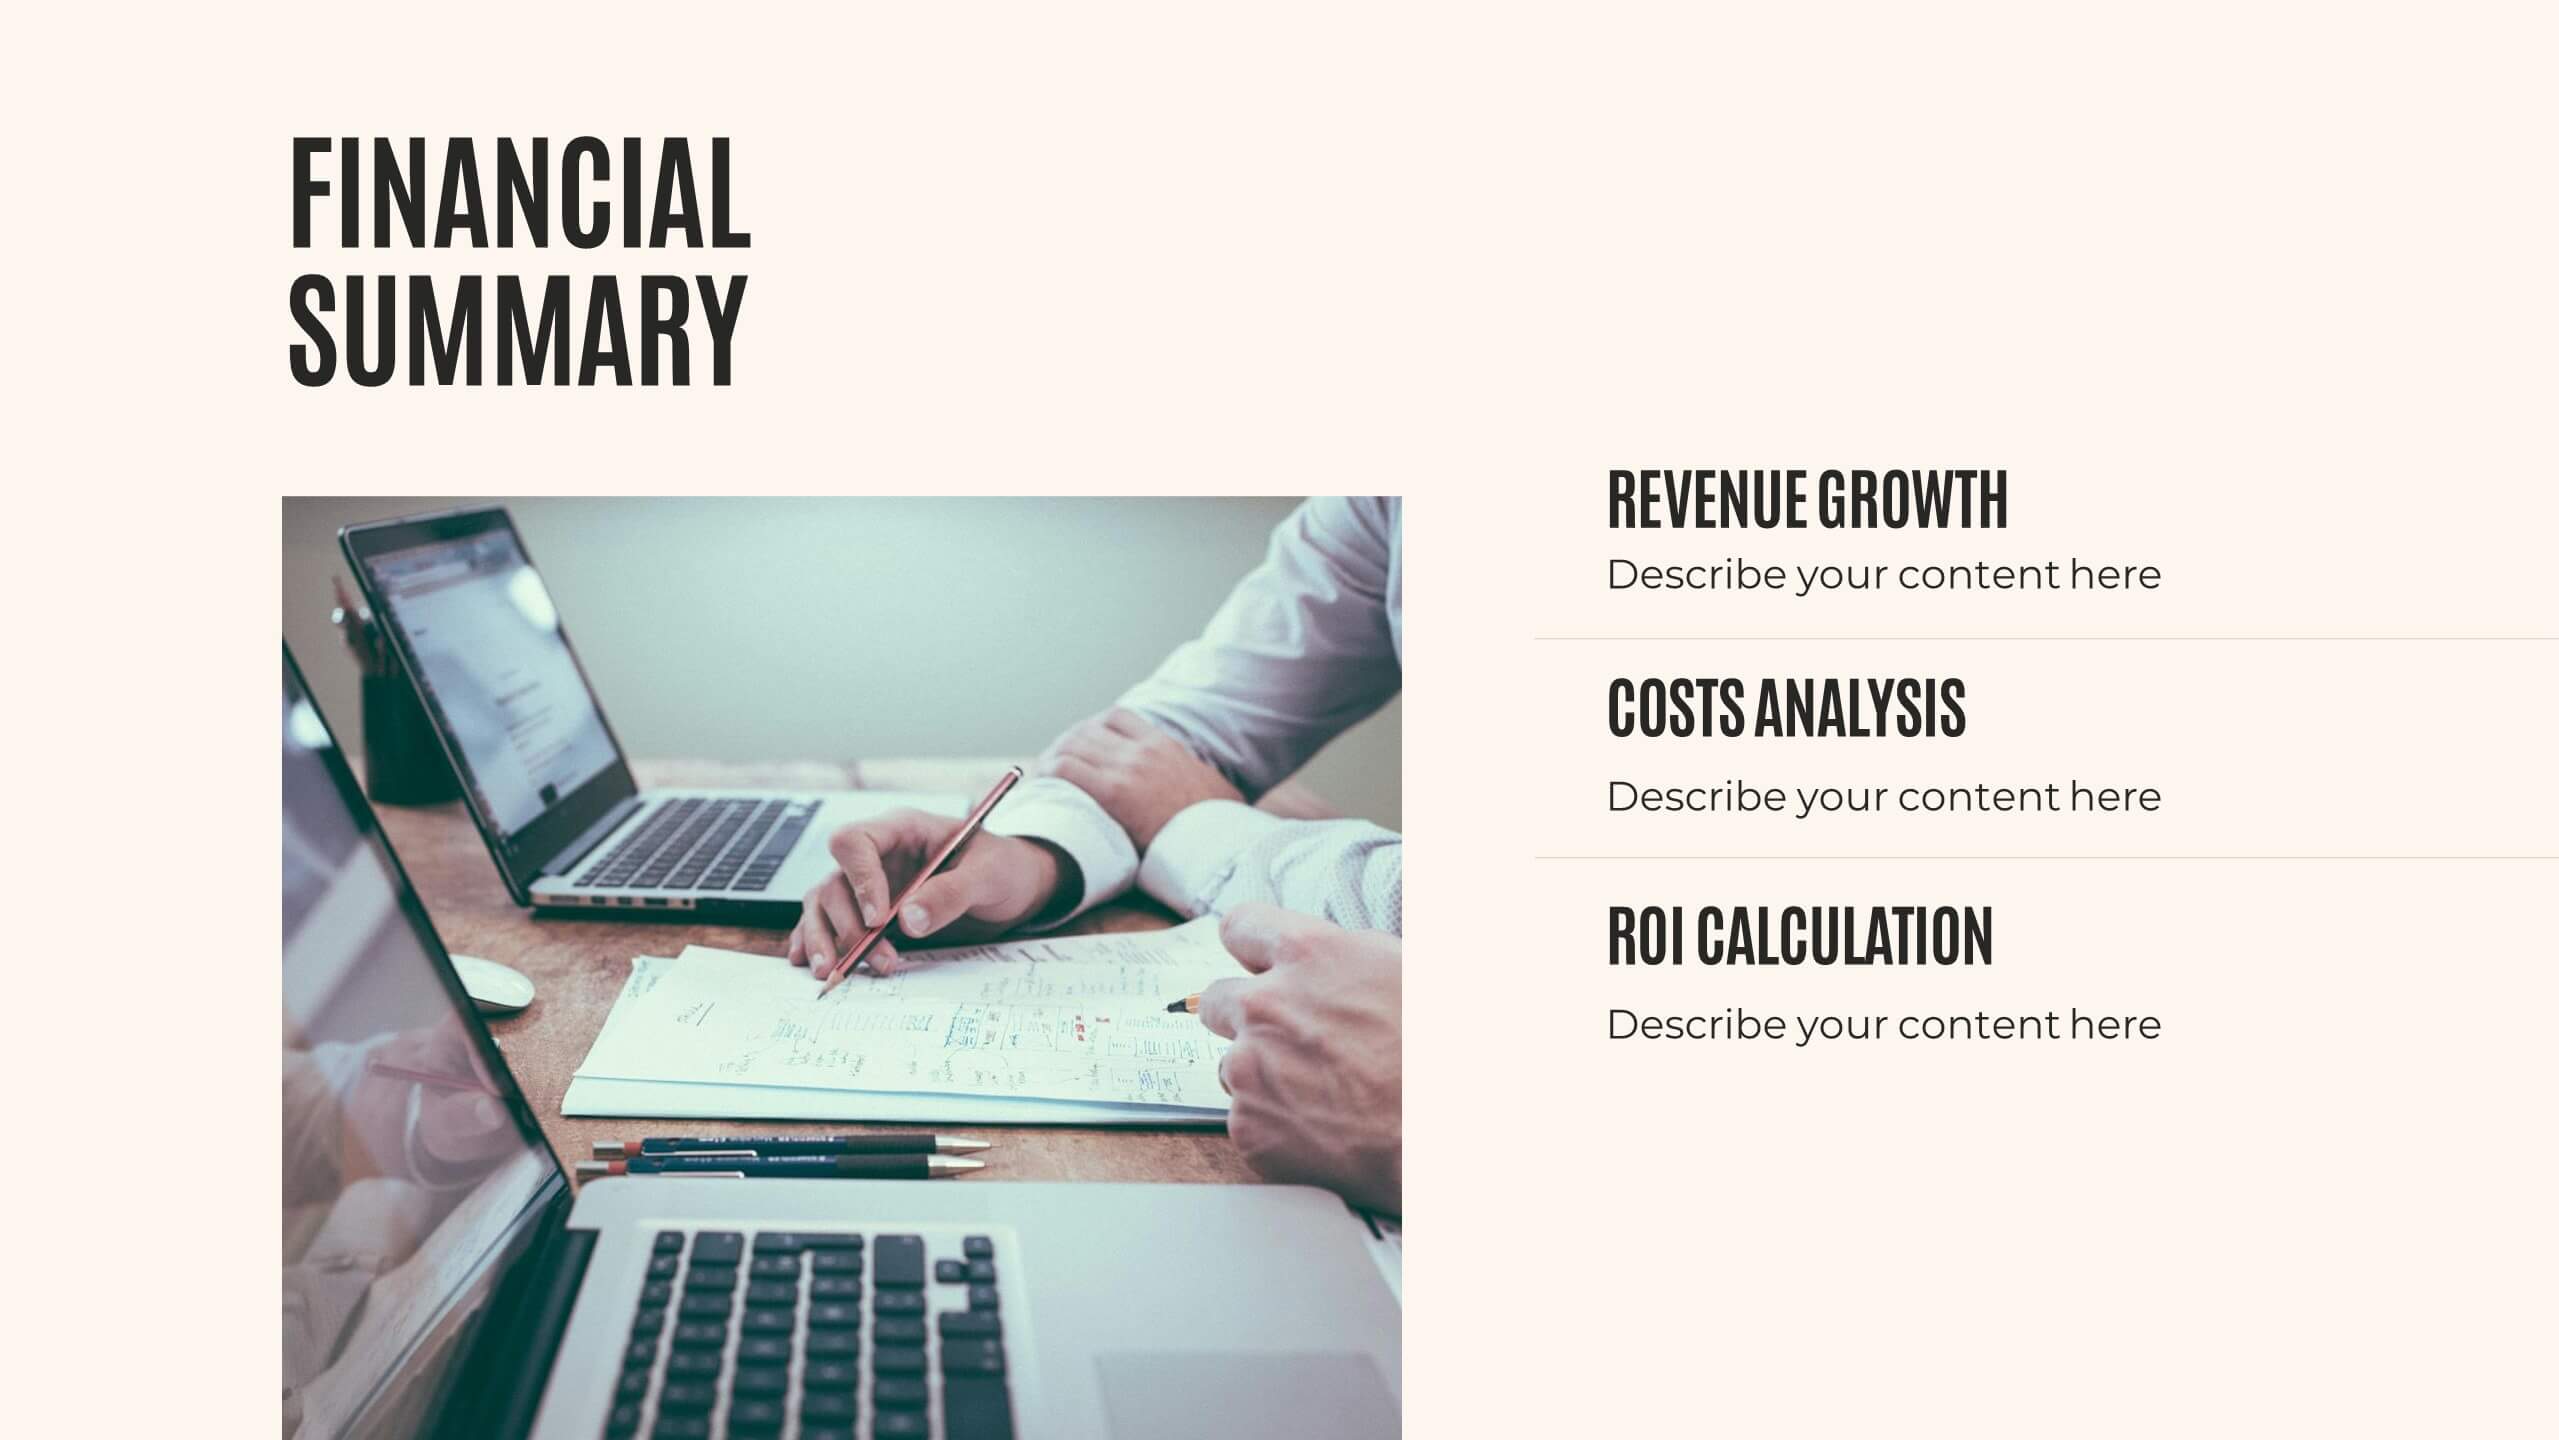
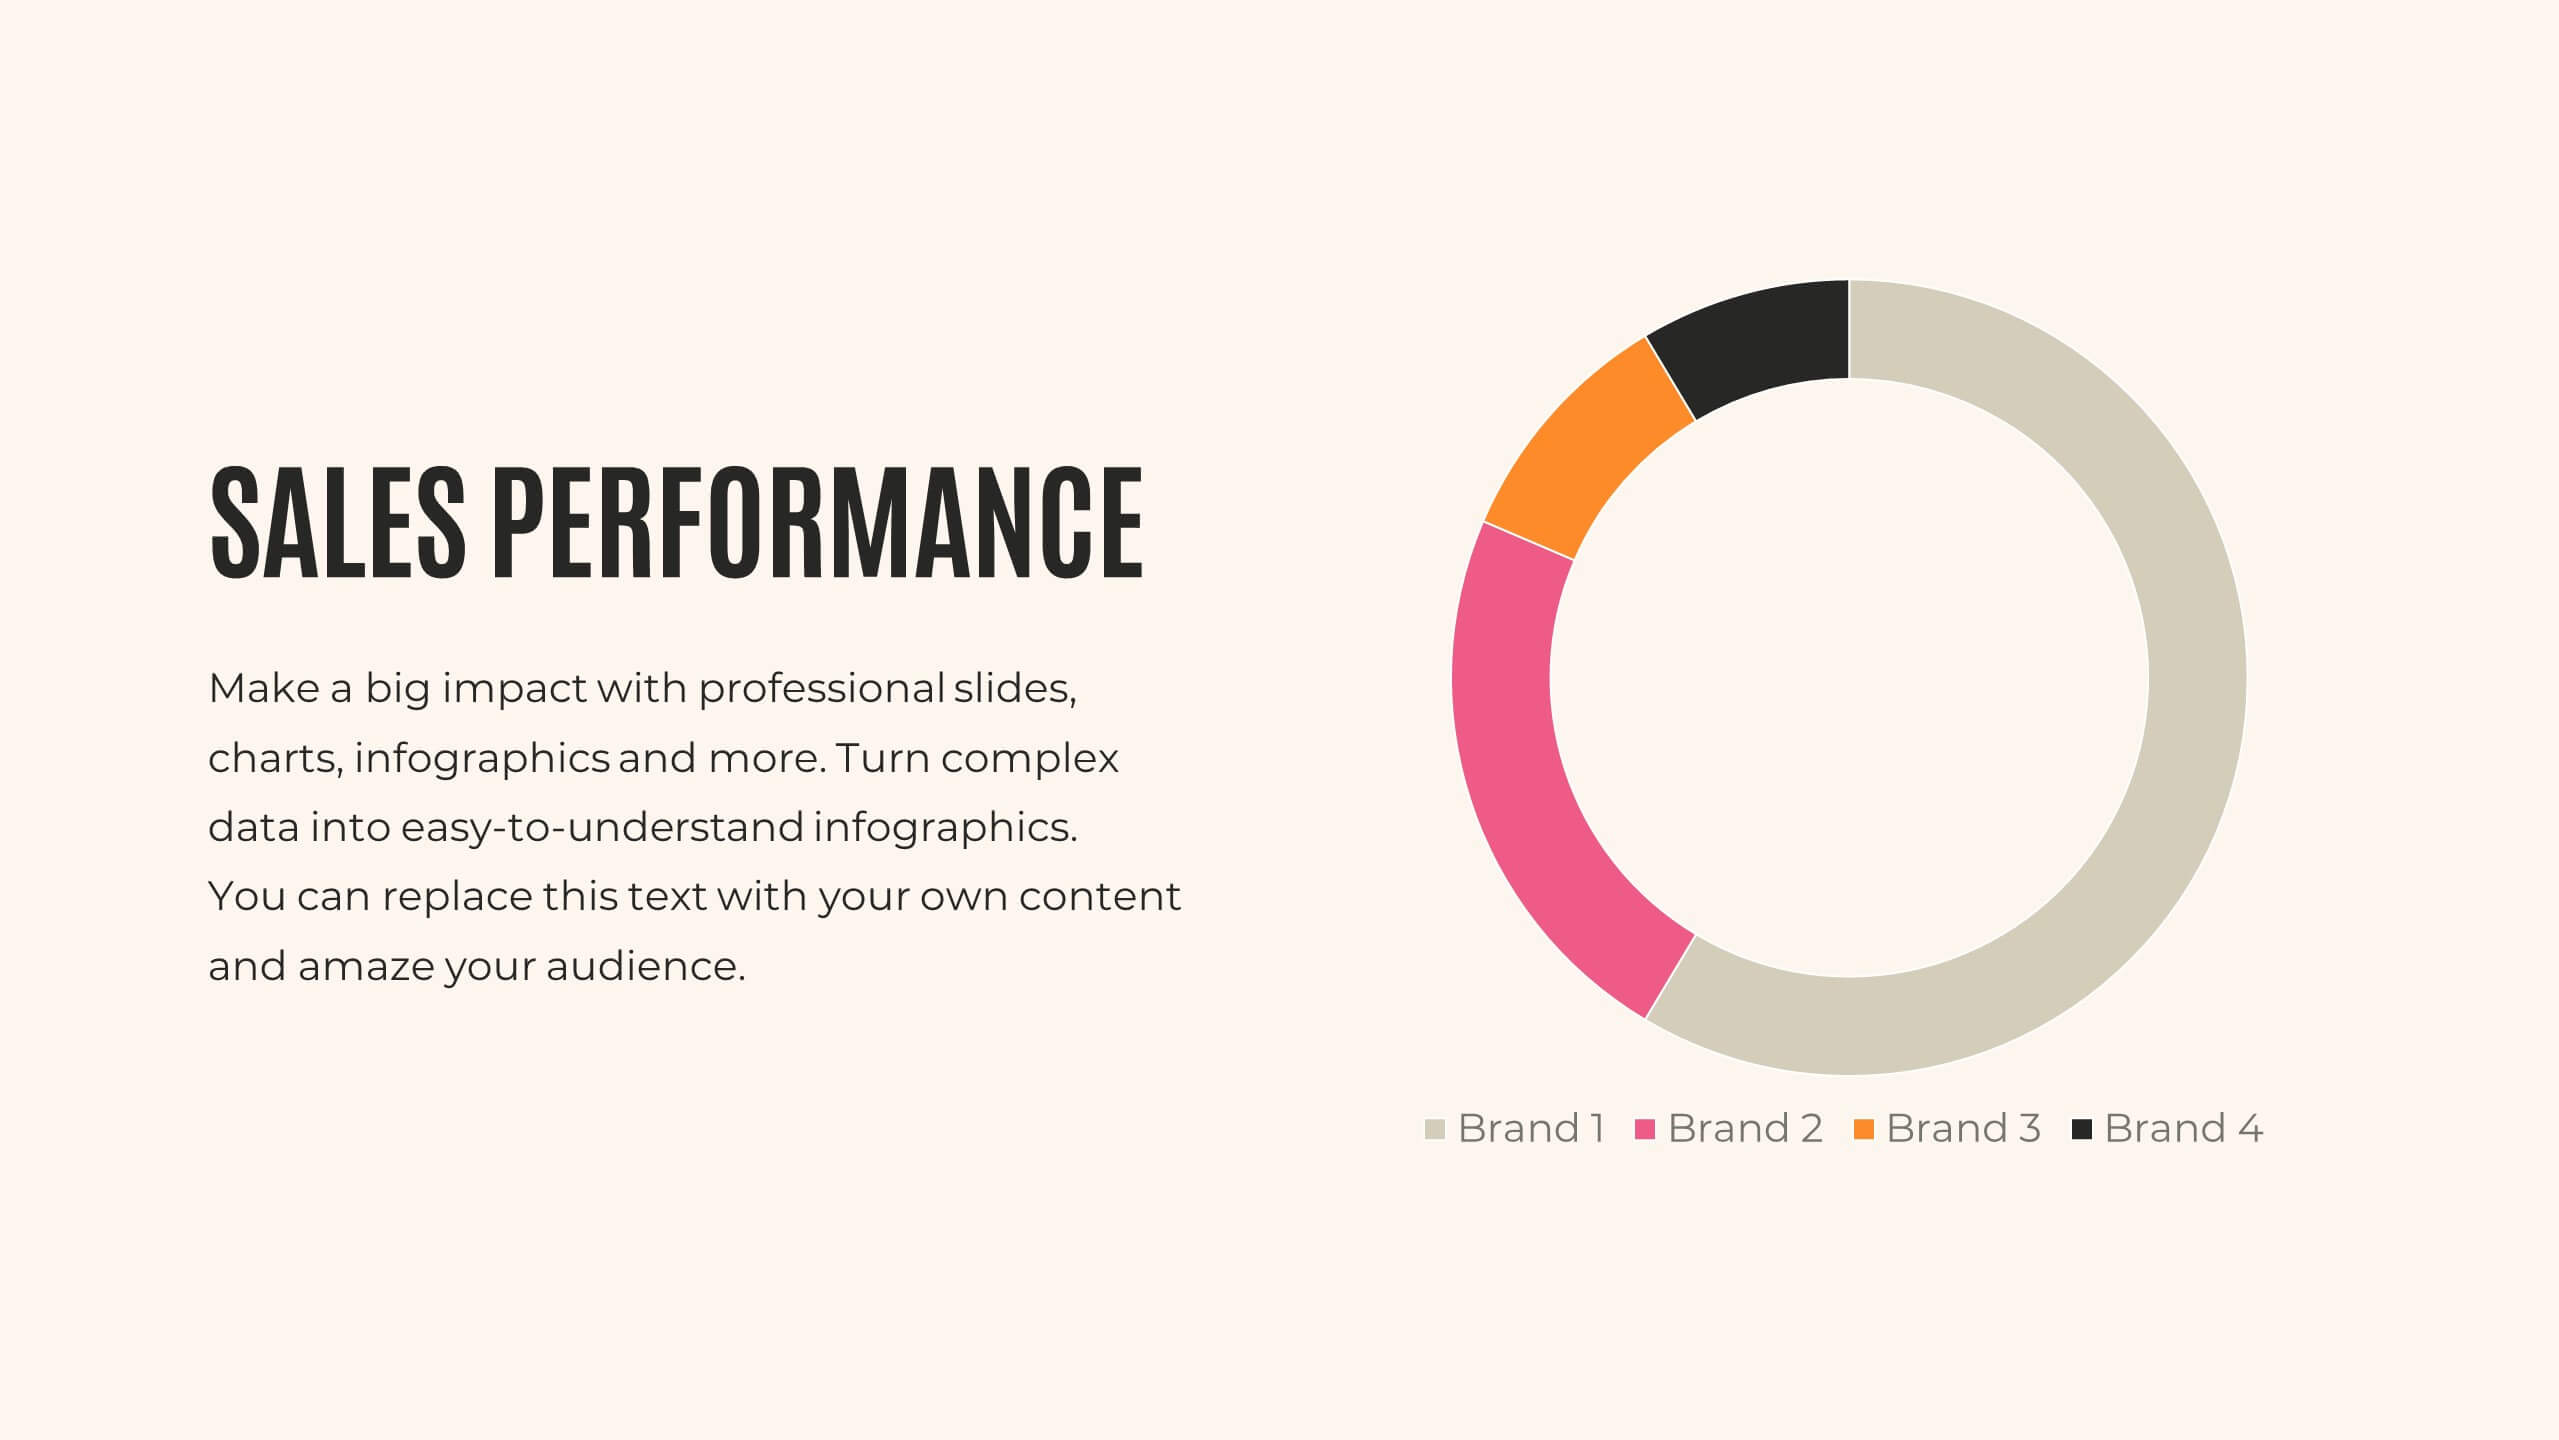
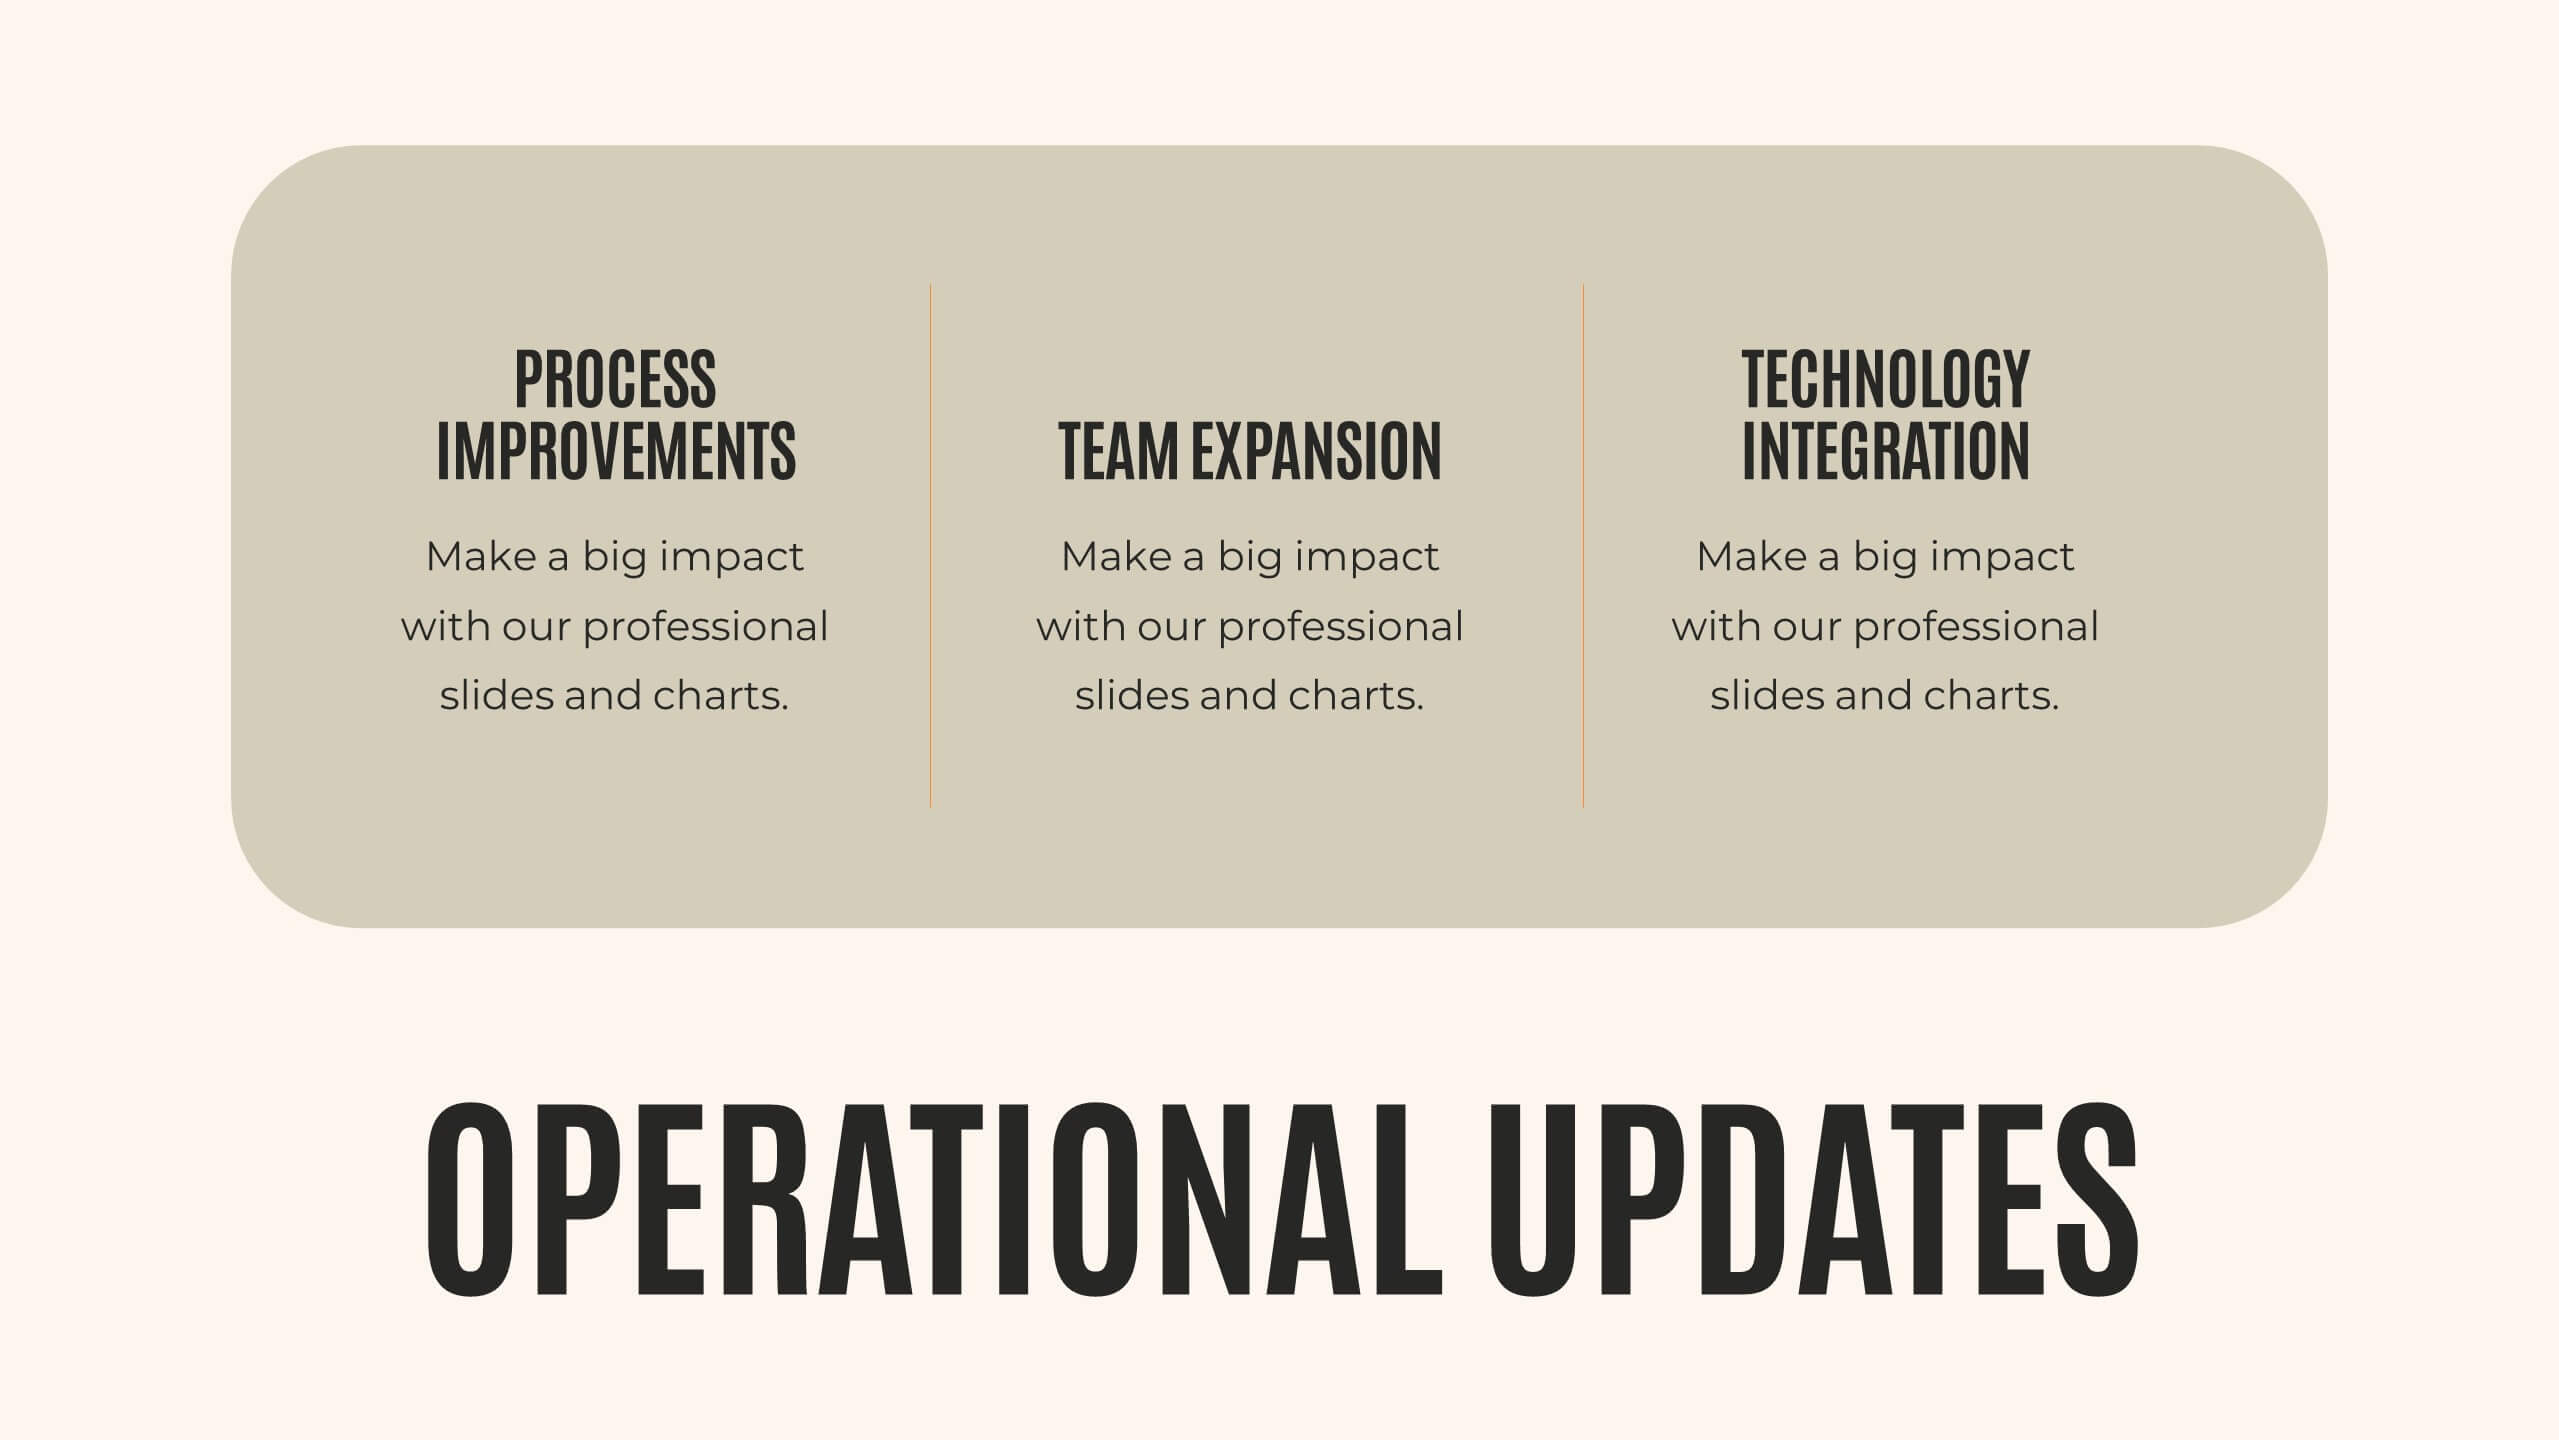
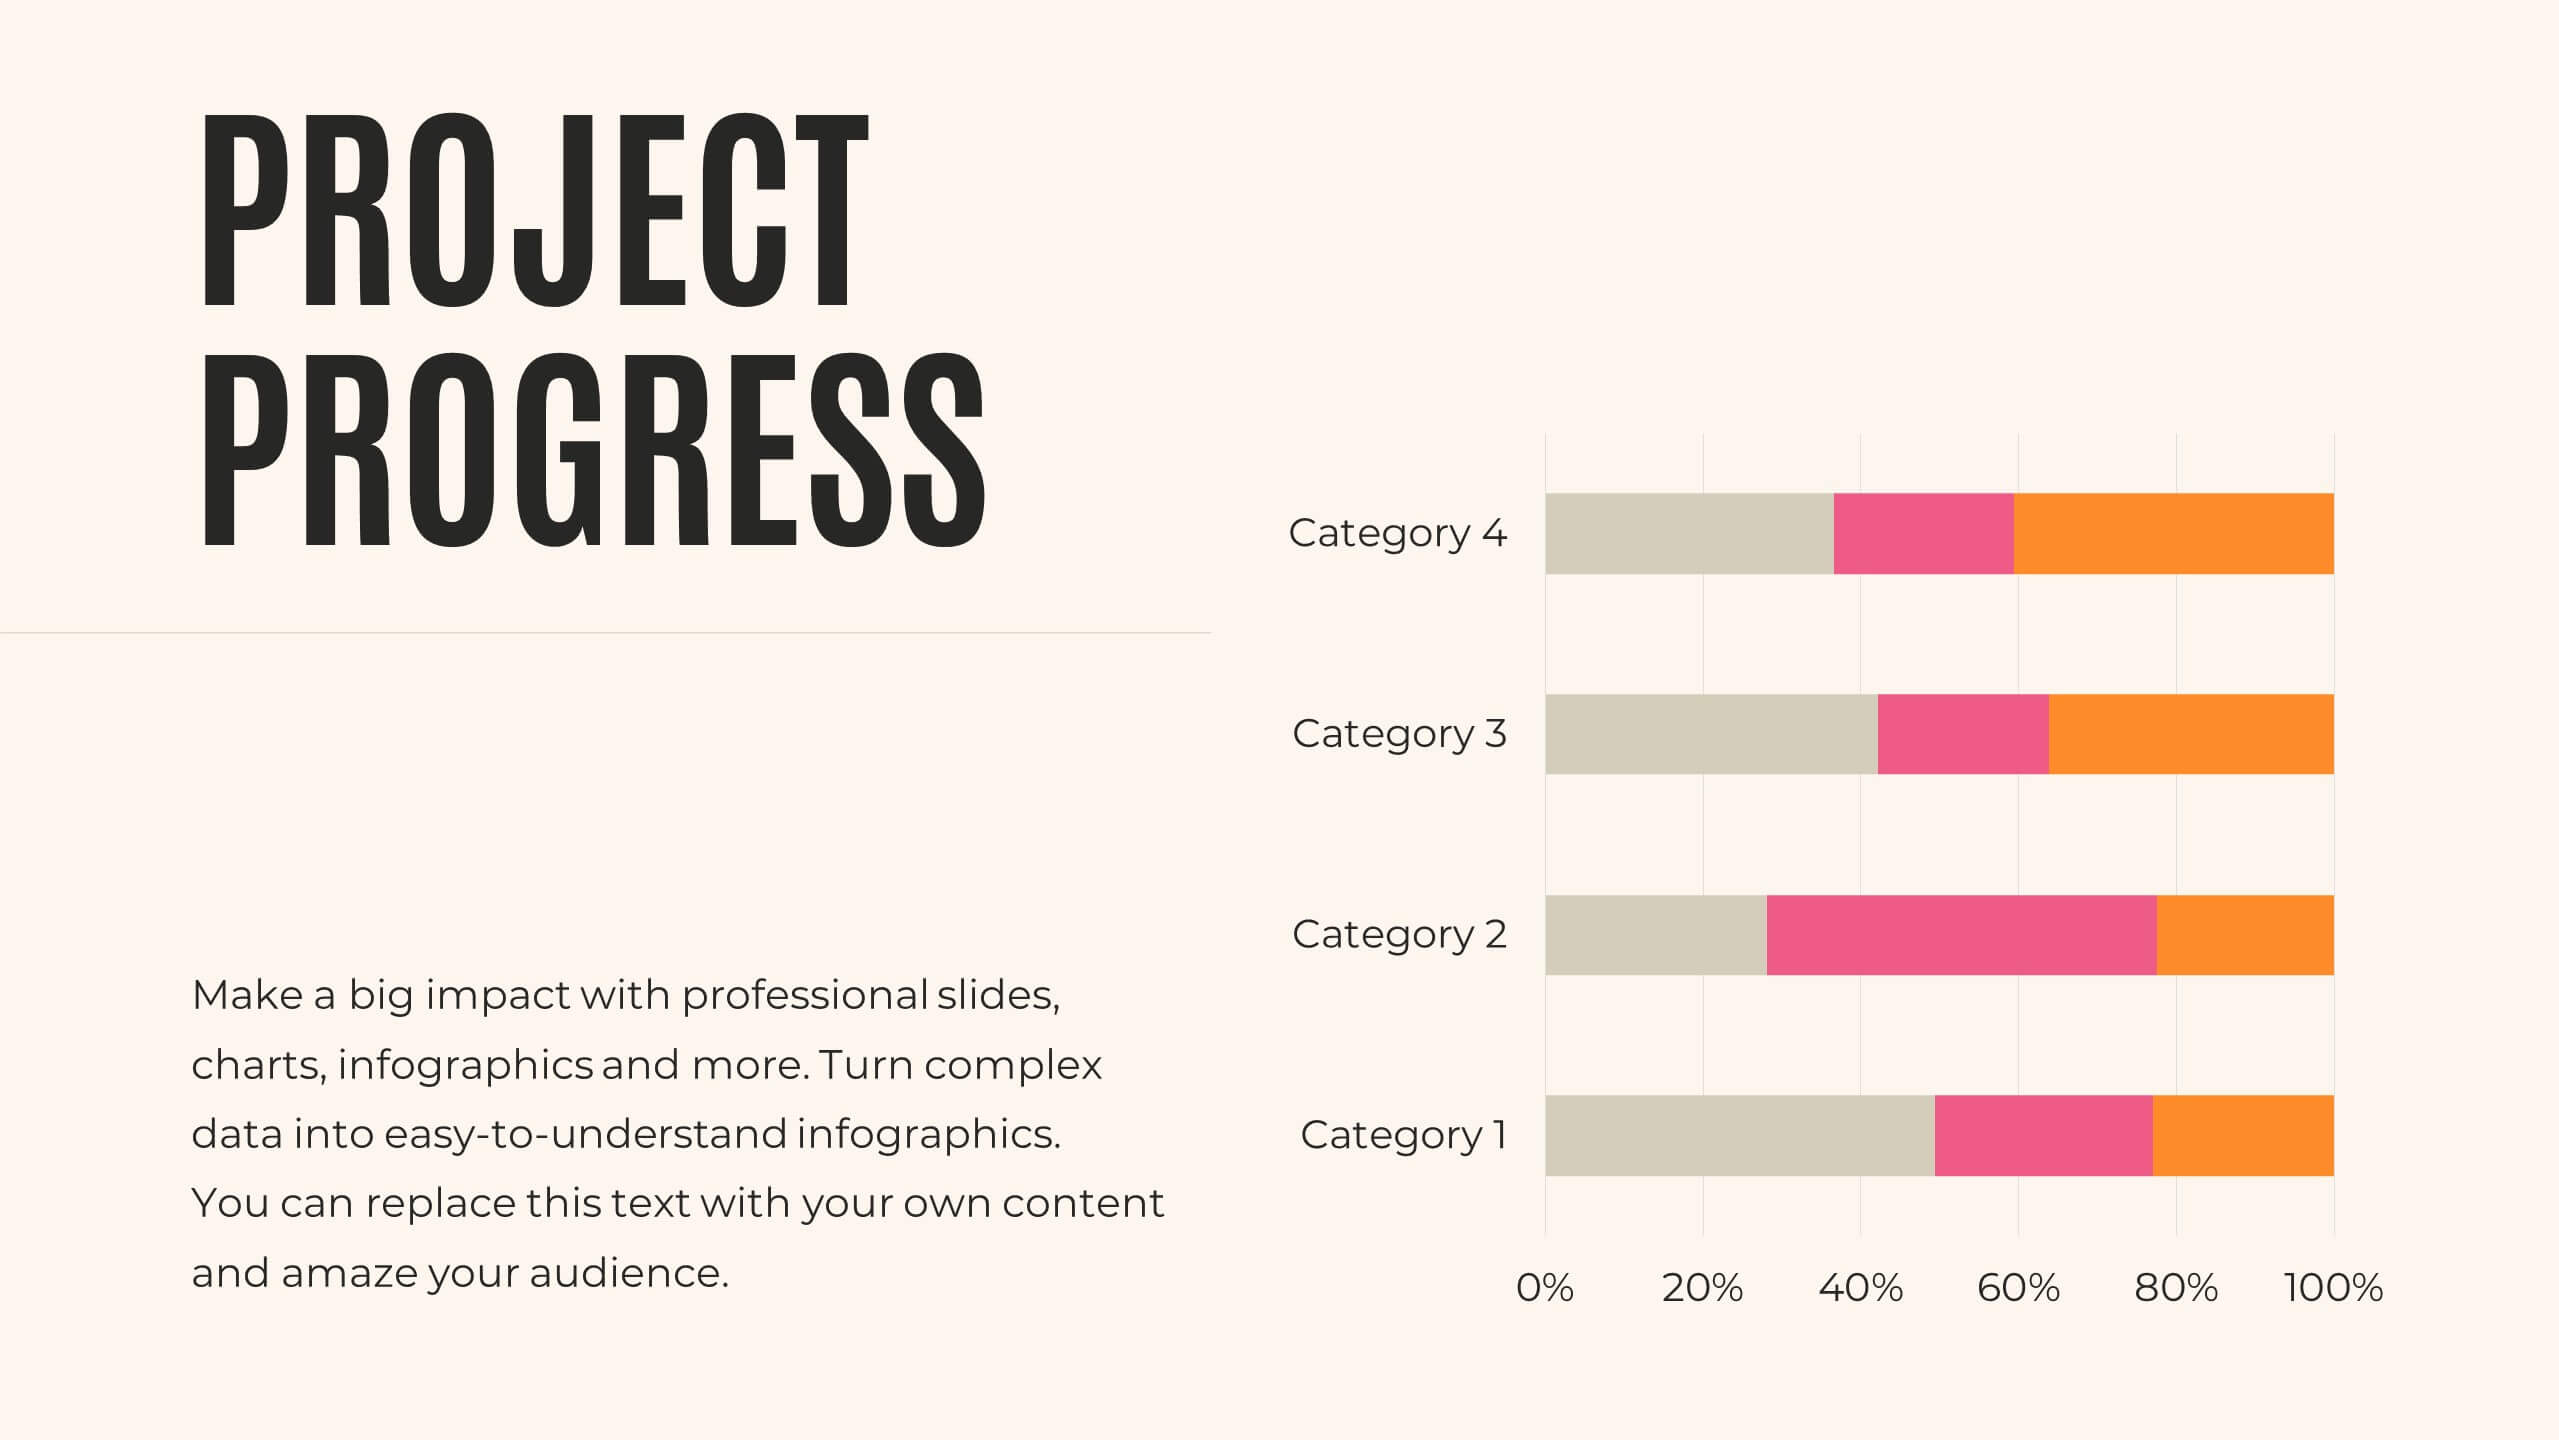
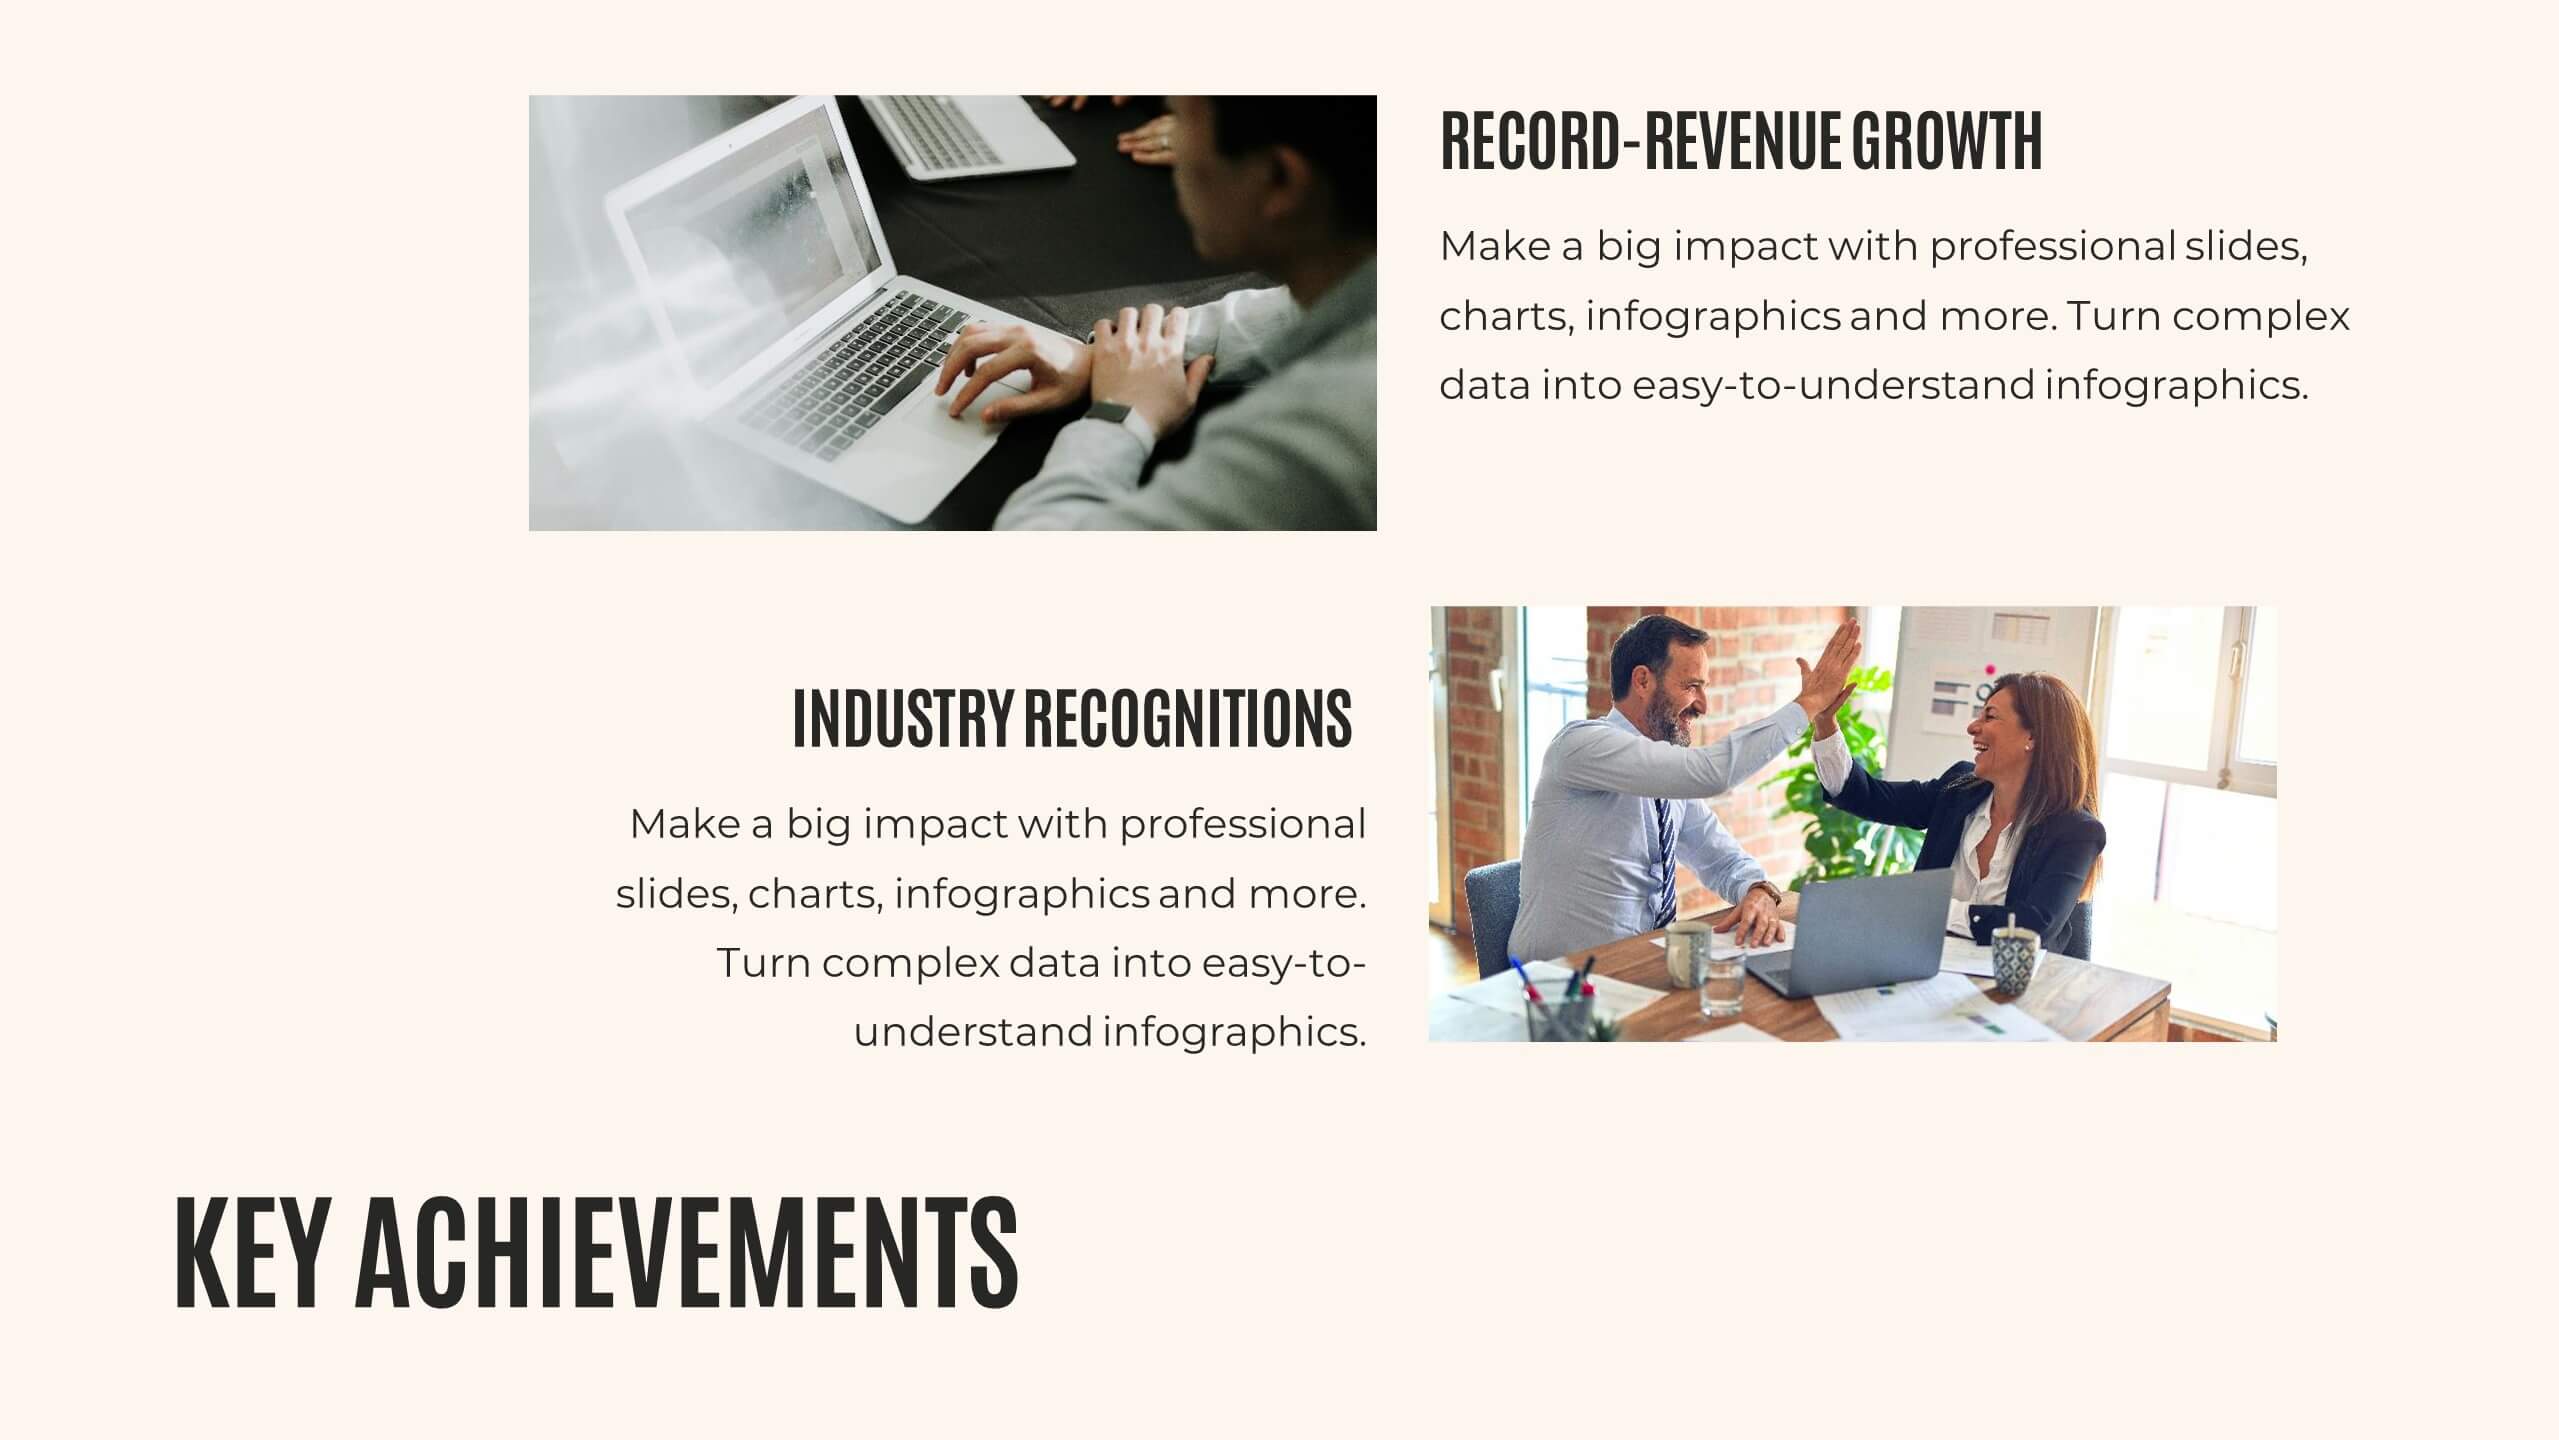
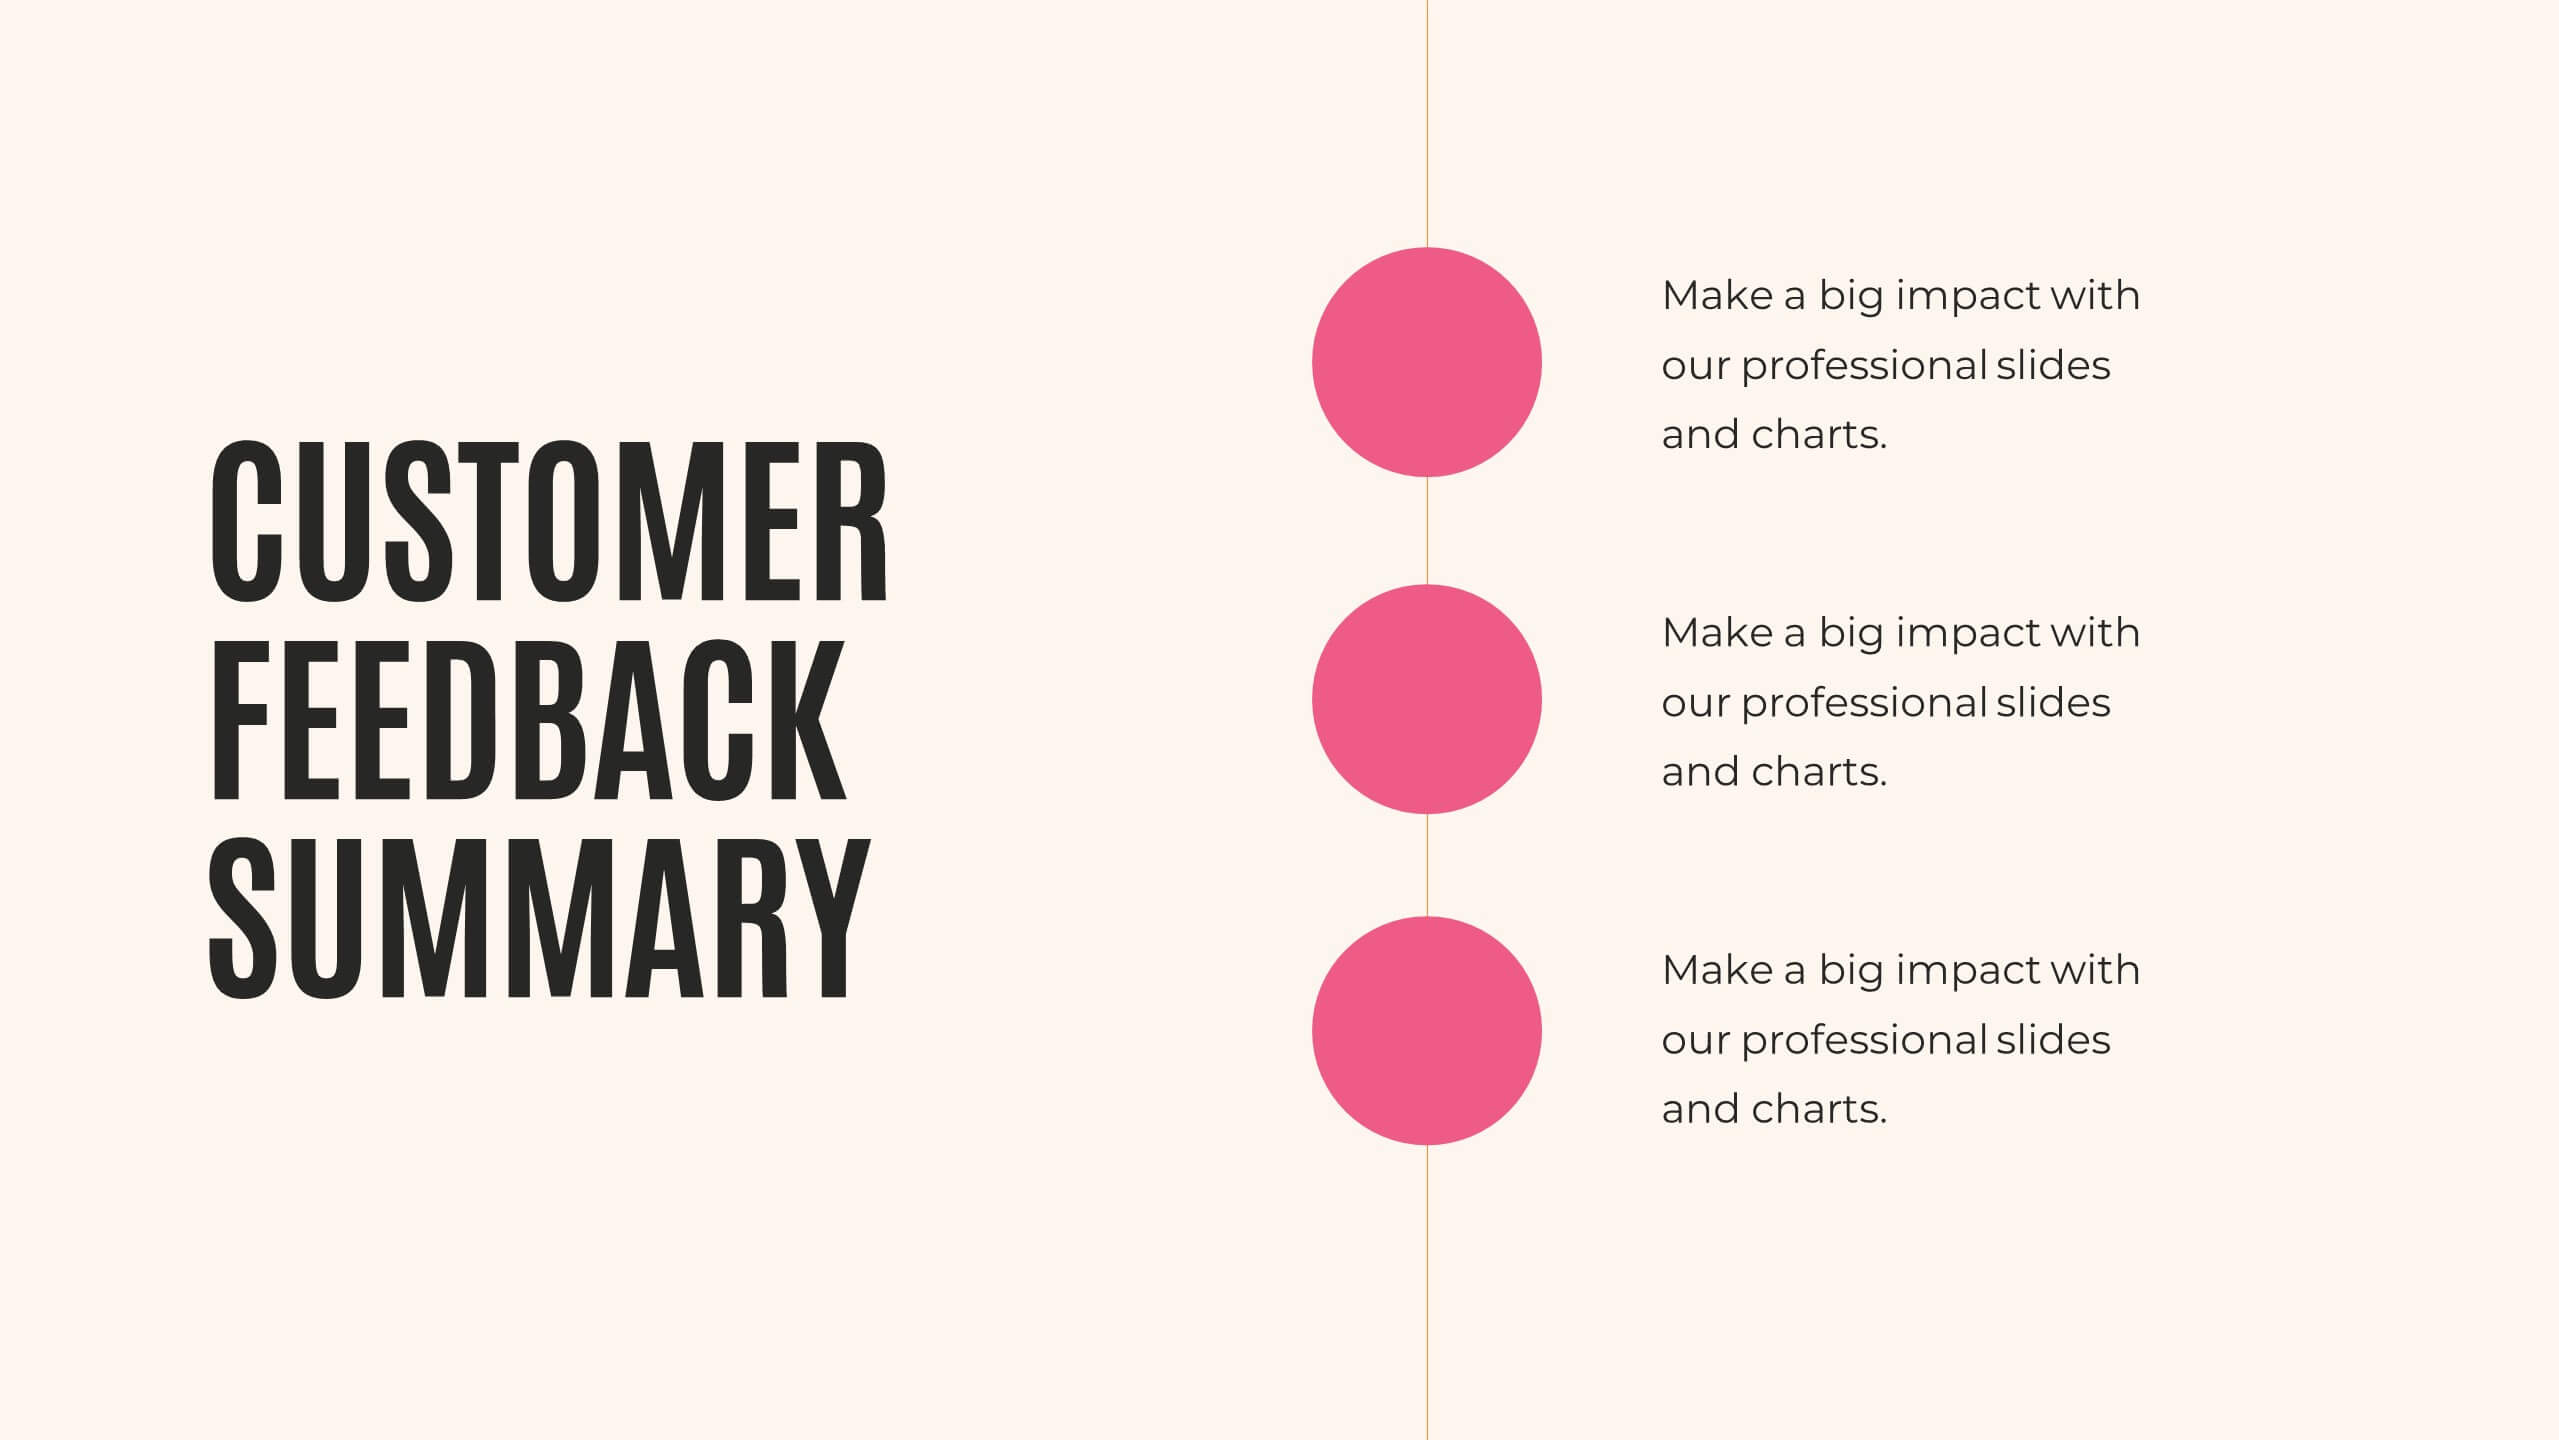
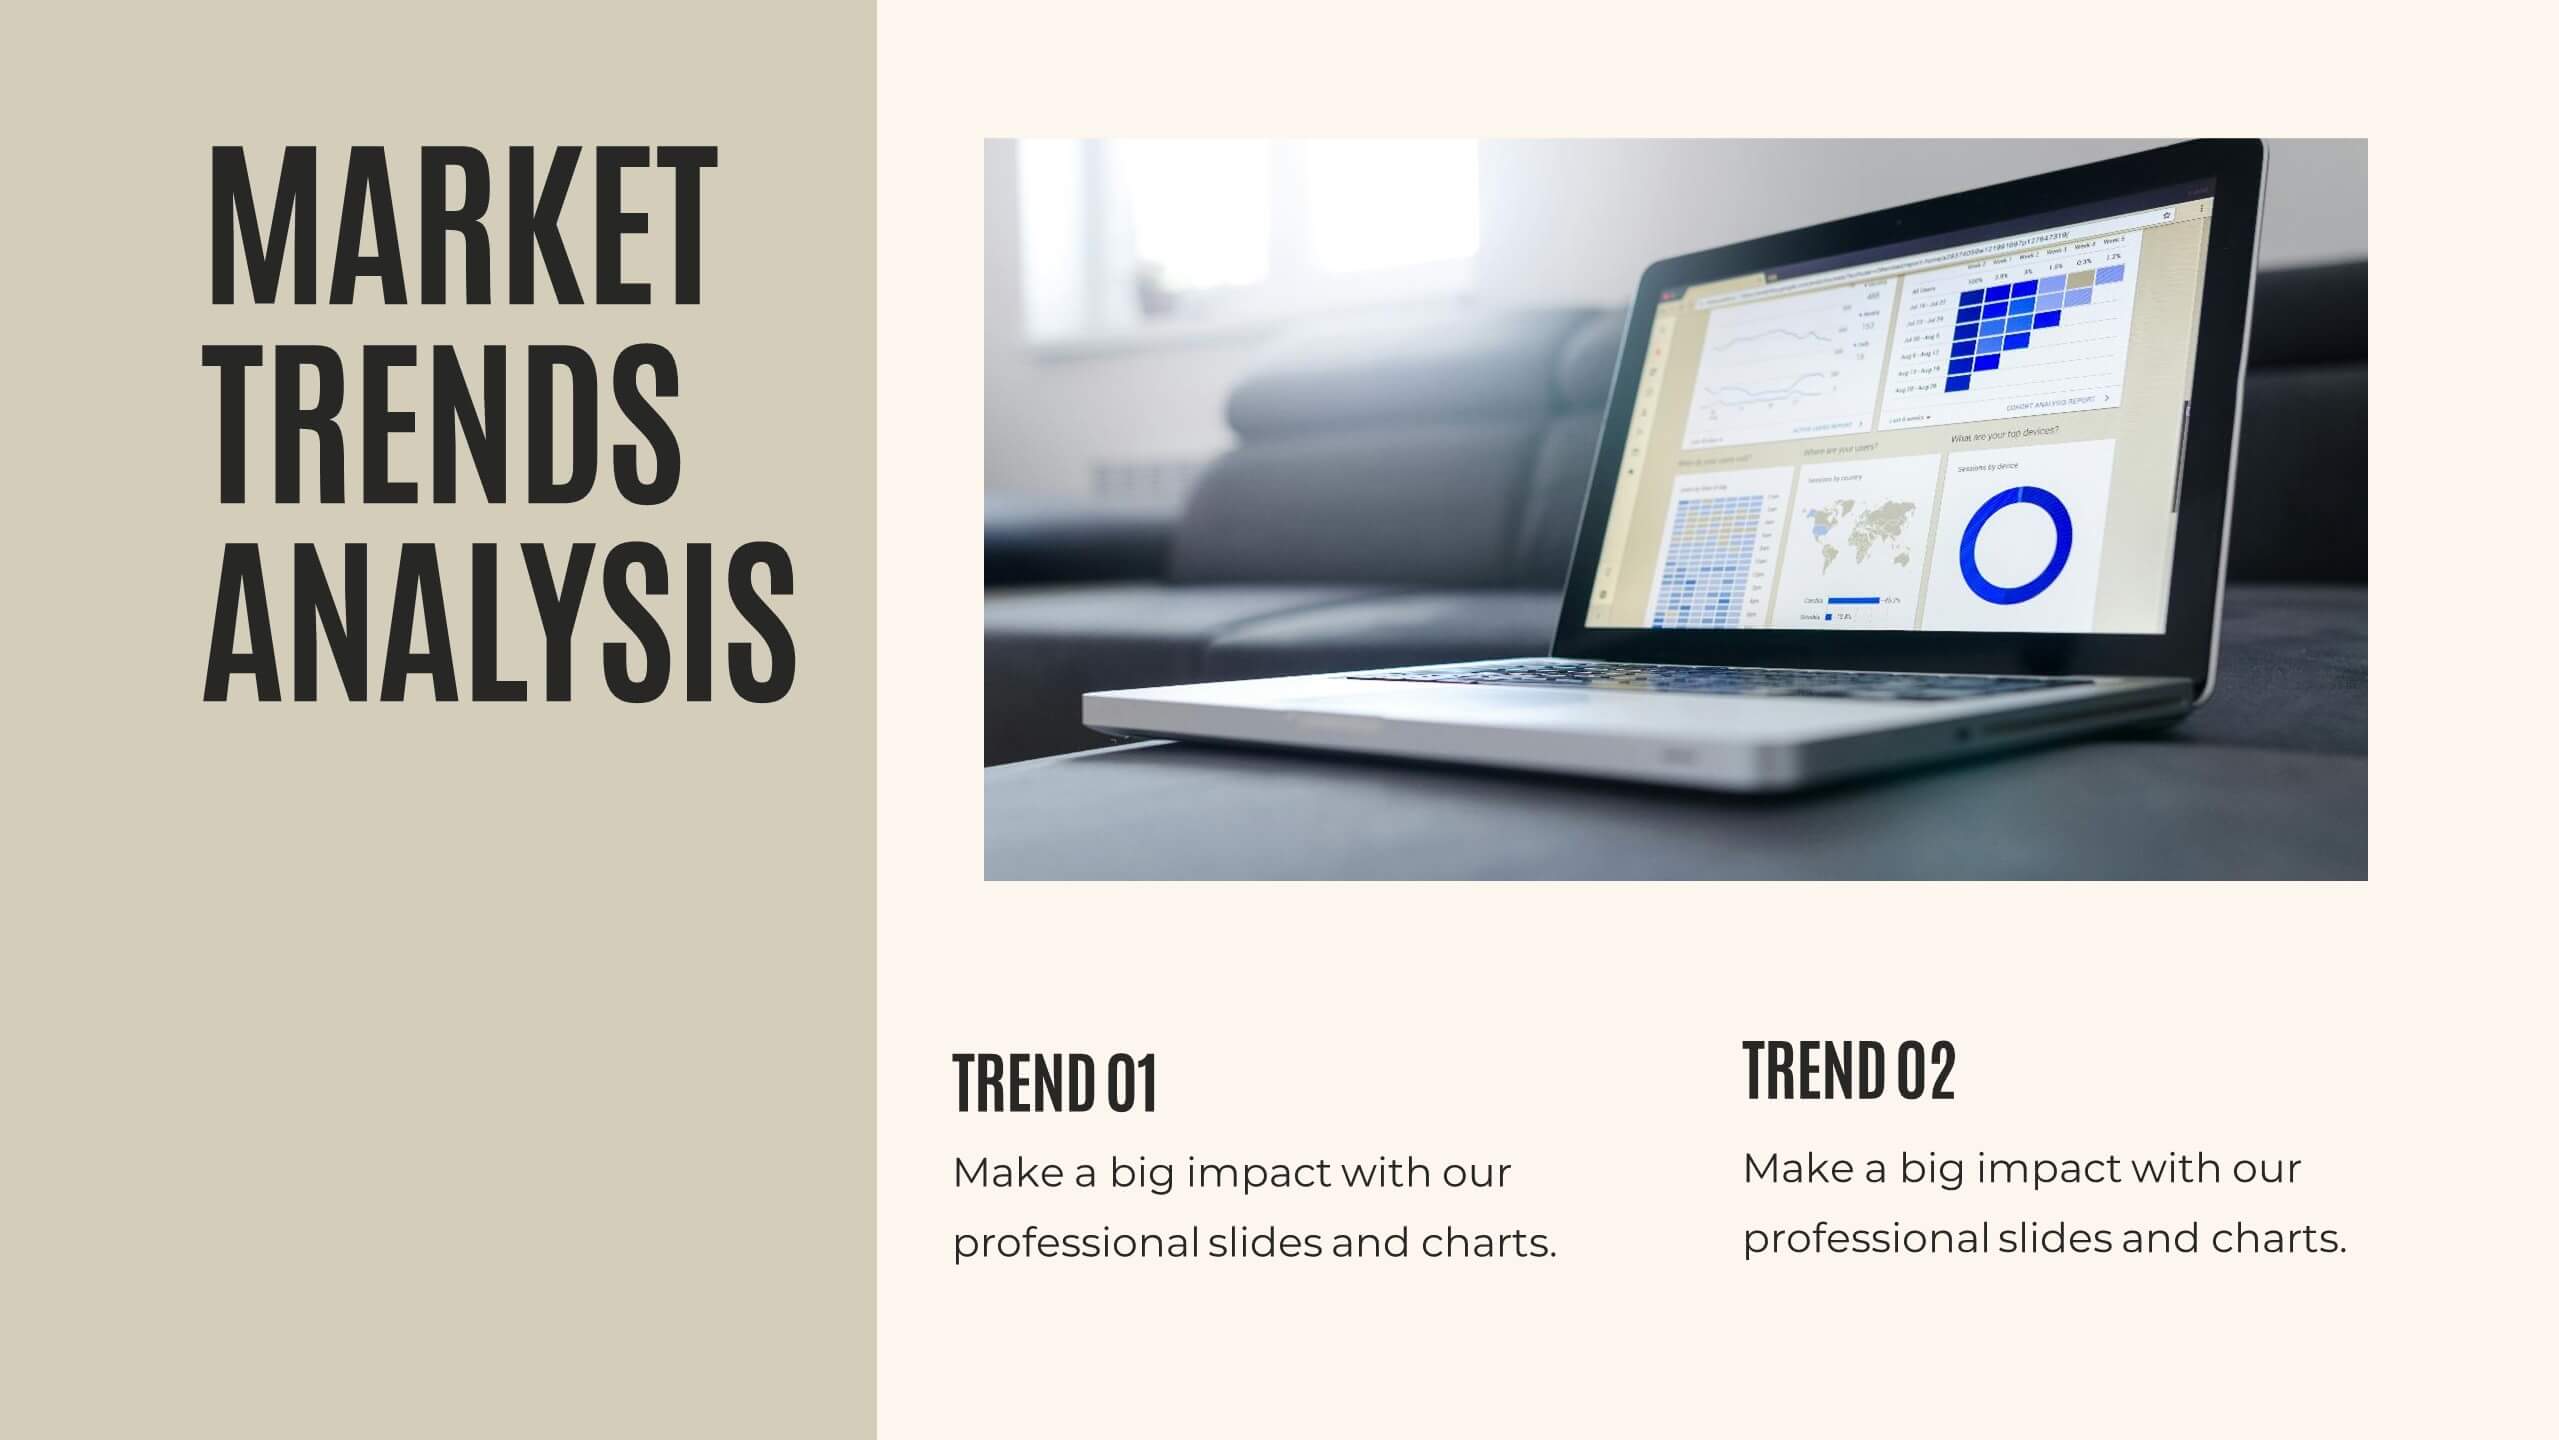
Journey Annual Report Presentation
Present your annual report with clarity and impact! This template covers agenda, key highlights, financial summary, sales performance, and project progress. Ideal for detailing achievements, insights, and future priorities. Compatible with PowerPoint, Keynote, and Google Slides, it ensures your data is visually compelling and easy to understand. Showcase your success effortlessly!


26 slides
Home Solar Power System Presentation
Harness the incredible power of the sun and transform your home with our vibrant and detailed presentation on home solar power systems! Discover the benefits and functionalities of solar energy, designed to help you understand how solar panels work, their environmental impact, and cost savings. Our engaging template covers essential topics like installation processes, efficiency comparisons, and maintenance tips. It includes a variety of infographics, charts, and diagrams to illustrate complex information clearly and effectively. Perfect for homeowners, energy consultants, or anyone interested in sustainable living, this template offers a visually appealing and informative guide to adopting solar power. Customize each slide to fit your needs, whether you're presenting to a small group or a large audience. Compatible with PowerPoint, Keynote, and Google Slides, this template ensures a smooth and professional presentation experience. Ideal for showcasing the future of clean energy and encouraging the switch to renewable resources.