


Features
- 4 Unique slides
- Fully editable and easy to edit in Microsoft Powerpoint, Keynote and Google Slides
- 16:9 widescreen layout
- Clean and professional designs
- Export to JPG, PDF or send by email


Do you have any questions?
Recommend


6 slides
Business Mission Statement Presentation
Here is a vivid "Business Mission Statement" presentation template tailored to elucidate your company's core objectives and strategic goals. This template features a unique brain-design interface that symbolizes thought leadership and innovative thinking, ideal for sharing insights that resonate deeply with your team or stakeholders. Compatible with PowerPoint, Keynote, and Google Slides, it's the perfect tool for broadcasting your mission with clarity and impact.


10 slides
Business Performance Metrics Presentation
Track and display your business metrics effectively with the "Business Performance Metrics" presentation templates. These visually engaging slides are designed to help you present key performance indicators in a clear and structured manner, enhancing understanding and decision-making. Ideal for corporate presentations, these templates are fully compatible with PowerPoint, Keynote, and Google Slides, ensuring seamless integration into your workflow.


5 slides
Social Myths & Facts Infographics
A Social Myth might be a certain belief, while a Social Fact would be the correct answer with data. This engaging and informative Infographics template is designed to help you dispel common misconceptions and provide accurate information on various social topics. With this template you can cover stereotypes, challenge myths, or present facts to promote understanding and awareness. The template features a modern design with vibrant colors and captivating visuals, making it visually appealing and easy to navigate. It includes a variety of design elements such as icons, illustrations and timelines that can all be customized.


3 slides
Cost-Benefit Analysis and Strategic Outcomes Presentation
Present trade-offs with clarity using the Cost-Benefit Analysis and Strategic Outcomes Presentation. Designed with visual balance scales and segmented callouts, this layout helps you compare investments versus returns, making complex decisions easier to explain. Ideal for proposals, audits, or business strategy reviews. Fully editable in PowerPoint, Keynote, and Google Slides.


7 slides
Modern Education Infographic
Immerse yourself in the evolving world of learning with our Modern Education Infographic. With a crisp white canvas, the design incorporates an energizing mix of orange, the trust-building hue of blue, and a dash of passionate red. This template boasts modern infographics, bespoke icons, and versatile image placeholders, offering a visual guide to contemporary educational methods, tools, and trends. Precision-made for Powerpoint, Keynote, or Google Slides. Ideal for educators, curriculum developers, edtech startups, or any professional keen on showcasing the transformation in learning techniques.


6 slides
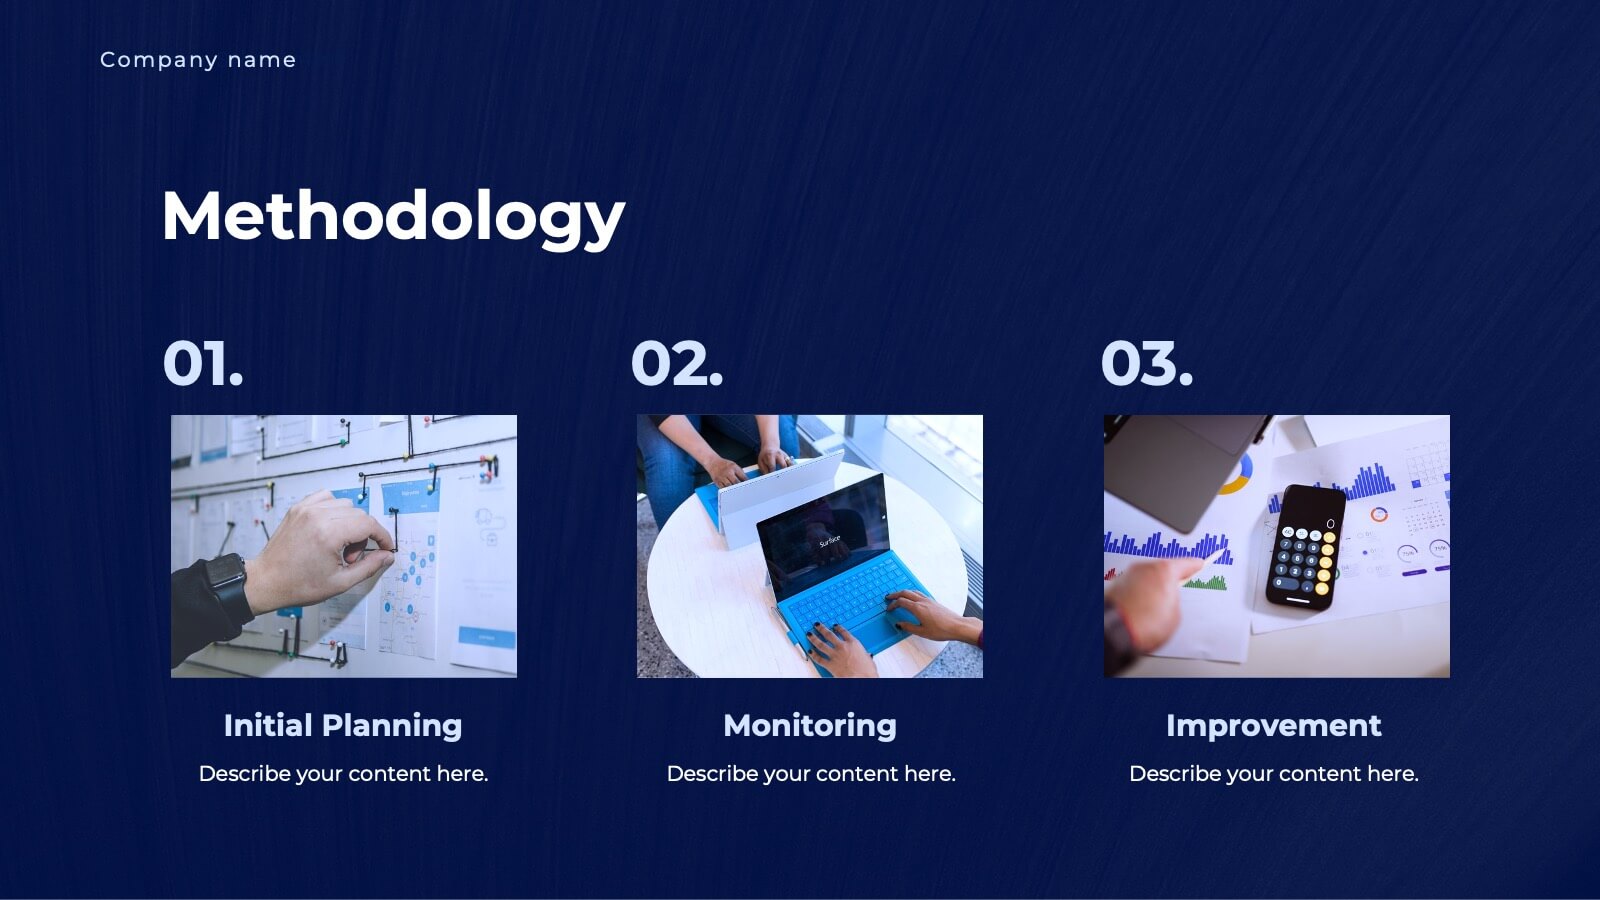
Defining Project Scope
Visualize your project's key components with this sleek hexagonal layout, perfect for outlining milestones, deliverables, and priorities. This six-part diagram helps teams align goals and clarify scope early in the process. Ideal for PMs, strategists, and consultants. Fully editable in PowerPoint, Keynote, and Google Slides.


5 slides
European Market Trends with Europe Map Presentation
Navigate market dynamics with the European Market Trends with Europe Map template, designed for business professionals analyzing key trends and opportunities across the region. It features an editable map, key data indicators, and graphical elements to represent market trends and opportunities. Compatible with PowerPoint and Google Slides, it's ideal for presentations on market analysis and growth strategies.


6 slides
PESTEL Analysis Business Presentation
The "PESTEL Analysis Business Presentation" template effectively facilitates a comprehensive review of the political, economic, social, technological, environmental, and legal factors that impact strategic business decisions. This template is designed to help strategists, analysts, and managers evaluate and present external factors that could affect their business operations and market environment. Each segment of the analysis is visually represented through connected circles, making complex data easily understandable. This layout encourages a structured discussion on each PESTEL aspect, ensuring that all critical elements are covered, making it an essential tool for businesses looking to align their strategies with external conditions.


5 slides
Cloud Technology Architecture Presentation
Visualize the power of modern connectivity with this clean and professional template designed to explain digital systems, cloud layers, and data flow. Ideal for tech teams and IT presentations, it simplifies complex information into clear visuals. Fully editable and compatible with PowerPoint, Keynote, and Google Slides for effortless customization.


8 slides
Dynamic Pricing Strategies Presentation
Navigate market complexities with our 'Dynamic Pricing Strategies' presentation template, perfect for outlining variable pricing models that respond to market demands. This versatile tool is ideal for businesses looking to adapt and thrive, with designs compatible with PowerPoint, Keynote, and Google Slides.


5 slides
Organizational and IT Network Mapping Presentation
Visualize internal roles and technical relationships with this Organizational and IT Network Mapping template. Ideal for IT teams, operations, or management, it helps illustrate user access, collaboration patterns, and system connections. Fully customizable and compatible with PowerPoint, Keynote, and Google Slides for a seamless integration into your presentations.


8 slides
Marketing Plan and Audience Targeting Presentation
Visualize your audience segmentation strategy with the Marketing Plan and Audience Targeting Presentation. This bullseye diagram template highlights three key focus areas, making it ideal for showcasing market research, targeting tactics, or funnel stages. Fully editable in Canva, PowerPoint, Keynote, and Google Slides to match your branding and goals.


7 slides
Pillar Infographics Presentation Template
Our Pillar Infographic will present your information in a hierarchical format, with a main "pillar" section at the center and supporting information or sections branching out from it like pillars or columns. This template is designed to provide a simple overview of your topic, while also allowing for more in-depth exploration of specific aspects. The central pillar featured may be used to contain a brief summary or key message, while the surrounding columns or sections may provide more detailed information, data, or visualizations. Grow your audience and increase sales with this template!


5 slides
Fitness Program Infographics
A fitness program is a structured plan designed to improve and maintain physical health and well-being. These vertical infographics outline the key elements and benefits of a fitness program. This template is ideal for gyms, personal trainers, and fitness enthusiasts looking to educate and inspire others to adopt a healthy and active lifestyle. The infographics offer space to include customizable workout plans tailored to different fitness levels, such as weight loss, muscle gain, or overall fitness improvement. Helpful nutrition tips are incorporated to complement the fitness program, emphasizing the importance of achieving fitness goals.

20 slides
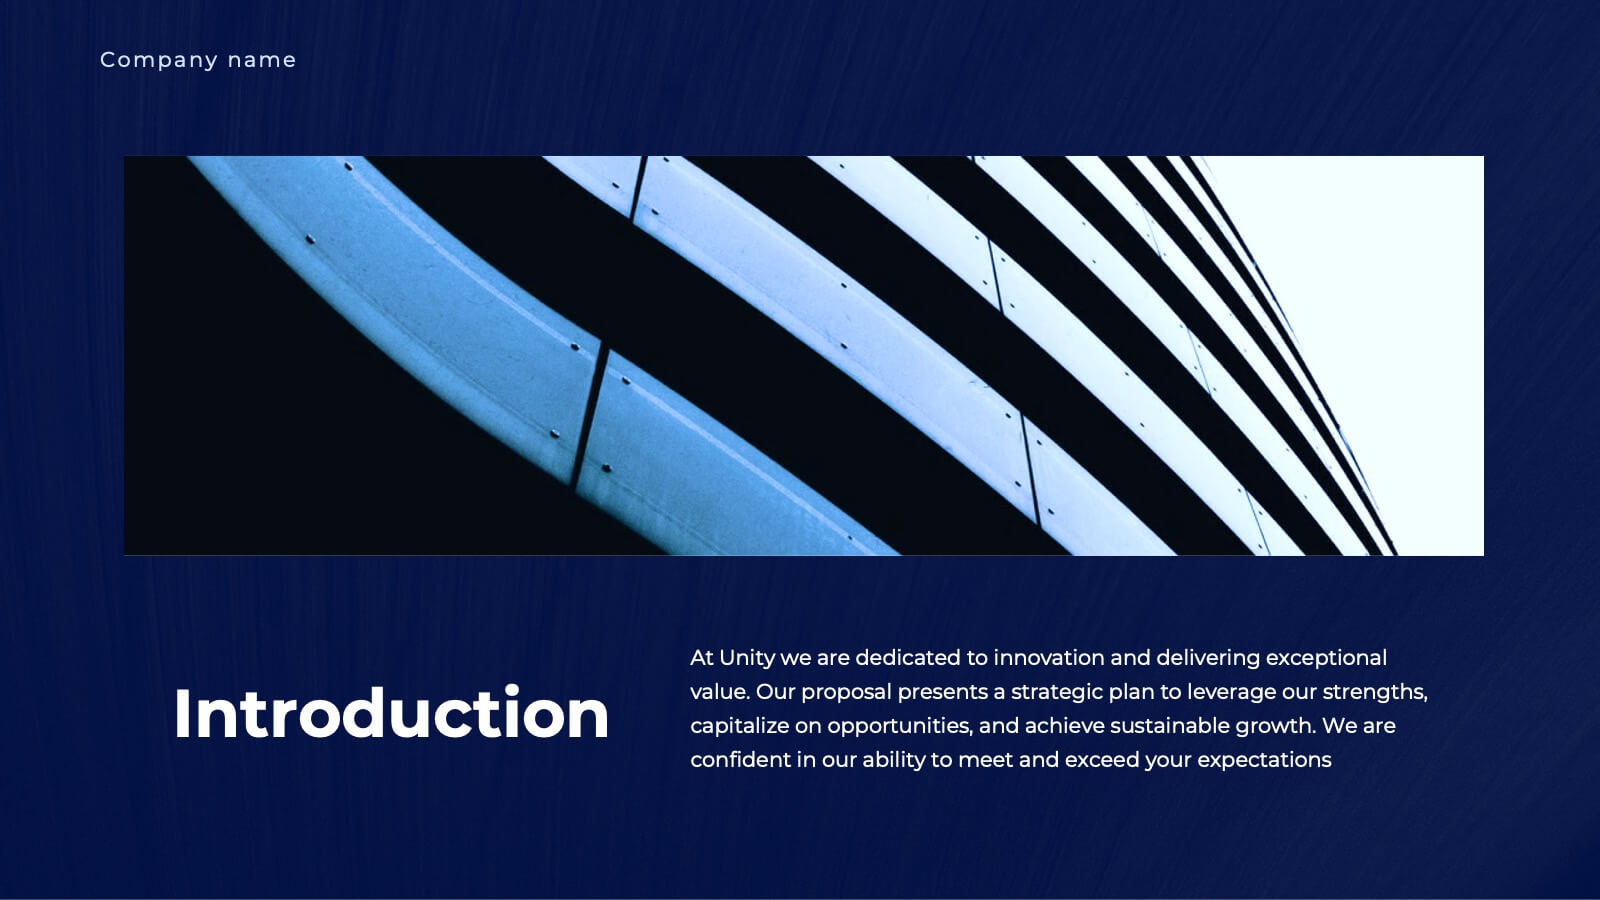
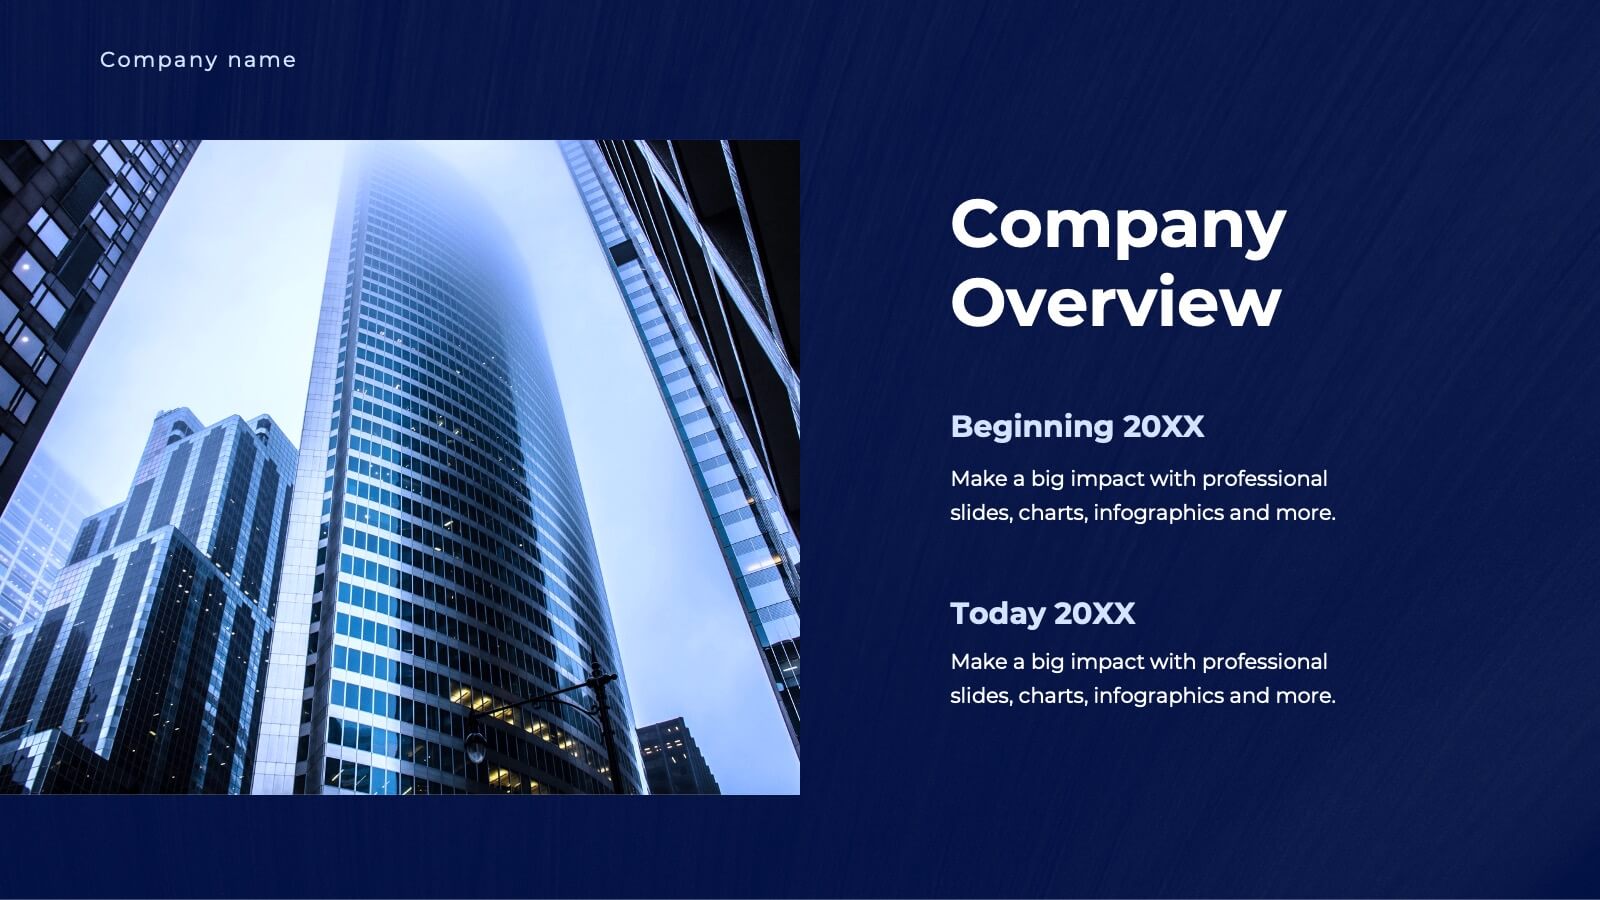
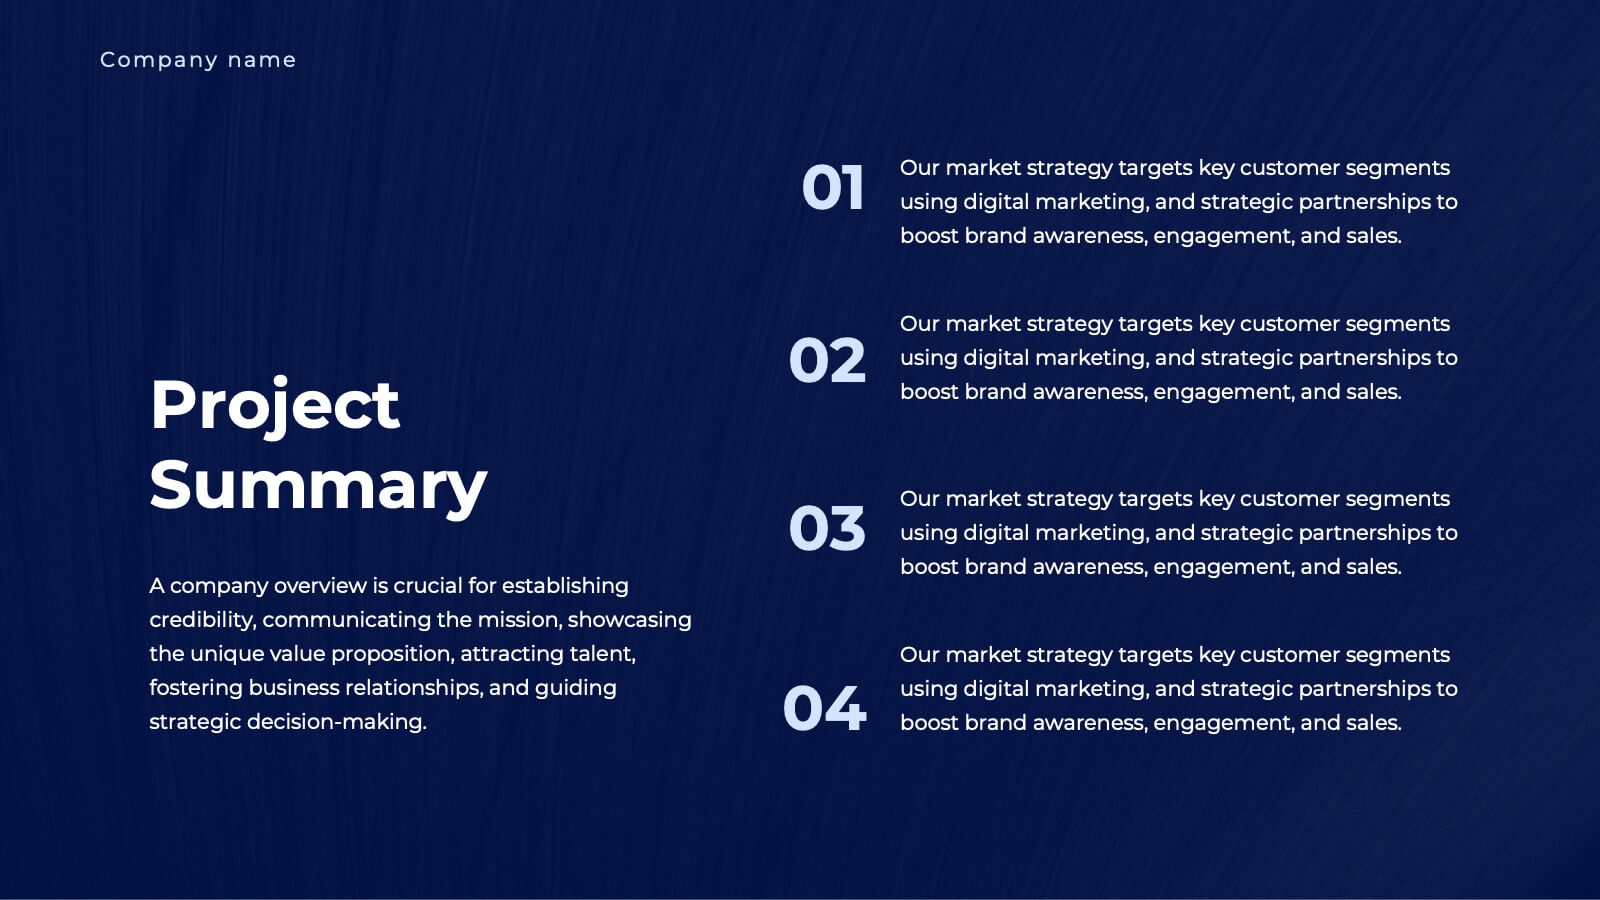
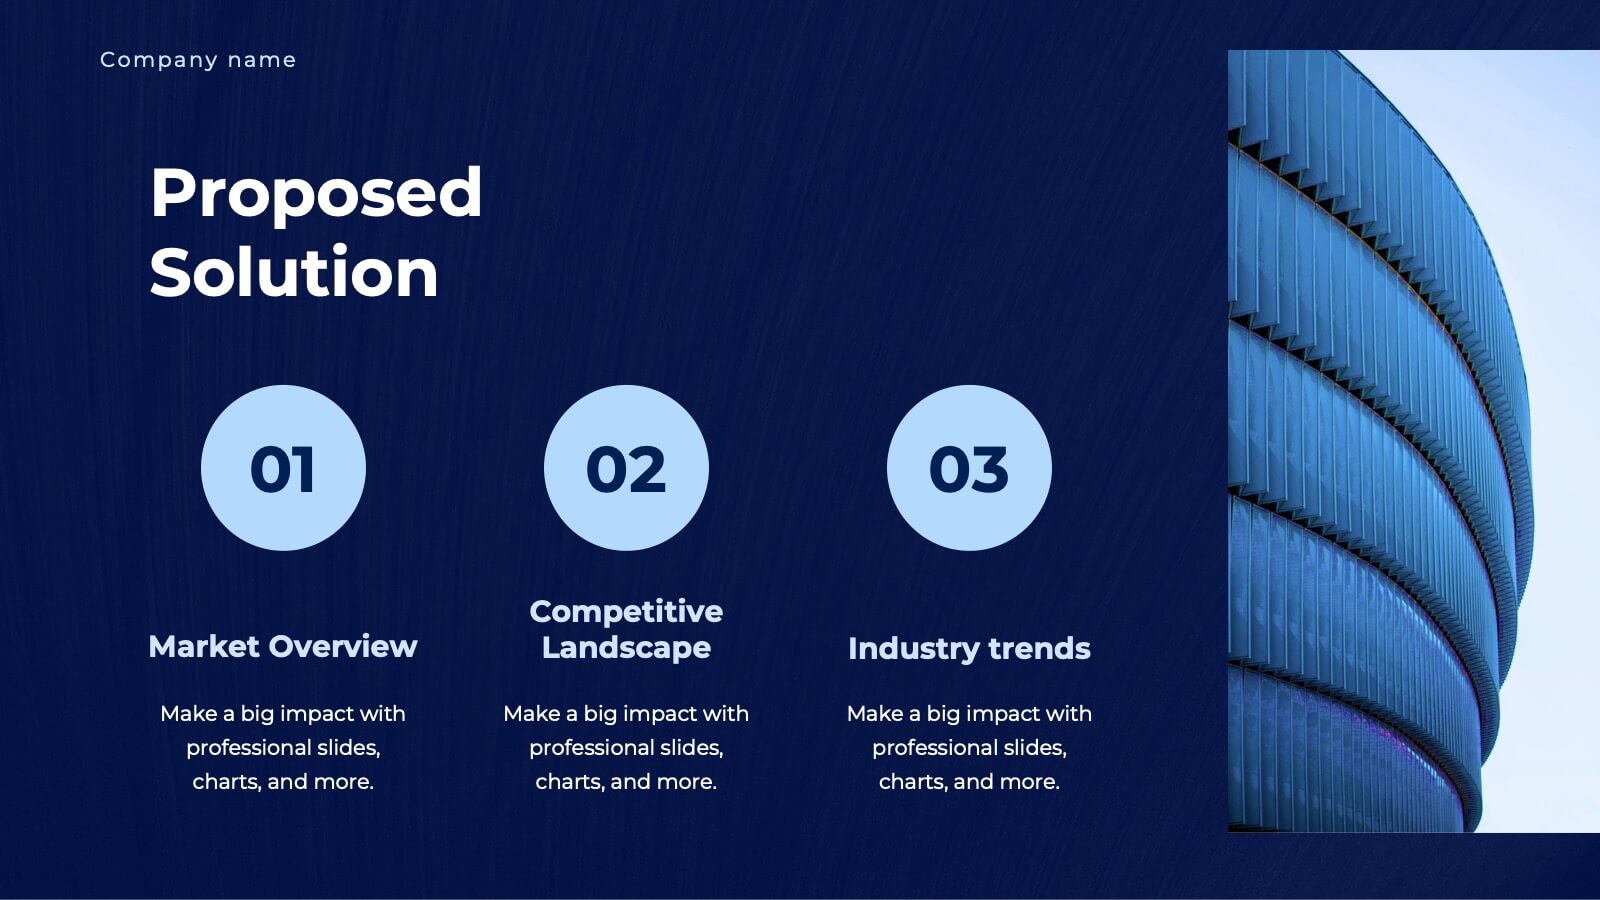
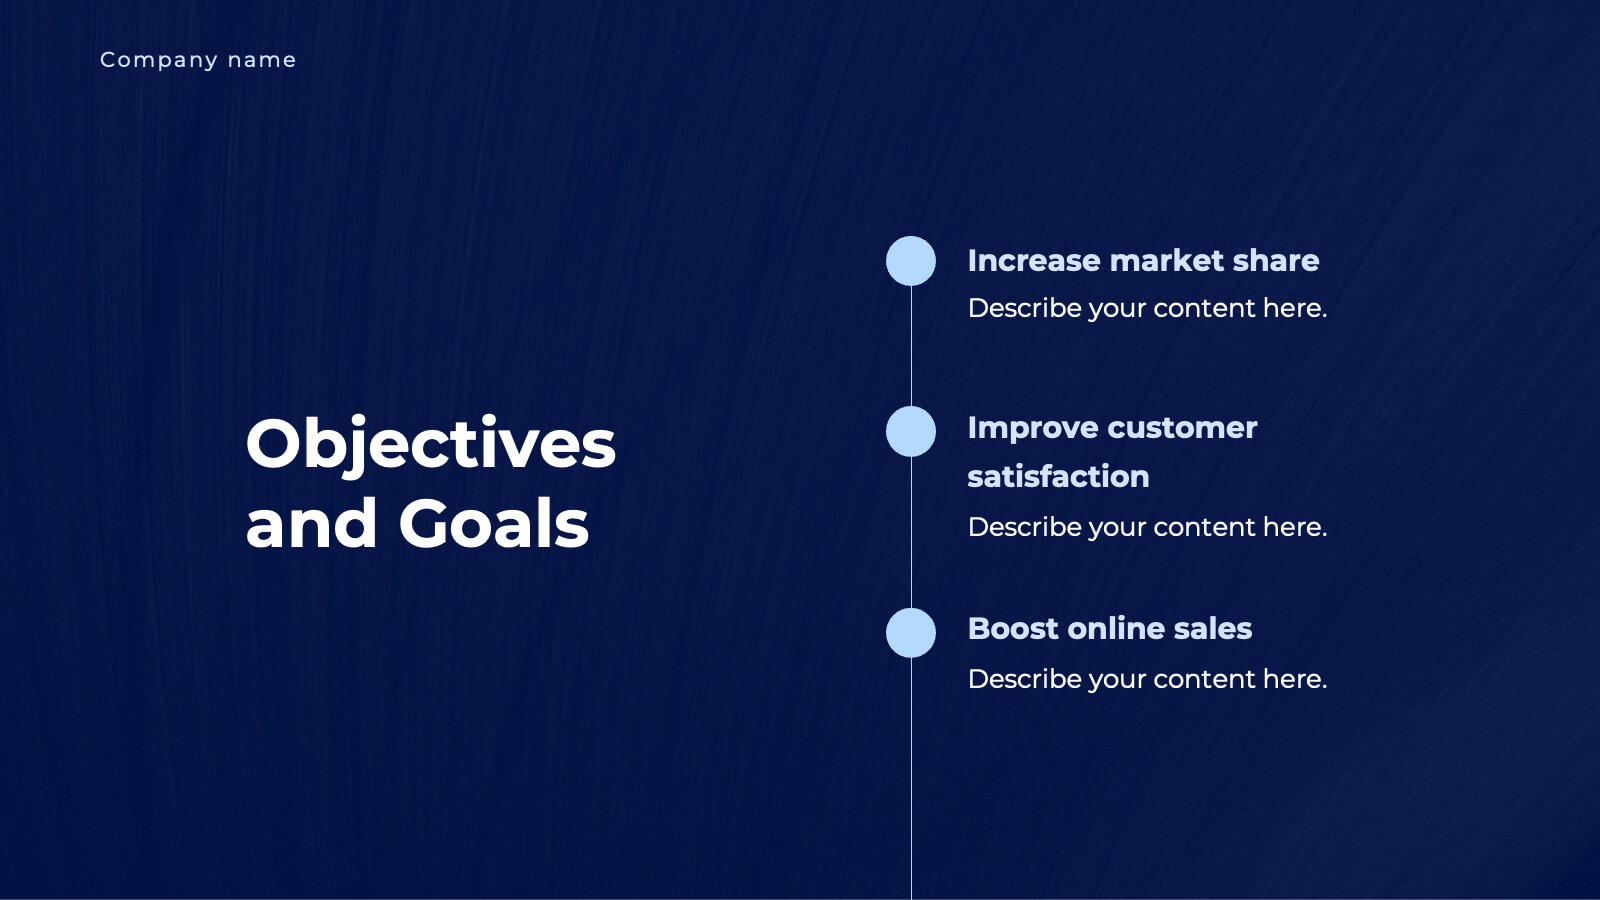
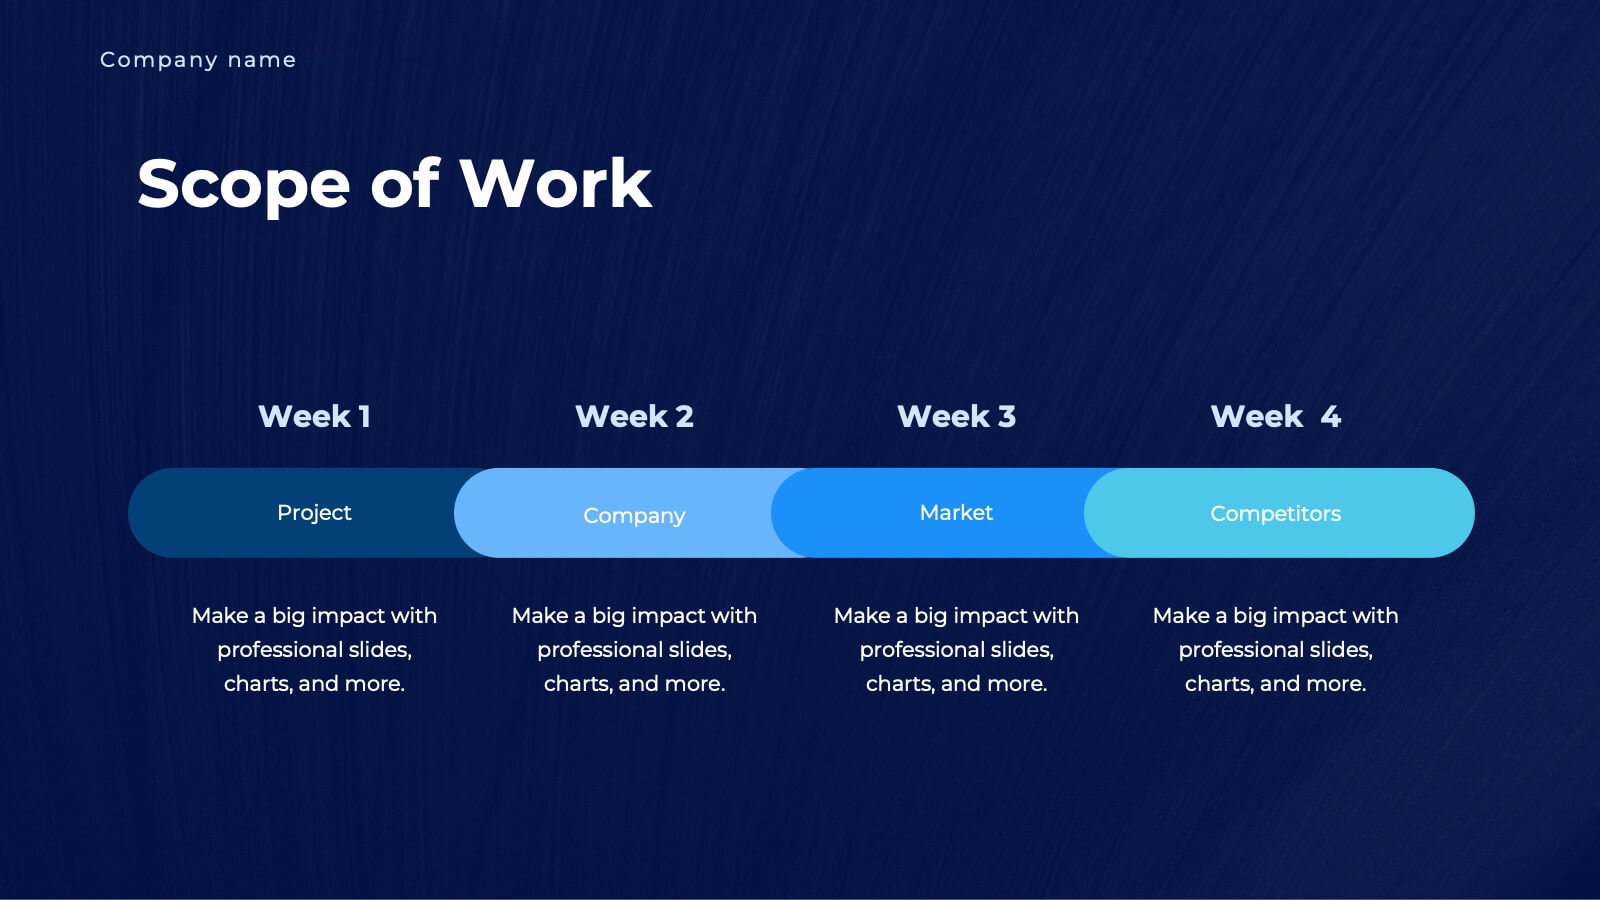
Unity Business Proposal Presentation
Take your business proposals to the next level with this elegant and comprehensive template! Perfect for presenting company overviews, project summaries, and detailed solutions. Ideal for business professionals looking to impress clients and stakeholders. Compatible with PowerPoint, Keynote, and Google Slides, this template ensures your proposals are impactful and professional.


6 slides
Value Chain Optimization and Analysis
Highlight each step that powers your business with this clean and modern value chain template. Ideal for mapping processes, identifying improvement areas, and aligning strategy with operations, this layout makes analysis simple and visual. Fully compatible with PowerPoint, Keynote, and Google Slides.


5 slides
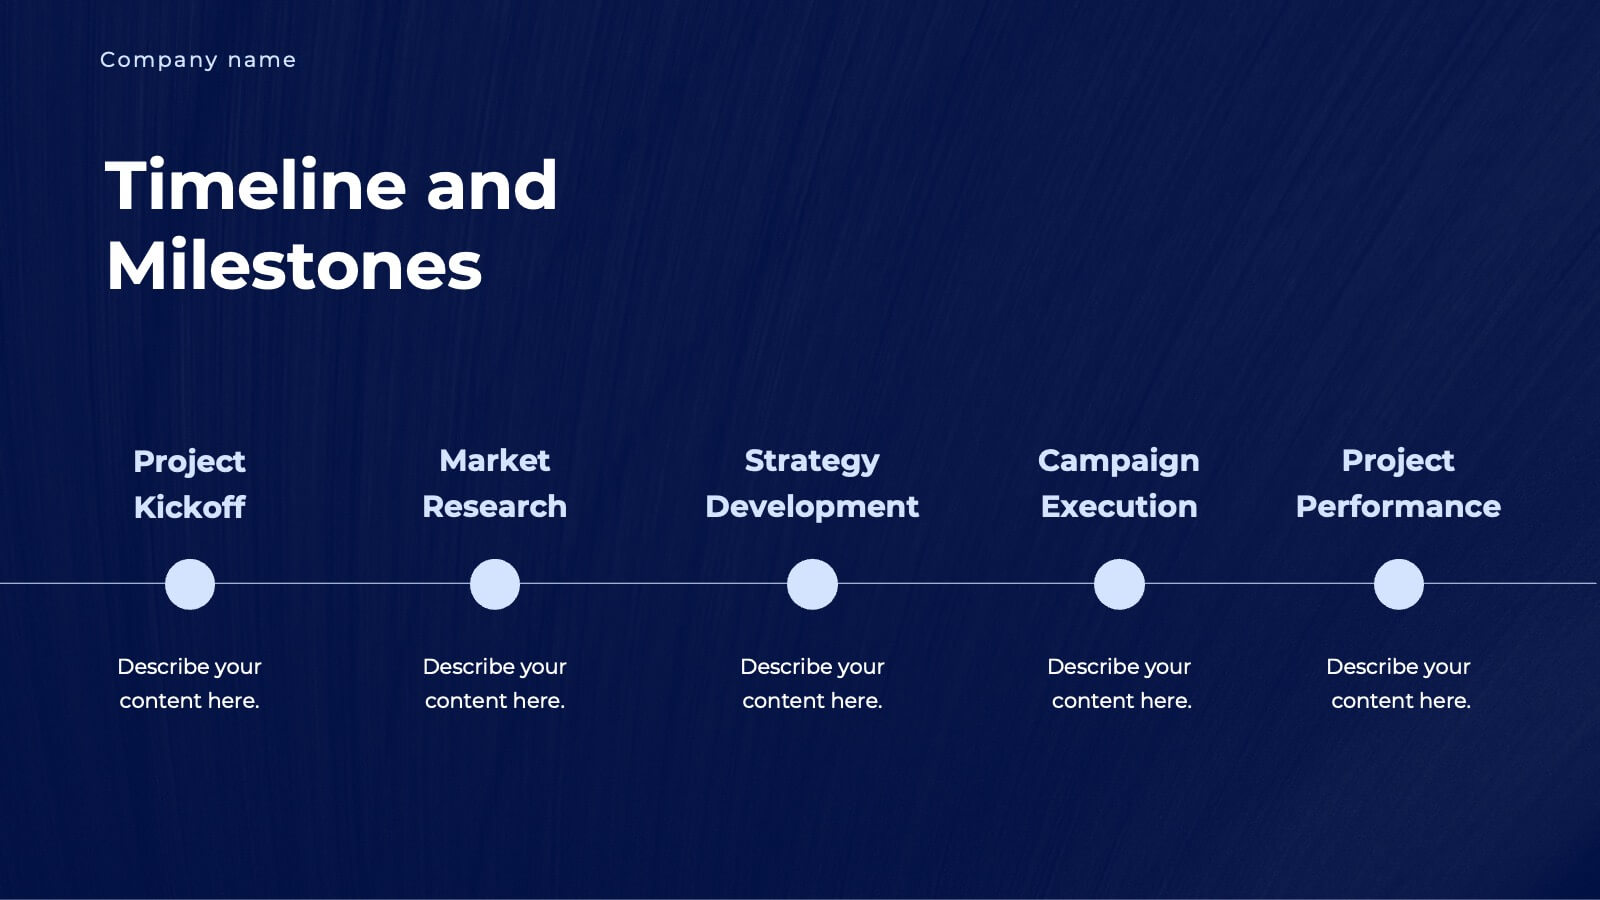
Project Management Framework
Guide your team through every project phase with this step-by-step framework presentation. Designed with a five-stage visual flow, this layout helps clearly communicate key milestones, tasks, and deliverables. Each stage is color-coded for easy tracking and includes editable text and icons. Perfect for planning, strategy, and agile workflows. Fully compatible with PowerPoint, Keynote, and Google Slides.