


Features
- 6 Unique Slides
- Fully editable and easy to edit in Microsoft Powerpoint, Keynote and Google Slides
- 16:9 widescreen layout
- Clean and professional designs
- Export to JPG, PDF or send by email


Do you have any questions?
Recommend


8 slides
Value Chain Optimization and Analysis Presentation
Streamline Your Business for Maximum Efficiency with this Value Chain Optimization and Analysis presentation template. This visually engaging template is designed to map, analyze, and enhance the key activities in your value chain, helping businesses identify opportunities for cost reduction, performance improvements, and strategic advantages. Featuring a clean flowchart layout, intuitive color-coded sections, and editable placeholders, this template is ideal for business analysts, consultants, and executives. Fully compatible with PowerPoint, Keynote, and Google Slides, ensuring seamless customization and professional delivery.


7 slides
Empathy Map Marketing Infographics
Gain deeper customer insights with our Empathy Map Marketing Infographic, ideal for marketing teams, product developers, and customer experience strategists. This infographic is a visual tool designed to help you understand your customers' experiences and perspectives. Our Empathy Map Marketing Infographic outlines a clear framework to map out what customers say, think, do, and feel. It's crafted to assist teams in building a customer-centric approach by examining various aspects of the customer journey. With sections dedicated to customer thoughts, emotions, actions, and pain points, you can tailor your marketing strategies to better address customer needs and enhance engagement. This SEO-optimized infographic ensures your marketing plans resonate with your target audience. Implement our infographic in your marketing workshops to foster an empathetic understanding of your customers, driving more personalized and effective marketing campaigns.


6 slides
Territorial Analysis of US Regions Presentation
Present clear regional insights with this Territorial Analysis of US Regions template. Ideal for market segmentation, sales reporting, or demographic studies. Each region is color-coded for quick comparison and fully editable to match your data. Compatible with PowerPoint, Keynote, and Google Slides—perfect for marketers, strategists, or analysts.


6 slides
Next Steps Outline for Project Teams Presentation
Keep your team aligned and motivated with a clear visual roadmap that outlines every upcoming milestone. Perfect for presenting project phases, workflow updates, or strategic goals, this slide ensures everyone knows what’s next. Fully compatible with PowerPoint, Keynote, and Google Slides for seamless editing and presentation versatility.


20 slides
Harmony Sales Forecast Presentation
Elevate your sales forecasting presentations with this vibrant and engaging template! Designed to captivate your audience, it covers all critical areas such as objectives, strategy, performance metrics, and opportunities. Keep your team motivated with visually striking layouts and an easy-to-follow structure. Compatible with PowerPoint, Keynote, and Google Slides for seamless integration!


5 slides
Harvey Ball Rating System Overview Presentation
Visualize performance ratings or feature comparisons with the Harvey Ball Rating System Overview Presentation. This template uses vertical bar visuals combined with Harvey ball icons to communicate progress, satisfaction, or status across four key areas. Clean, intuitive, and ideal for executive summaries or status dashboards. Fully editable and compatible with PowerPoint, Keynote, and Google Slides.


6 slides
Transportation and Logistics Jobs Infographic
Transportation and logistics jobs involve managing the movement of goods, materials, and people from one location to another. This infographic template is essential in ensuring the efficient and smooth operation of supply chains, distribution networks, and transportation systems. This infographic is an informative representation of the various job roles and career opportunities available within the transportation and logistics industry. This template is designed to provide valuable insights to individuals seeking careers in this field, as well as professionals looking to explore different career paths within transportation and logistics.


7 slides
Competitive Analysis Using Strategy Wheel
Highlight your competitive edge with this dynamic strategy wheel diagram. Designed to visually compare up to six business components, this slide is ideal for showcasing strengths, weaknesses, or market positioning. Perfect for strategic planning sessions, it’s fully editable in PowerPoint, Keynote, and Google Slides.


6 slides
Innovative Design Thinking Steps Presentation
Bring structure to creativity with a bold, modern layout that walks your audience through each phase of innovation. Perfect for showcasing processes, strategy development, or brainstorming frameworks, this presentation makes complex ideas feel simple and engaging. Fully compatible with PowerPoint, Keynote, and Google Slides for effortless editing and presentation.


5 slides
Regional Sales Heatmap Presentation
Showcase performance by region with this Regional Sales Heatmap Presentation. This template highlights U.S. state-by-state sales data using gradient color coding and a clear legend system. Easily customizable for quarterly reports, territory analysis, or sales strategy reviews. Compatible with PowerPoint, Keynote, and Google Slides.


29 slides
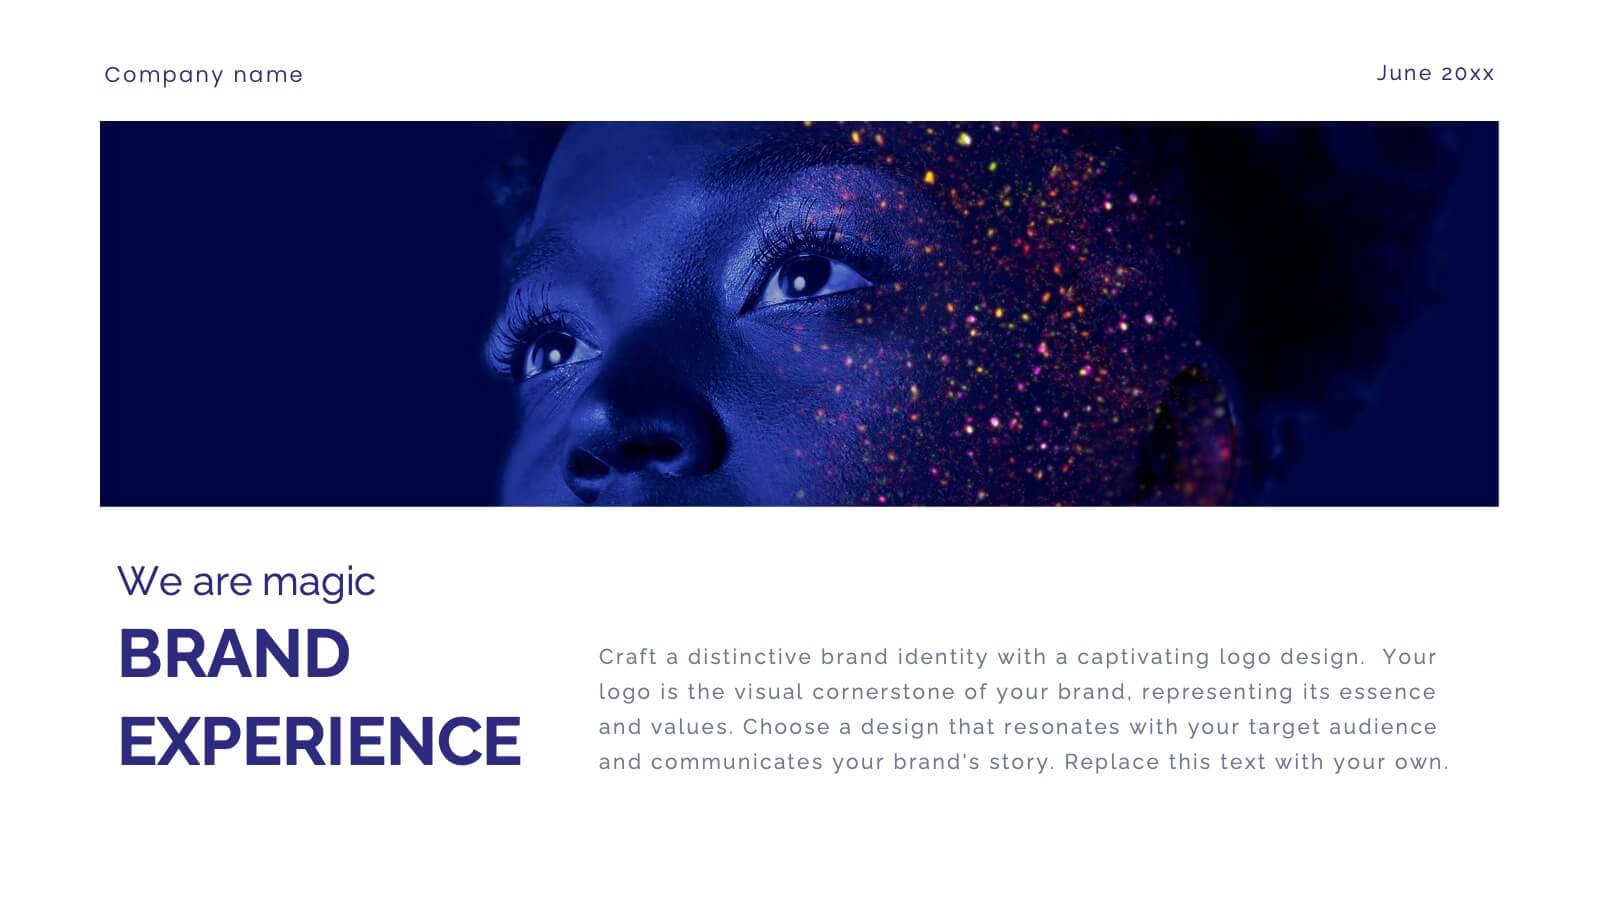
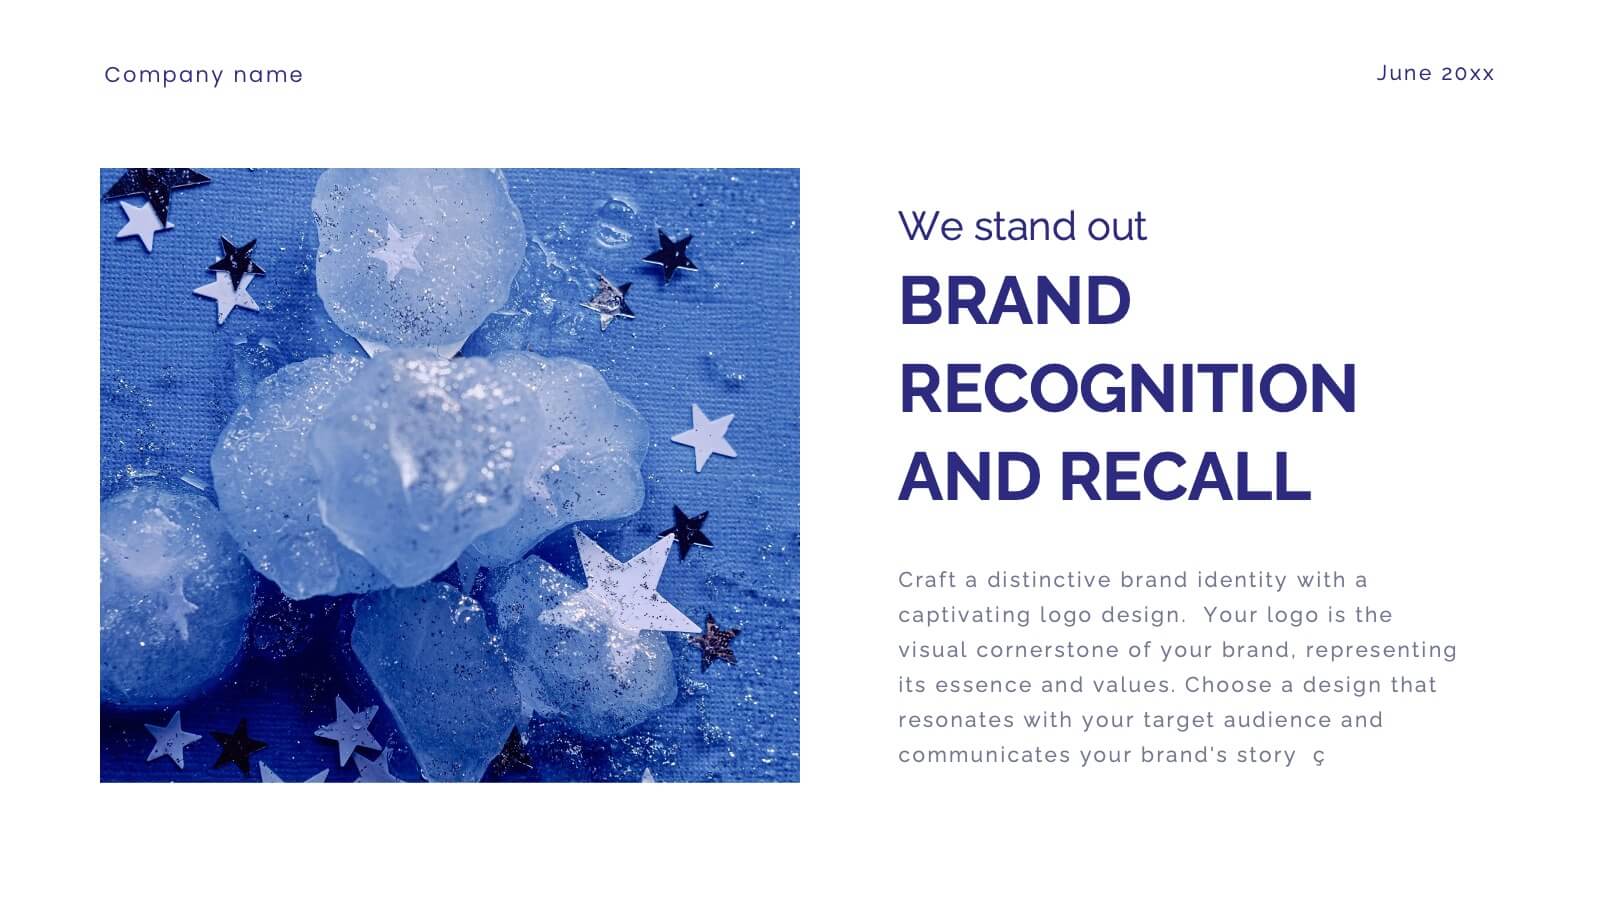
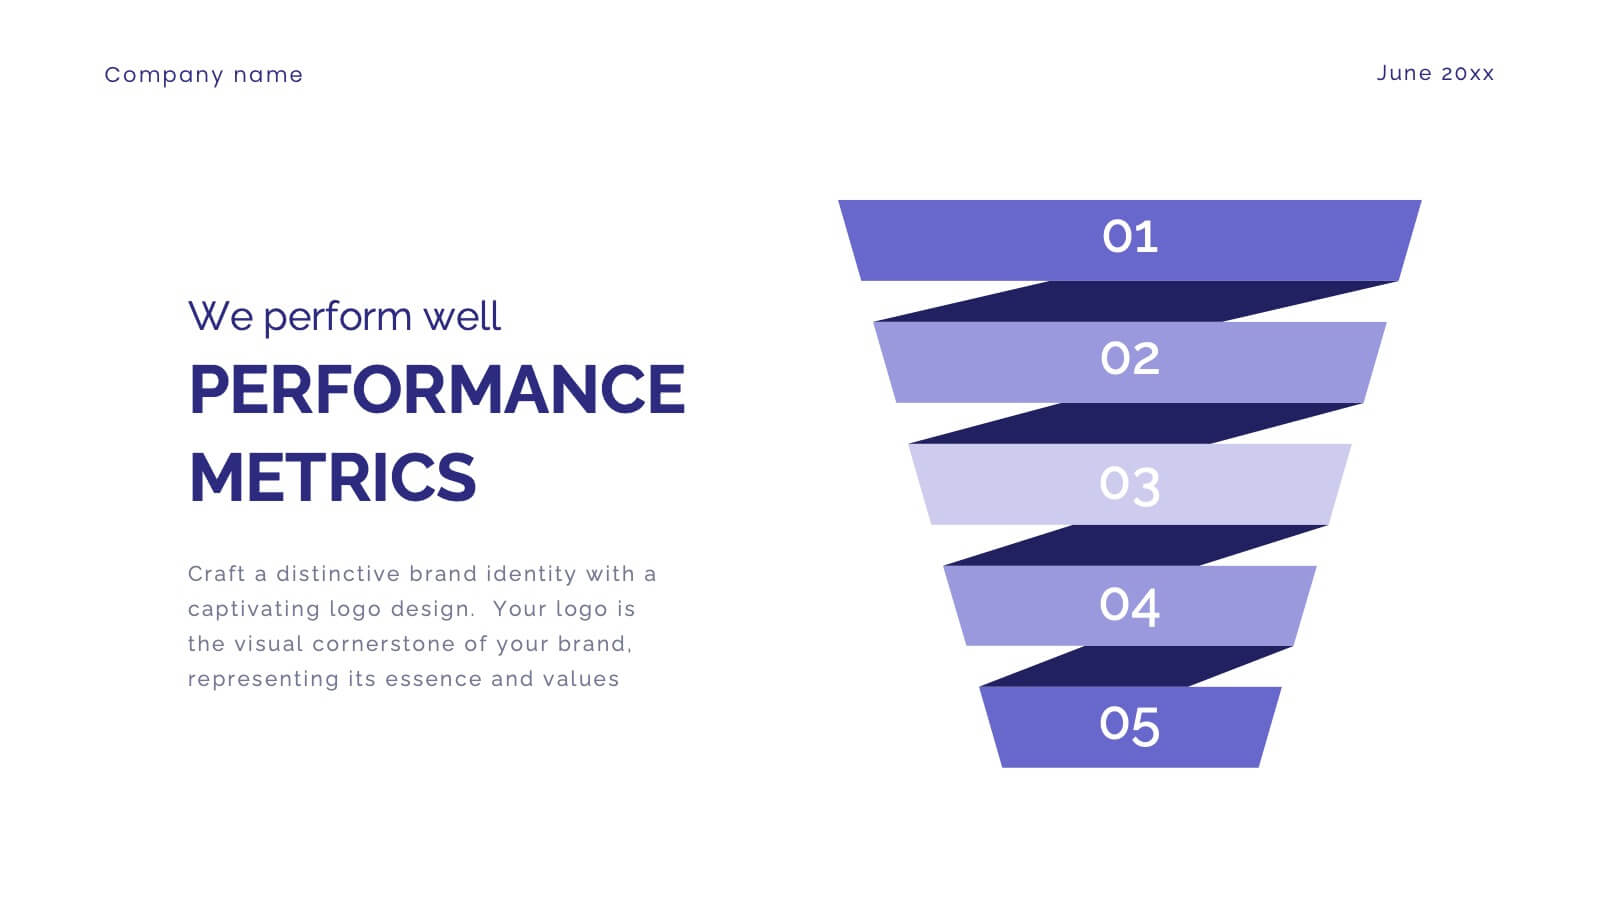
Shadowglow Brand Guidelines Proposal Presentation
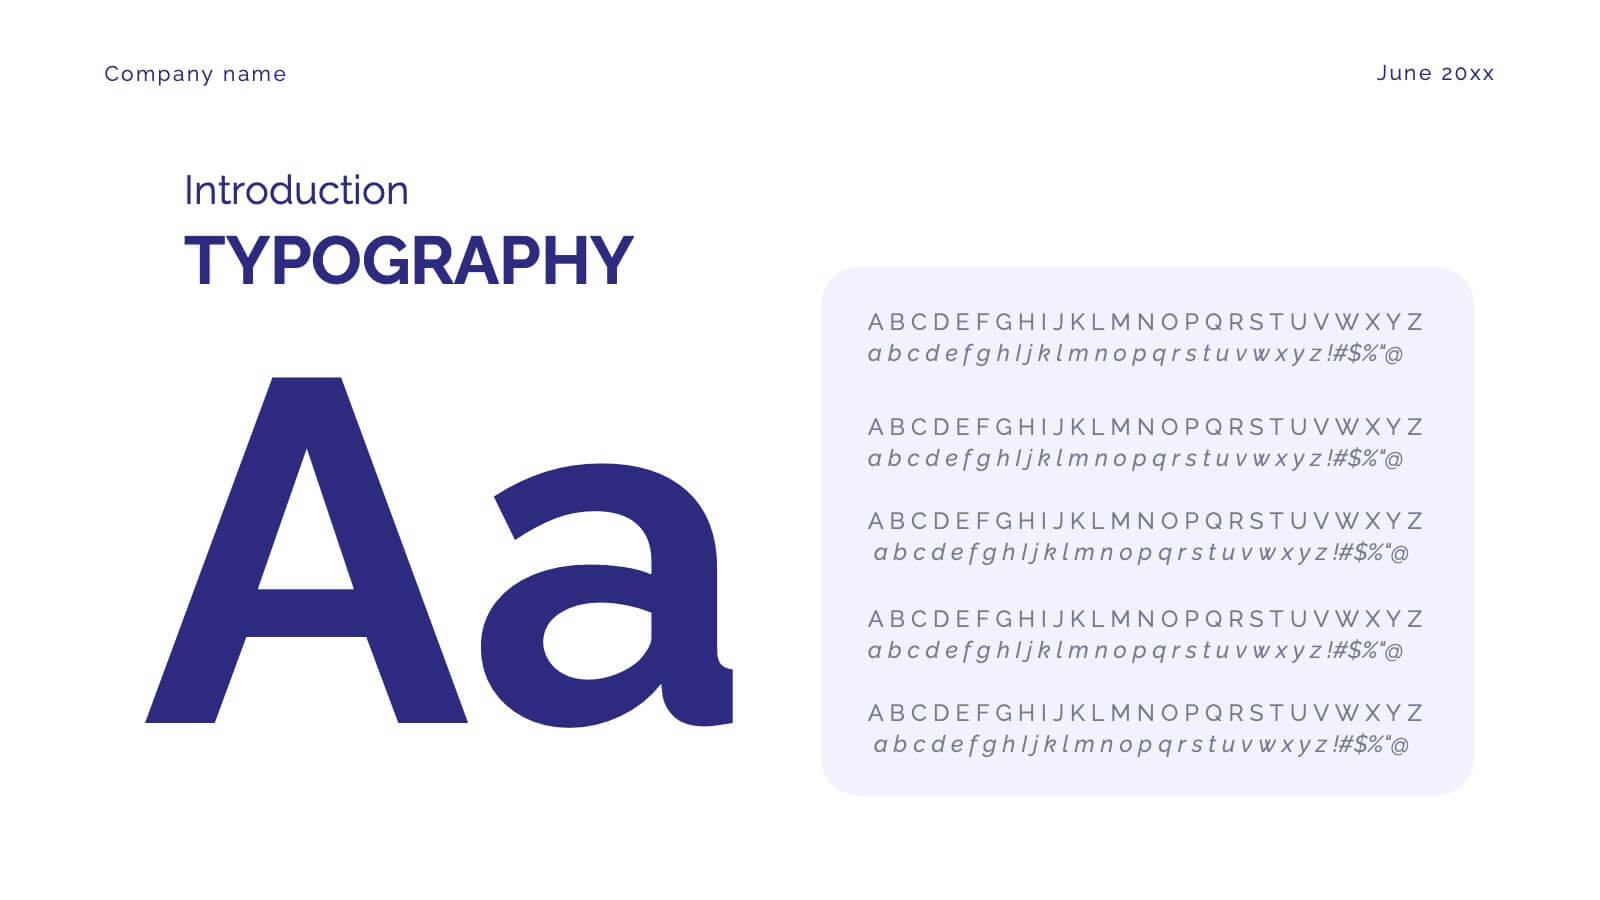
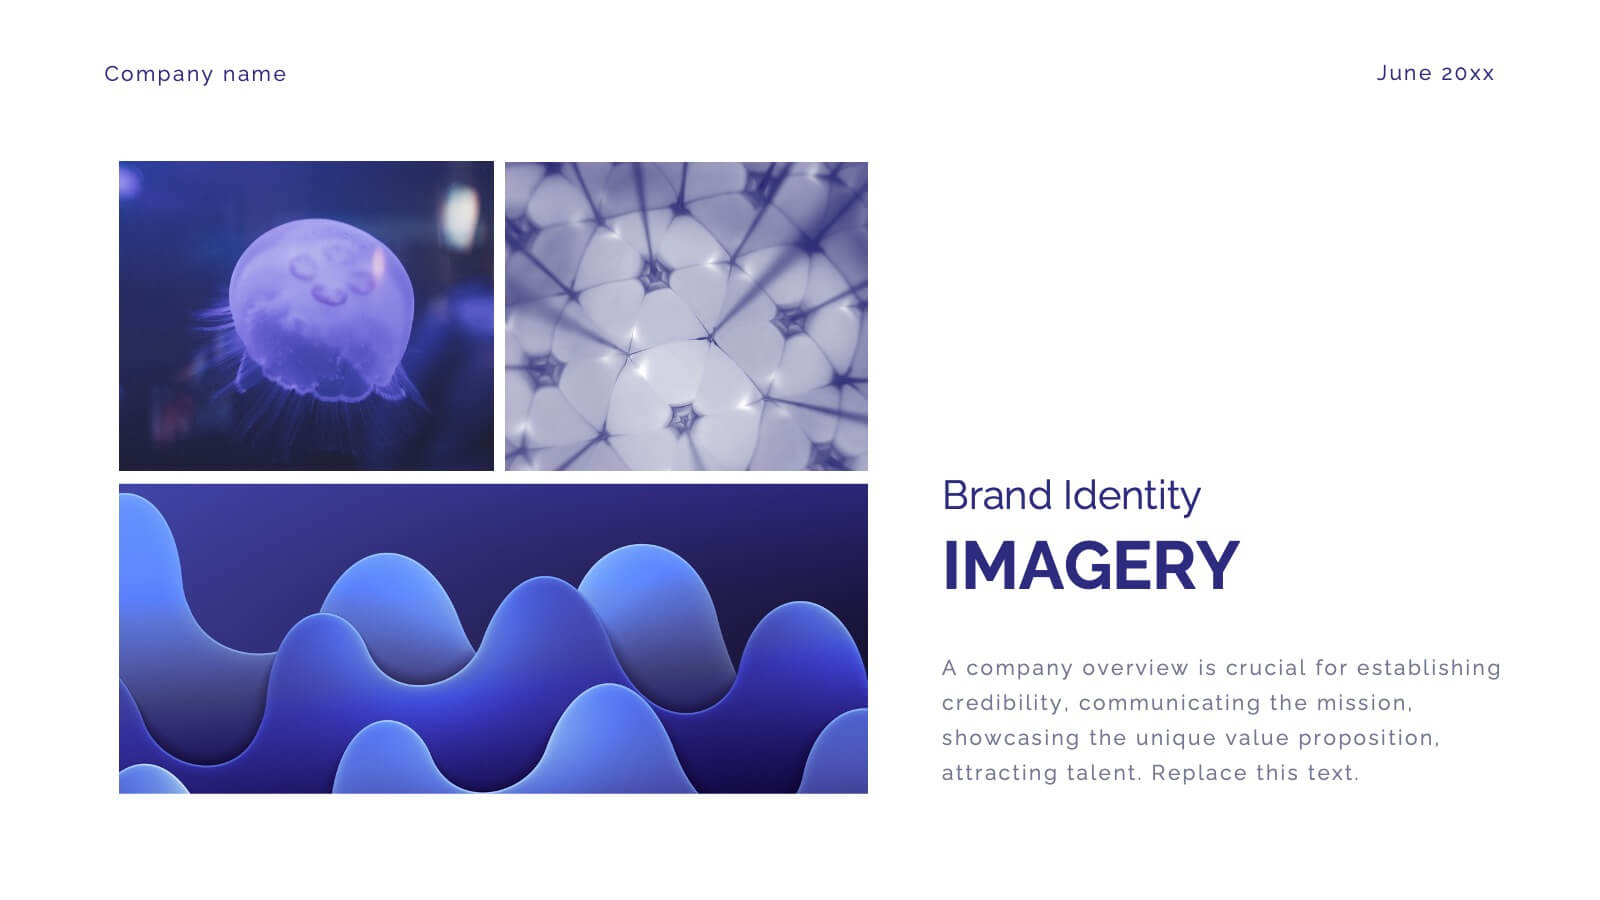
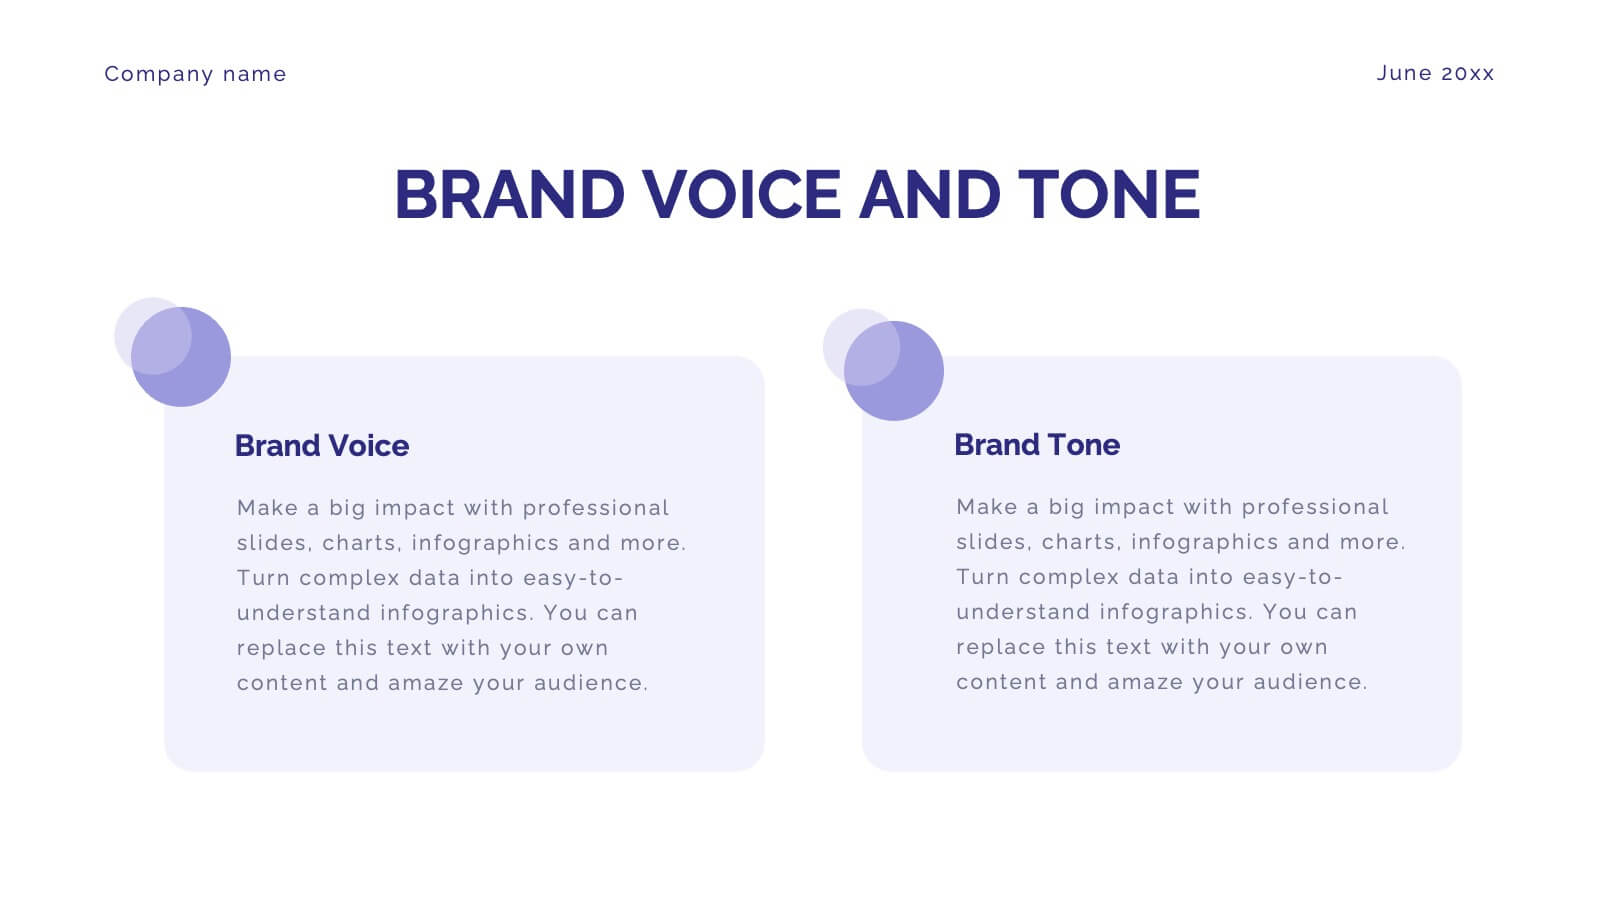
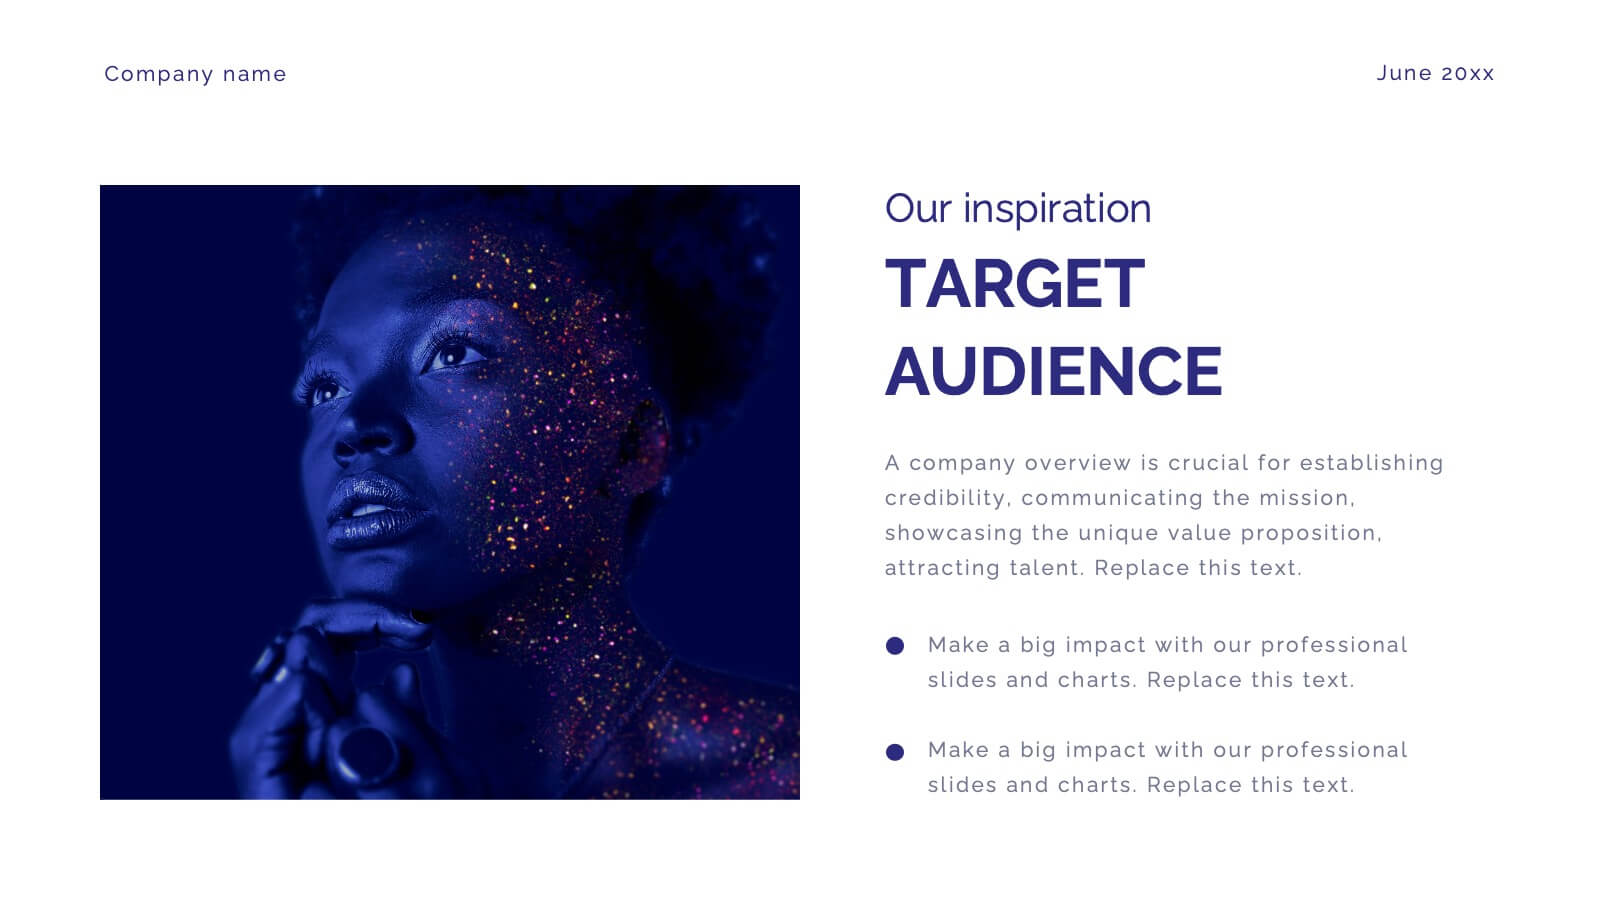
Present a cohesive brand vision with this professional template, designed for crafting detailed and visually compelling brand guidelines. Highlight essential components like brand vision and mission, brand values, and identity elements, including color palettes, typography, and imagery. This template seamlessly incorporates customer personas, tone and voice guidelines, and brand touchpoints to define the essence of your brand's communication. Utilize slides for website, social media, and packaging strategies to establish consistency across all platforms. Customizable and compatible with PowerPoint, Google Slides, and Keynote, this design ensures clarity and professionalism, making it ideal for agencies or teams presenting comprehensive brand proposals.


5 slides
Business Growth and Expansion
Visually communicate each stage of business development with this Business Growth and Expansion diagram. Featuring a dynamic circular flow, this editable slide is perfect for showcasing progress, scaling strategies, or roadmap milestones. Fully compatible with PowerPoint, Keynote, and Google Slides—ideal for business plans and strategic presentations.


20 slides
Illumira Design Proposal Presentation
Impress clients with this modern and professional design proposal presentation template. It covers key sections such as project summary, objectives, budget breakdown, and action plans. Fully customizable with clean layouts and engaging visuals, perfect for showcasing your design solutions effectively. Compatible with PowerPoint, Keynote, and Google Slides.


10 slides
South America Business Development Growth Map Presentation
Showcase business growth insights with this South America-focused development map. Featuring vibrant bar-style columns aligned with country highlights, this layout helps visualize economic potential, investment zones, and performance indicators. Perfect for regional strategy presentations, market analysis, and expansion proposals. Fully editable for PowerPoint, Keynote, and Google Slides compatibility.


26 slides
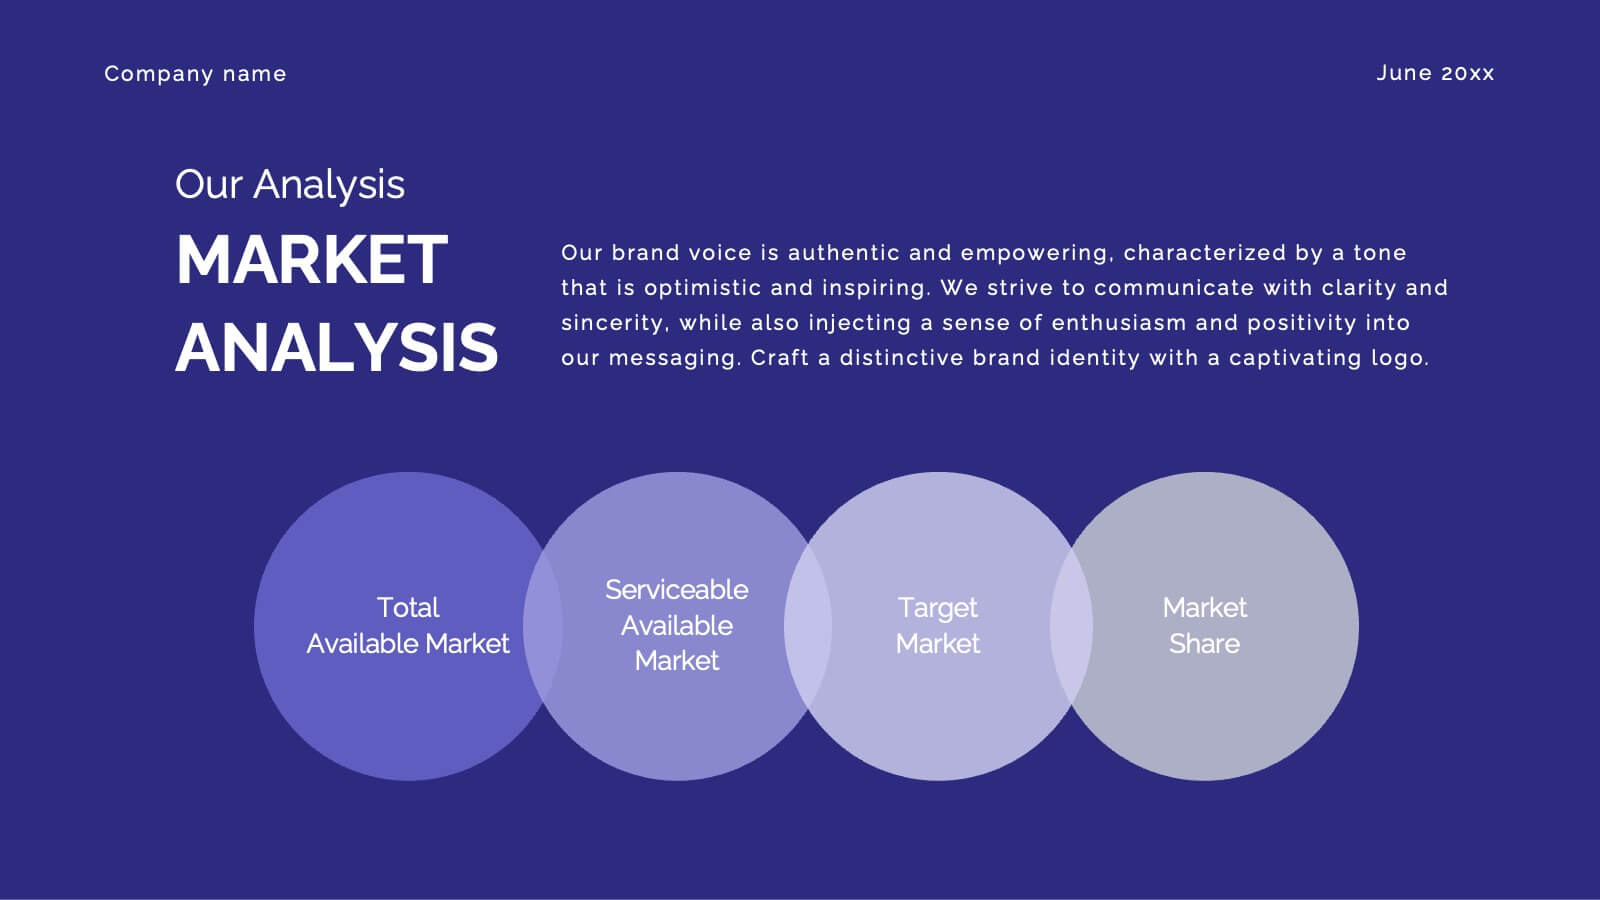
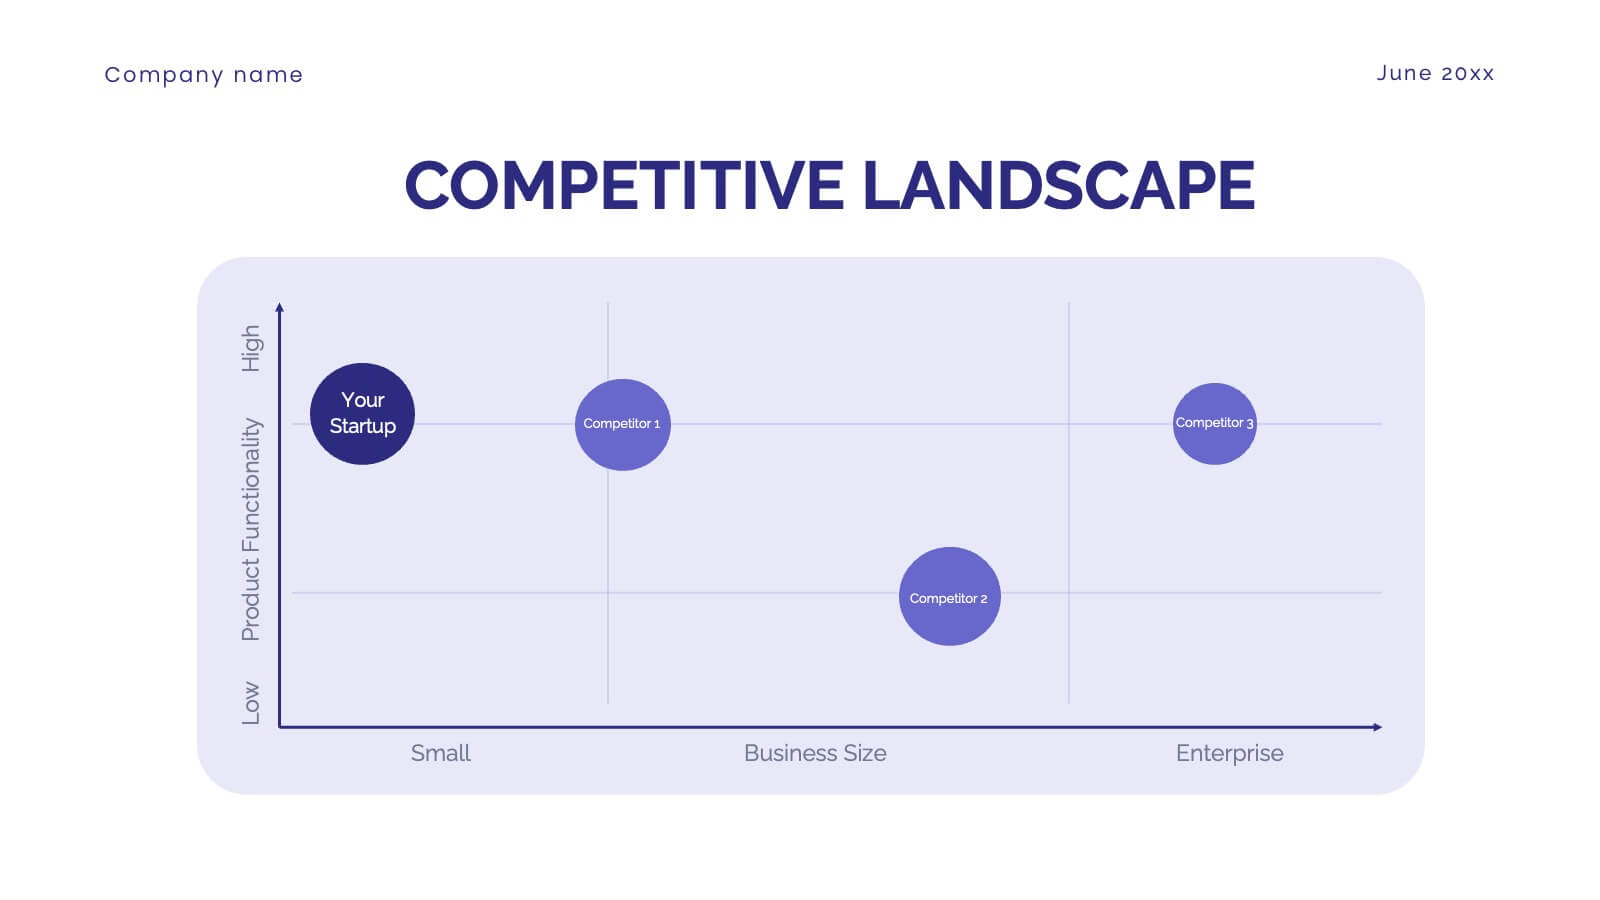
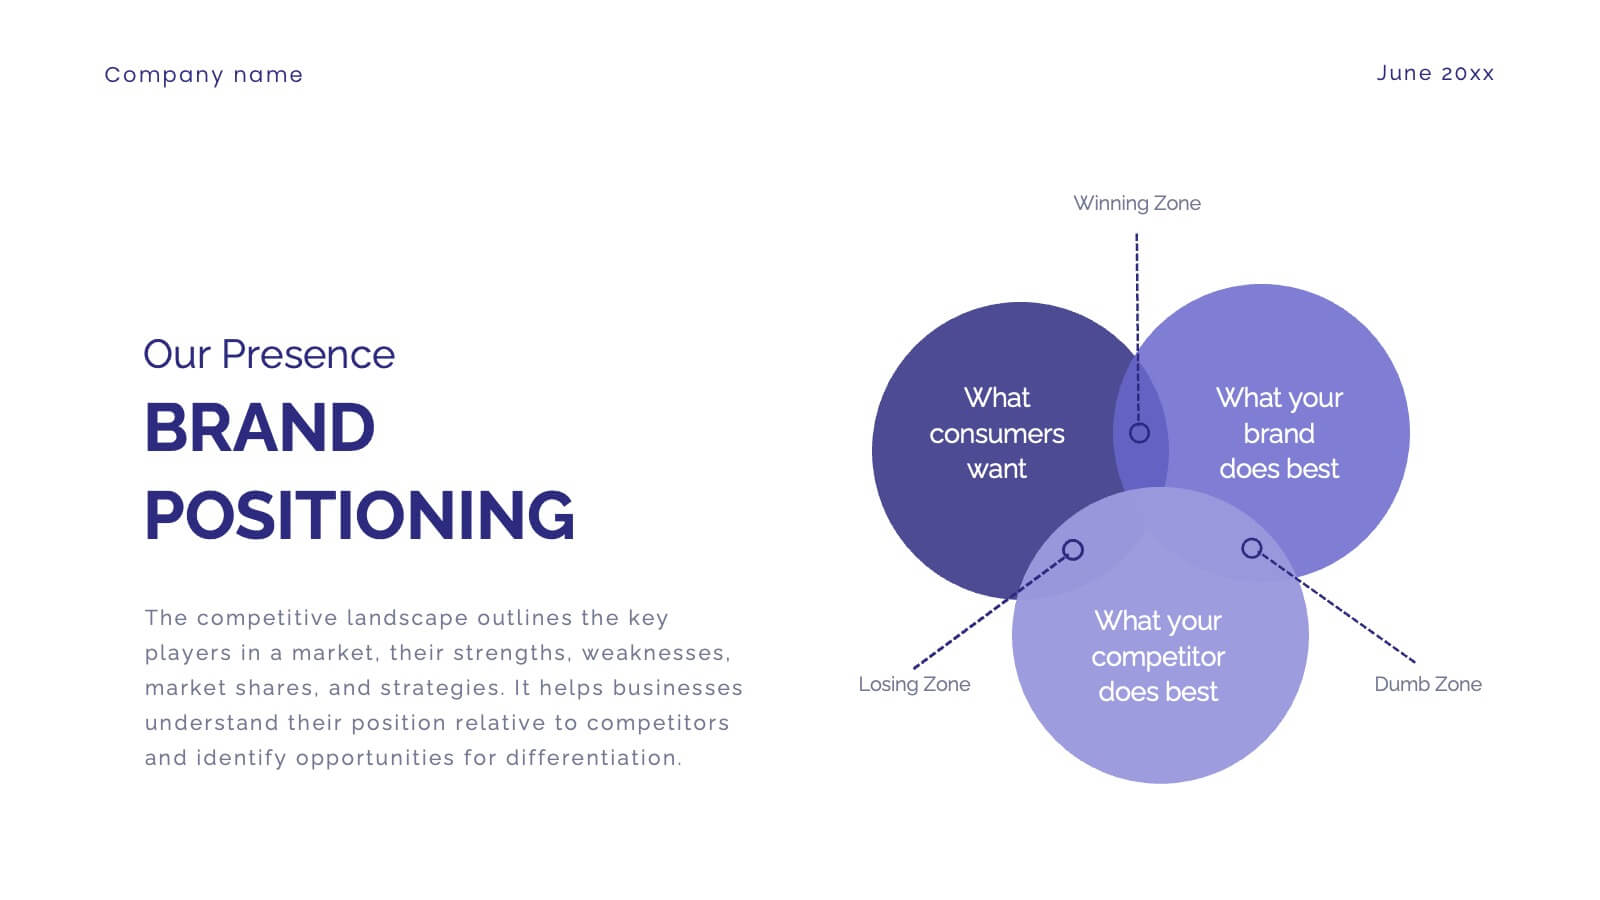
Glimmer Brand Development Pitch Deck Presentation
Elevate your brand with this comprehensive rebranding presentation template! Perfect for detailing your logo, color scheme, and market analysis, it includes slides for brand positioning, competitive landscape, and performance metrics. Engage your audience with clear visuals and structured content. Compatible with PowerPoint, Keynote, and Google Slides for seamless presentations on any platform.


6 slides
Africa Richest Map Infographic
Africa is the world's second-largest and second-most-populous continent, It's a continent full of people, culture, and history. This infographic template is designed to help you inform your audience about everything they need to know about Africa's richest countries. Use this template to inform about Africa's most valuable exports and imports, the percentage of their GDP that is made up of oil revenue, and much more. This infographic map displays information on each country, including population density and economic ranking. This template is fully customizable and compatible with Powerpoint, Keynote, and Google Slides.


4 slides
Visual Decision-Making with Harvey Balls
Make smart decisions faster with this clean and strategic Harvey Balls layout. Ideal for comparing key business factors or project options, this slide helps illustrate progress and priorities through four percentage-based visuals. Fully customizable in PowerPoint, Keynote, and Google Slides.