


Features
- 8 Unique slides
- Fully editable and easy to edit in Microsoft Powerpoint, Keynote and Google Slides
- 16:9 widescreen layout
- Clean and professional designs
- Export to JPG, PDF or send by email


Do you have any questions?
Recommend


6 slides
Customer Empathy Mapping Presentation
Step into your audience’s world with a visual layout that brings their thoughts, feelings, and motivations into focus. This presentation helps teams understand customer needs more clearly, creating stronger products and experiences through structured empathy insights. Fully compatible with PowerPoint, Keynote, and Google Slides.


7 slides
Blue Ocean Strategy Infographic Presentation Template
The Blue Ocean strategy is a highly practical, step-by-step process for leaders to create uncontested market space and make the competition irrelevant. With this template you will be able to identify and capitalize on the growth opportunities your company has been overlooking or avoiding due to industry constraints. Our template is designed to help you identify market opportunities and formulate your strategy to avoid the threat of competition. Use this as a graphic organizer to help you think about how you can best compete in the marketplace. This template is perfect for your next presentation!


5 slides
Real-Time KPI Monitoring Dashboard Presentation
Track performance at a glance with this Real-Time KPI Monitoring Dashboard. This slide includes a clean layout with metrics, charts, and gauges to visualize your top KPIs. Perfect for business reviews, executive updates, and performance reports. Fully editable in PowerPoint, Keynote, and Google Slides for fast customization.


7 slides
Aviation Infographic Presentation Template
Featuring our light, vibrant and eye-catching aviation infographic template compatible with PowerPoint. The theme is designed to show you the key facts and figures about your topic, so you can easily produce a stunning presentation. This infographic is a visual representation of information related to aviation, presented in a clear and visually appealing way. With this template cover topics such as aviation history or the economic impact of the aviation industry. The information in the template can be in the form of statistics, data visualizations, timelines, maps, or other graphical elements.


7 slides
Annual Report Infographics Presentation Template
Annual reports are comprehensive documents designed to provide readers with information about a company's performance in the preceding year with a focus on all major aspects of its operations. They help investors, competitors and other stakeholders understand how well a business is performing. This template is designed to help users produce annual reports for their company. Annual reports provide insights into the company's direction in the preceding year. This template includes many features to make your document as professional as possible and includes various charts and graphs.


21 slides
Ionforge Startup Pitch Deck Presentation
Impress investors and showcase your startup's potential with this structured pitch deck! It covers key areas like market analysis, business model, value proposition, and financial overview, ensuring a complete story of your growth plan. Perfect for startup presentations and funding pitches, this template is fully compatible with PowerPoint, Keynote, and Google Slides.


5 slides
Annual Achievements and Highlights Presentation
Celebrate your progress with the Annual Achievements and Highlights Presentation. This timeline-style layout guides viewers along a visual path of milestones year by year. Each pin represents a key accomplishment, backed by icons and editable text for context. Perfect for end-of-year reviews or company retrospectives. Compatible with PowerPoint, Google Slides, and Canva.


22 slides
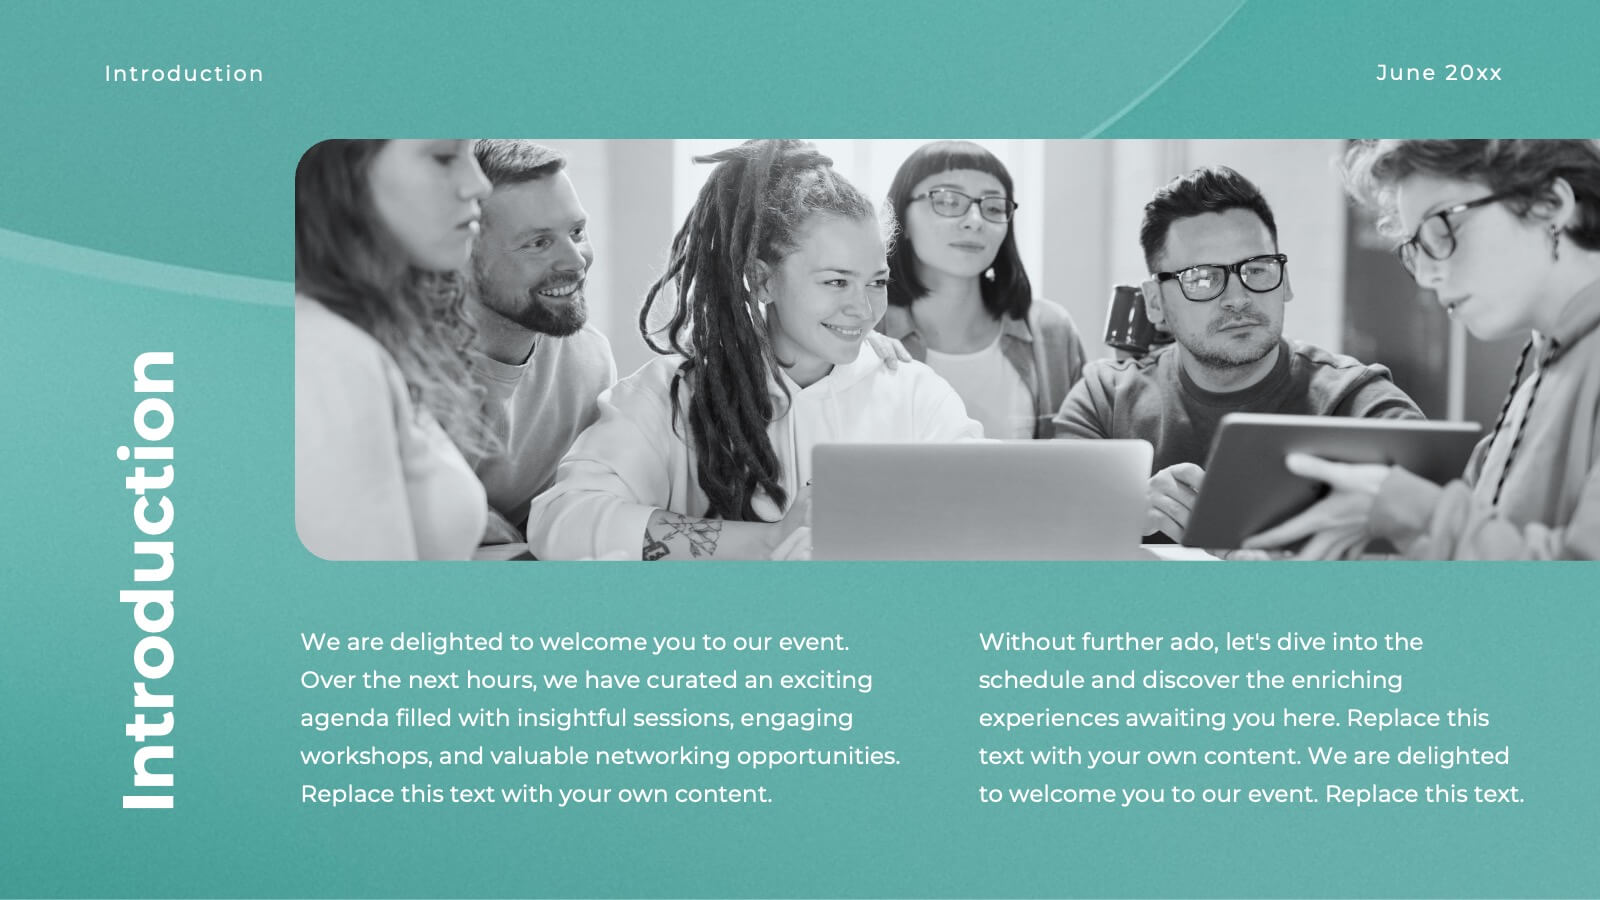
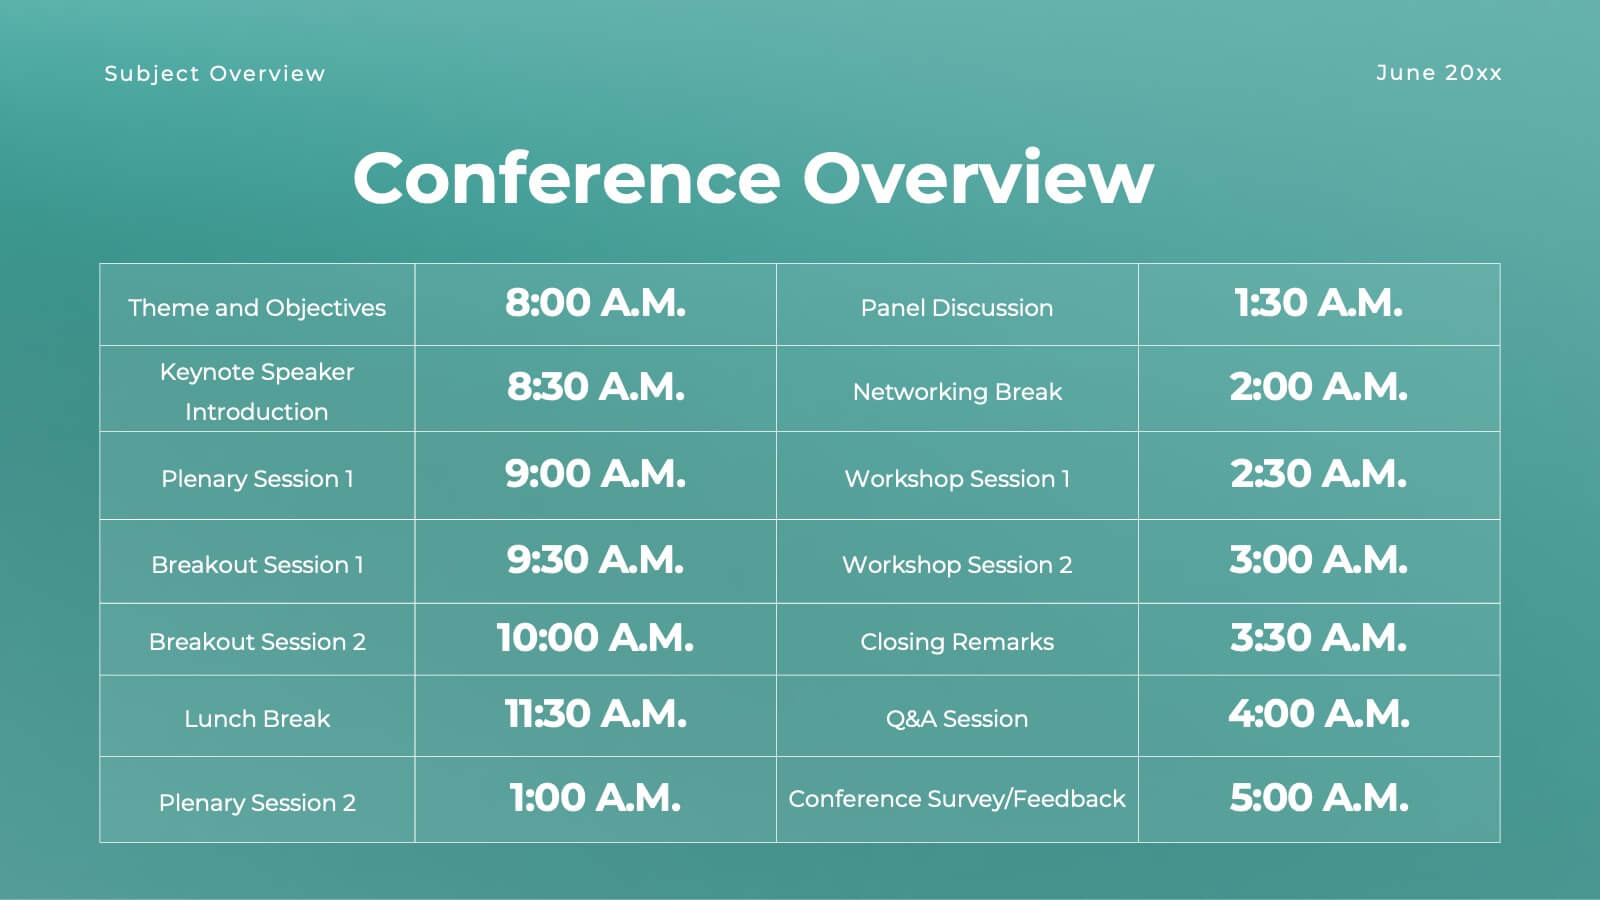
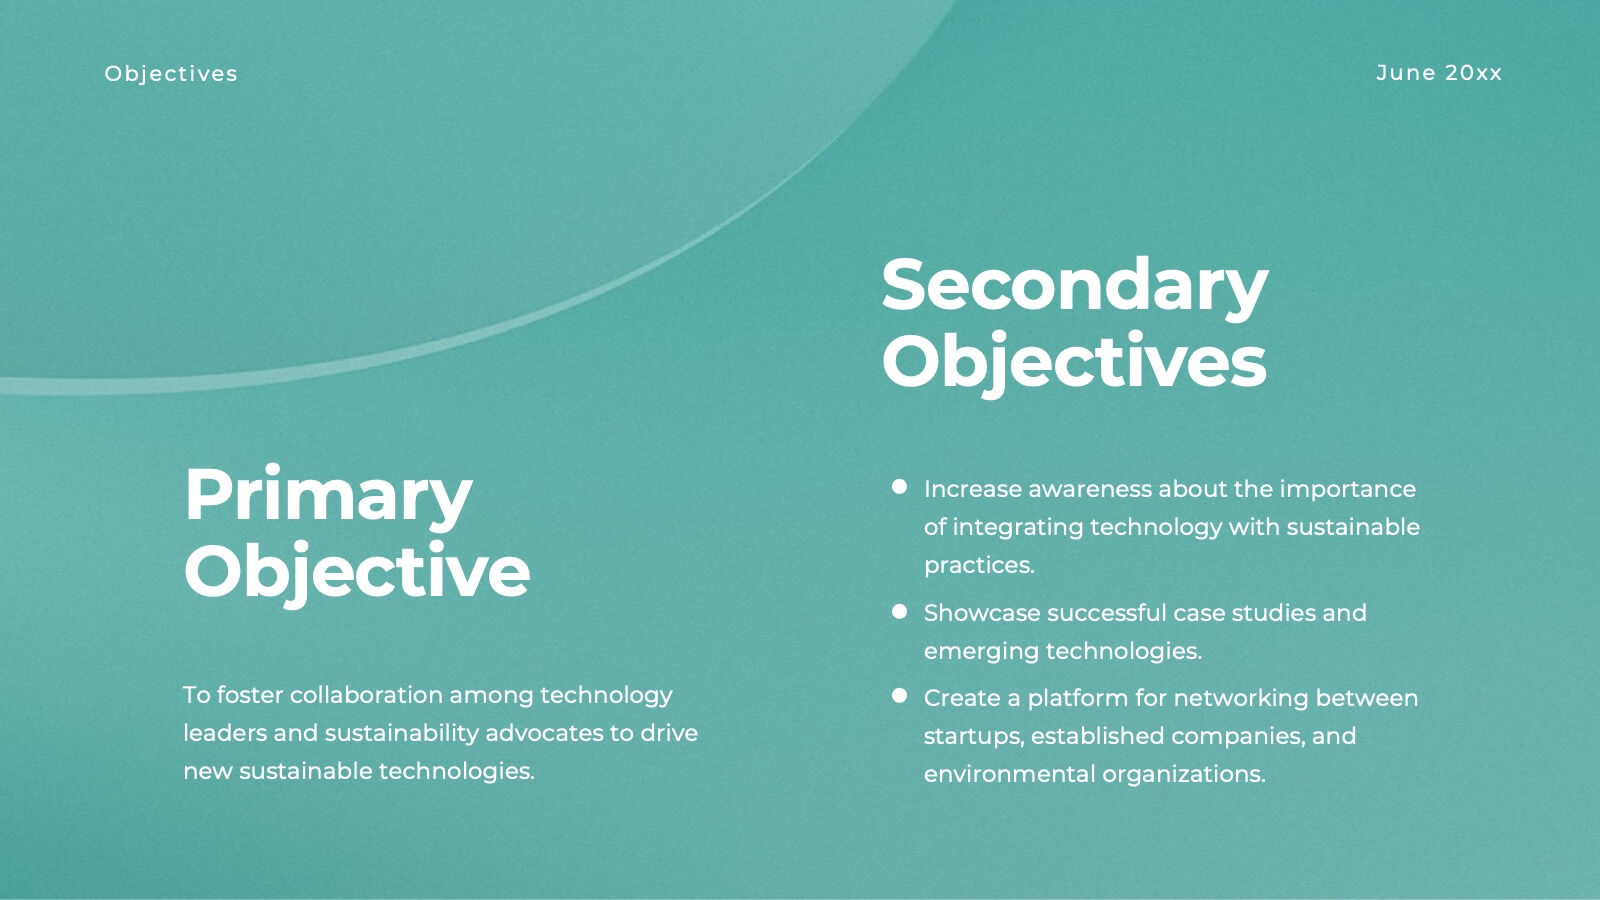
Halo Small Business Pitch Deck Presentation
Streamline your business presentations with this versatile pitch deck template! Ideal for conferences and meetings, it includes slides for objectives, session details, keynote speakers, and panel discussions. Keep your audience engaged with professional design and clear, structured content. Compatible with PowerPoint, Keynote, and Google Slides for seamless presentations on any platform.


5 slides
Elegant Abstract Watercolor Layout Presentation
Add artistic flair to your message with the Elegant Abstract Watercolor Layout Presentation. Featuring hand-drawn brush elements and delicate color drops, this design blends creativity with clarity. Ideal for storytelling, brand values, or conceptual visuals. Fully editable in PowerPoint, Keynote, and Google Slides for stylish and customizable presentations.


8 slides
Health and Safety Training
Create impactful safety briefings with this visual slide designed around a caution-sign layout. Perfect for outlining training modules, compliance steps, or workplace hazard procedures, it presents four key points using icons and color-coded elements. Fully customizable in PowerPoint, Keynote, and Google Slides.


6 slides
Bubble Mapping Strategy Presentation
Turn your ideas into a clear visual roadmap that captures every connection and concept in one glance. This professional presentation helps organize strategies, goals, and processes through an easy-to-follow bubble map layout. Fully customizable and compatible with PowerPoint, Keynote, and Google Slides for seamless editing and presentation.


12 slides
Corporate Sustainability Strategy Presentation
Achieve your sustainability goals with the Corporate Sustainability Strategy Presentation template. This modern, visually engaging layout helps businesses showcase their environmental, social, and governance (ESG) initiatives, sustainability roadmaps, and corporate responsibility plans. Featuring clear, structured sections, this fully customizable design is perfect for corporate leaders, consultants, and eco-conscious organizations. Compatible with PowerPoint, Keynote, and Google Slides for effortless editing and presentation.


7 slides
Hierarchy Infographic Presentation Template
This Hierarchy infographic template presents information in a hierarchical format and makes it easy to see the most important pieces of information without having to read through all of your content. Use this template as a starting point to create an effective hierarchy chart by copying and pasting the template into PowerPoint. It features an assortment of color schemes and styles that can be customized. Our hierarchy infographic template will help you build an amazing presentation. This isn't just an ordinary Infographic template, it features a design that will stand out in the crowd!


21 slides
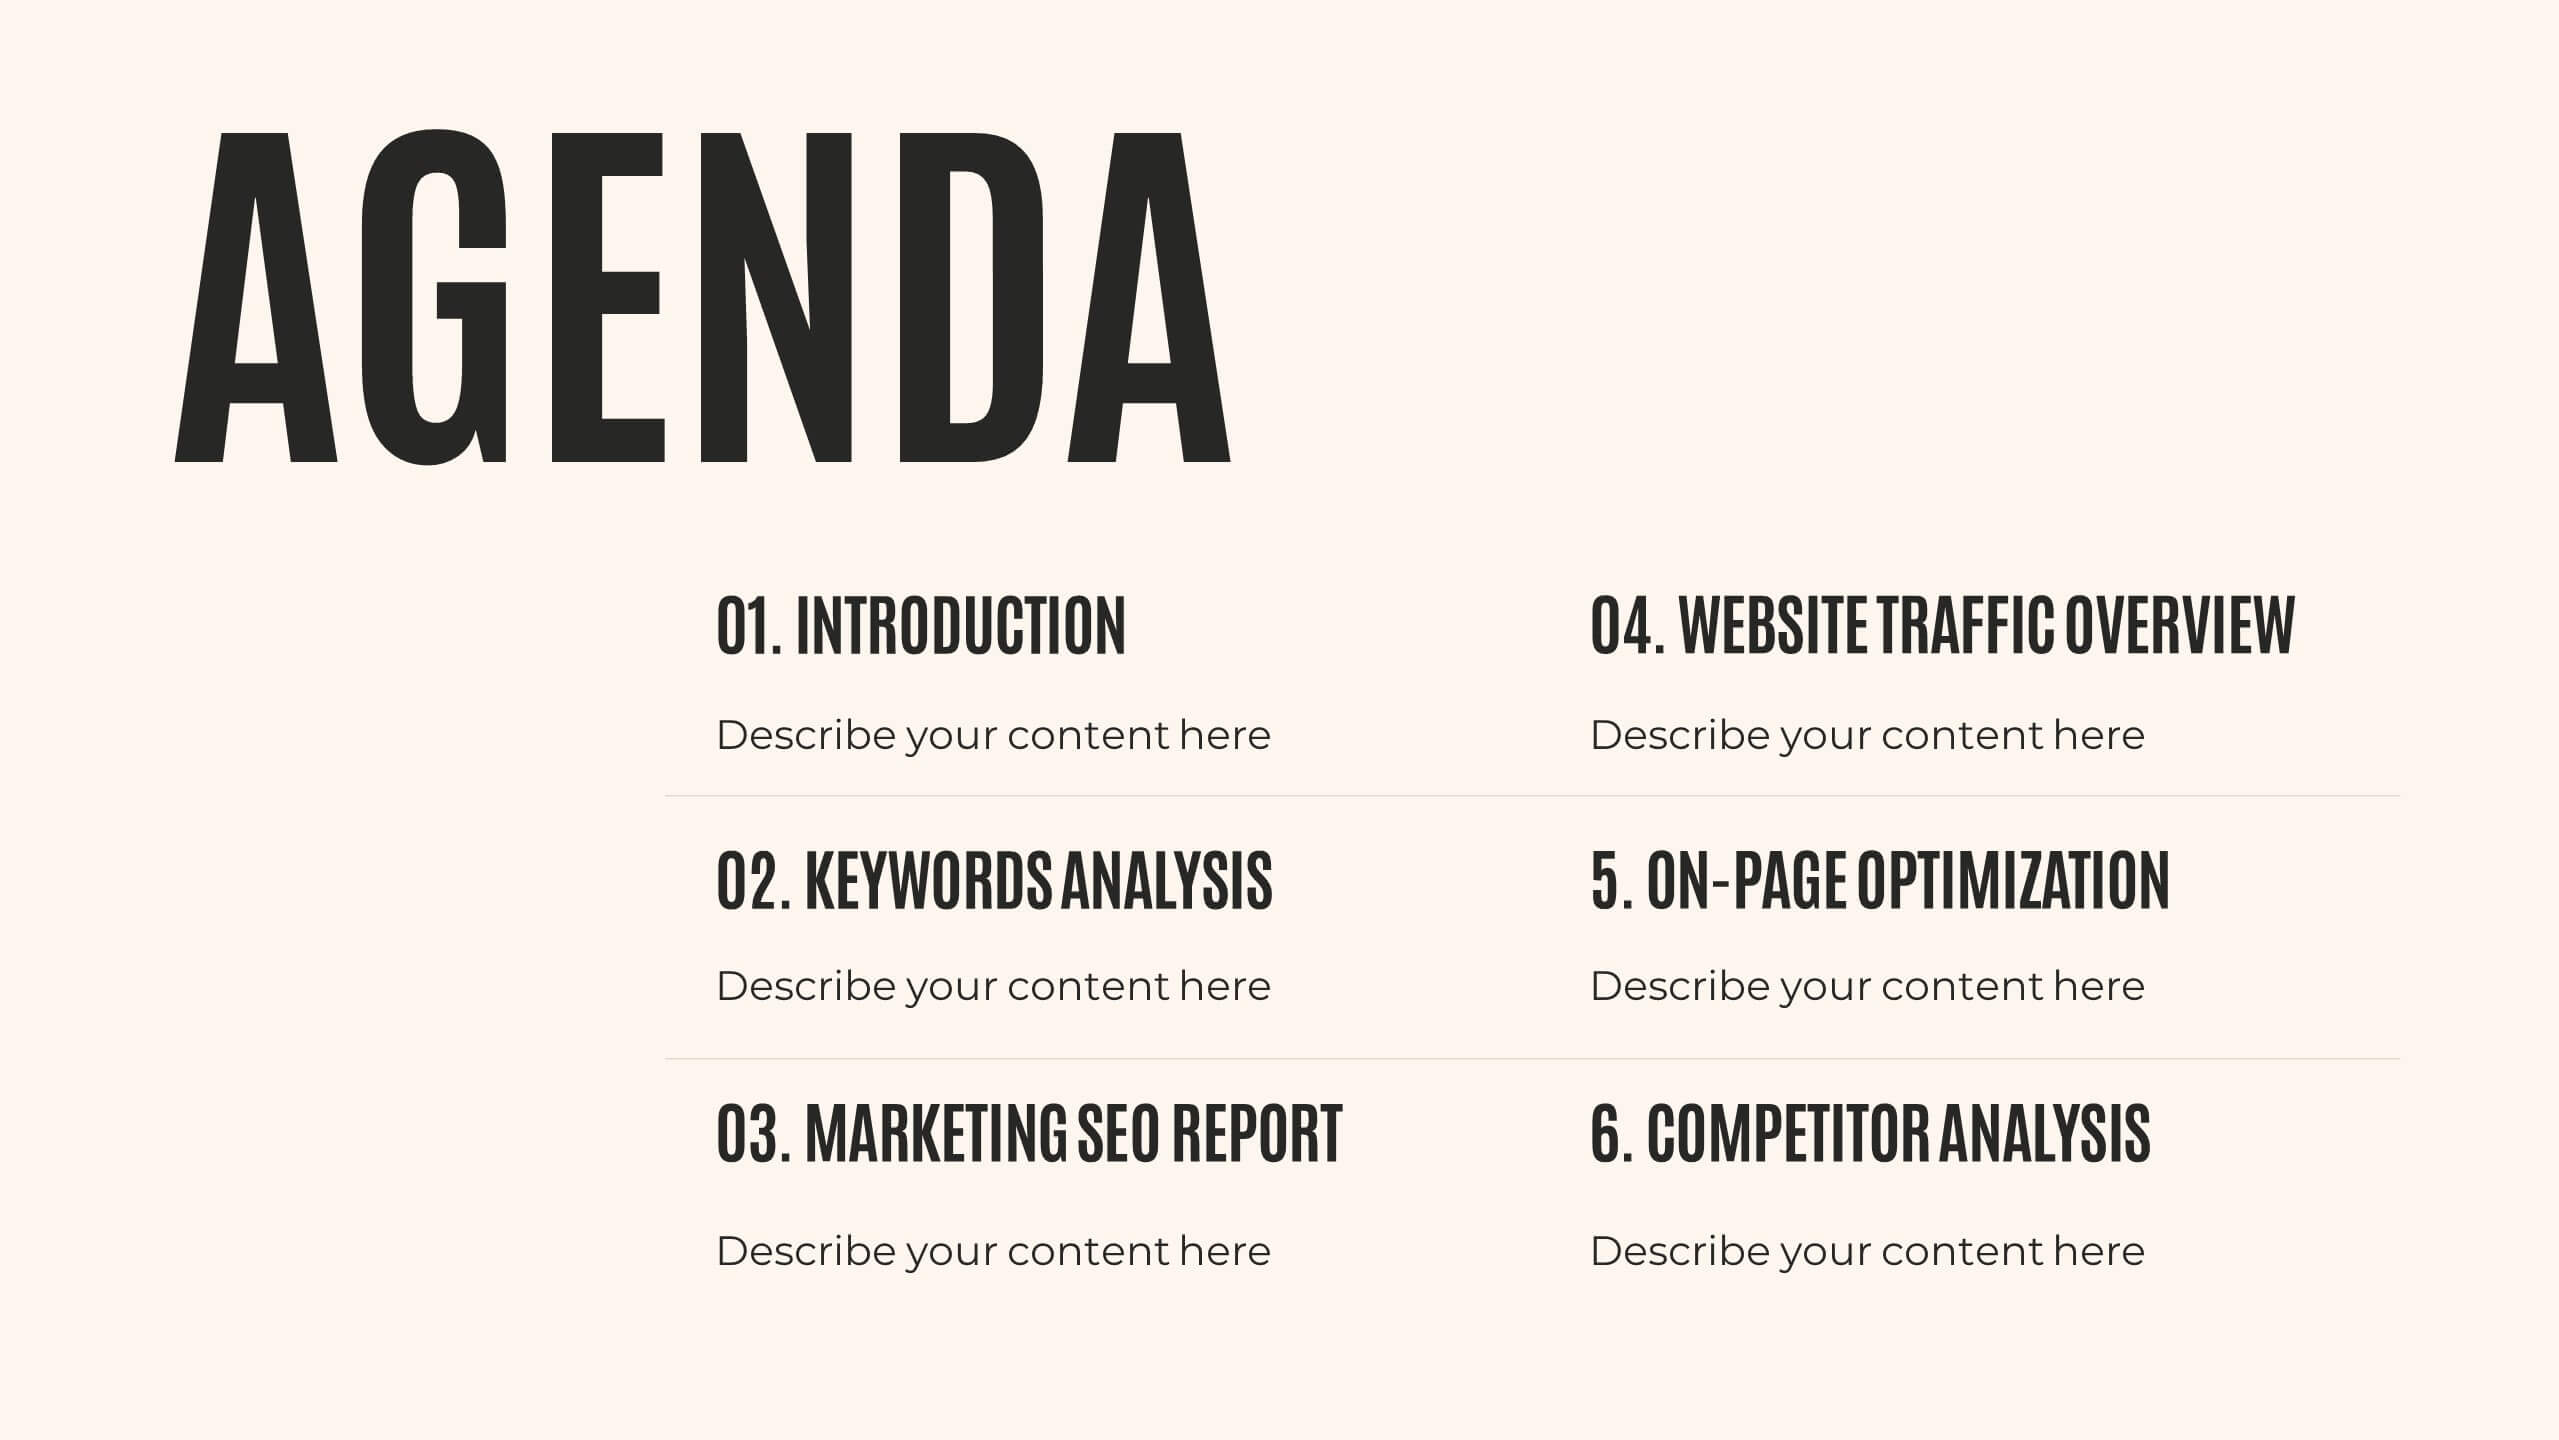
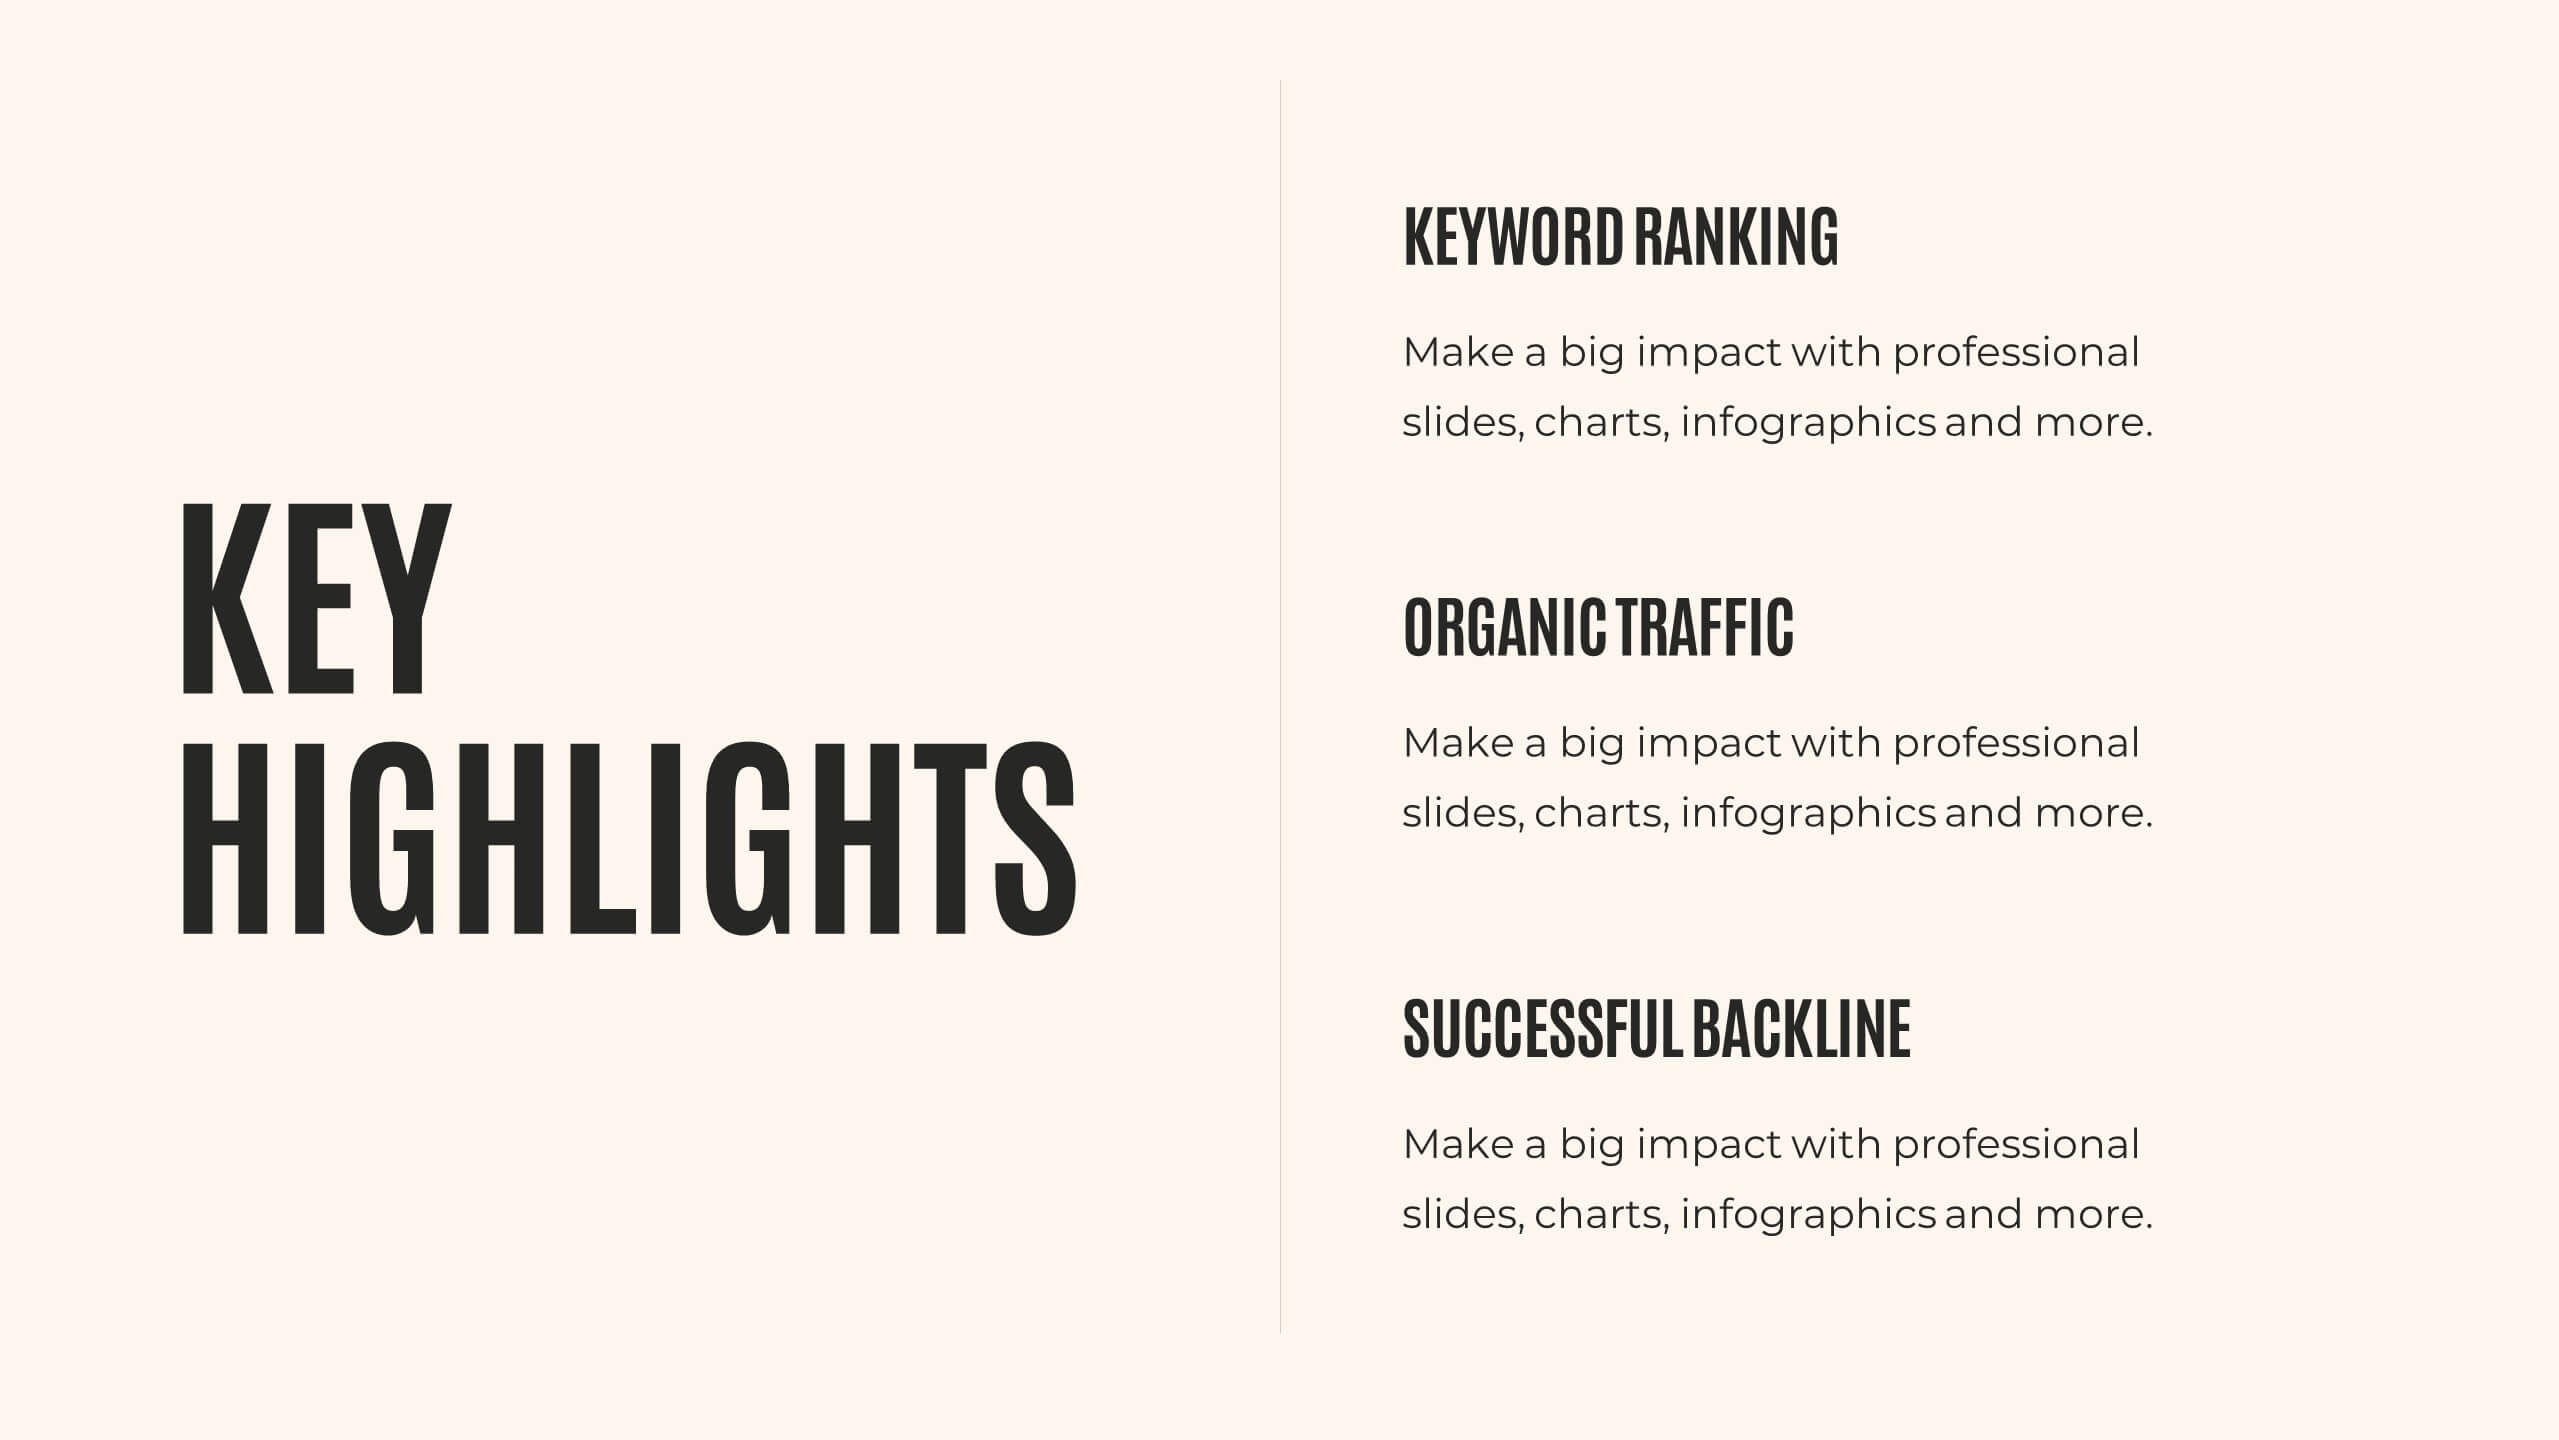
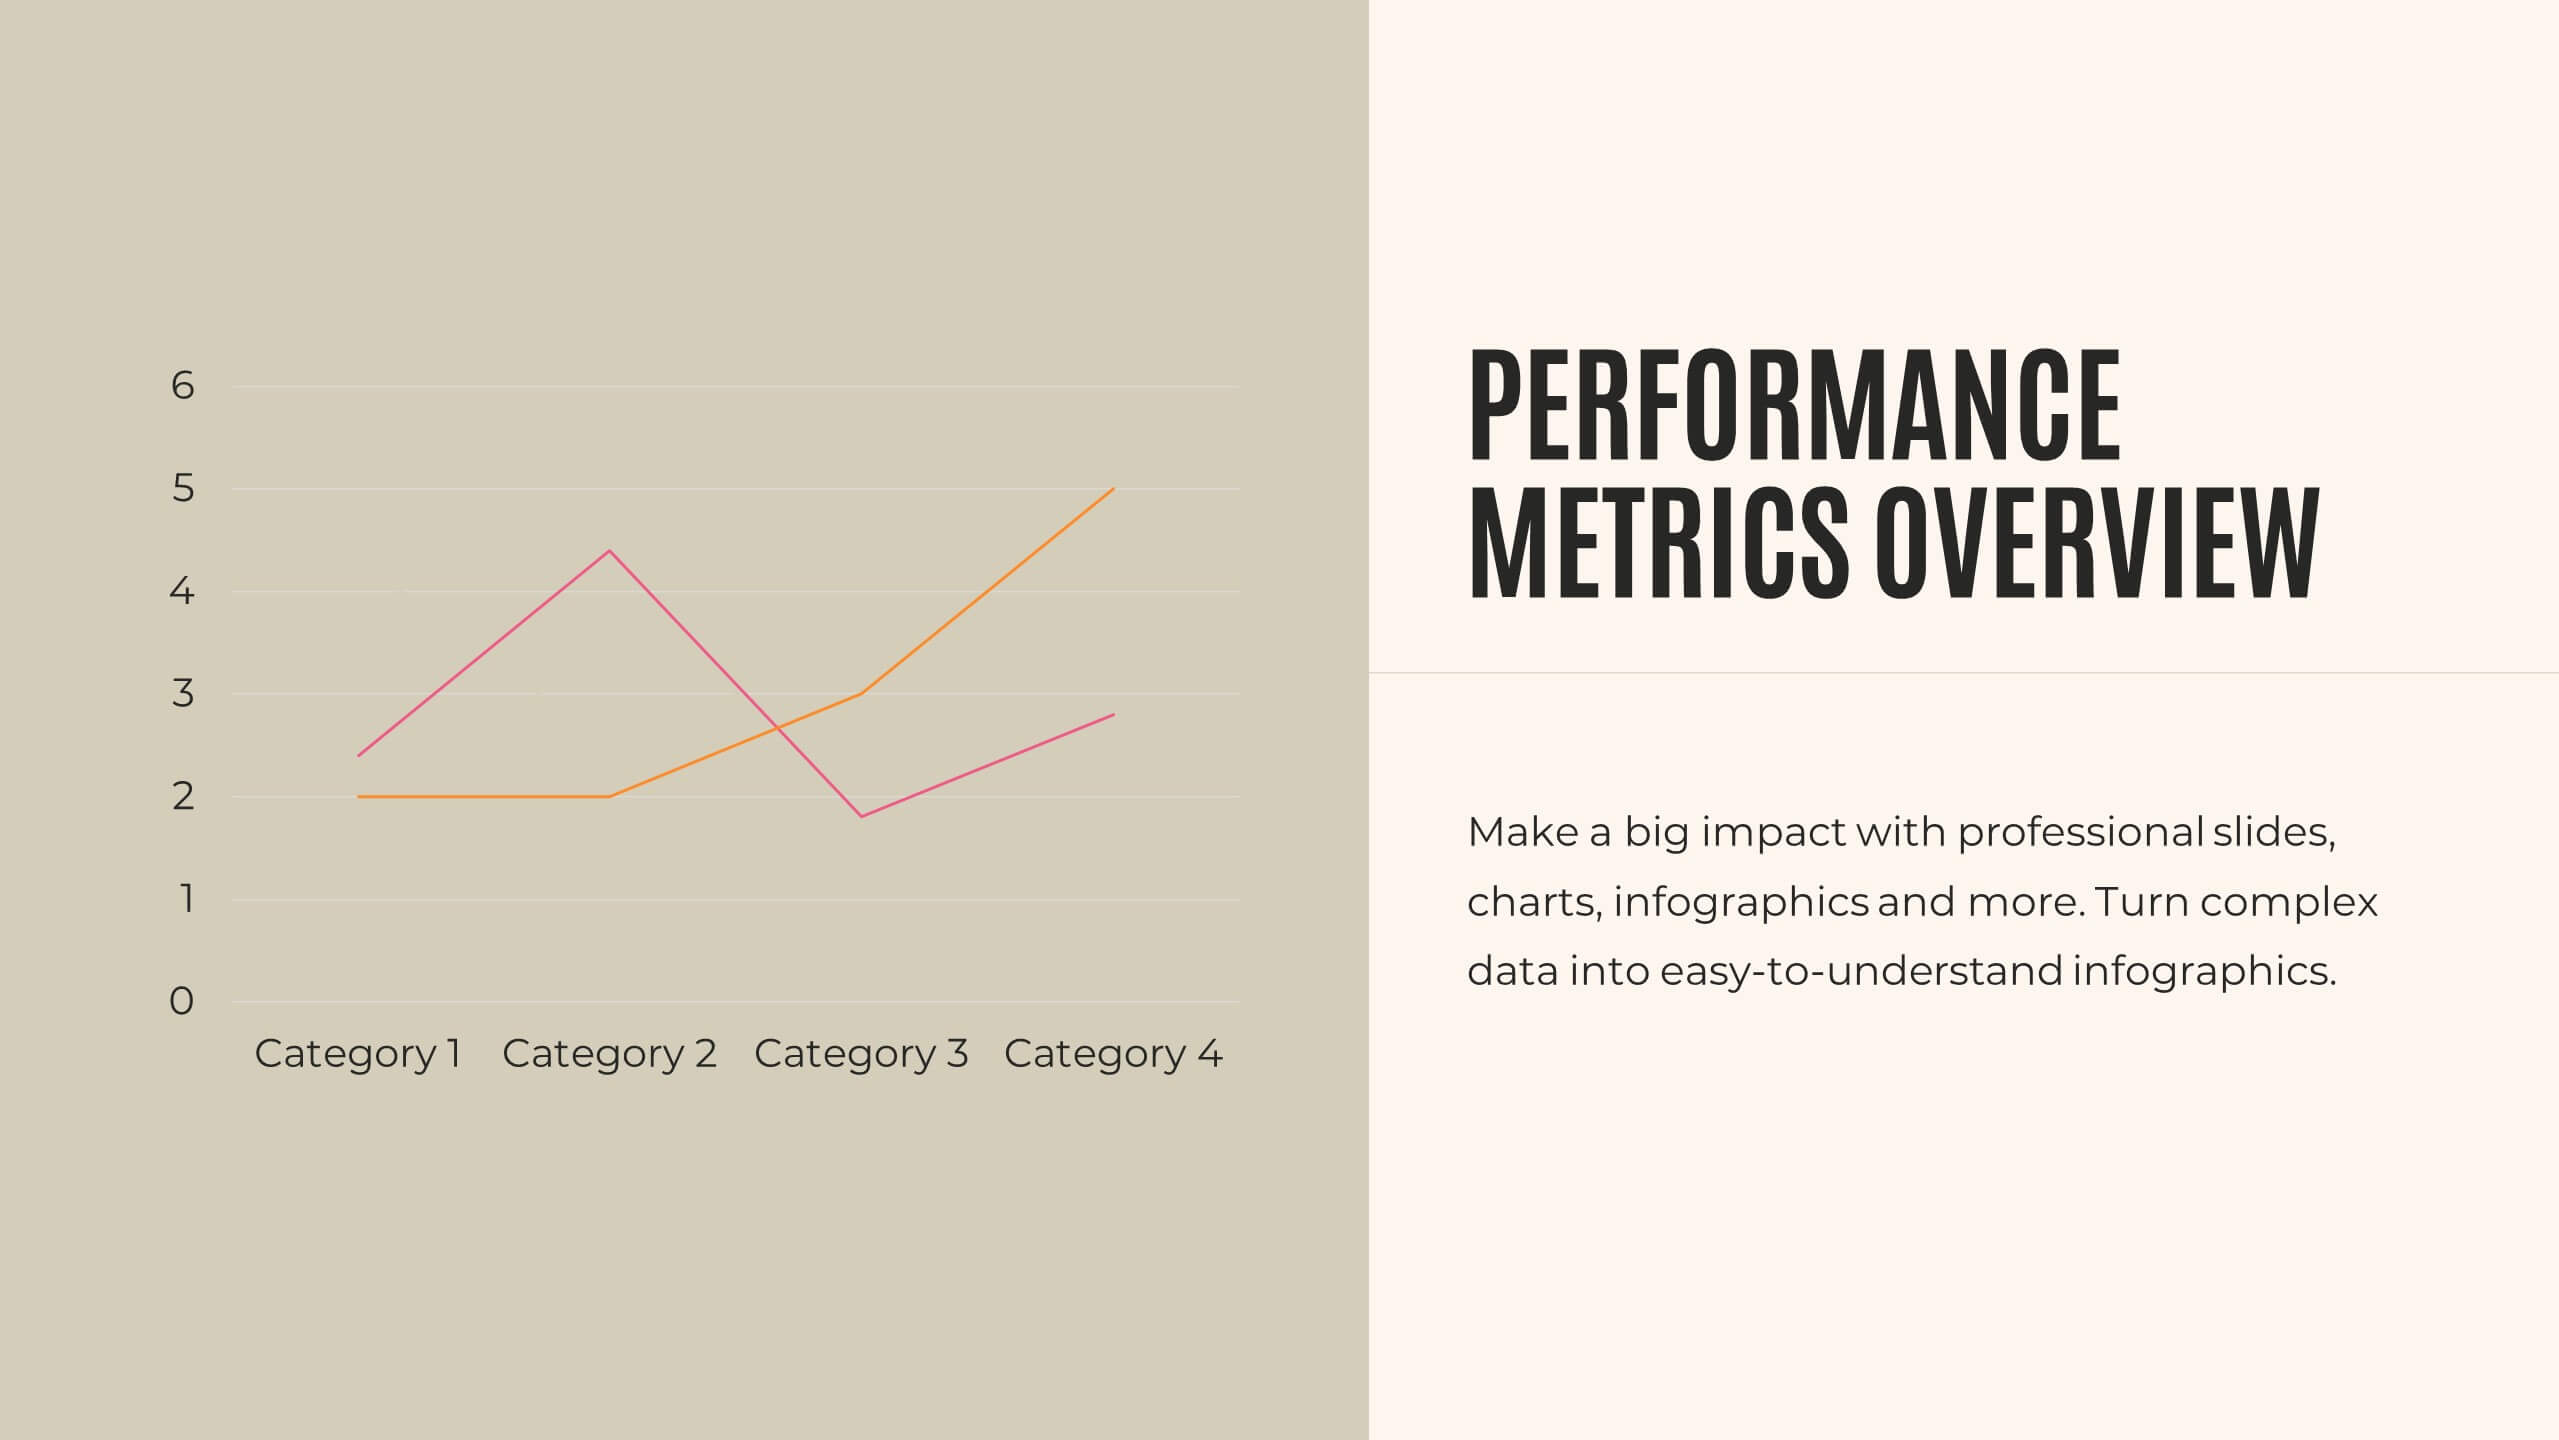
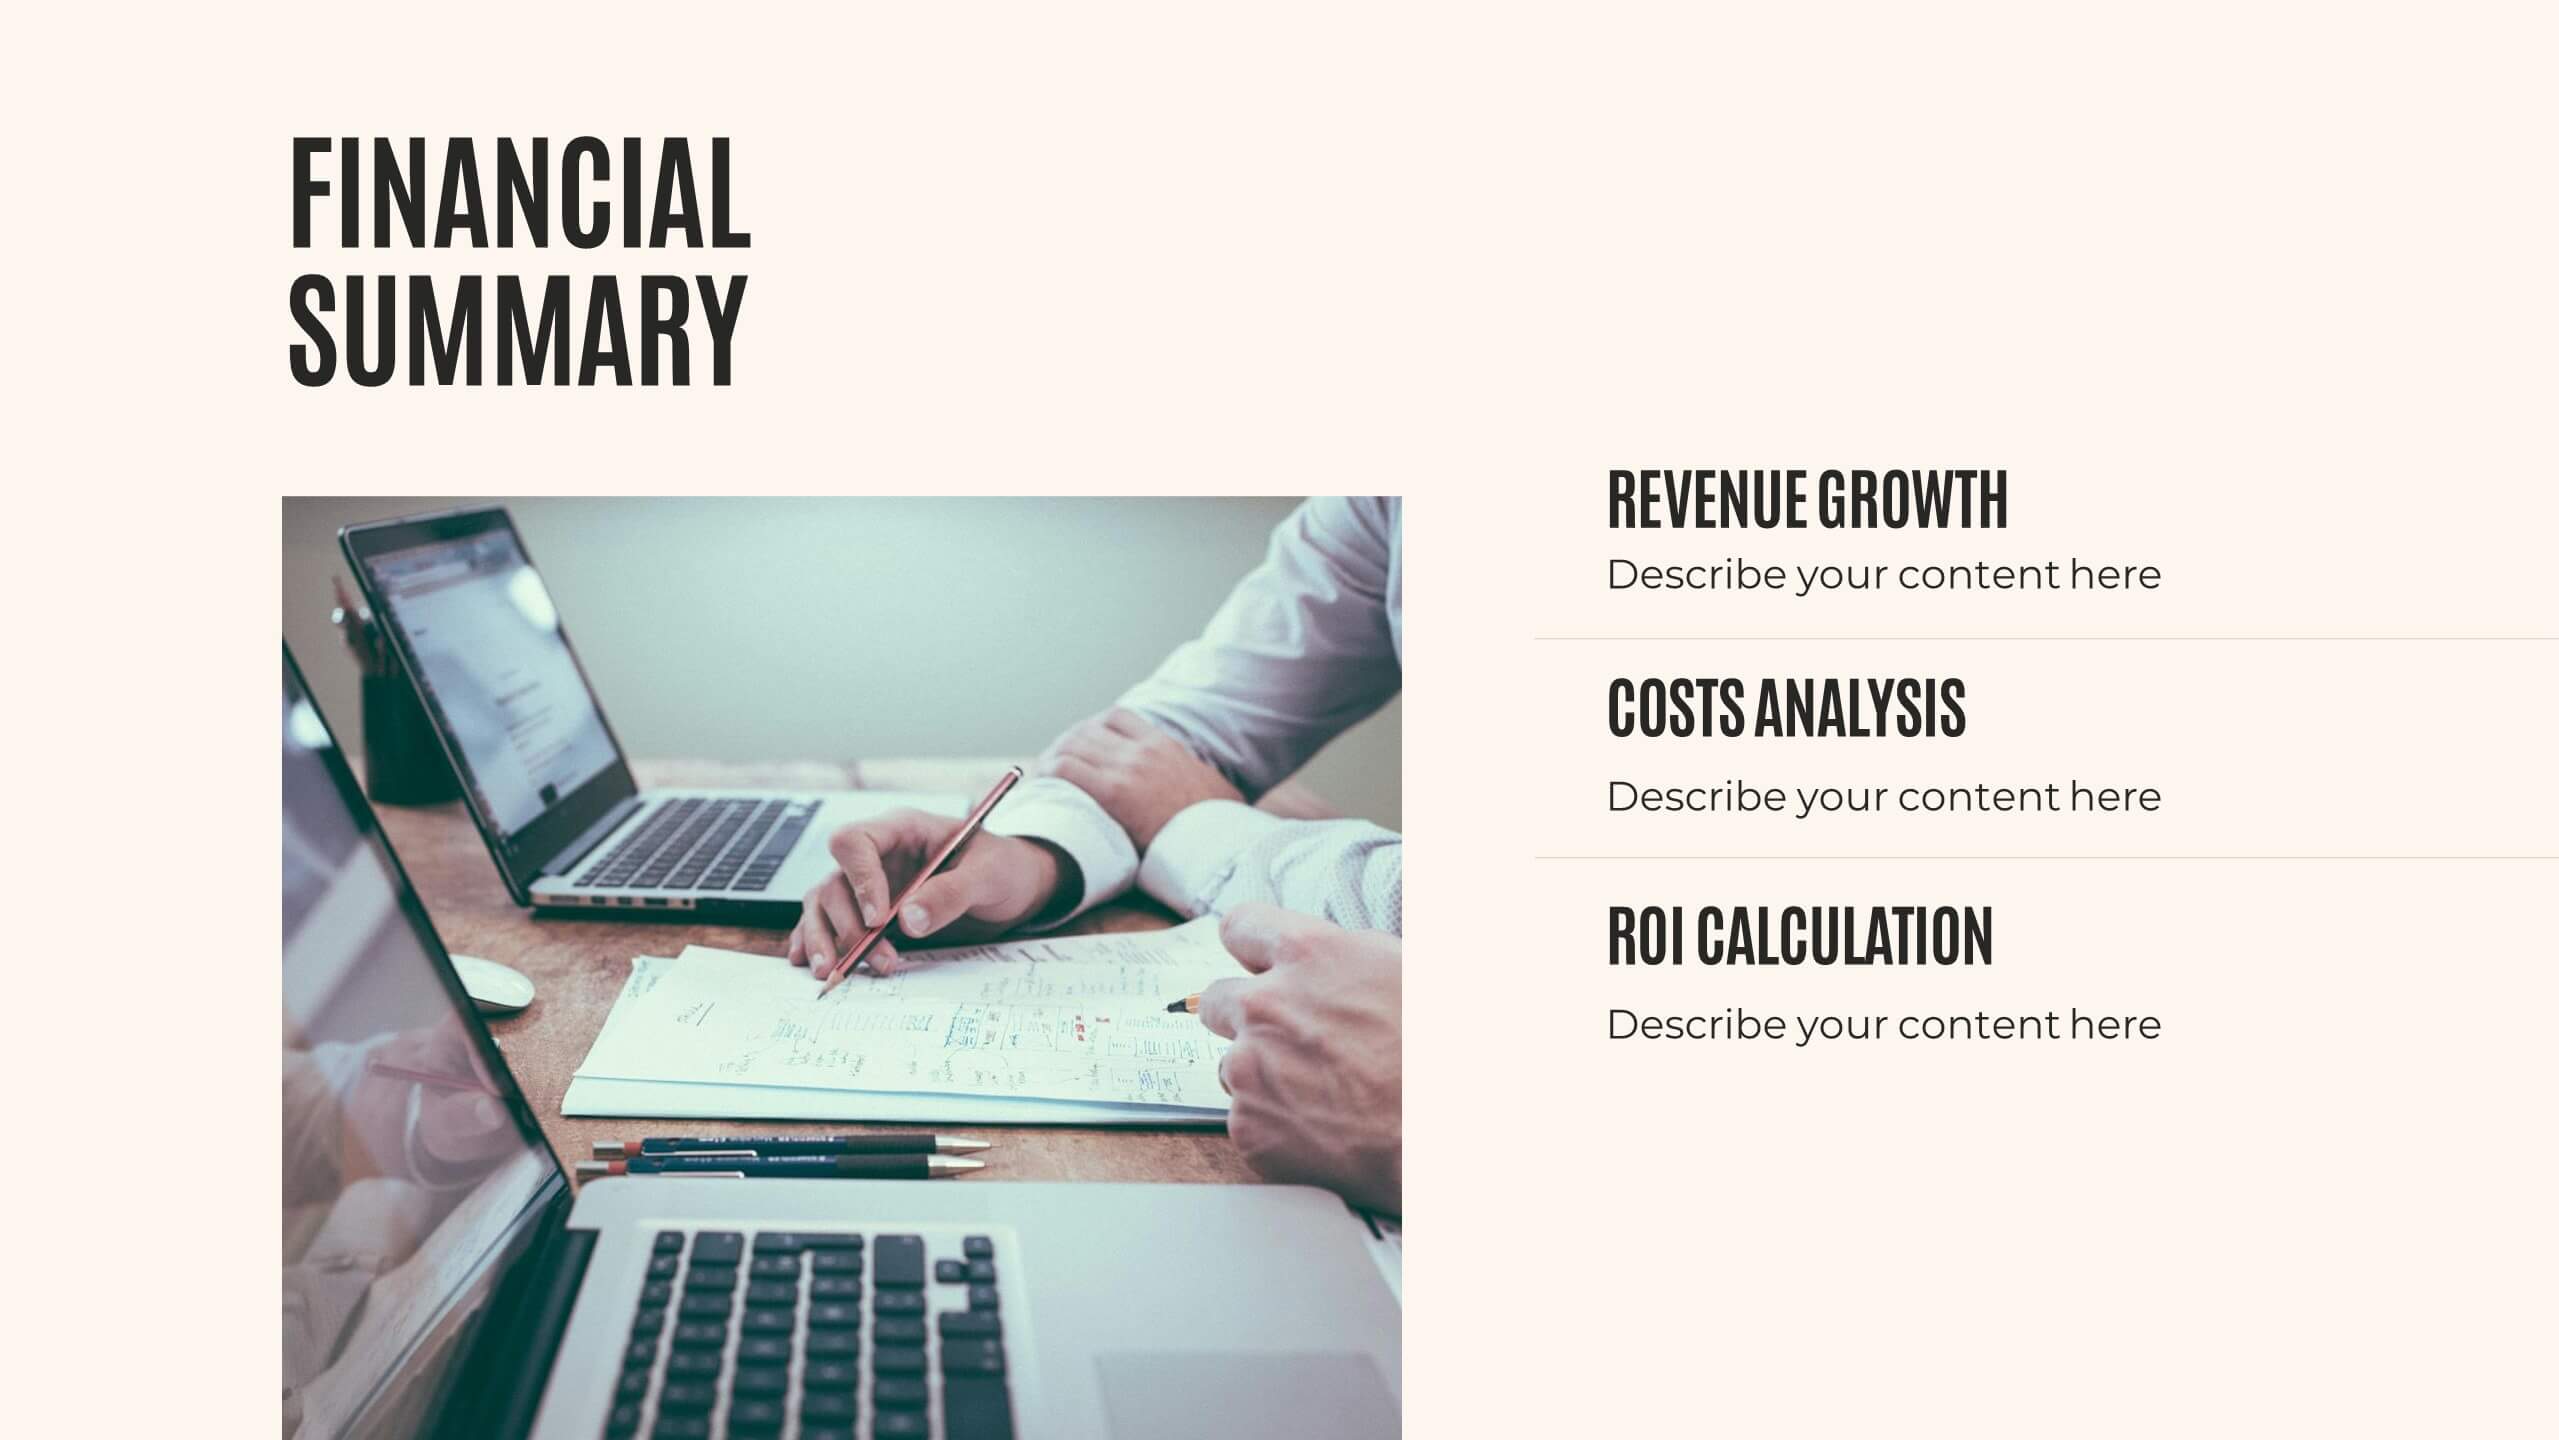
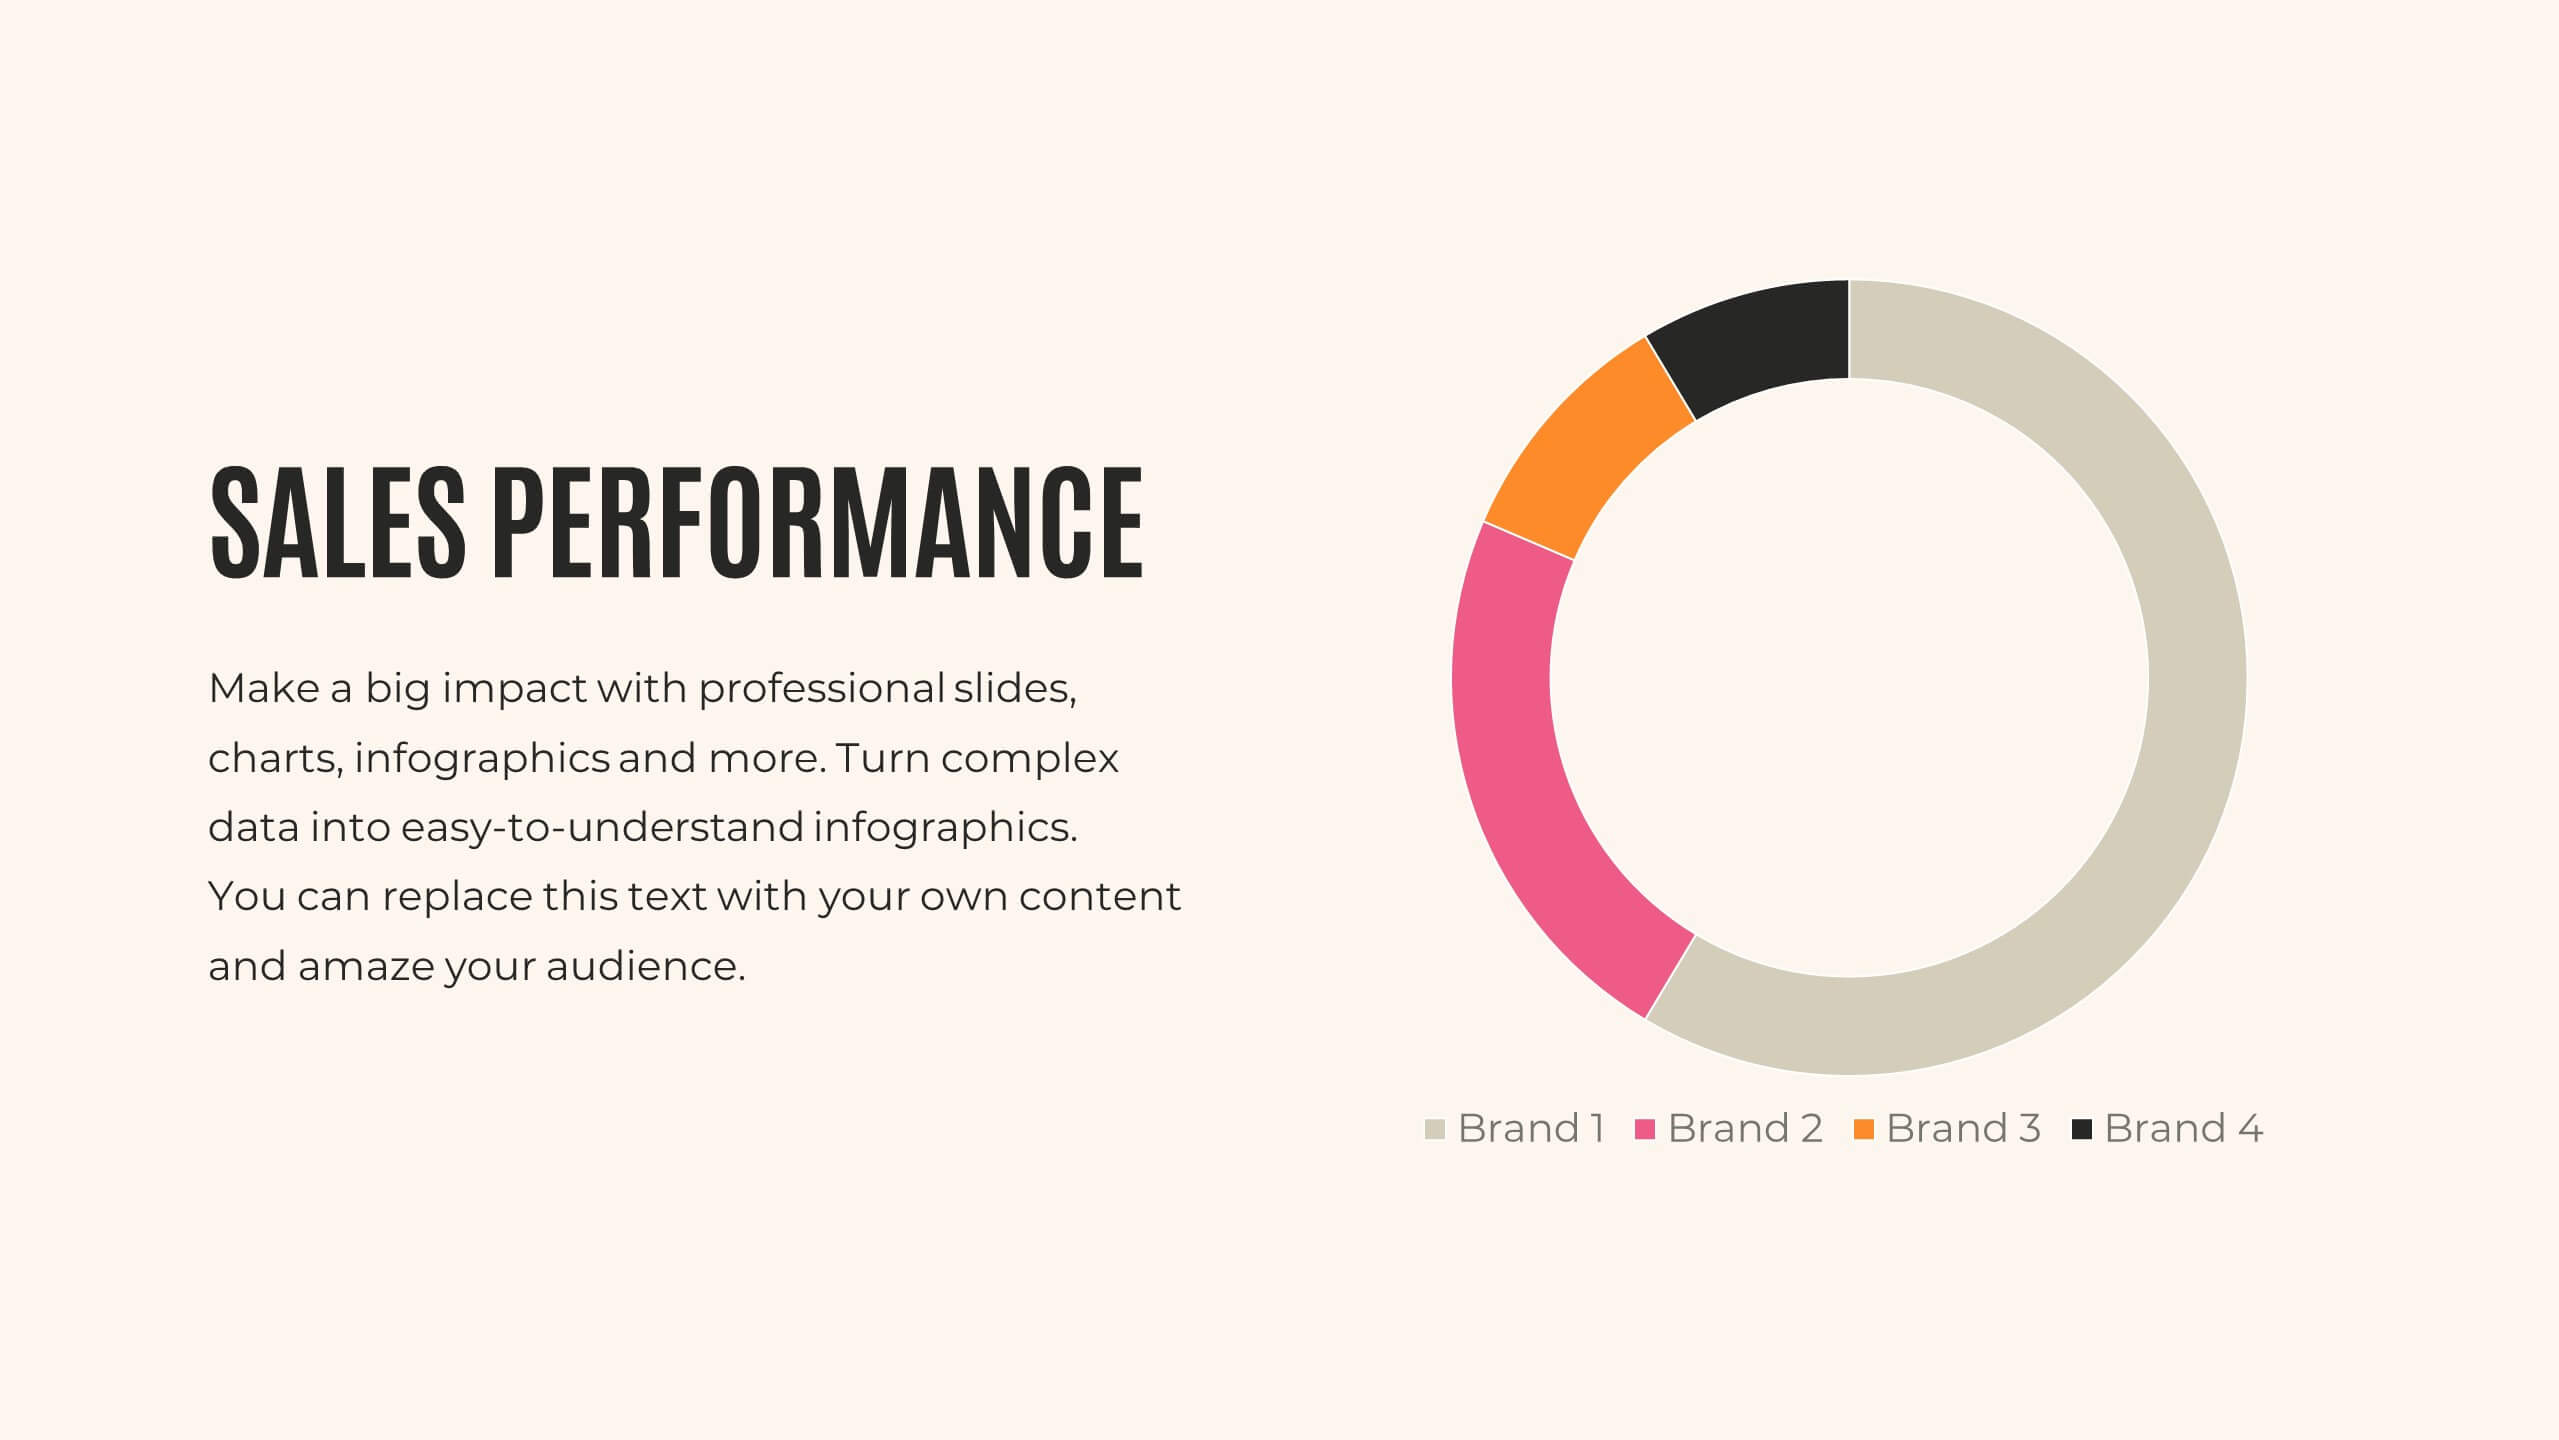
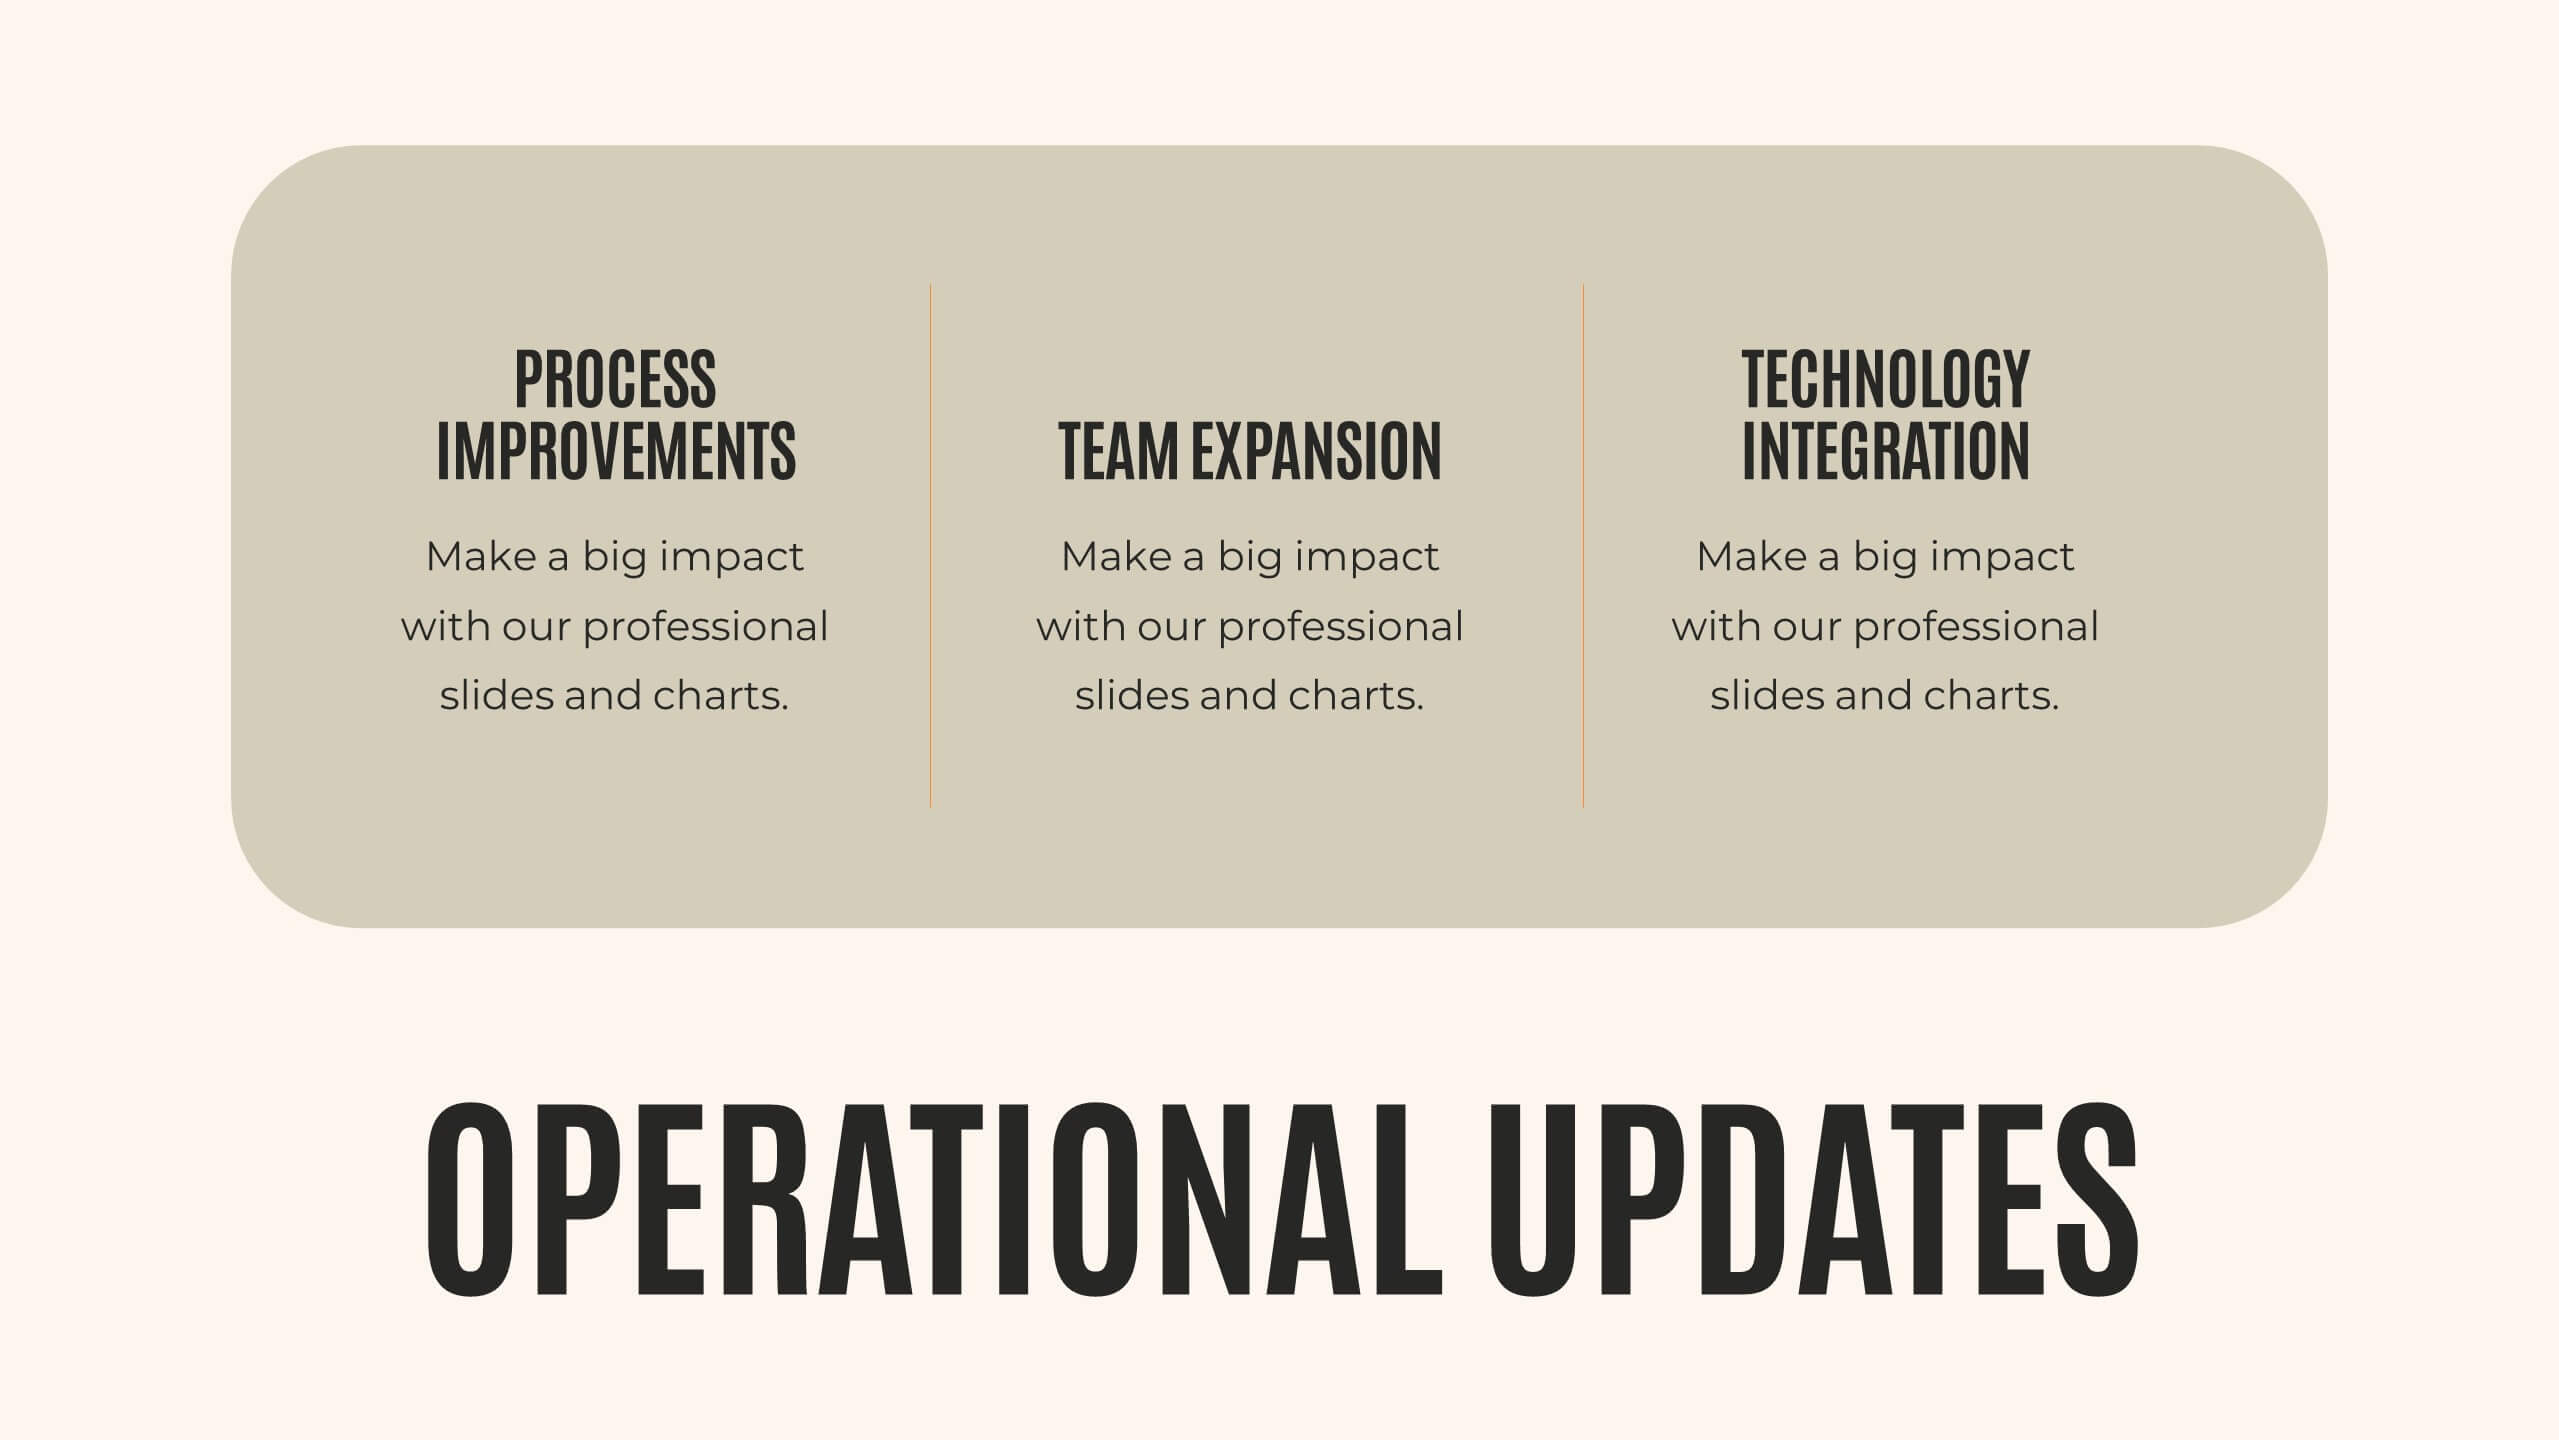
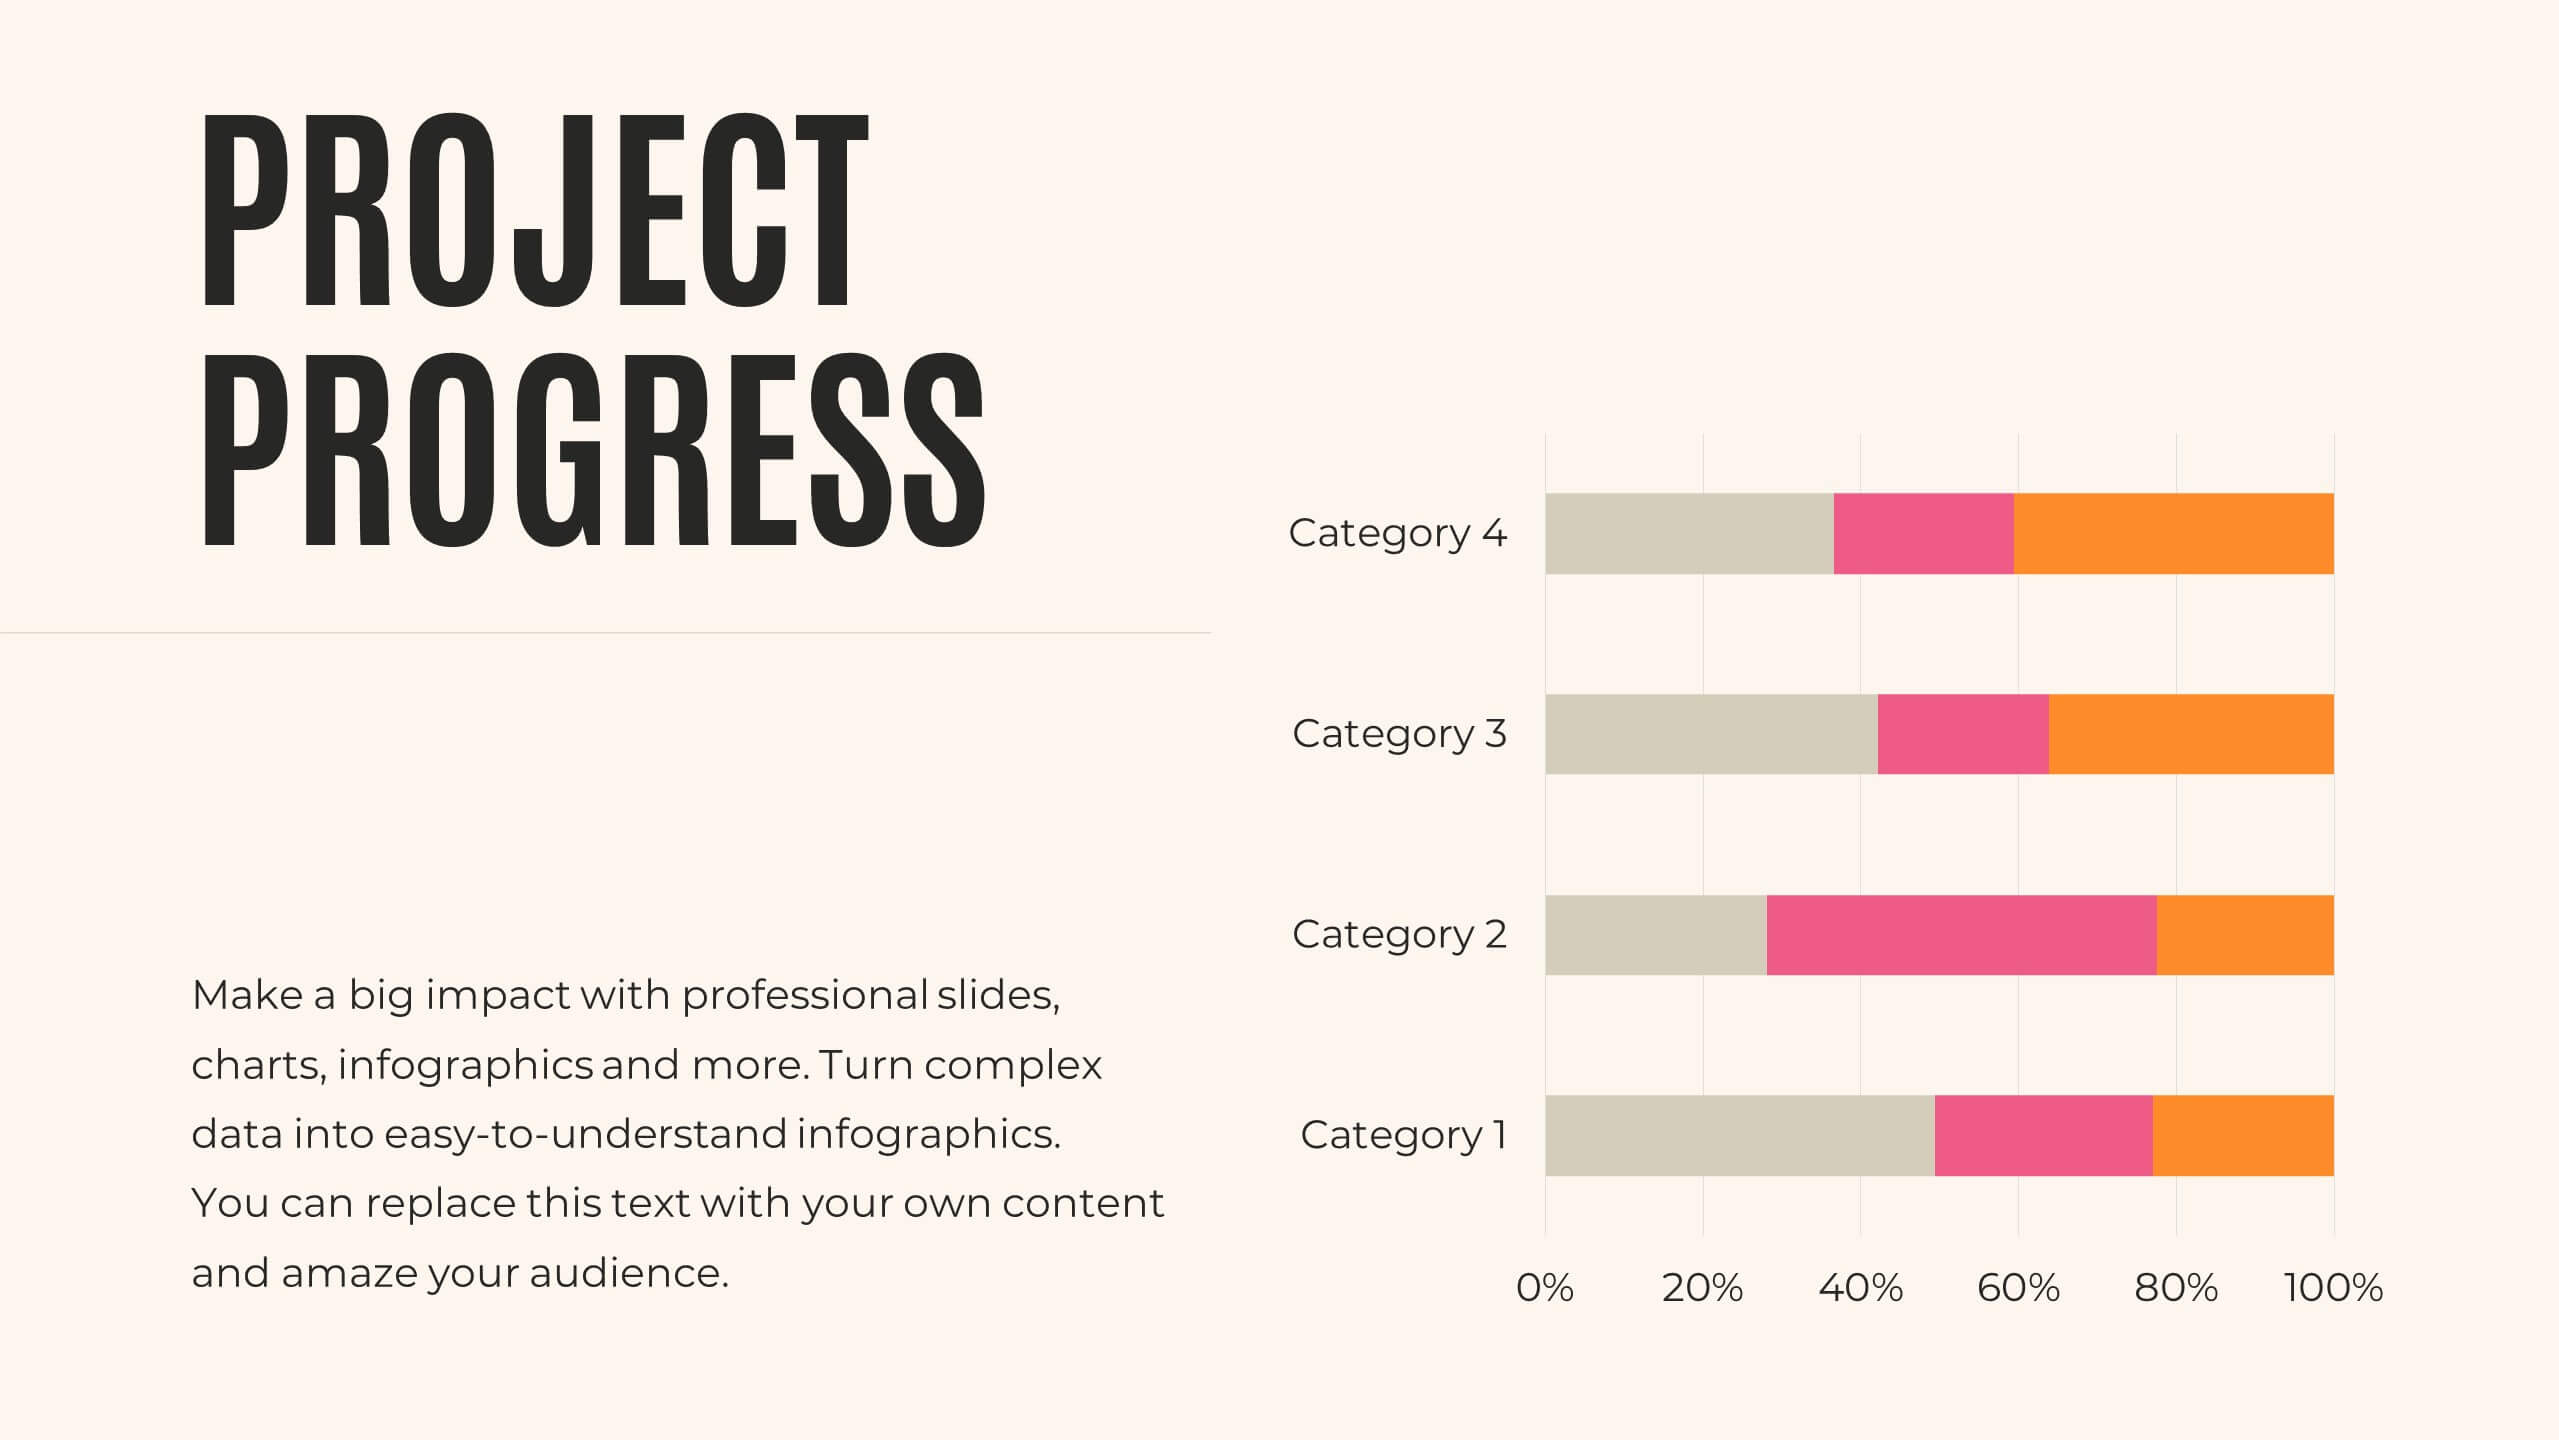
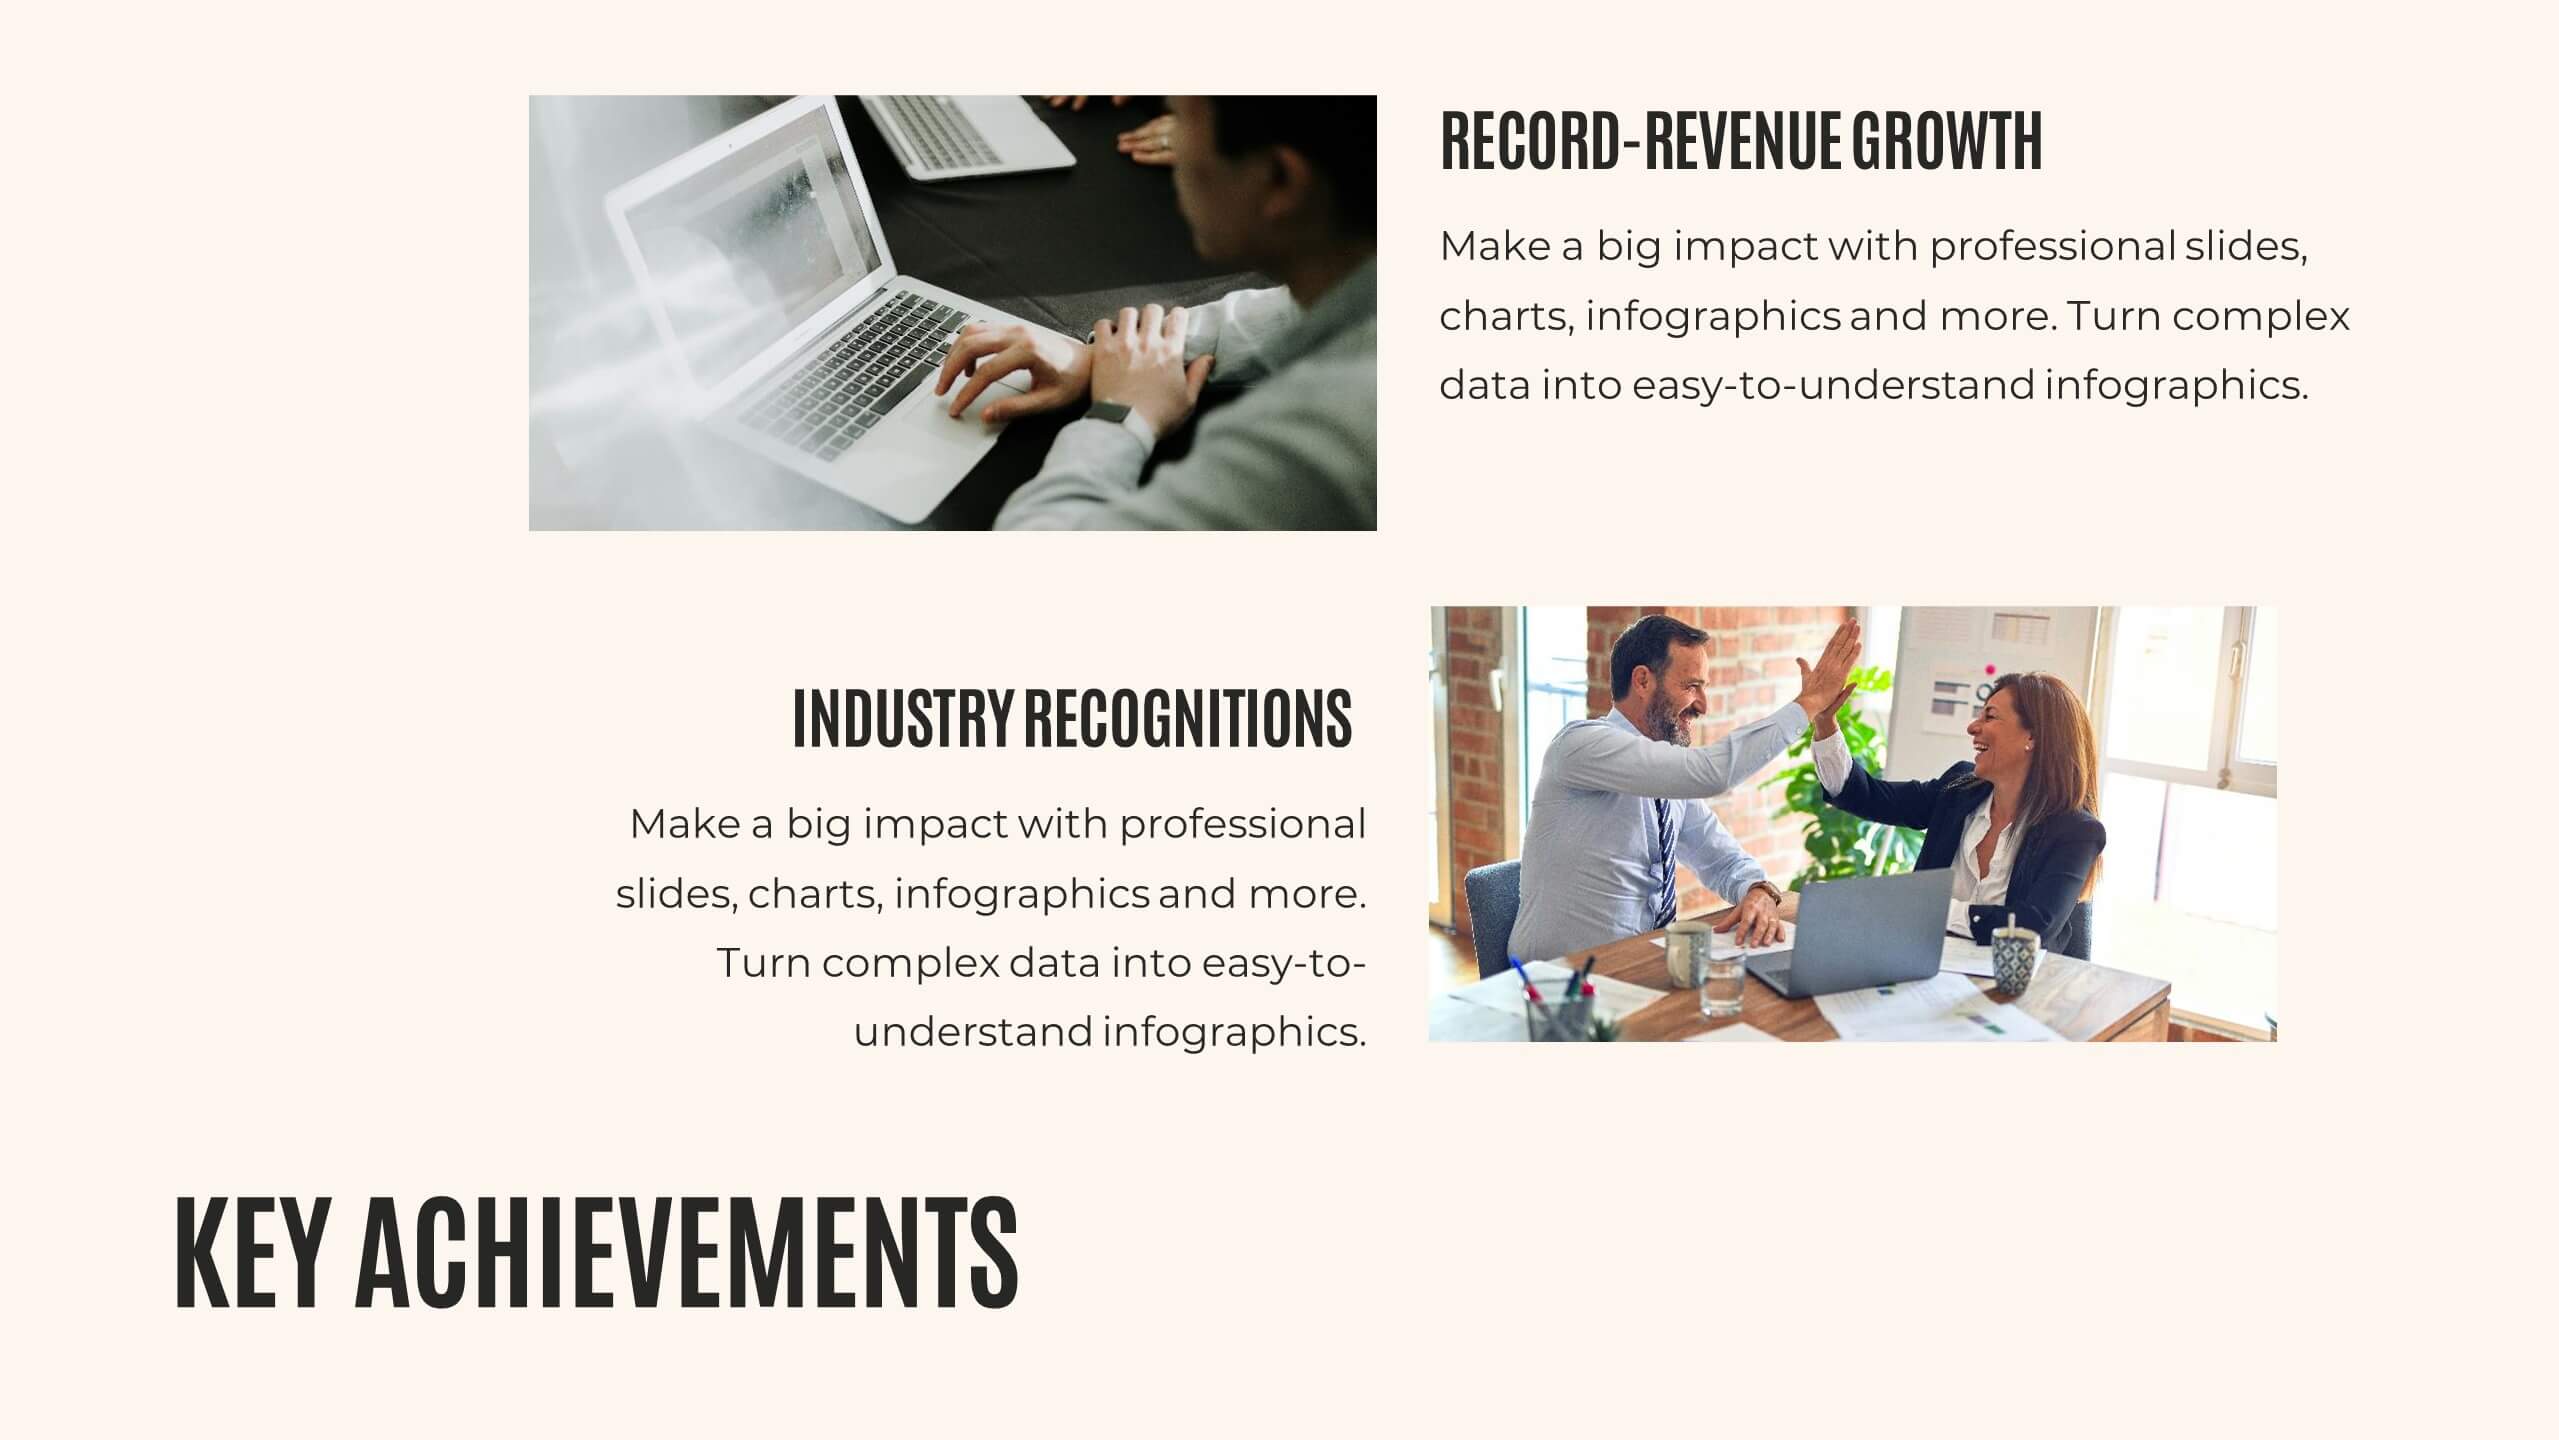
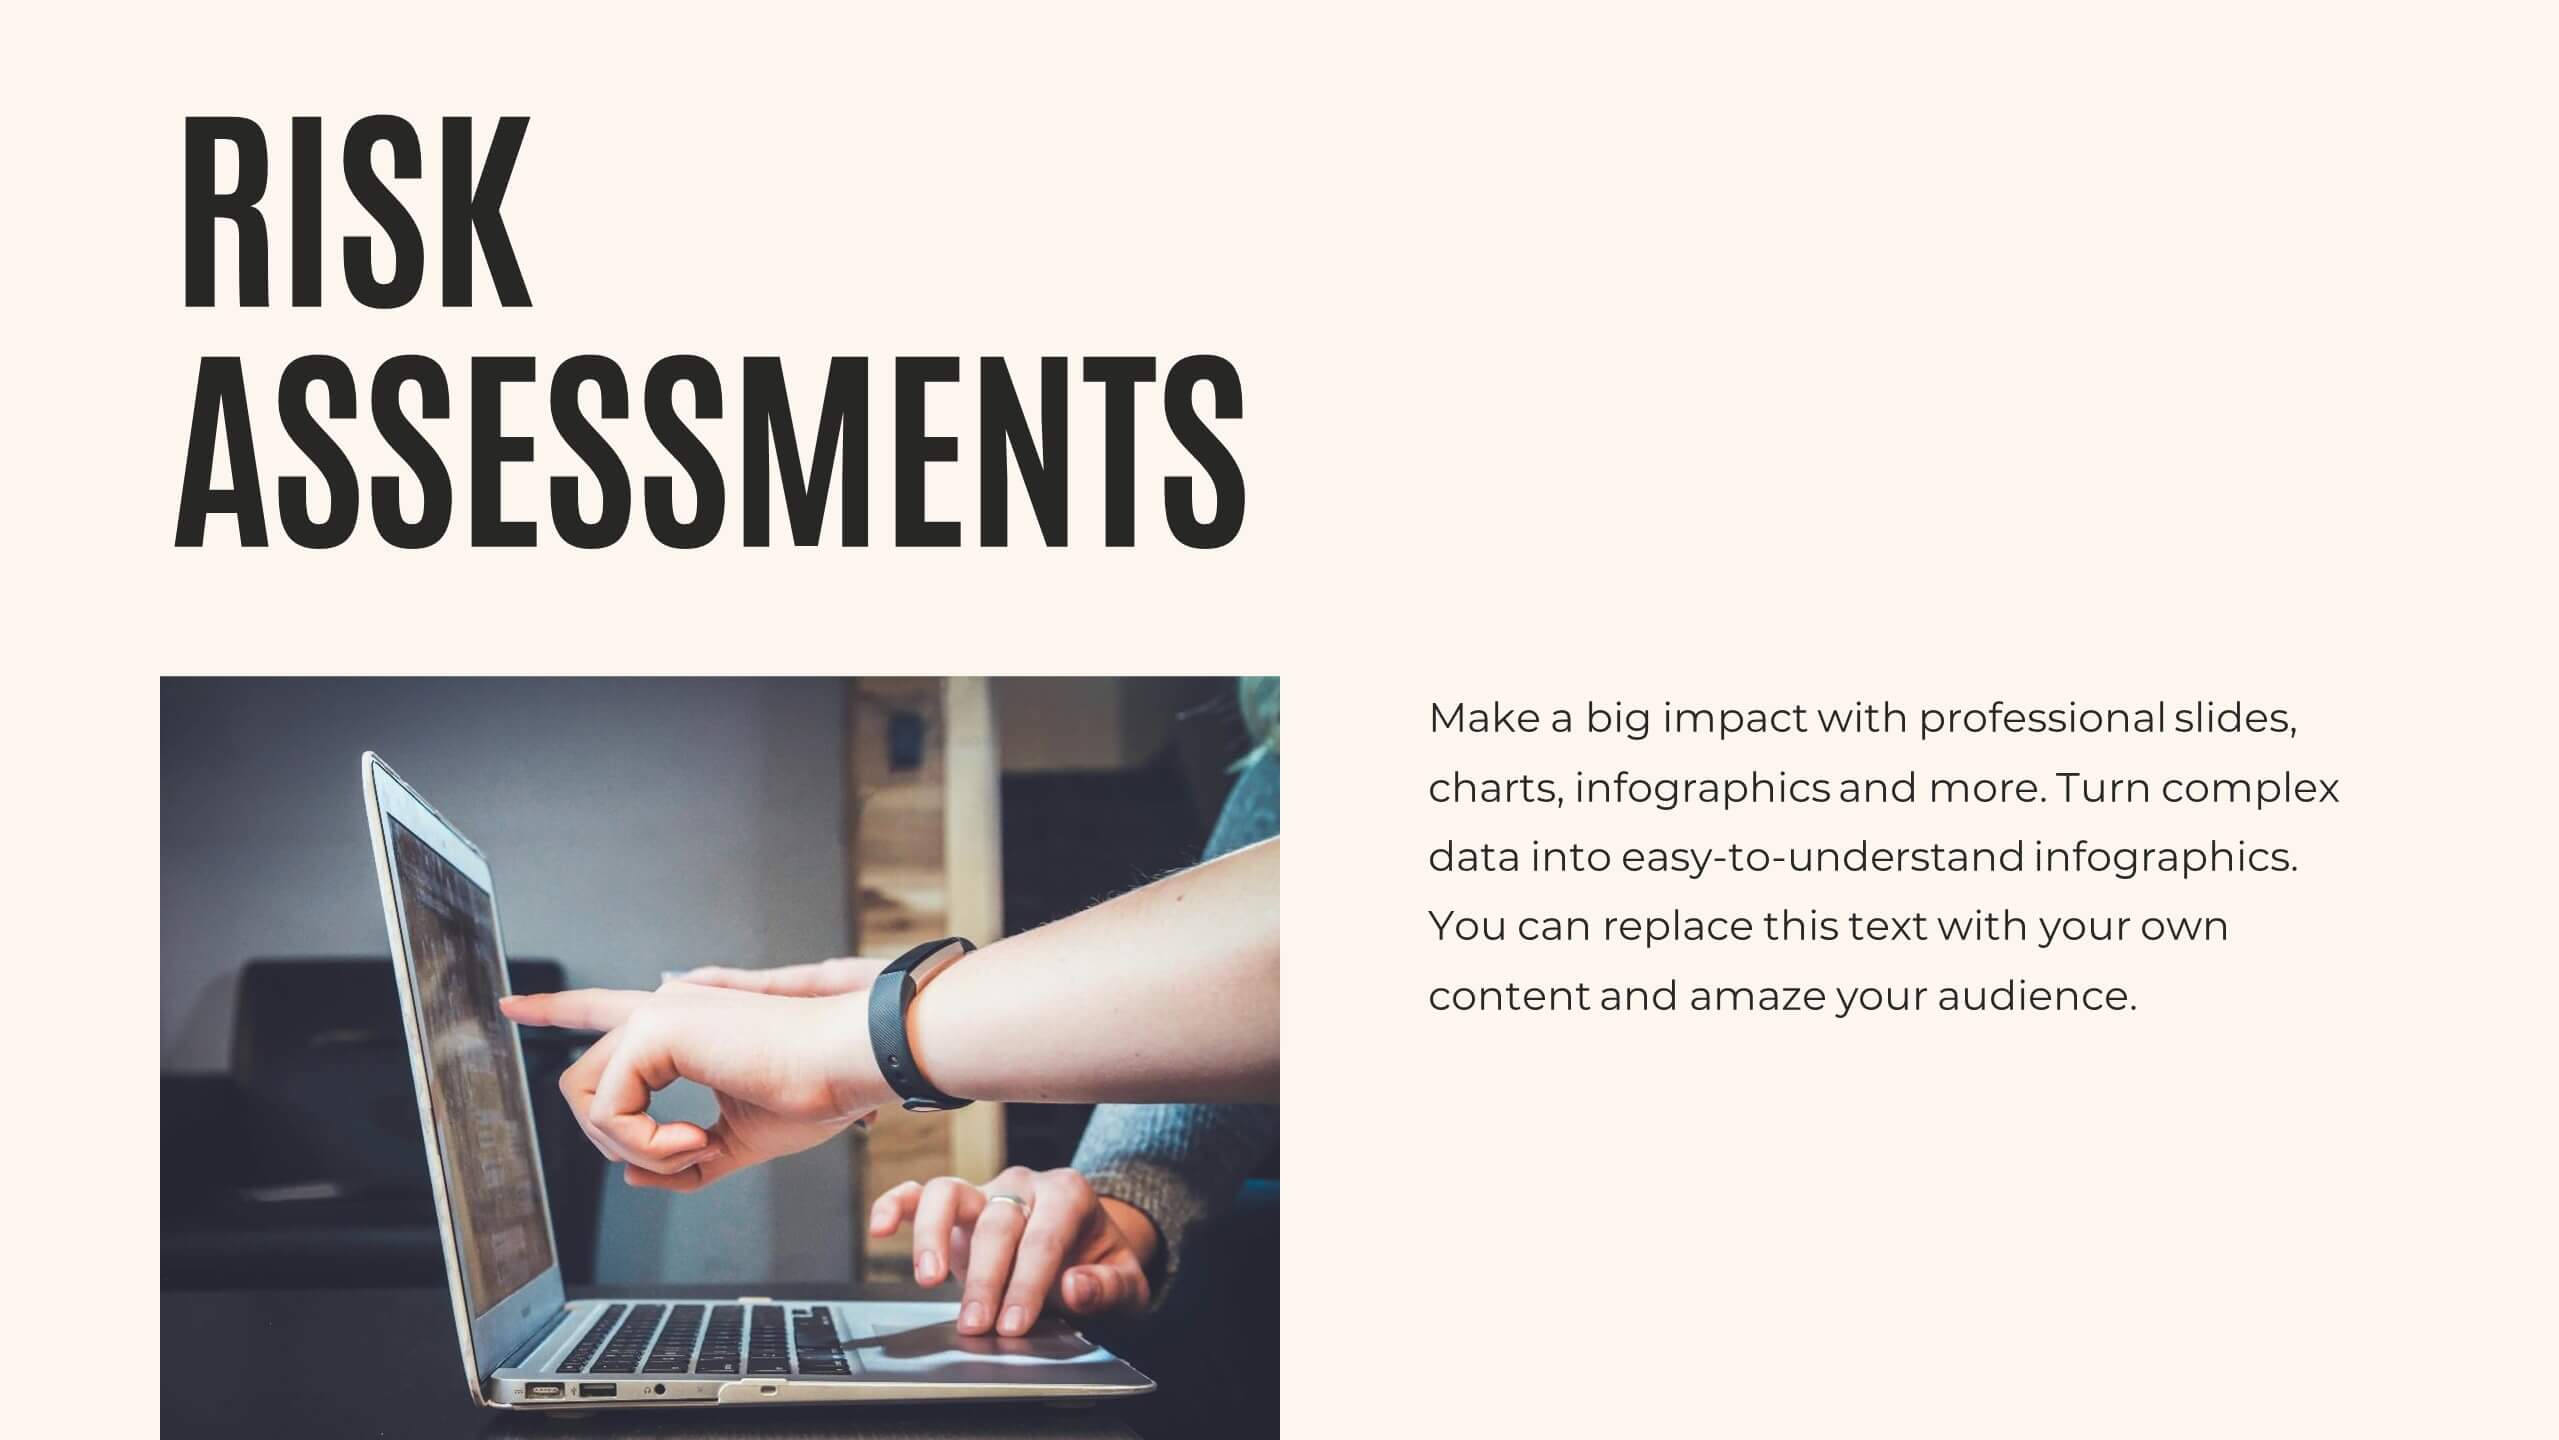
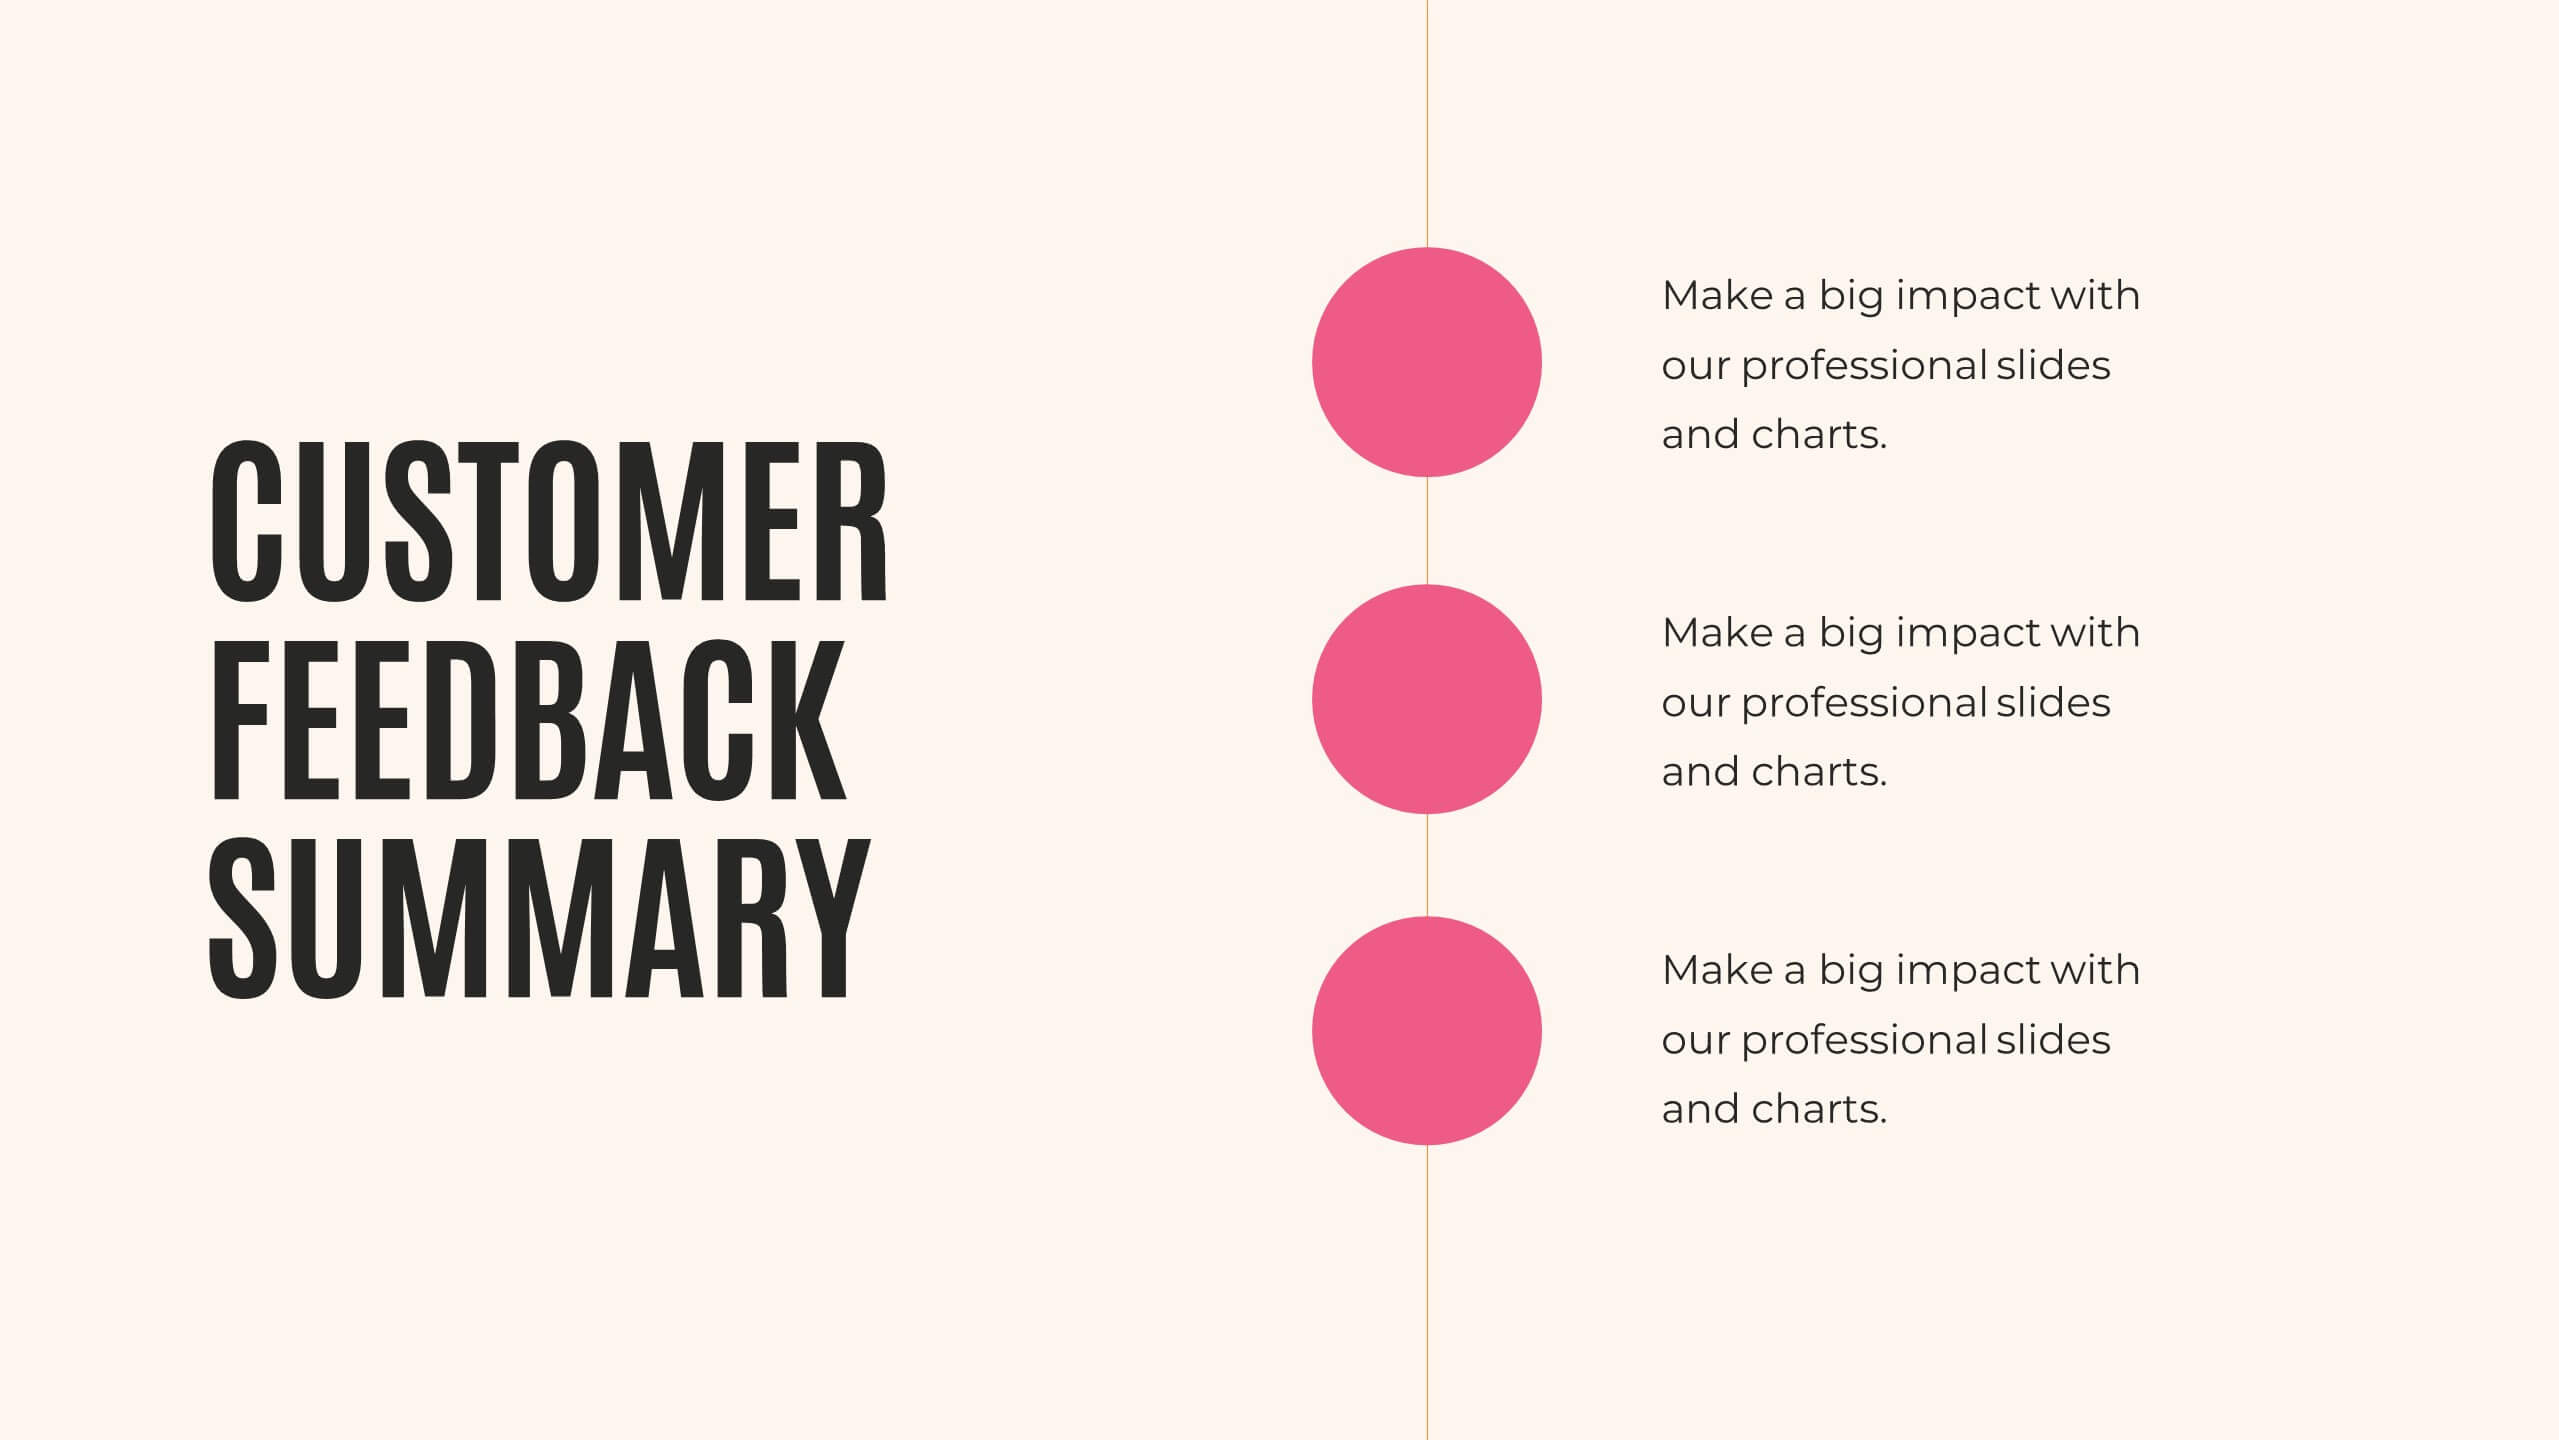
Journey Annual Report Presentation
Present your annual report with clarity and impact! This template covers agenda, key highlights, financial summary, sales performance, and project progress. Ideal for detailing achievements, insights, and future priorities. Compatible with PowerPoint, Keynote, and Google Slides, it ensures your data is visually compelling and easy to understand. Showcase your success effortlessly!


10 slides
SWOT and Competitor Comparison Presentation
Turn insights into strategy with a clean, visual layout designed to compare strengths, weaknesses, opportunities, and threats side by side. This professional presentation helps teams evaluate competitors and identify growth opportunities clearly. Compatible with PowerPoint, Keynote, and Google Slides for easy editing and seamless presentation delivery.


6 slides
Aviation Safety and Efficiency Presentation
Take your audience to new heights with this modern aviation-themed infographic layout. Perfect for illustrating flight performance, safety systems, and operational improvements, it combines clarity with sleek visual flow to enhance understanding. Fully customizable and compatible with PowerPoint, Keynote, and Google Slides for effortless professional presentations.


6 slides
Adapting to Change in Business Presentation
Effectively illustrate business adaptability with this dynamic domino-effect slide. Designed to visually represent cause-and-effect relationships, this template is ideal for change management, business strategy, and risk assessment presentations. The falling blocks symbolize challenges, interventions, and strategic adjustments to drive impactful decision-making. Fully editable—customize colors, text, and layout to match your needs. Compatible with PowerPoint, Keynote, and Google Slides for seamless use.