


Features
- 4 Unique slides
- Fully editable and easy to edit in Microsoft Powerpoint, Keynote and Google Slides
- 16:9 widescreen layout
- Clean and professional designs
- Export to JPG, PDF or send by email


Do you have any questions?
Recommend


22 slides
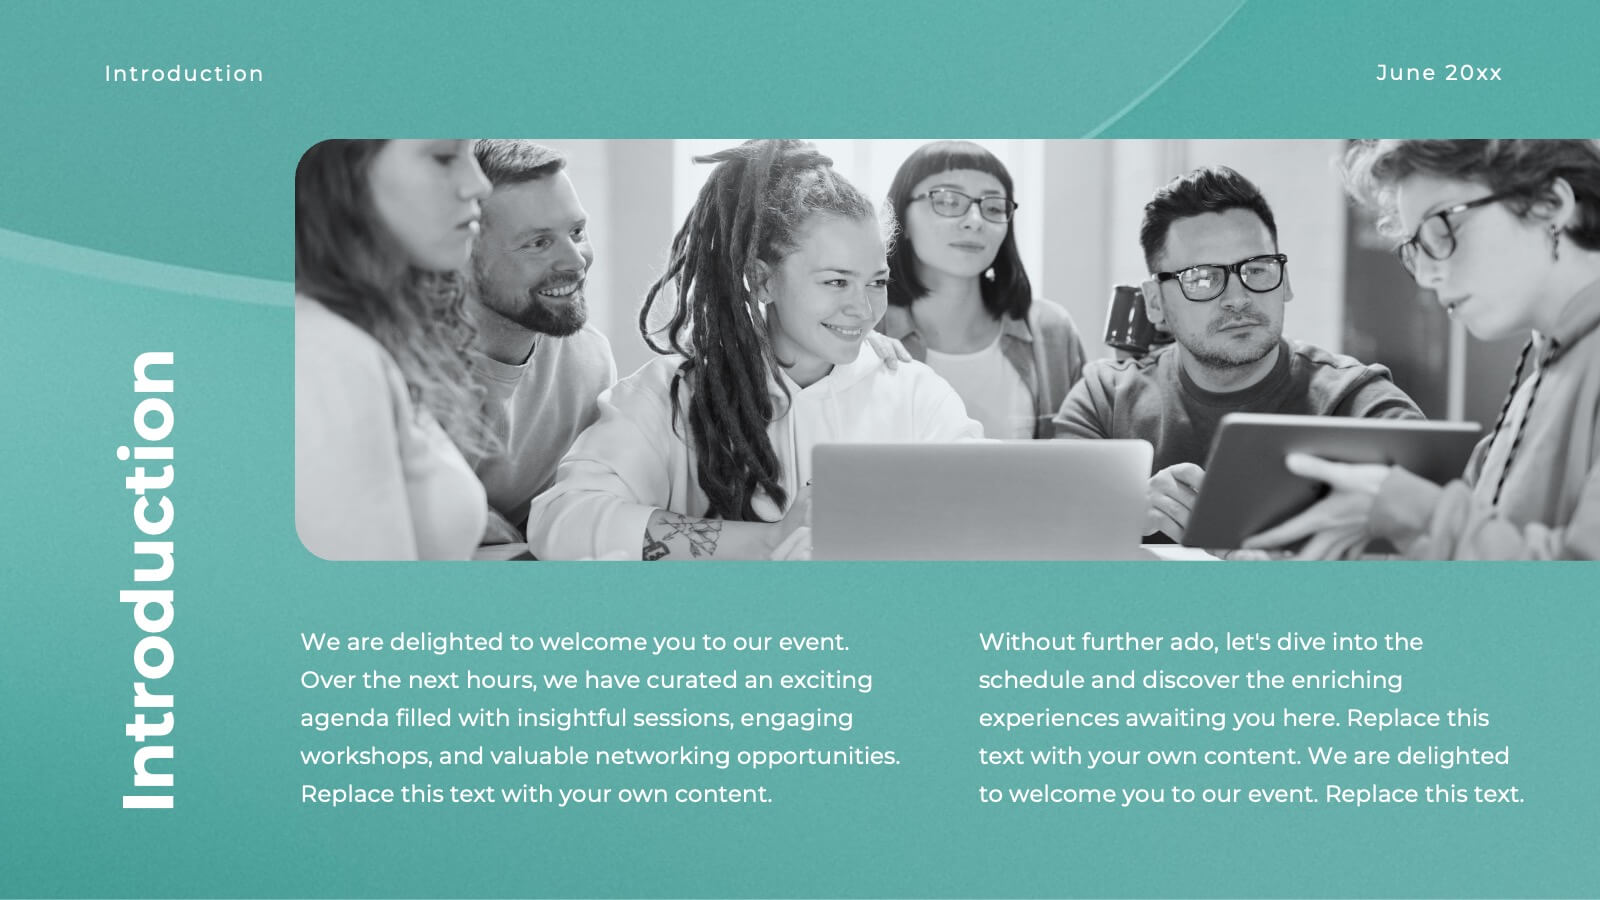
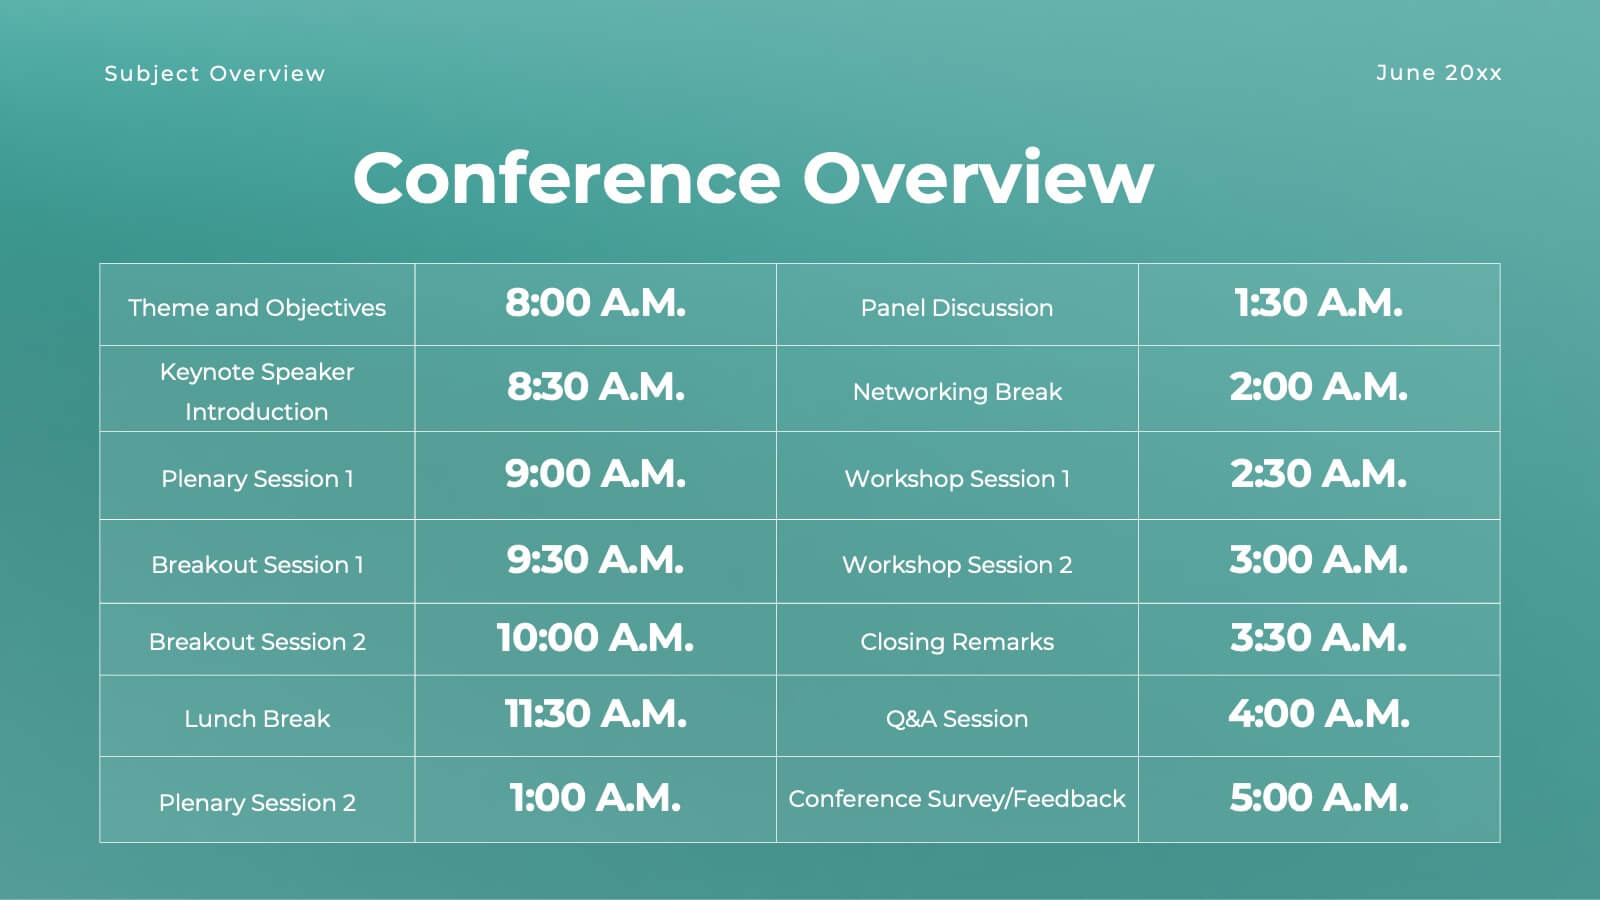
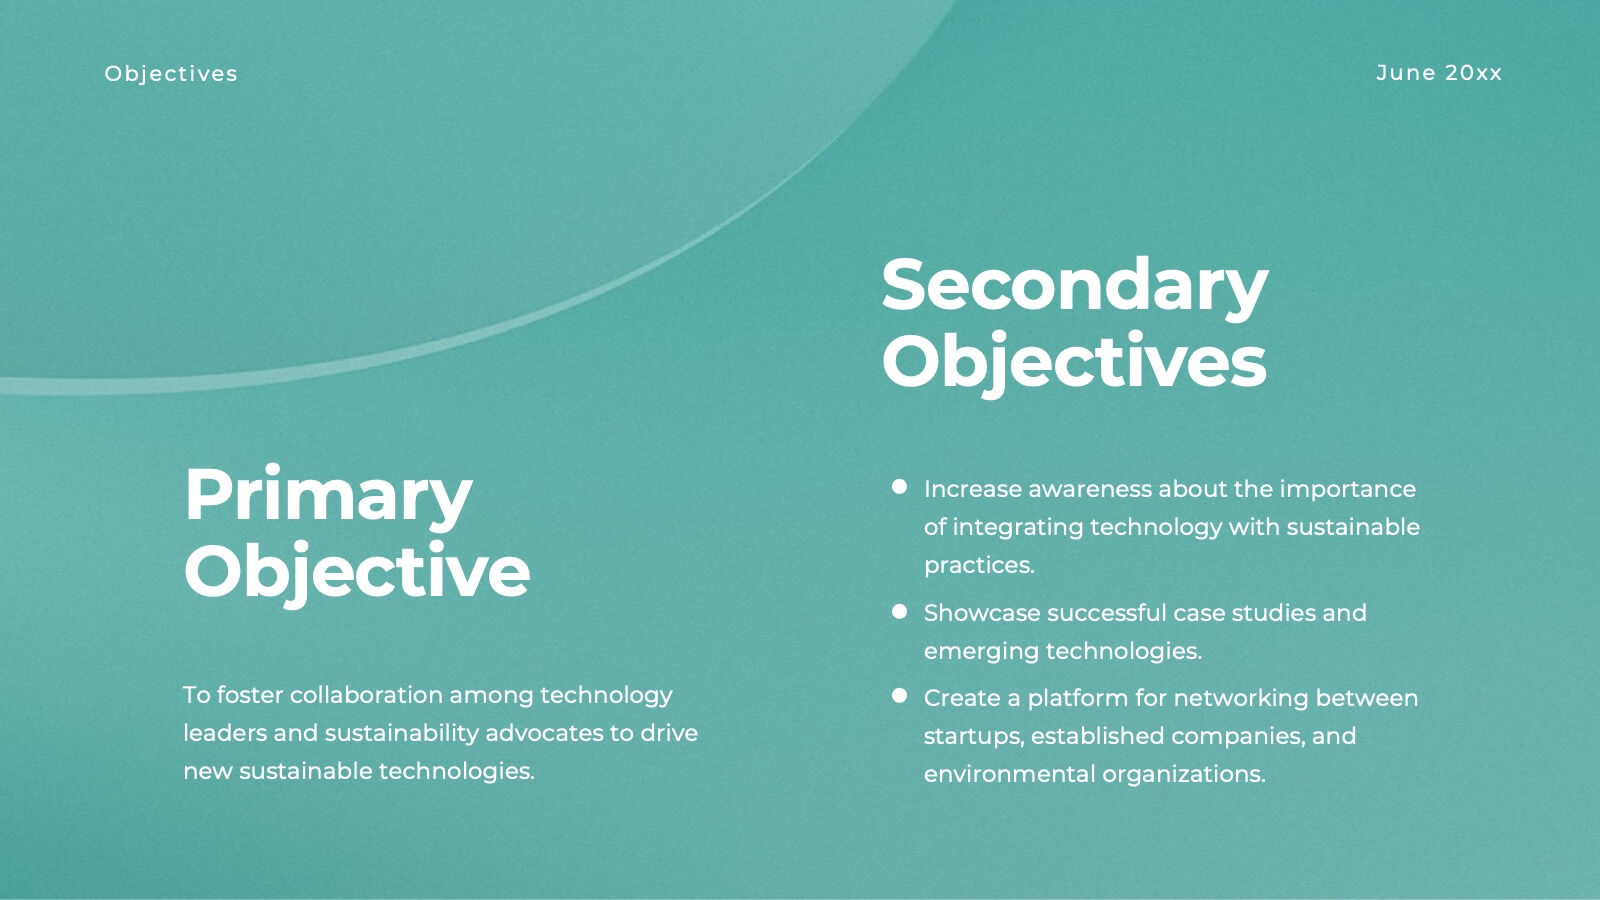
Halo Small Business Pitch Deck Presentation
Streamline your business presentations with this versatile pitch deck template! Ideal for conferences and meetings, it includes slides for objectives, session details, keynote speakers, and panel discussions. Keep your audience engaged with professional design and clear, structured content. Compatible with PowerPoint, Keynote, and Google Slides for seamless presentations on any platform.


5 slides
Annual Achievements and Highlights Presentation
Celebrate your progress with the Annual Achievements and Highlights Presentation. This timeline-style layout guides viewers along a visual path of milestones year by year. Each pin represents a key accomplishment, backed by icons and editable text for context. Perfect for end-of-year reviews or company retrospectives. Compatible with PowerPoint, Google Slides, and Canva.


10 slides
Effective Decision-Making in Five Steps Presentation
Make smarter choices with the Effective Decision-Making in Five Steps presentation. This dynamic template breaks down the key stages of strategic thinking and problem-solving into a clear, engaging framework. Designed for leaders, teams, and consultants, this structured layout helps guide discussions and optimize workflows. Fully editable and available for PowerPoint, Keynote, and Google Slides for seamless customization.


5 slides
Business People Collaboration Overview Presentation
Showcase team dynamics with the Business People Collaboration Overview Presentation. This template uses a clean hexagon layout to highlight roles, responsibilities, or partnerships between individuals or departments. Ideal for collaboration strategies, organizational structures, or cross-functional workflows. Fully editable in PowerPoint, Canva, and Google Slides.


20 slides
Windsong Sales Proposal Presentation
Craft a persuasive sales proposal with this sleek and professional template. Perfectly suited for communicating your value proposition, this design includes slides for introductions, company overviews, and a detailed service summary. Address critical business factors with sections for target markets, competitive analysis, and clearly defined sales objectives. Highlight your sales process, showcase the team's expertise, and build trust through customer testimonials. Dedicated slides for pricing strategies, promotions, and discounts allow you to present a compelling financial offer. Wrap up with an actionable next steps plan and a feedback section to reinforce client engagement. Fully customizable and compatible with PowerPoint, Google Slides, and Keynote, this template combines modern design with functional layouts to ensure your proposal stands out. Ideal for creating a lasting impression.


7 slides
Stock Market Futures Infographic
The stock market, also known as the equity market or share market, is a platform where buying, selling, and issuing shares of publicly-held companies take place. This infographic template serves as your compass through the intricate landscape of stocks and futures, empowering you with the knowledge to steer your investments towards a prosperous horizon. Compatible with Powerpoint, Keynote, and Google Slides. The striking visualizations present the clash between the bullish and bearish market forces, symbolizing the constant struggle that drives market movements. Easily showcase the latest stock prices with this template.


5 slides
RAPID Decision-Making Model Presentation
The RAPID Decision-Making Model template simplifies complex decision processes, laying out steps from recommending to deciding in an easily digestible format. It's ideal for team leaders and managers who want to streamline decision-making. The template is designed for seamless use across PowerPoint, Keynote, and Google Slides, ensuring broad compatibility and user-friendly presentations.


5 slides
SEO and Funnel Tactics in Marketing Presentation
Showcase your digital strategy step-by-step with the SEO and Funnel Tactics in Marketing Presentation. Designed with a layered visual layout, this template helps you highlight up to five key stages of your marketing funnel—from awareness to conversion. Fully customizable in PowerPoint, Canva, Keynote, and Google Slides.


5 slides
Environmental and Social Sustainability Presentation
Explore the synergy of environmental protection and social responsibility with our Environmental and Social Sustainability Presentation template. This visual aid is a compelling tool for discussing key strategies in balancing ecological and social impacts, providing a roadmap for sustainable business practices. Ideal for engaging audiences in discussions about conservation and community engagement, the template is fully compatible with PowerPoint, Keynote, and Google Slides, ensuring a smooth presentation experience in any setting.


5 slides
Strategic Vision for Long-Term Growth
Turn big goals into clear milestones with this upward path-style layout—perfect for illustrating your company’s strategic vision and long-term growth plan. Use each step to highlight priorities, phases, or guiding principles along the journey. Fully compatible with PowerPoint, Keynote, and Google Slides.


4 slides
Execution-Based Strategic Action Plan Presentation
Highlight your execution strategy with this visually striking pinwheel diagram. Each blade represents a focused action step, ideal for showcasing implementation plans or performance initiatives. Fully customizable in PowerPoint, Keynote, and Google Slides—perfect for strategic reviews, team briefings, or progress tracking across four critical areas.


6 slides
Project Planning and Task Allocation Presentation
Streamline your project timelines with the Project Planning and Task Allocation Presentation. This template uses a clear horizontal flow to map out six key tasks or stages, making it ideal for visualizing schedules, assigning responsibilities, or showcasing milestones. Fully editable in PowerPoint, Google Slides, Keynote, and Canva.


4 slides
Data Table Infographic Presentation
Organize complex information clearly with the Data Table Infographic Presentation. This slide design features a structured table layout paired with icon-labeled column headers for visual clarity. Ideal for presenting statistics, performance metrics, survey data, or structured comparisons. Highlighted headers draw attention to key sections, making your data easy to digest. Fully editable in PowerPoint, Keynote, and Google Slides.


22 slides
Tranquil Project Status Report Presentation
This dynamic project report template delivers key insights with a bold, modern design. From performance metrics to market trends and client feedback, it's crafted for comprehensive yet visually appealing updates. Perfect for team presentations, this template ensures clarity and engagement. Compatible with PowerPoint, Keynote, and Google Slides, it’s ideal for project leaders!


6 slides
Company Value Proposition Presentation
Bring your brand’s promise to life with a clean, engaging visual flow that highlights what makes your business stand out. This presentation is perfect for showcasing your mission, vision, and key differentiators with clarity and impact. Fully compatible with PowerPoint, Keynote, and Google Slides for seamless editing.


7 slides
Simple Schedule Infographic
Effortlessly structure your time with our simple schedule infographic. Rendered in a clean white canvas, enhanced with dependable blue tones and anchored with timeless black, our template is the epitome of clarity and organization. Equipped with streamlined infographics, universal icons, and adaptable image placeholders, it facilitates easy time management and daily planning. Seamlessly tailored for Powerpoint, Keynote, or Google Slides. A fundamental tool for project managers, event planners, educators, or any professional aiming to efficiently allocate their time. Plan with ease; let every slide bring order to your daily chaos.


4 slides
Personal and Business Insurance Plans
Clearly present your insurance tiers with this easy-to-read comparison layout. Ideal for showcasing plan options for individuals, families, and businesses, this template highlights pricing, benefits, and coverage icons side-by-side. Clean and professional, it’s fully editable in PowerPoint, Keynote, and Google Slides.