


Features
- 10 Unique Slides
- Fully editable and easy to edit in Microsoft Powerpoint, Keynote and Google Slides
- 16:9 widescreen layout
- Clean and professional designs
- Export to JPG, PDF or send by email


Do you have any questions?
Recommend


26 slides
Fitness Company Profile Dark Presentation
Dive into the pulsating realm of fitness, where every sweat drop carves the path to chiseled abs. Imbued in shades of black with electrifying neon accents, our template captures the dark, motivating ambiance of late-night gym sessions. Featuring dynamic graphics, empowering icons, and inspiring image placeholders, it's a testament to determination and grit. Flawlessly curated for Powerpoint, Keynote, or Google Slides. The ultimate asset for fitness trainers, gym enthusiasts, health bloggers, or anyone aiming to inspire a journey towards physical excellence. Push your limits; let every rep ignite your passion.


5 slides
Multi-Step Procedure and Execution Flow Presentation
Visualize complex processes with clarity using the Multi-Step Procedure and Execution Flow Presentation. Ideal for SOPs, task breakdowns, or team workflows, this layout helps you present sequential actions, decision points, and outcomes with a clean, structured flow. Fully editable in PowerPoint, Canva, and Google Slides.


4 slides
Project Responsibility RACI Matrix Presentation
The "Project Responsibility RACI Matrix" presentation effectively delineates the responsibilities associated with different roles in a project. Each slide visually encodes the responsibilities as Responsible, Accountable, Consulted, or Informed for various tasks across different roles, enhancing clarity and promoting a thorough understanding of who is involved in each phase of project execution. This format is particularly useful for complex projects where multiple stakeholders need clear communication about their roles and contributions.


4 slides
Income and Expense Highlights Presentation
Enhance learning with the Interactive Digital Learning Experience Presentation. This template mimics a multiple-choice format, making it perfect for quizzes, training modules, or eLearning content. Each slide includes labeled options (A–D) alongside a modern vertical interface, ideal for engaging assessments or lesson recaps. Fully editable in Canva, PowerPoint, Keynote, and Google Slides.


7 slides
Sports Infographic Presentation Template
A sports infographic is a visual representation of information or knowledge related to a sport or sporting event. This template allows you to include statistics, performance metrics, records, and other relevant data that helps to explain and showcase the sport. Our sports infographic also include images, illustrations, and other graphic elements that can help to tell a story. They can be used in a variety of settings. The goal of this sports infographic is to present your information in a clear and engaging way, and to help your audience understand and appreciate the sport more deeply.


5 slides
Team Role Distribution Matrix Presentation
Clarify responsibilities and improve collaboration with the Team Role Distribution Matrix Presentation. This RACI-style slide helps visualize team accountability across multiple tasks, making it ideal for project management, cross-functional teams, or workflow planning. Each layout option includes clearly labeled roles and color-coded responsibilities: Responsible, Accountable, Consulted, and Informed. Fully editable in Canva, PowerPoint, Keynote, and Google Slides.
22 slides
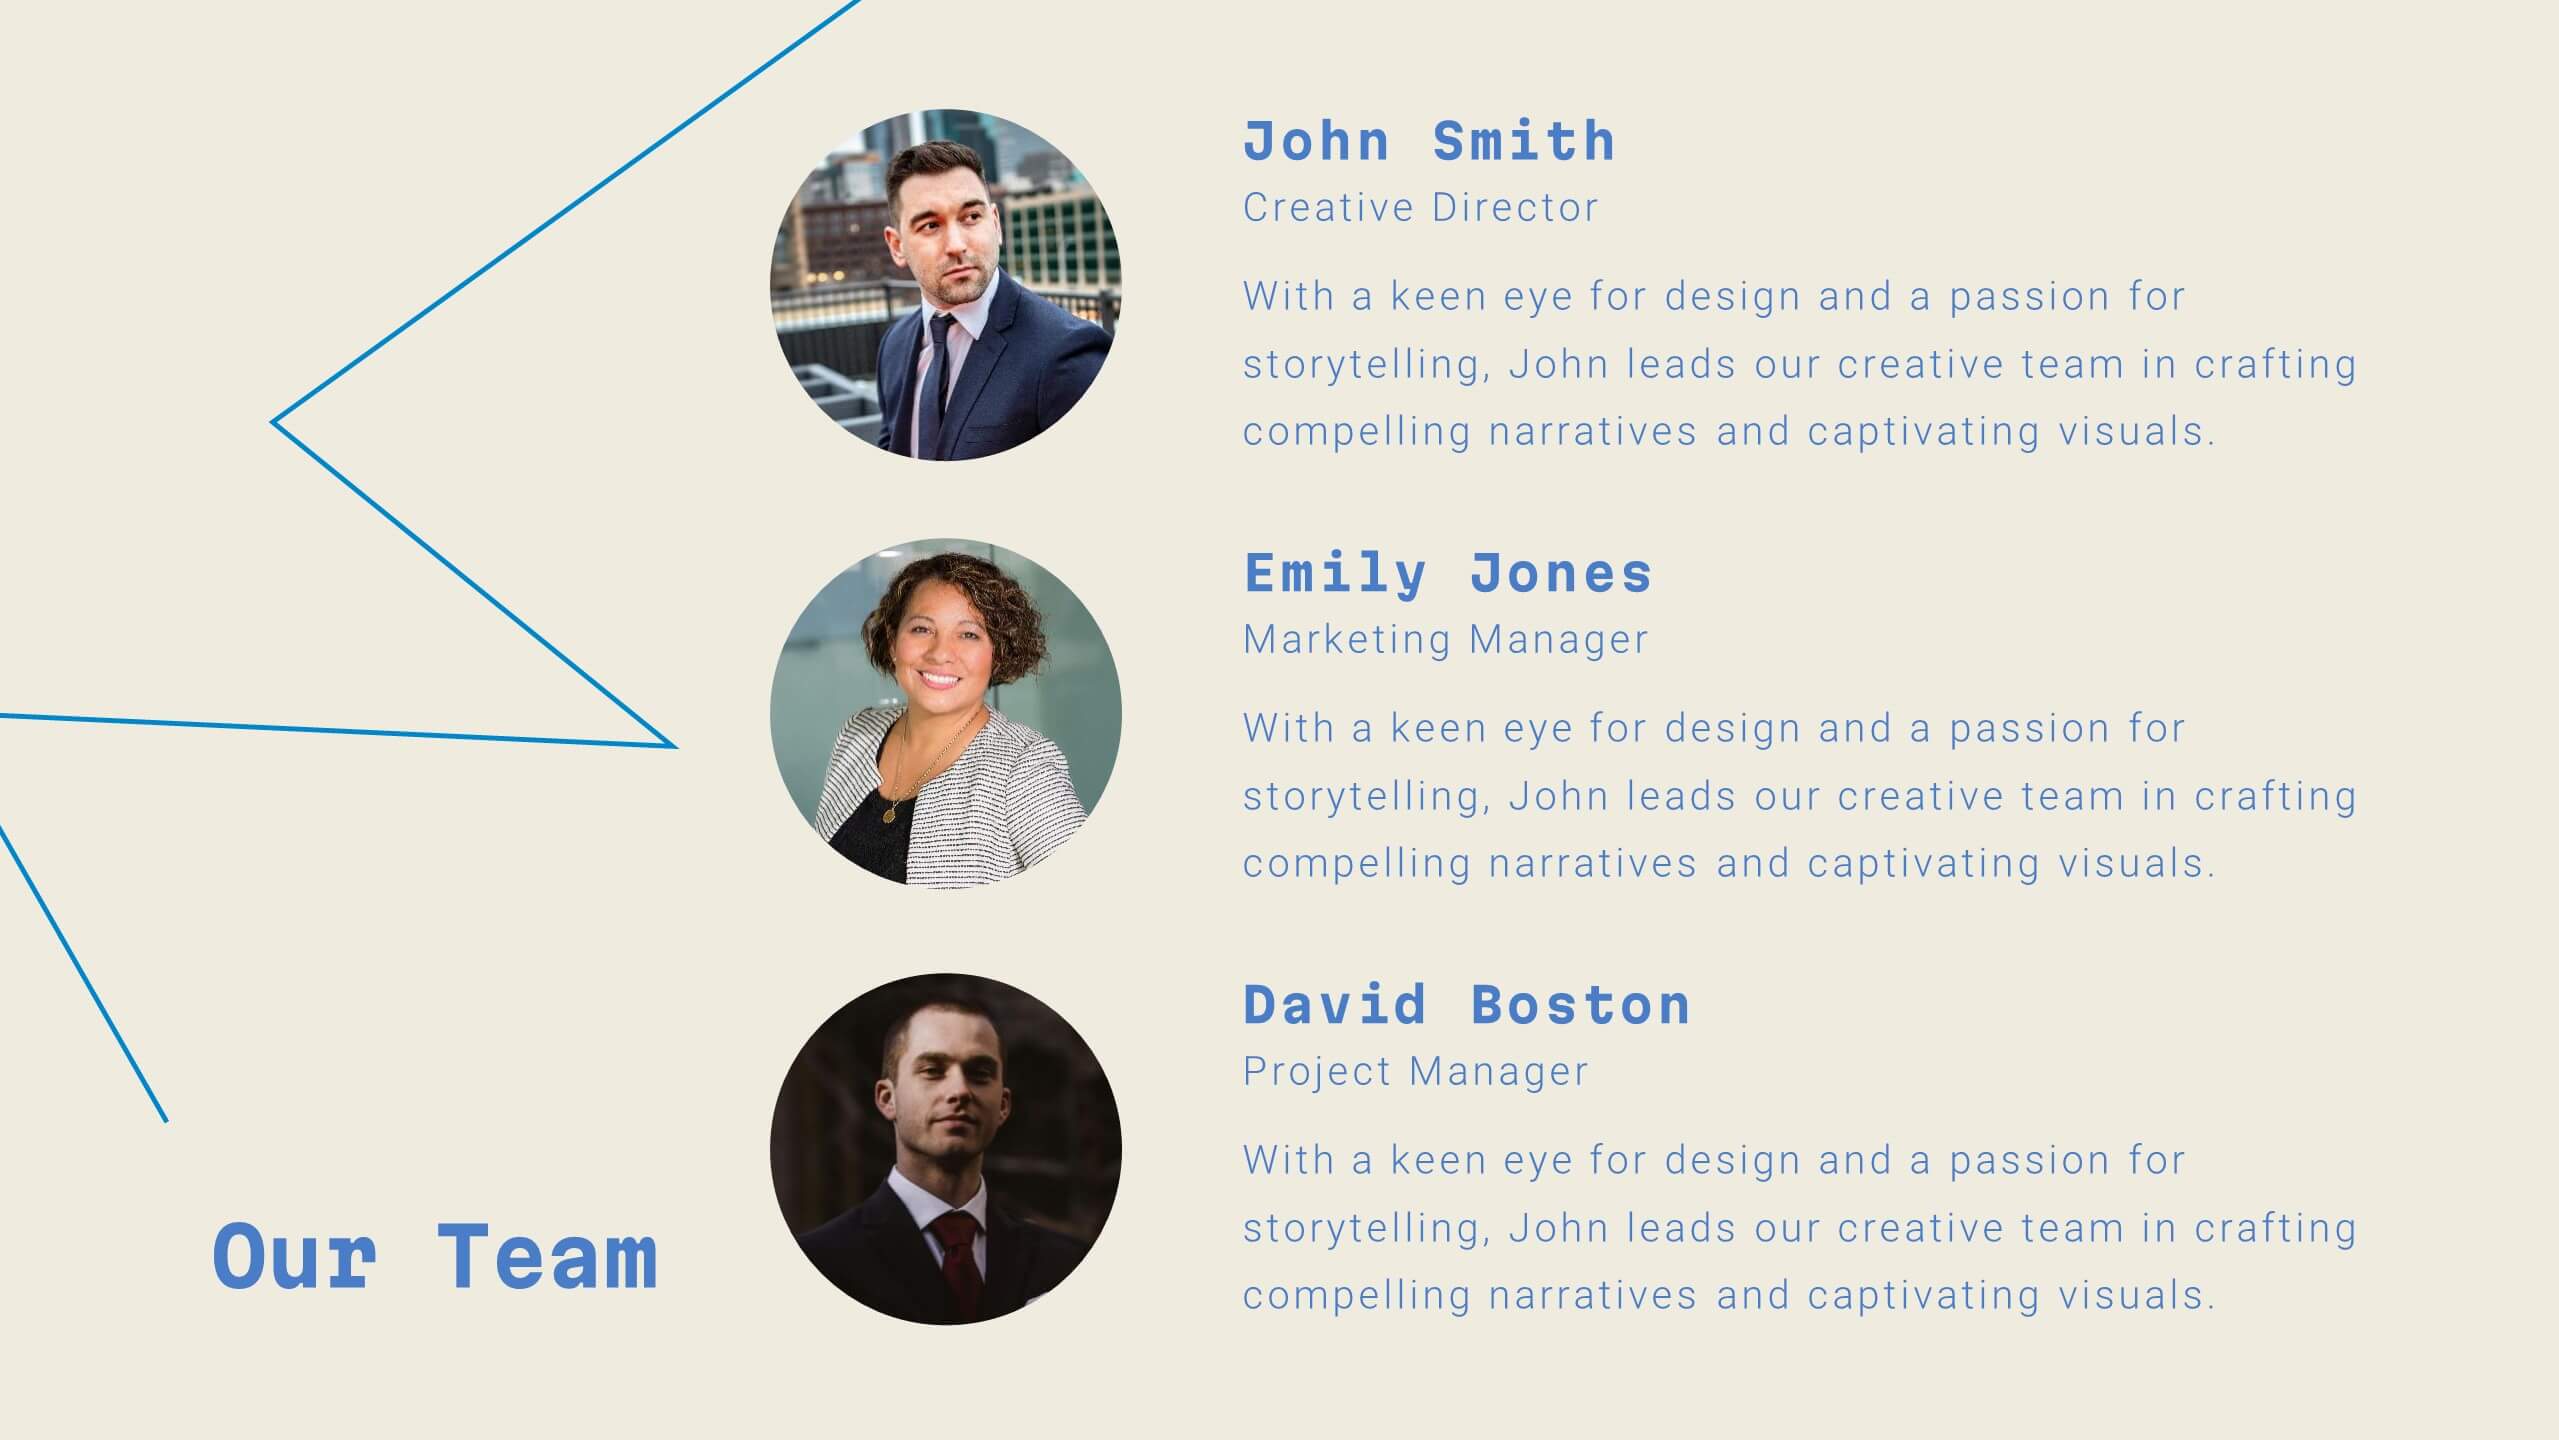
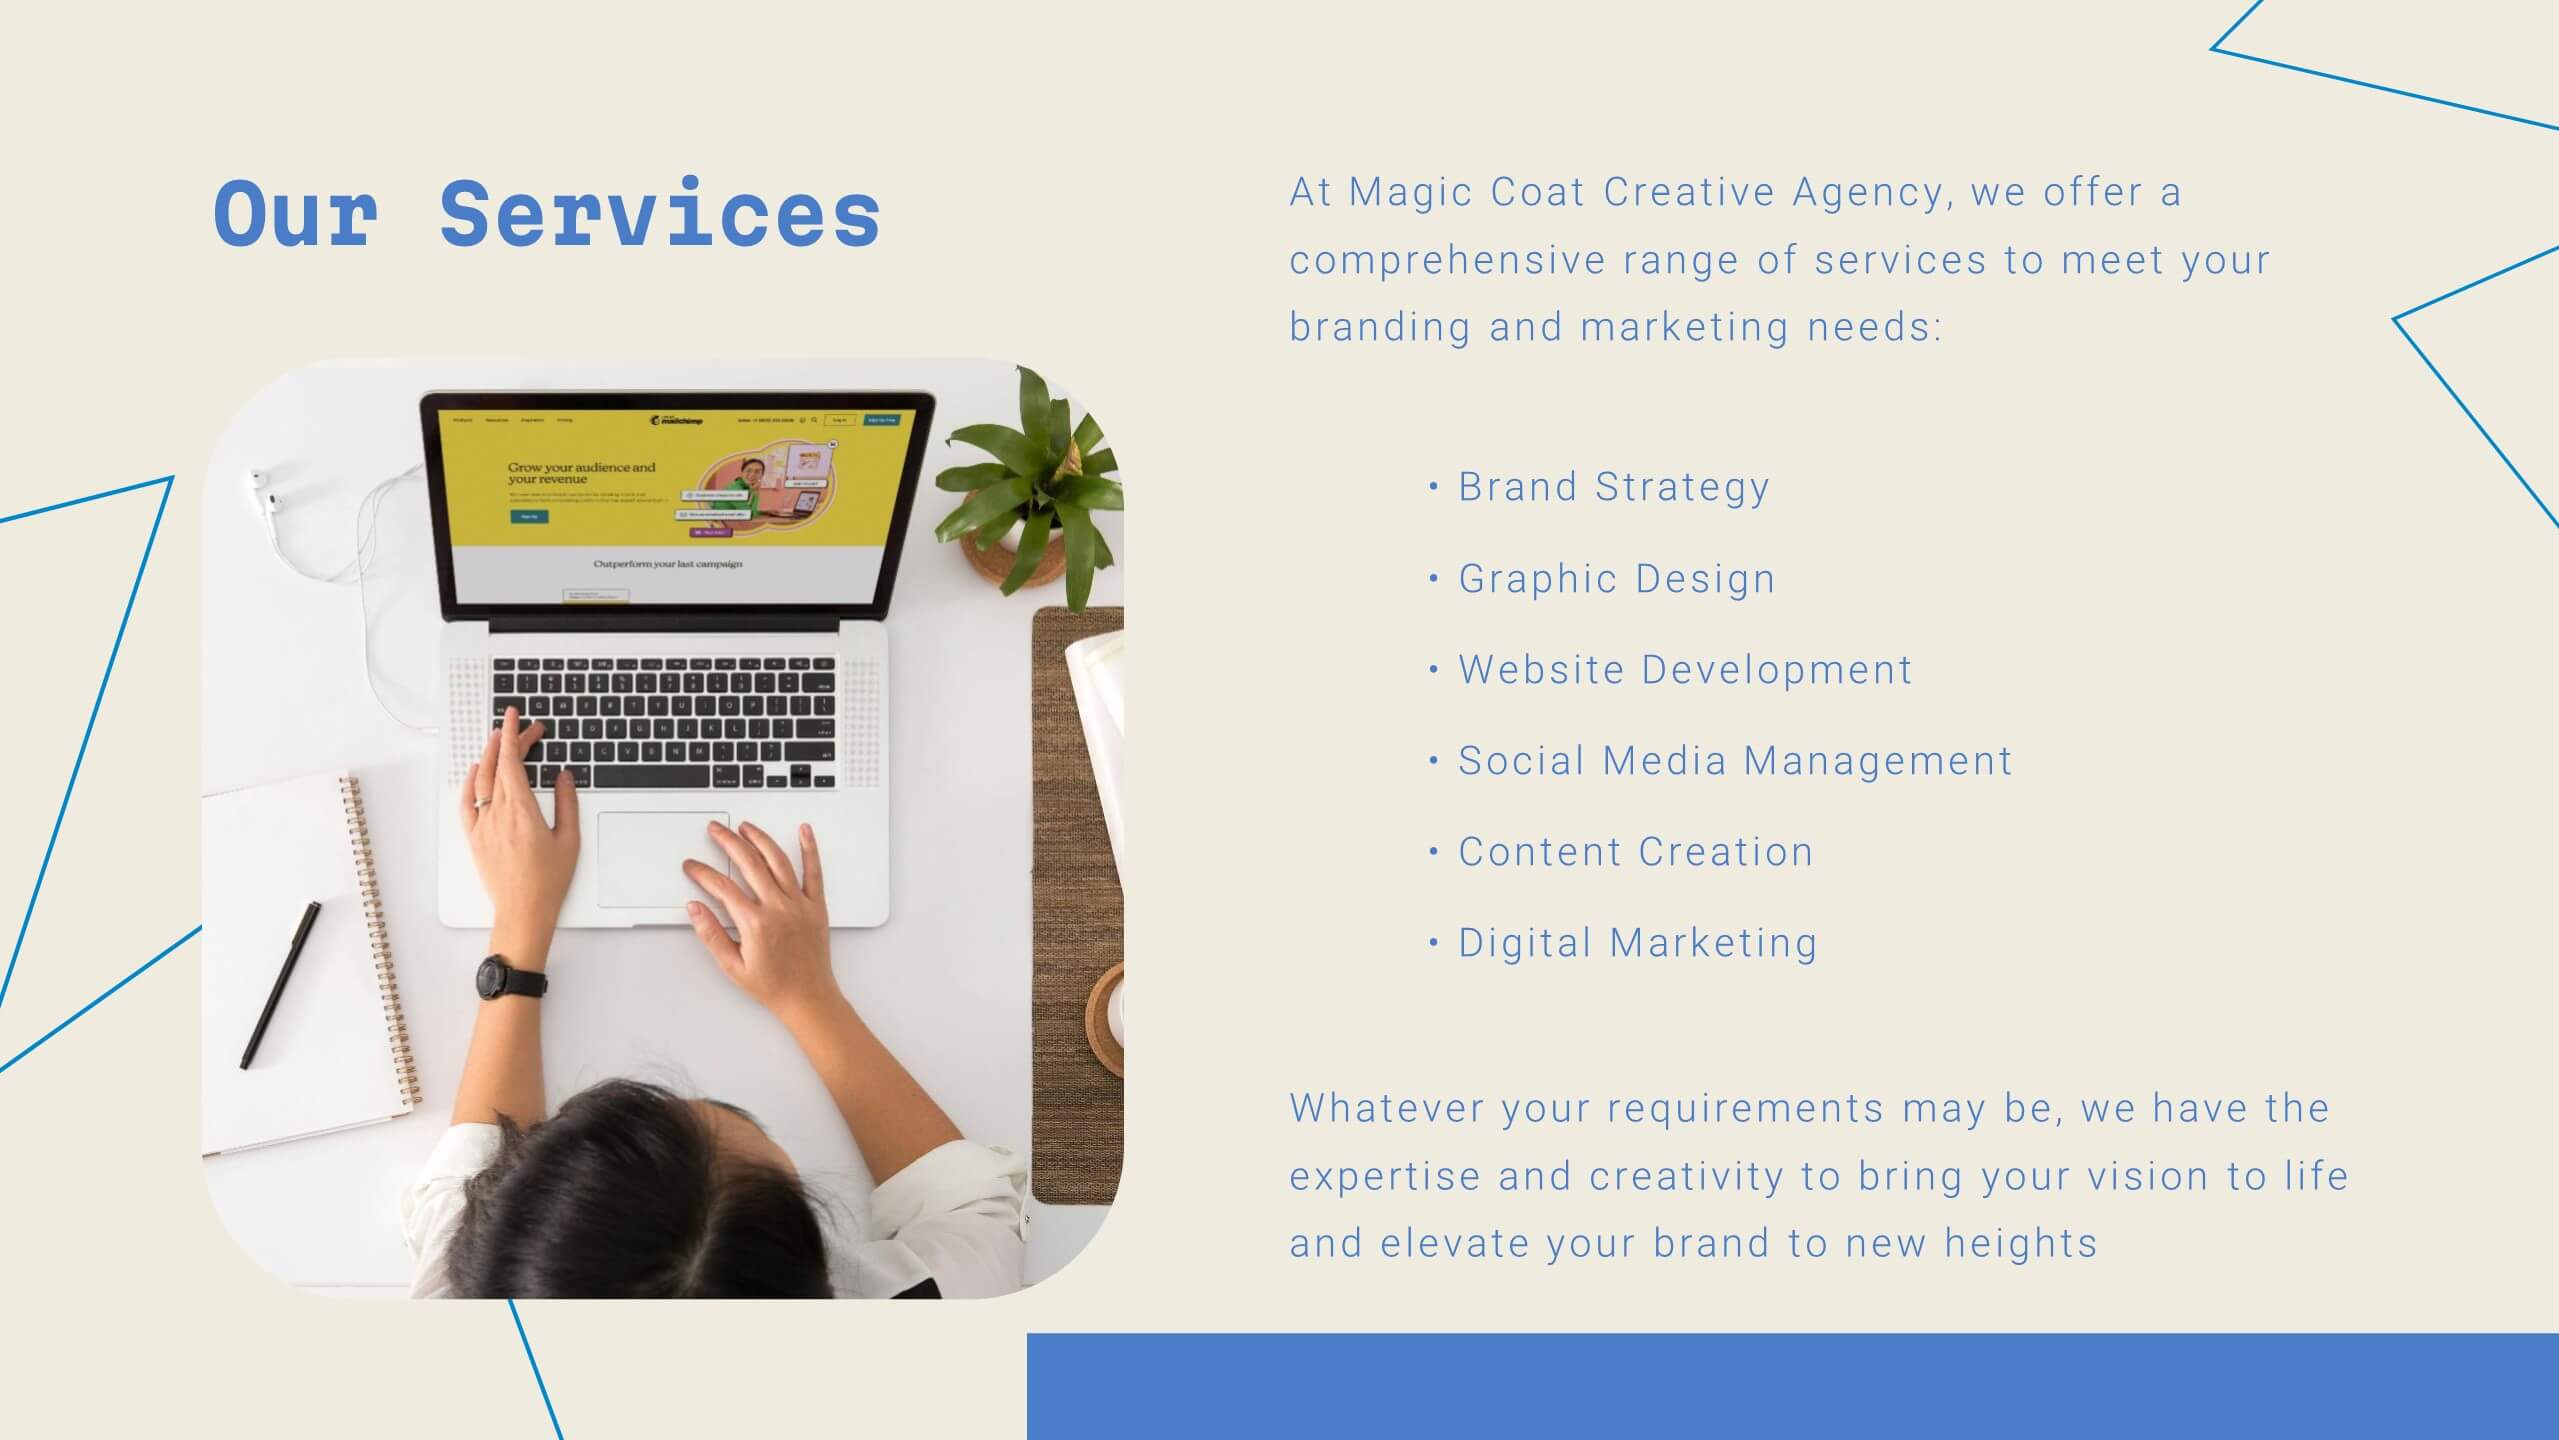
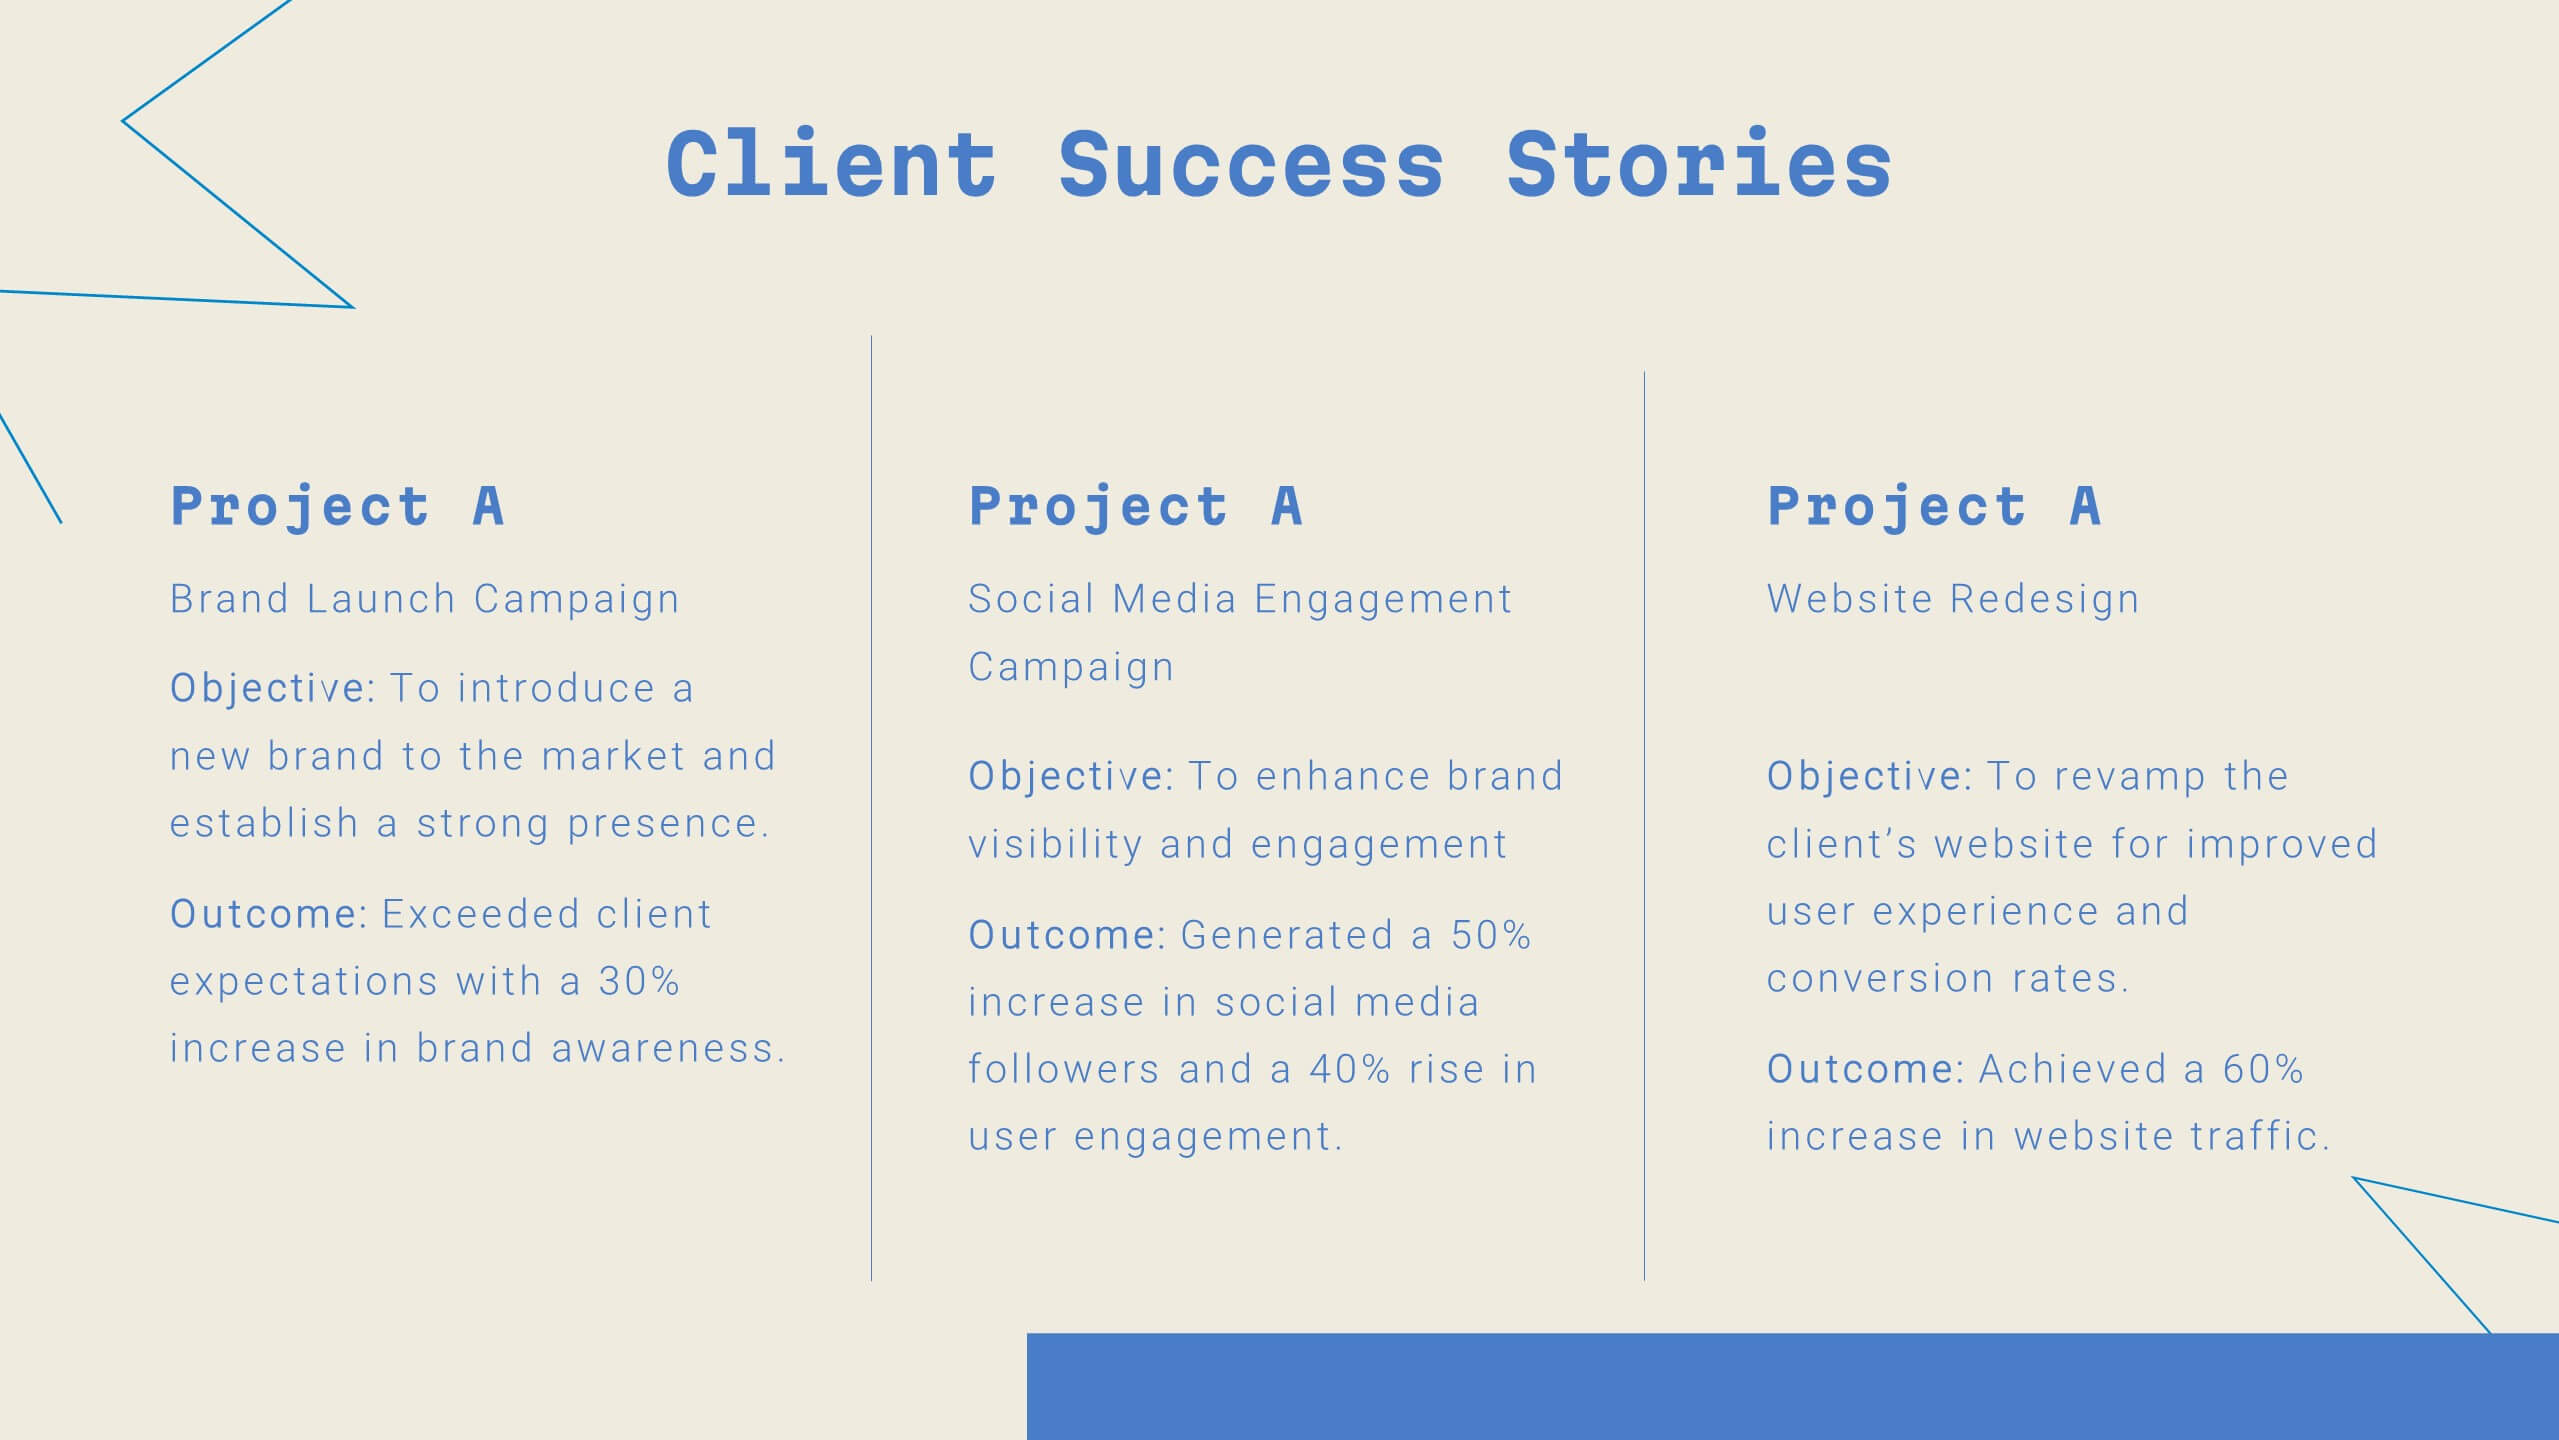
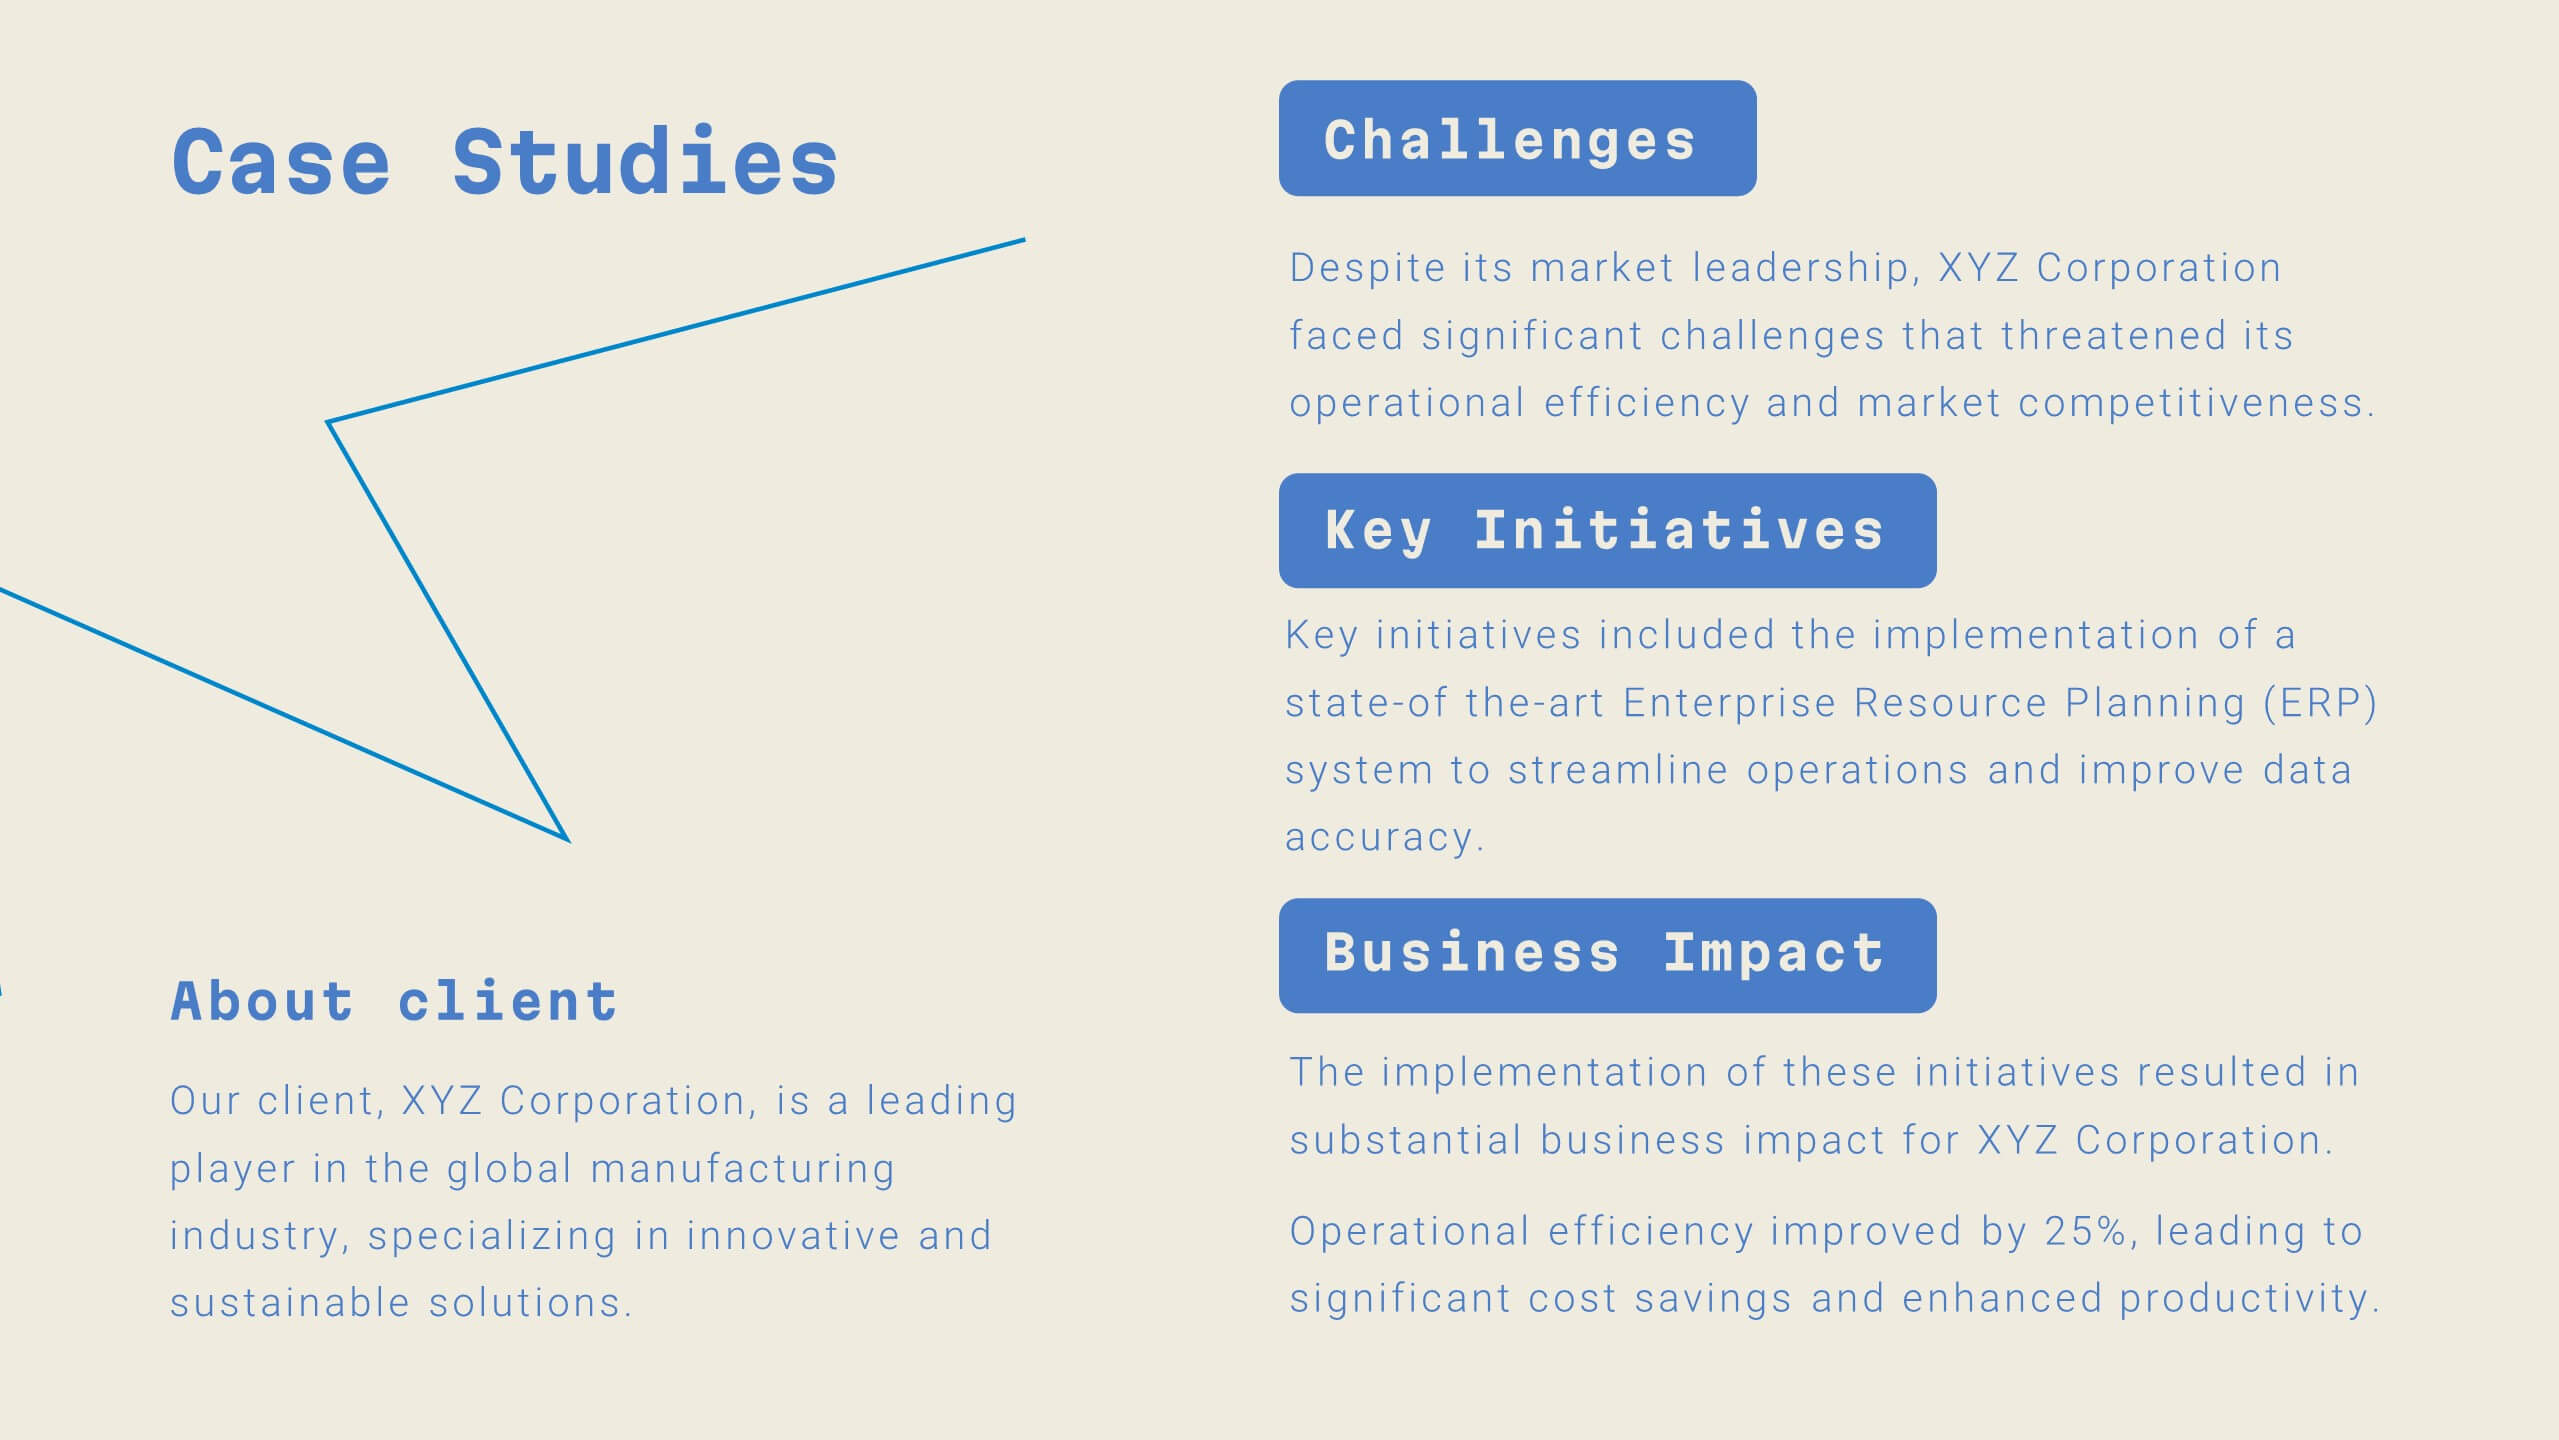
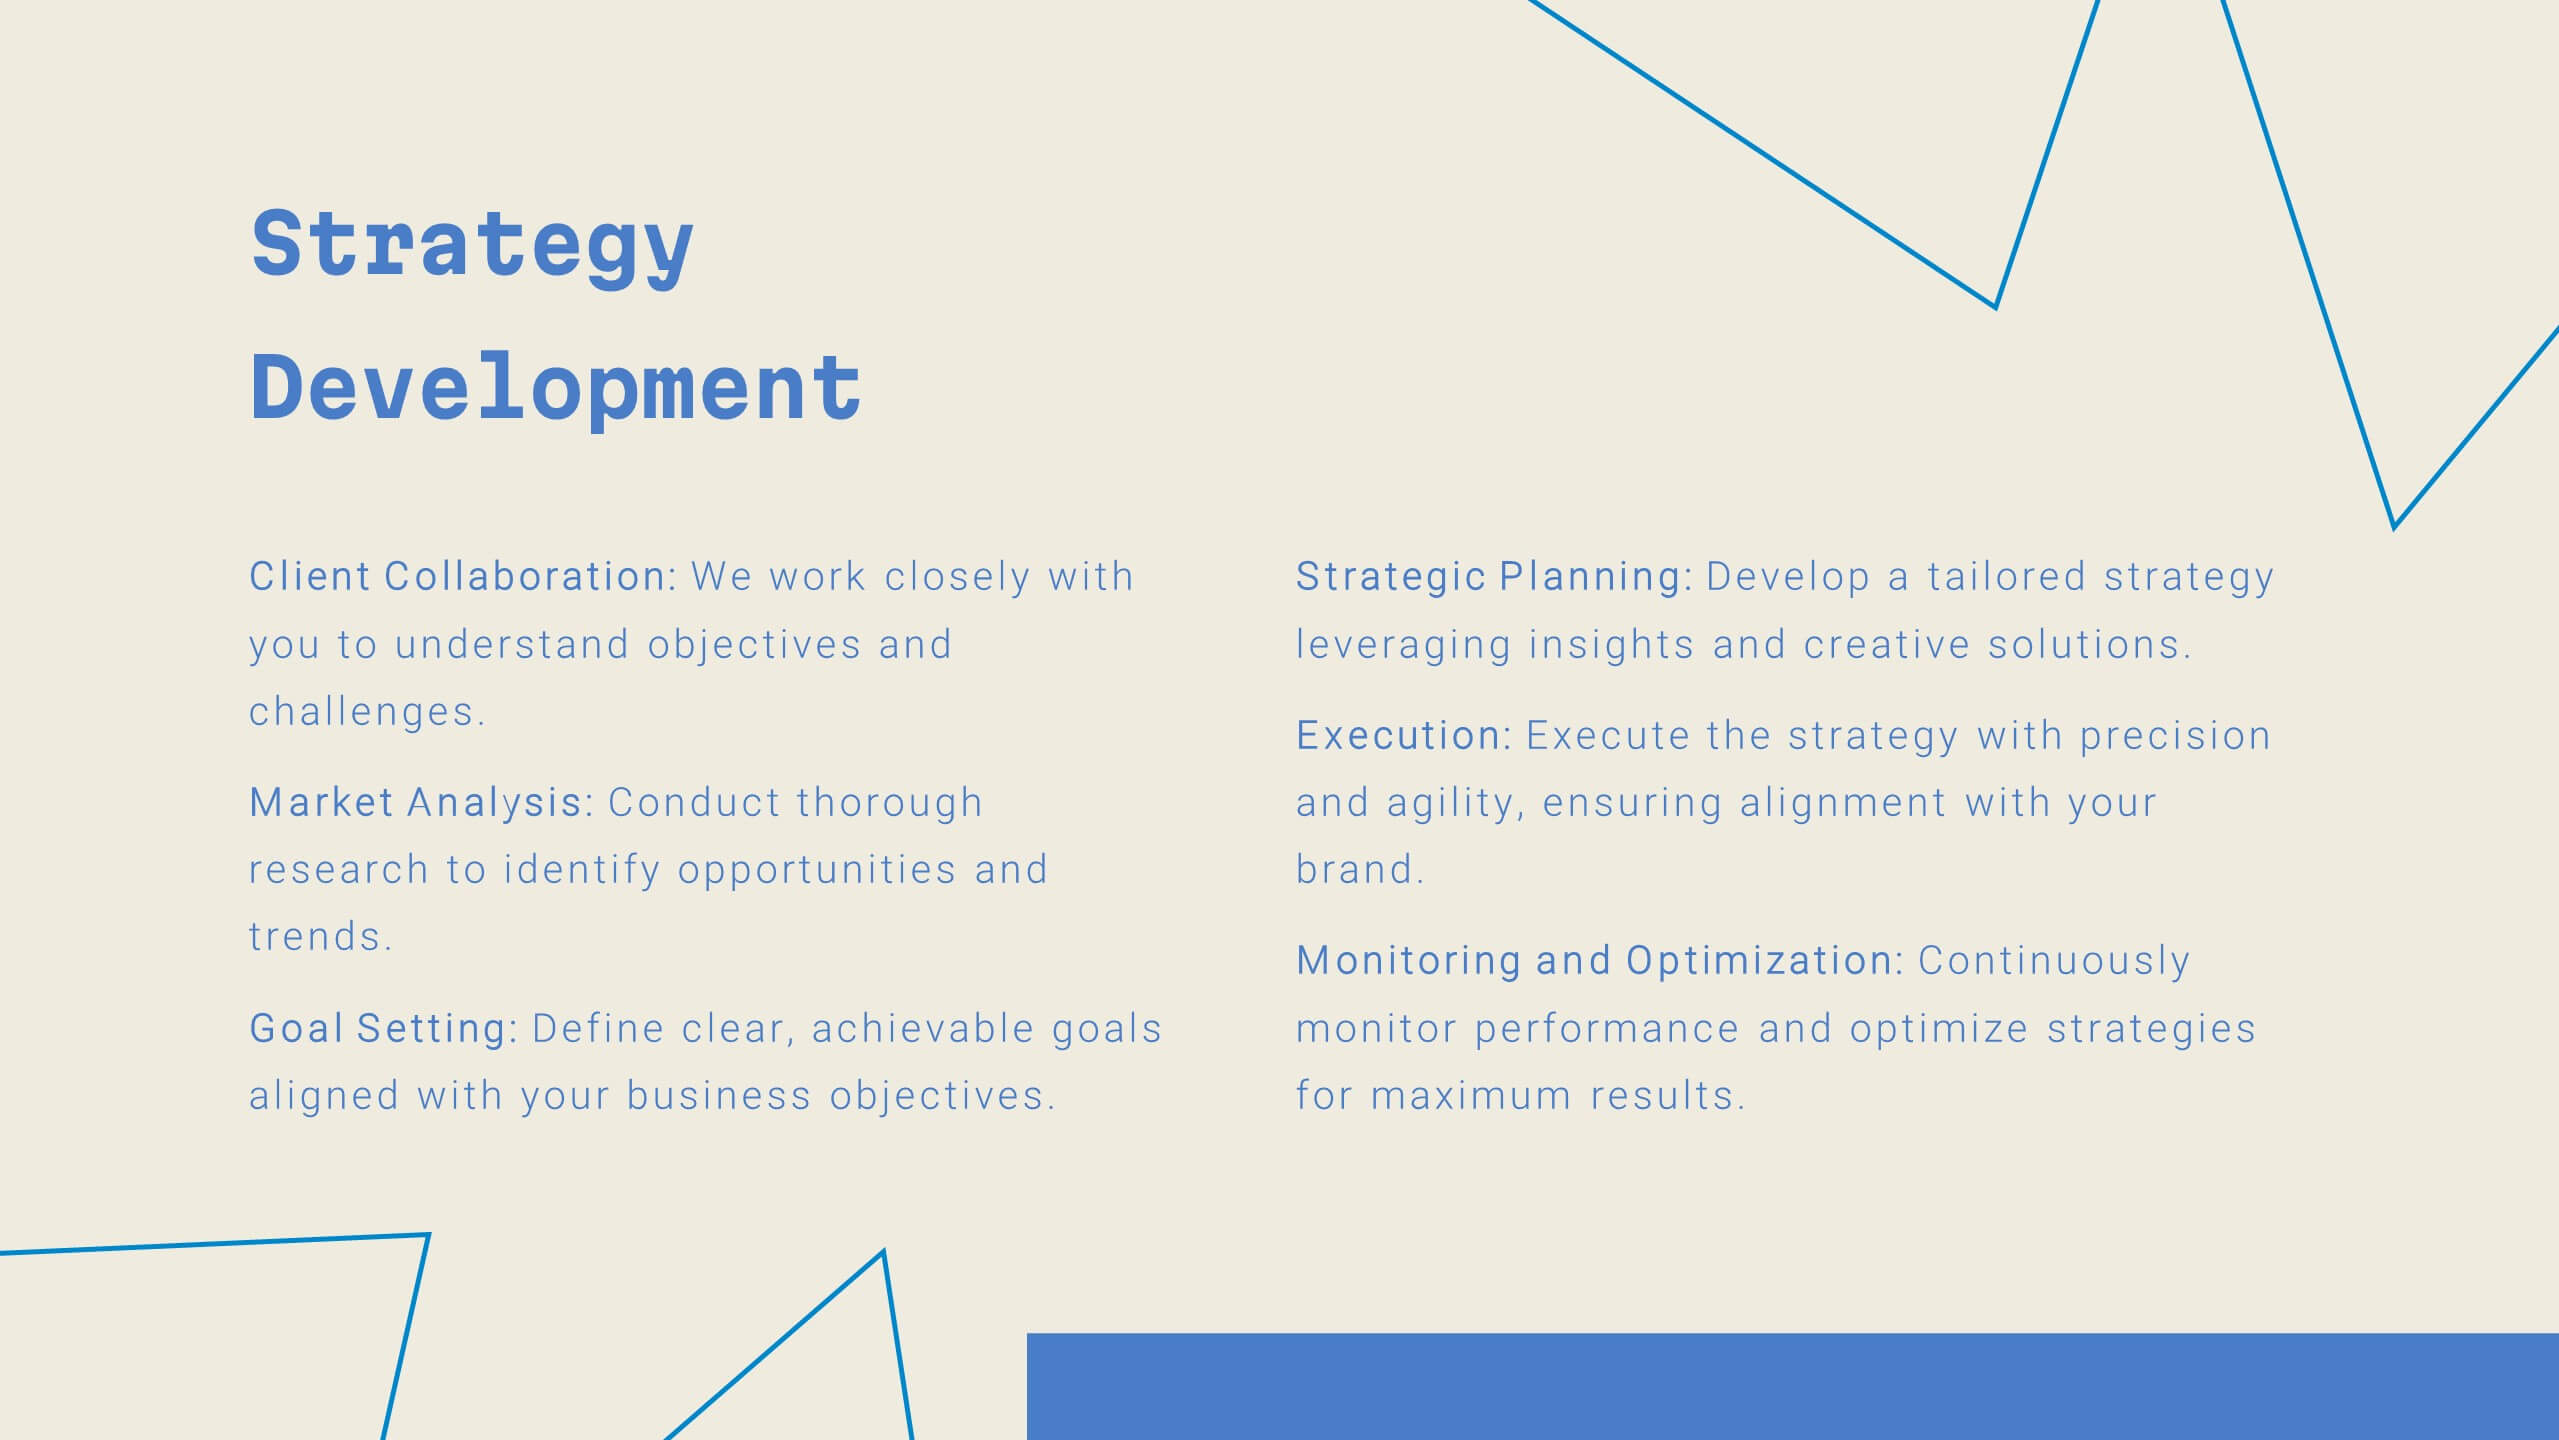
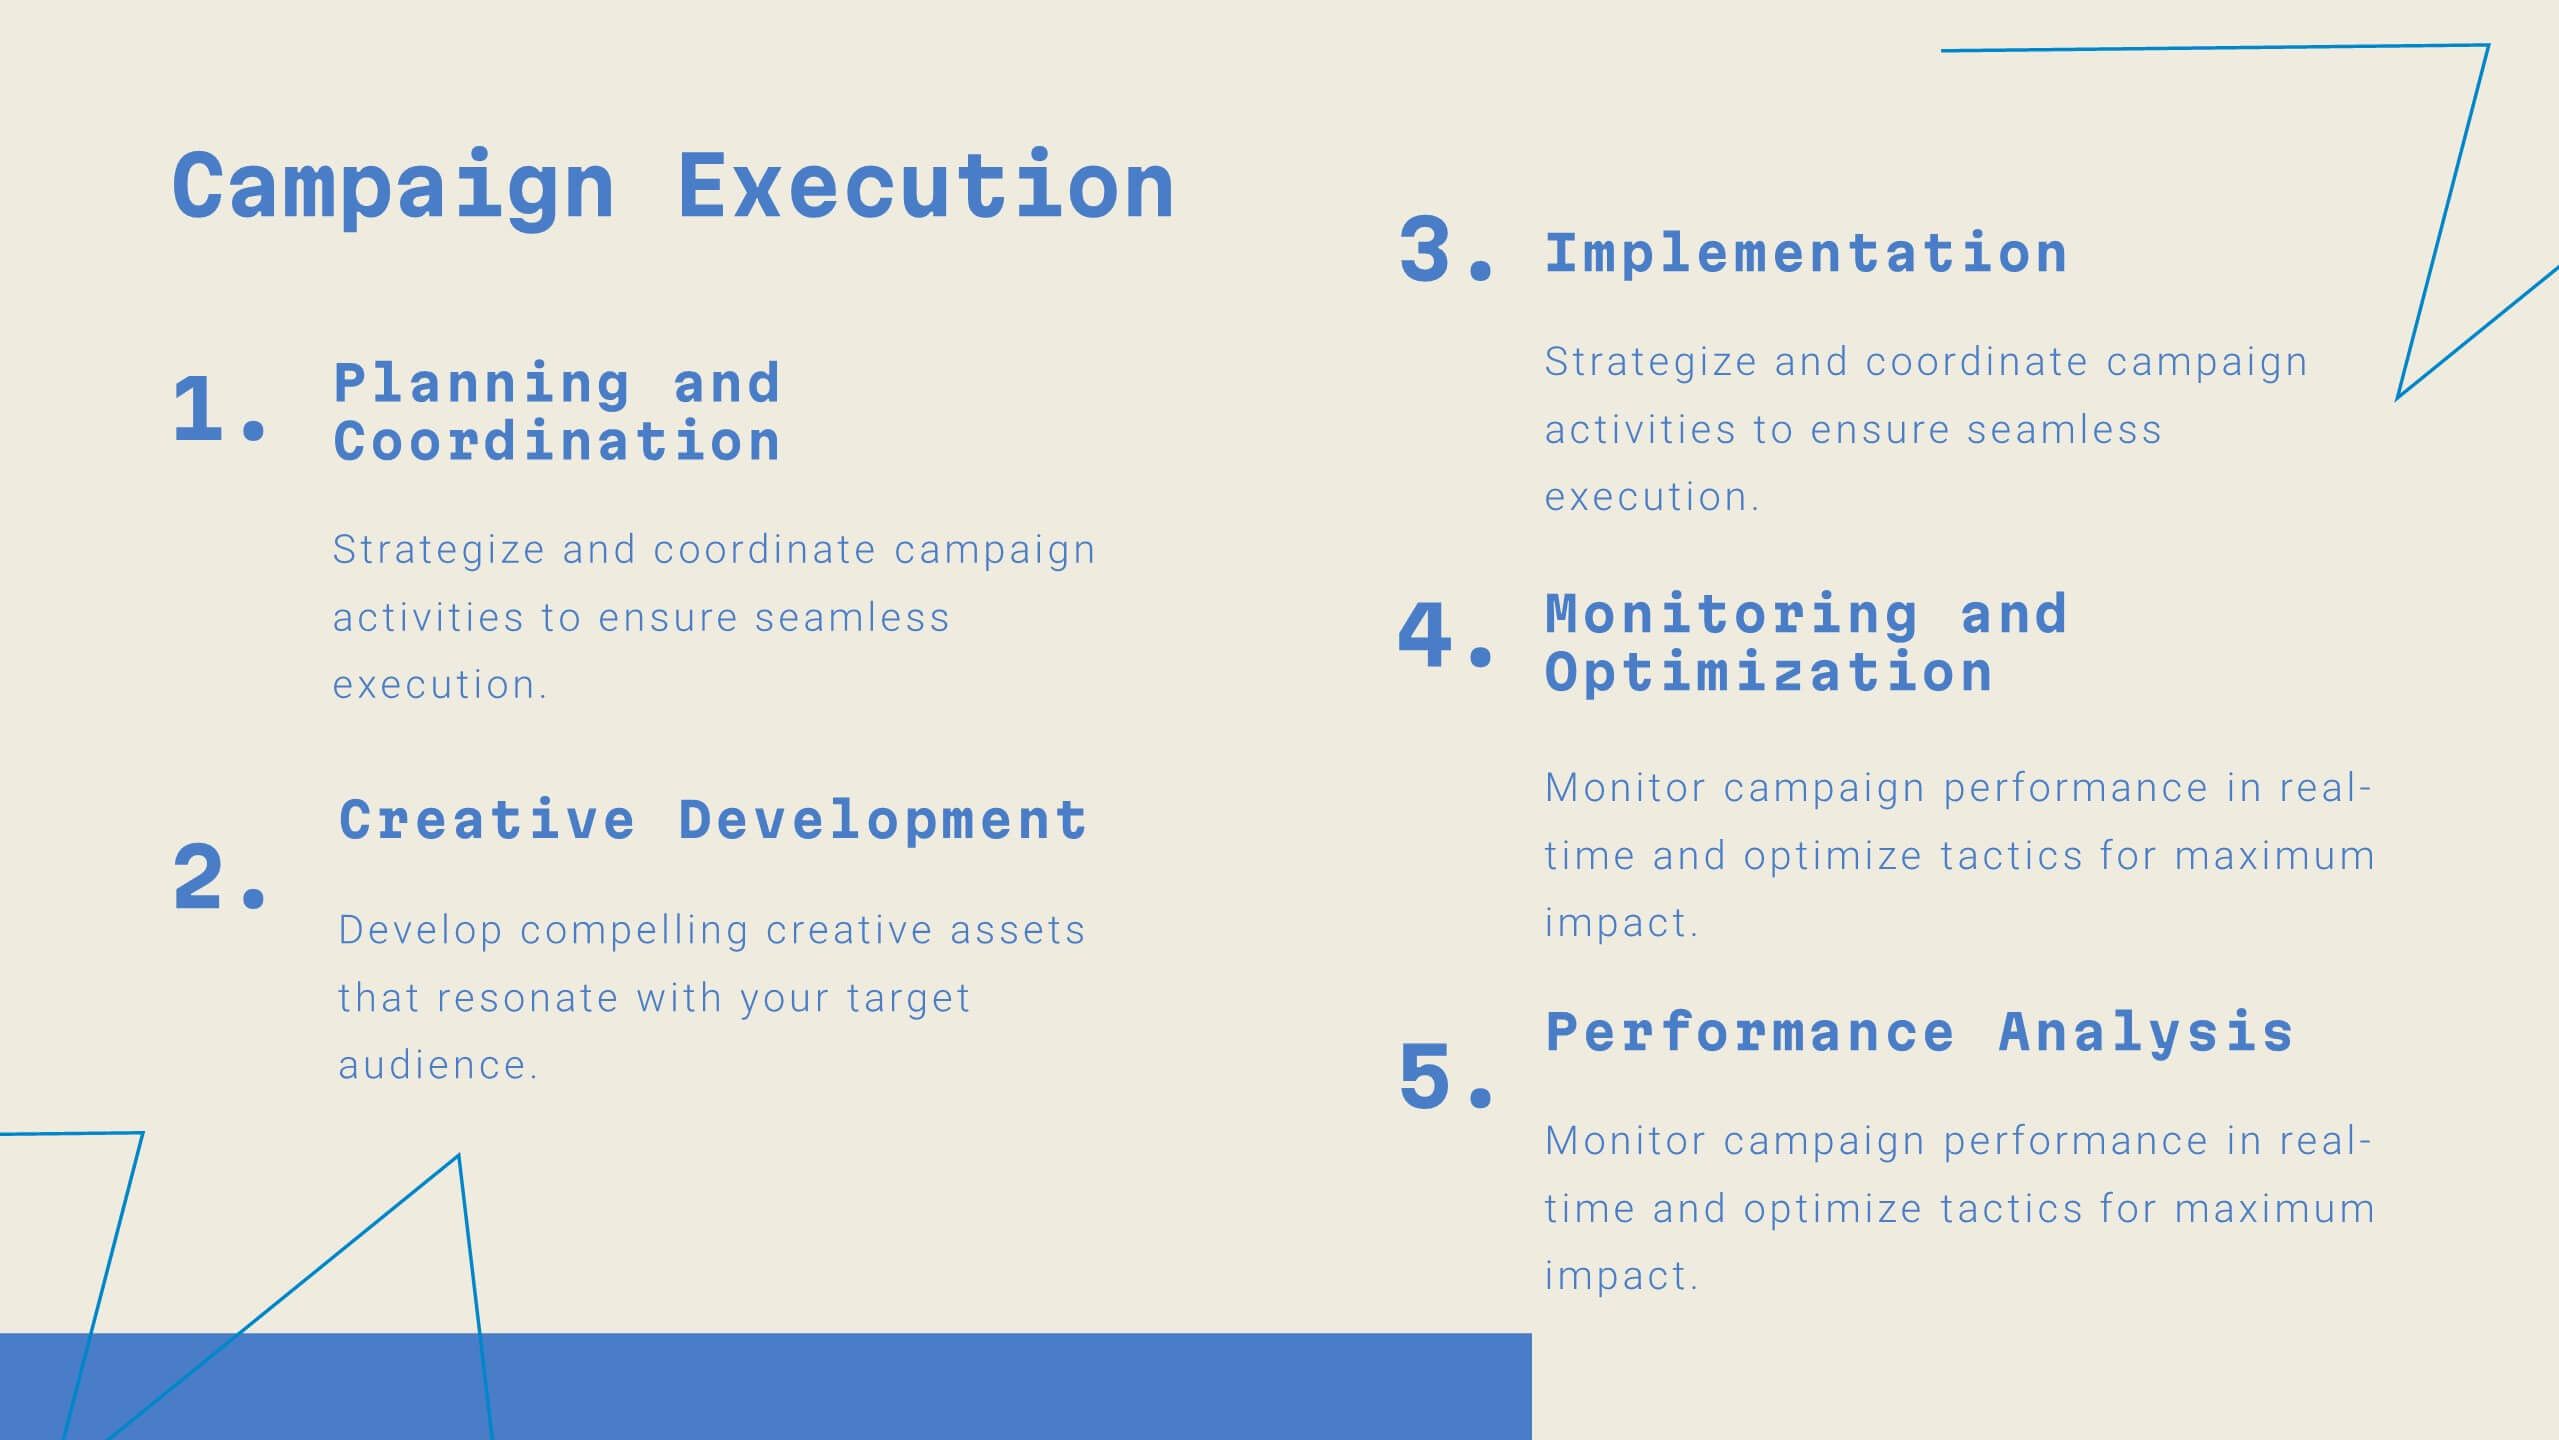
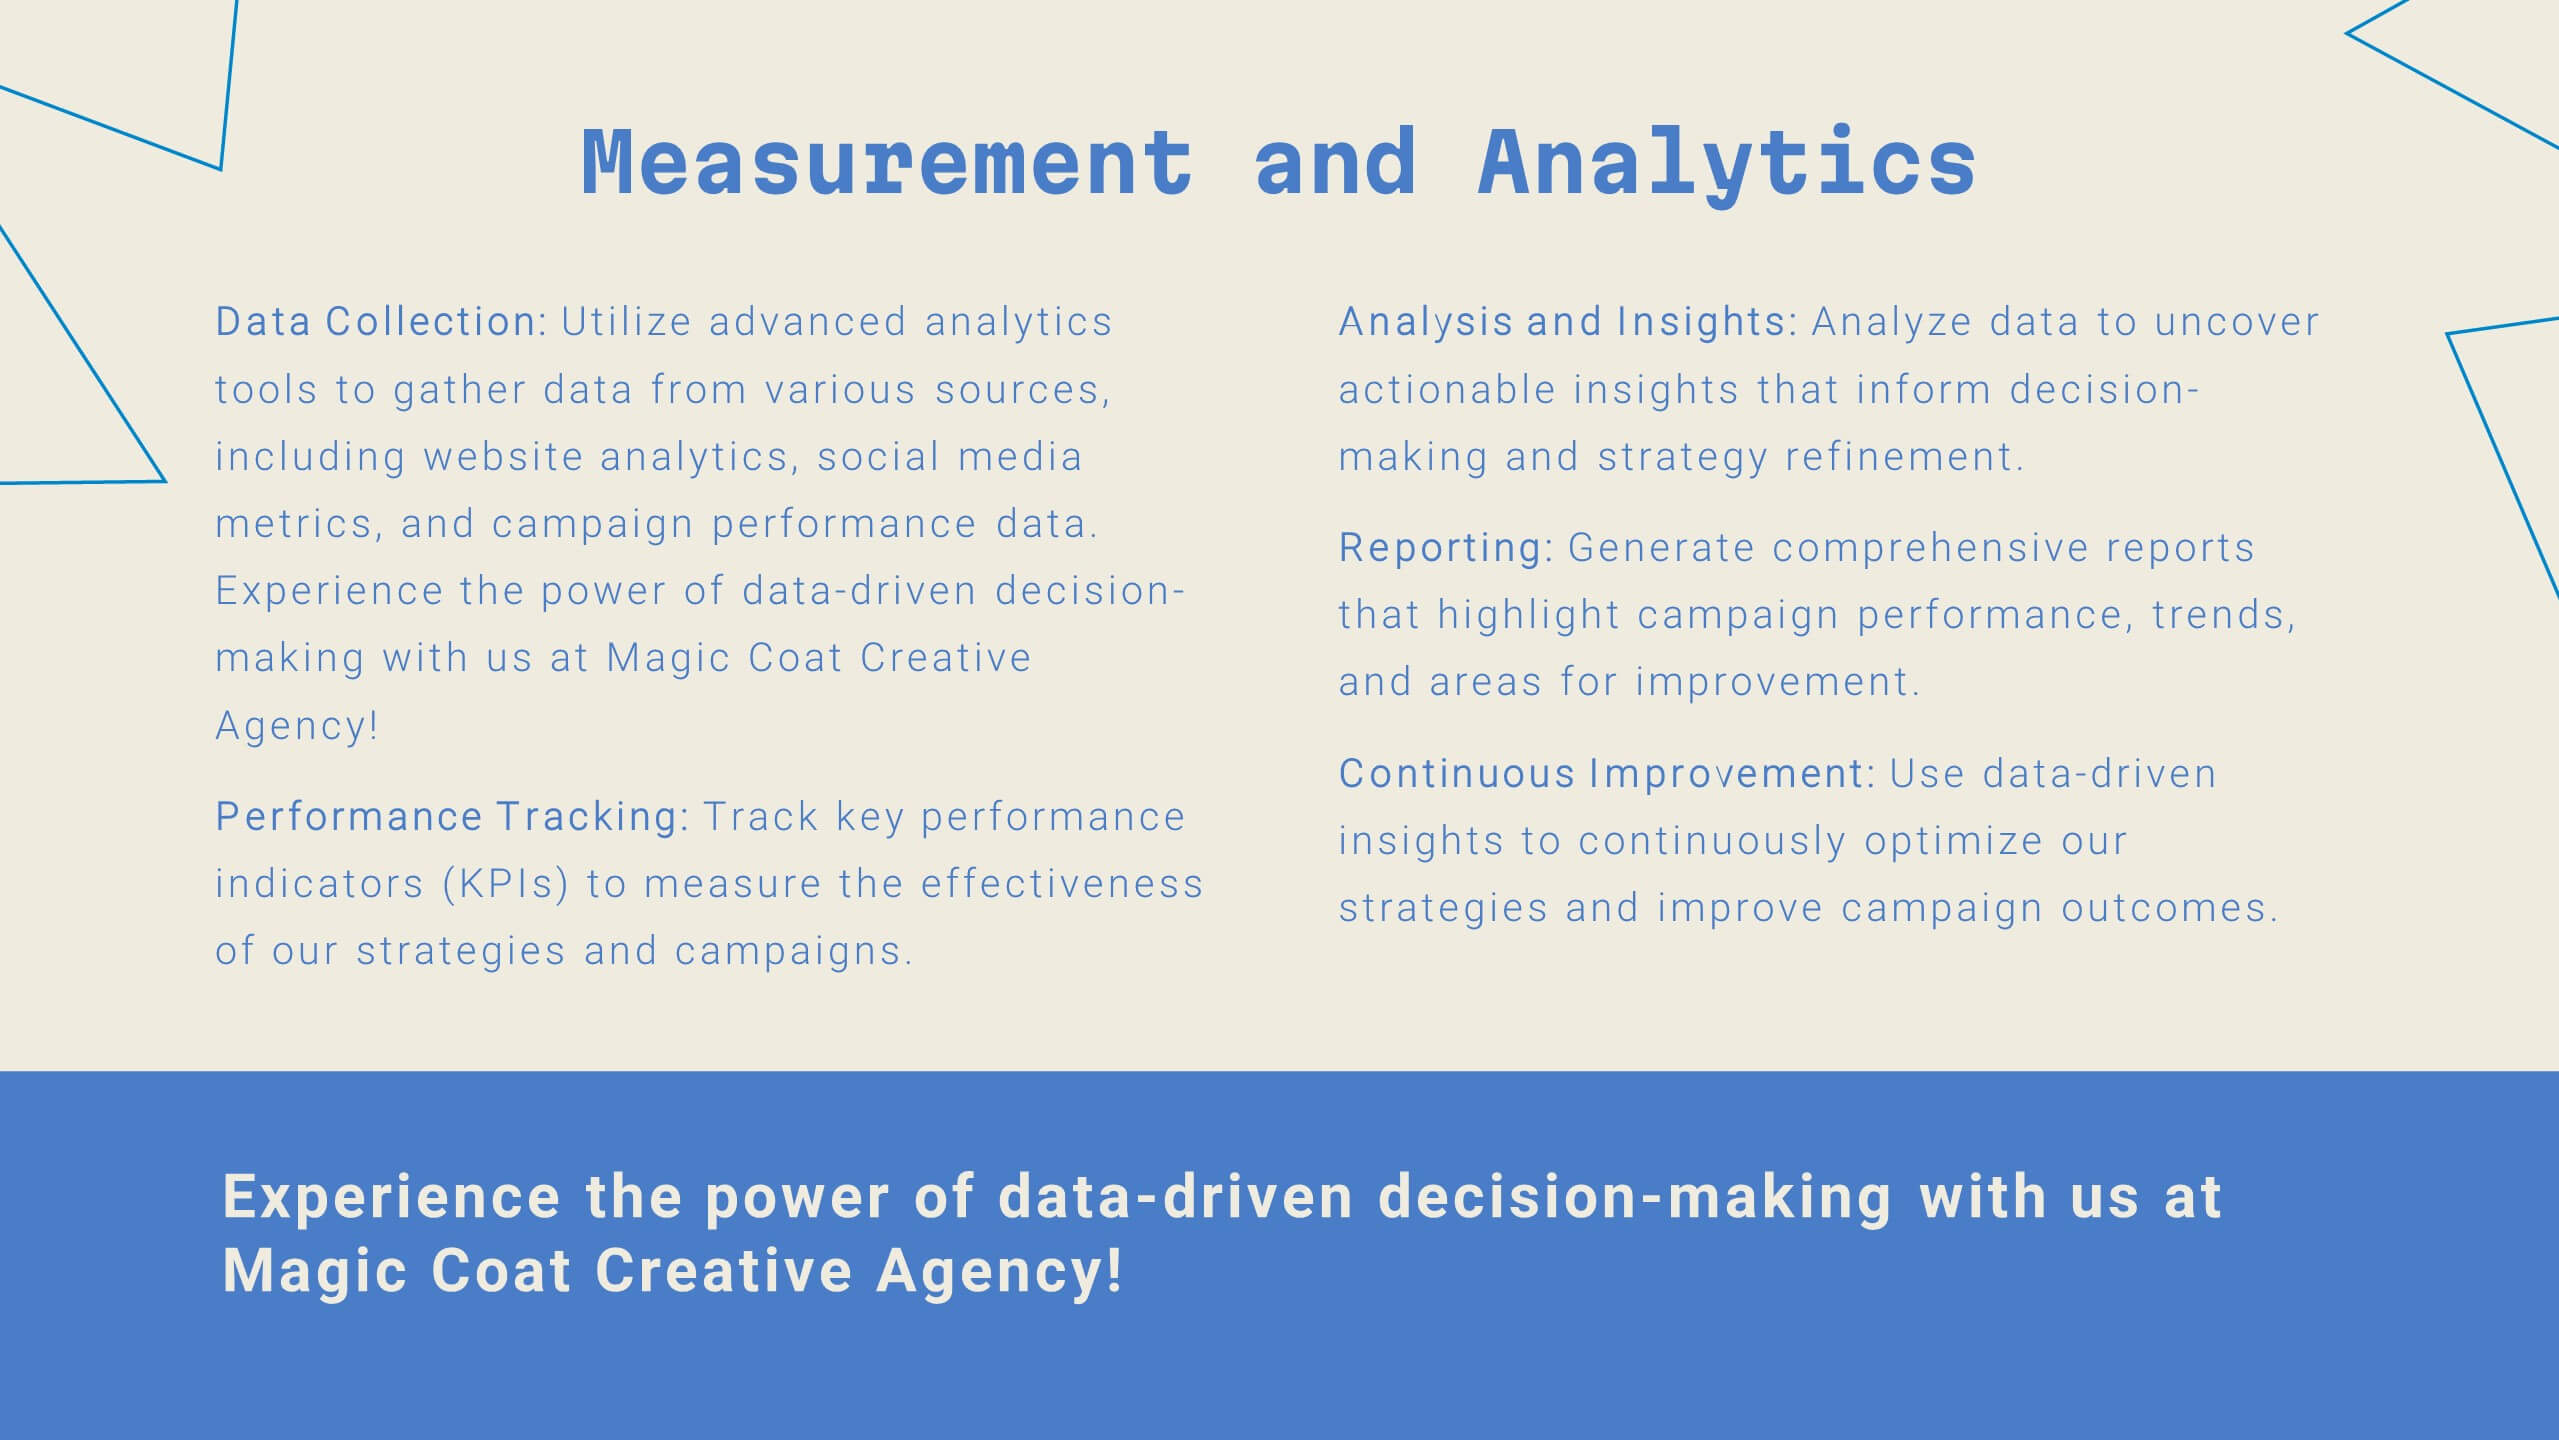
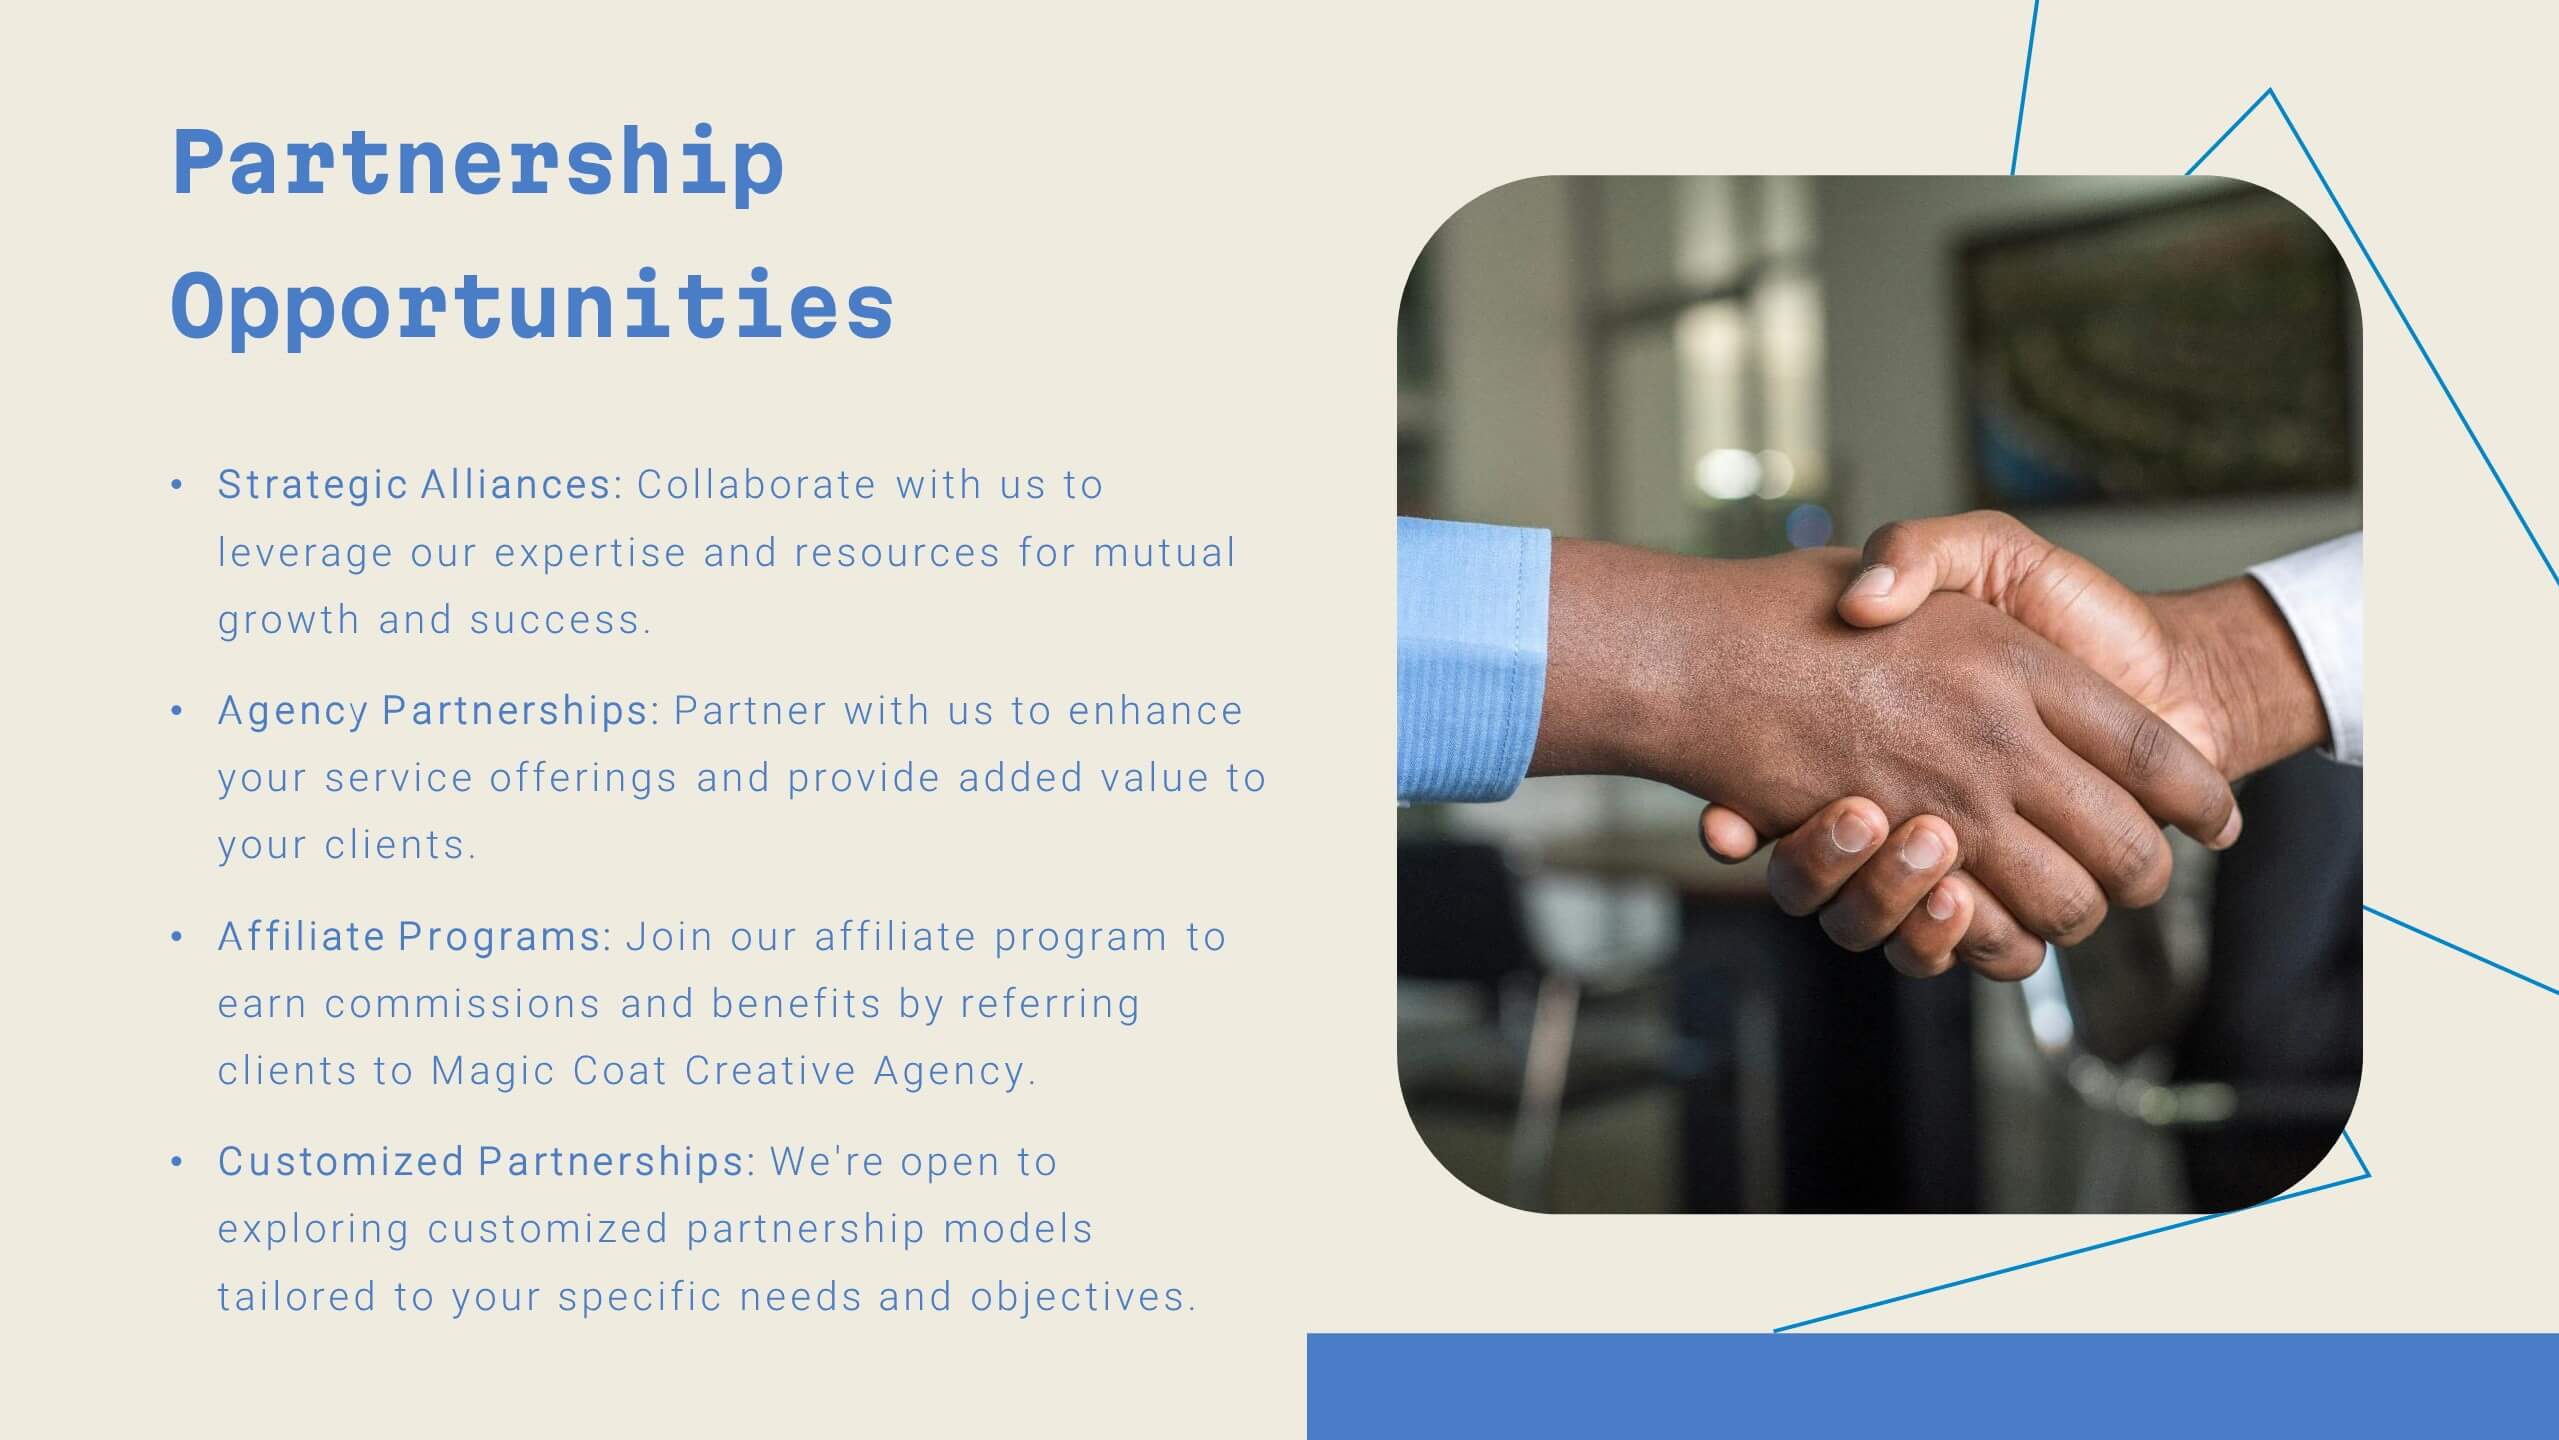
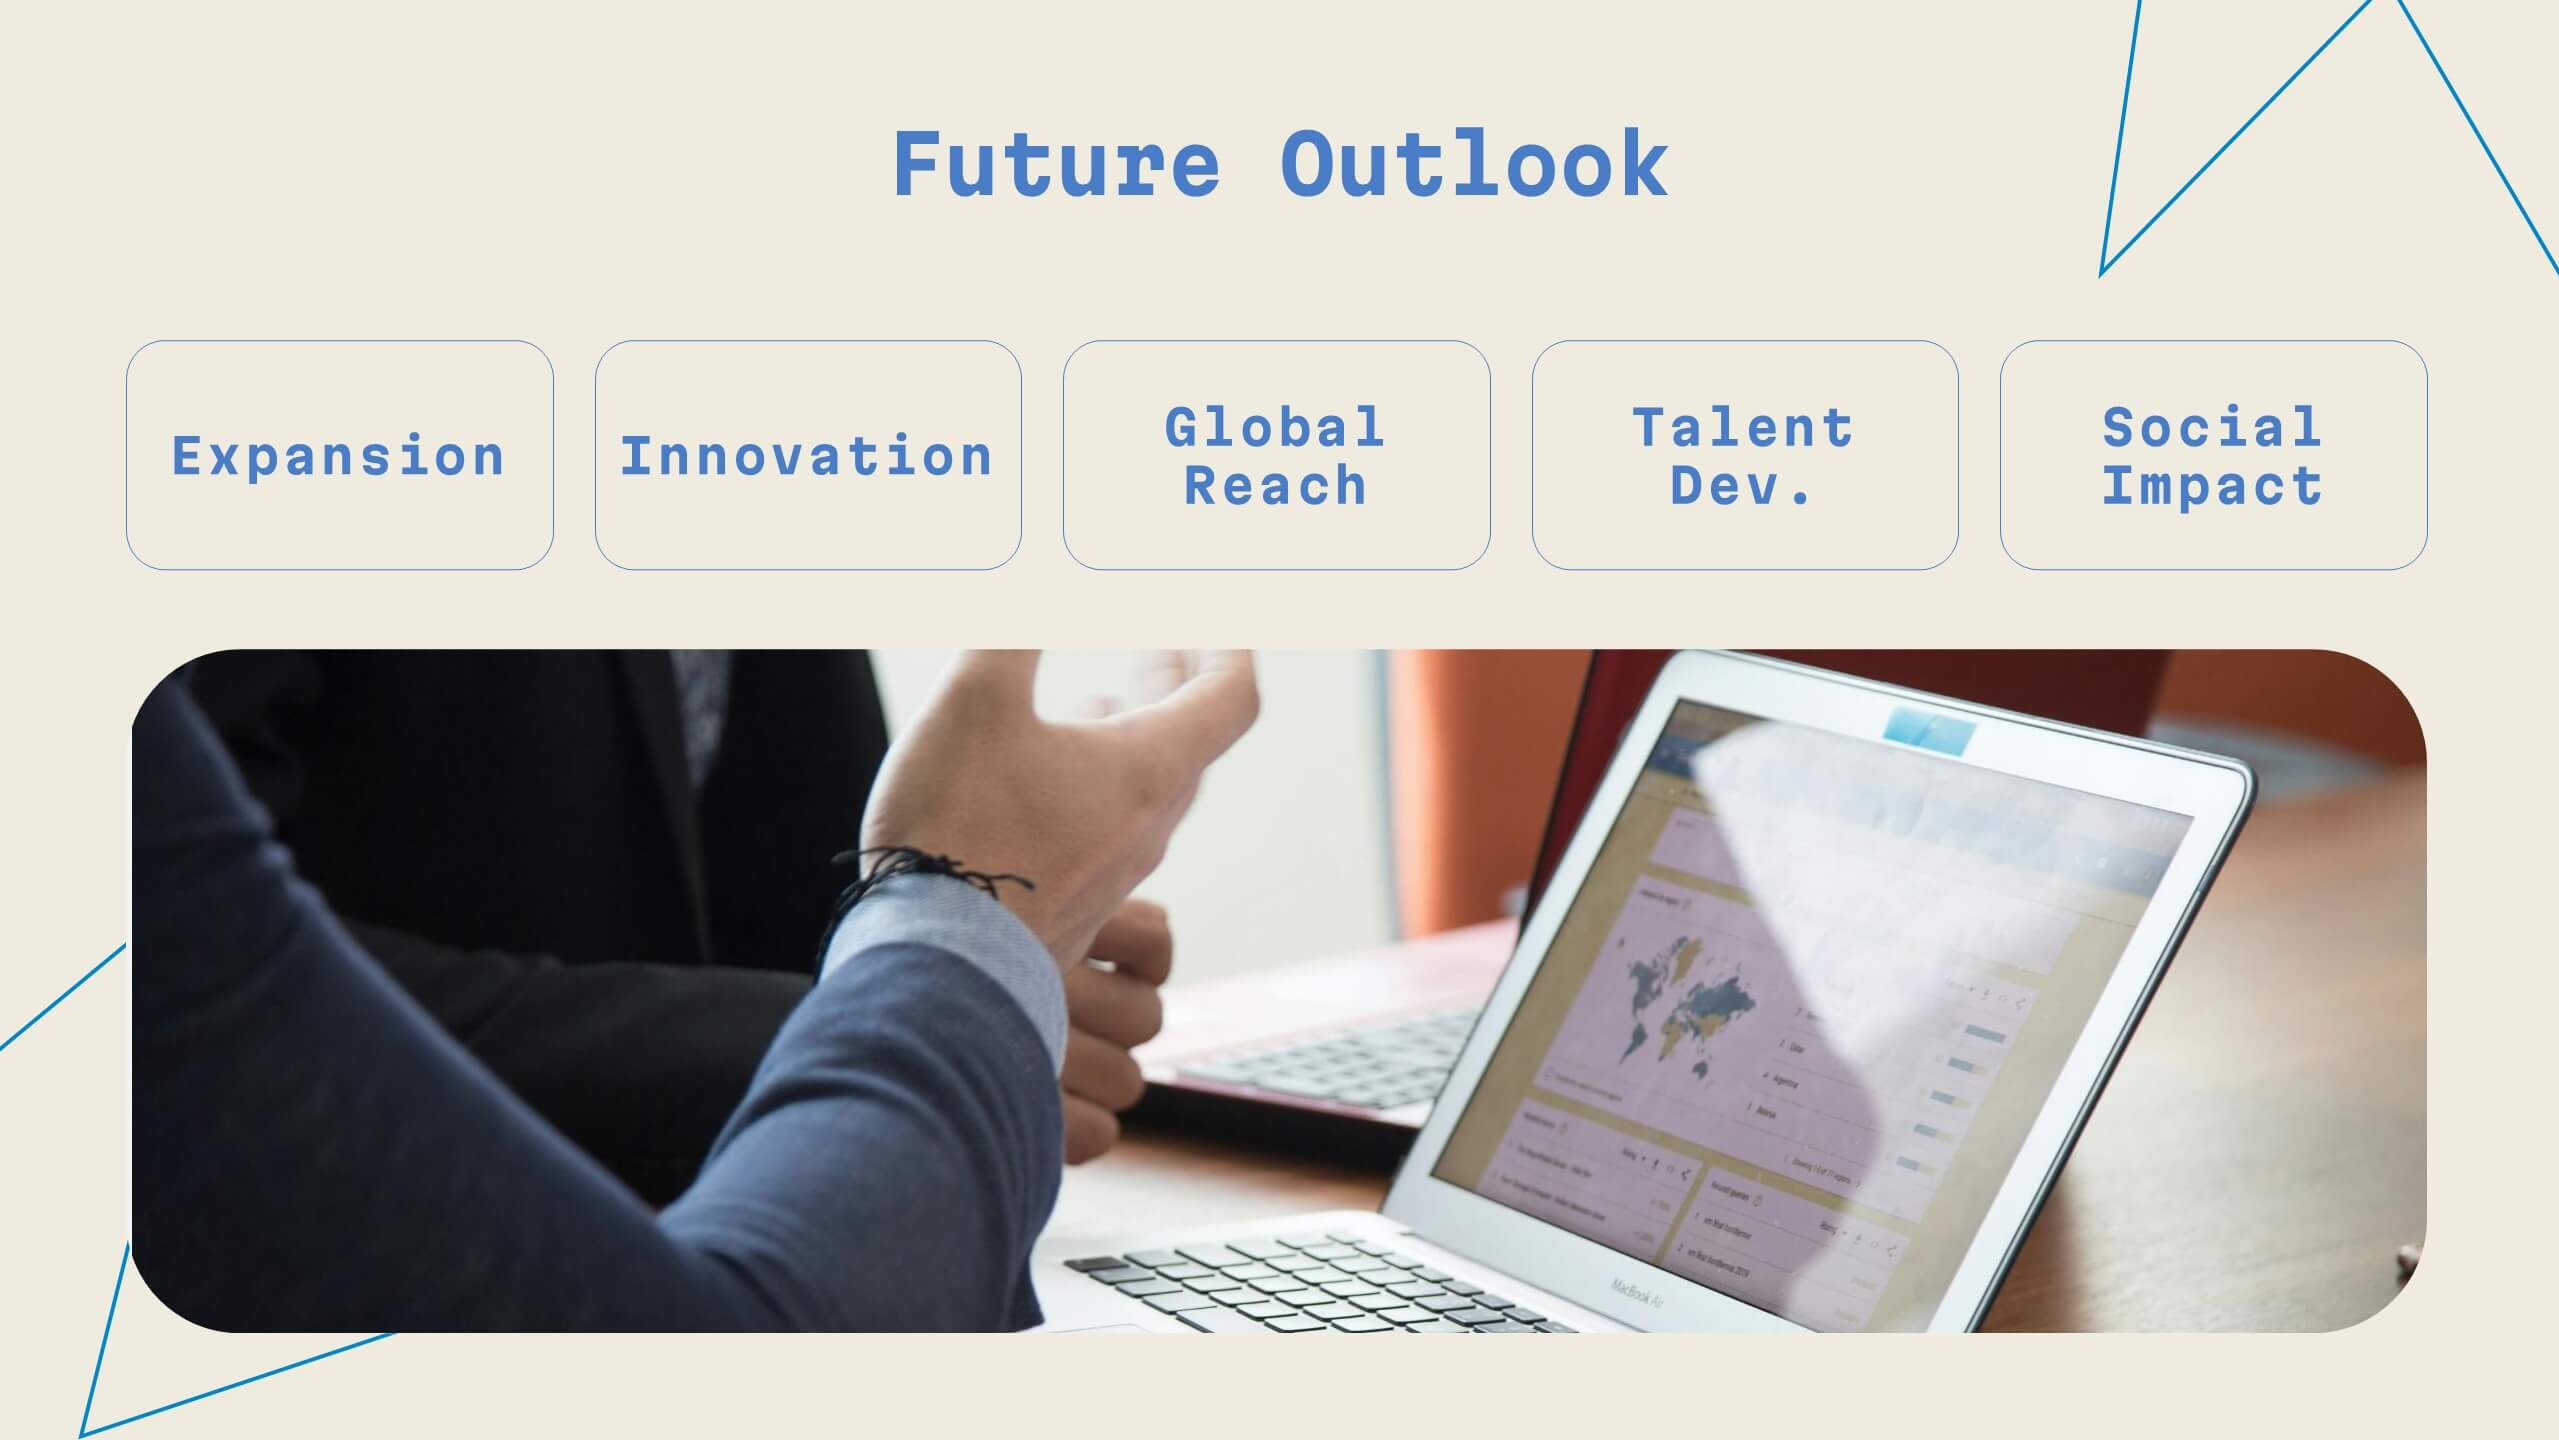
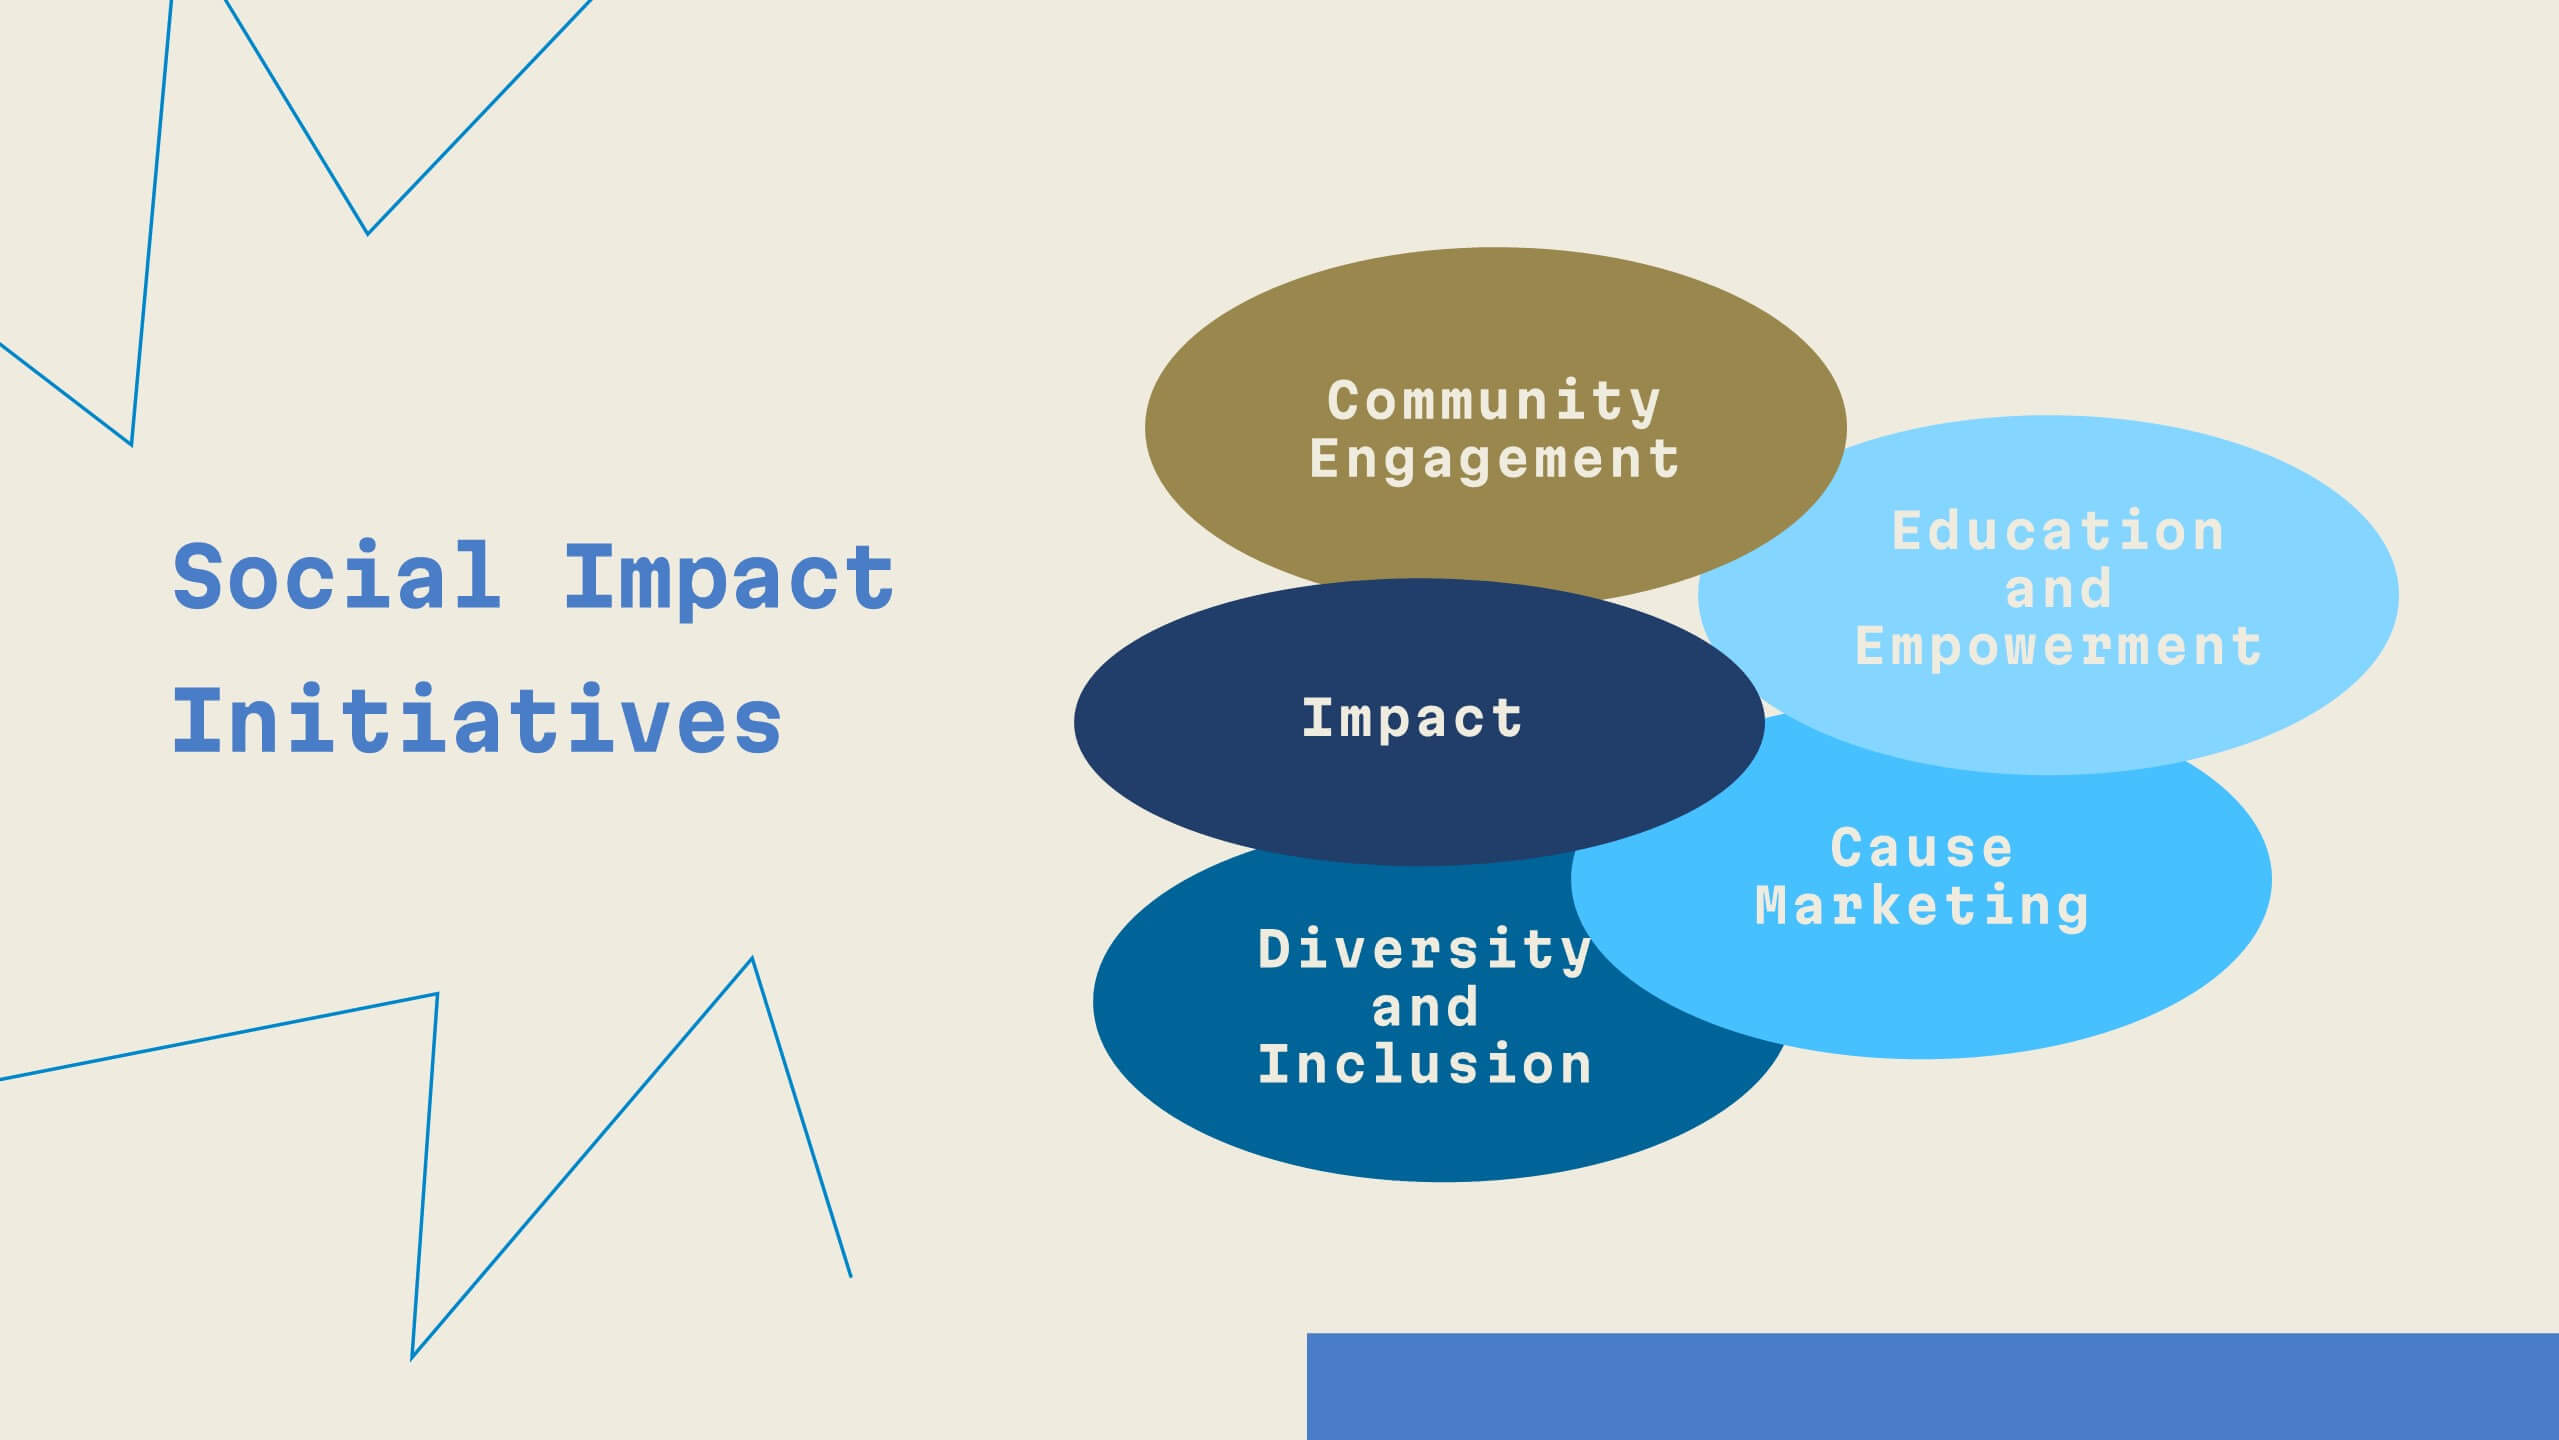
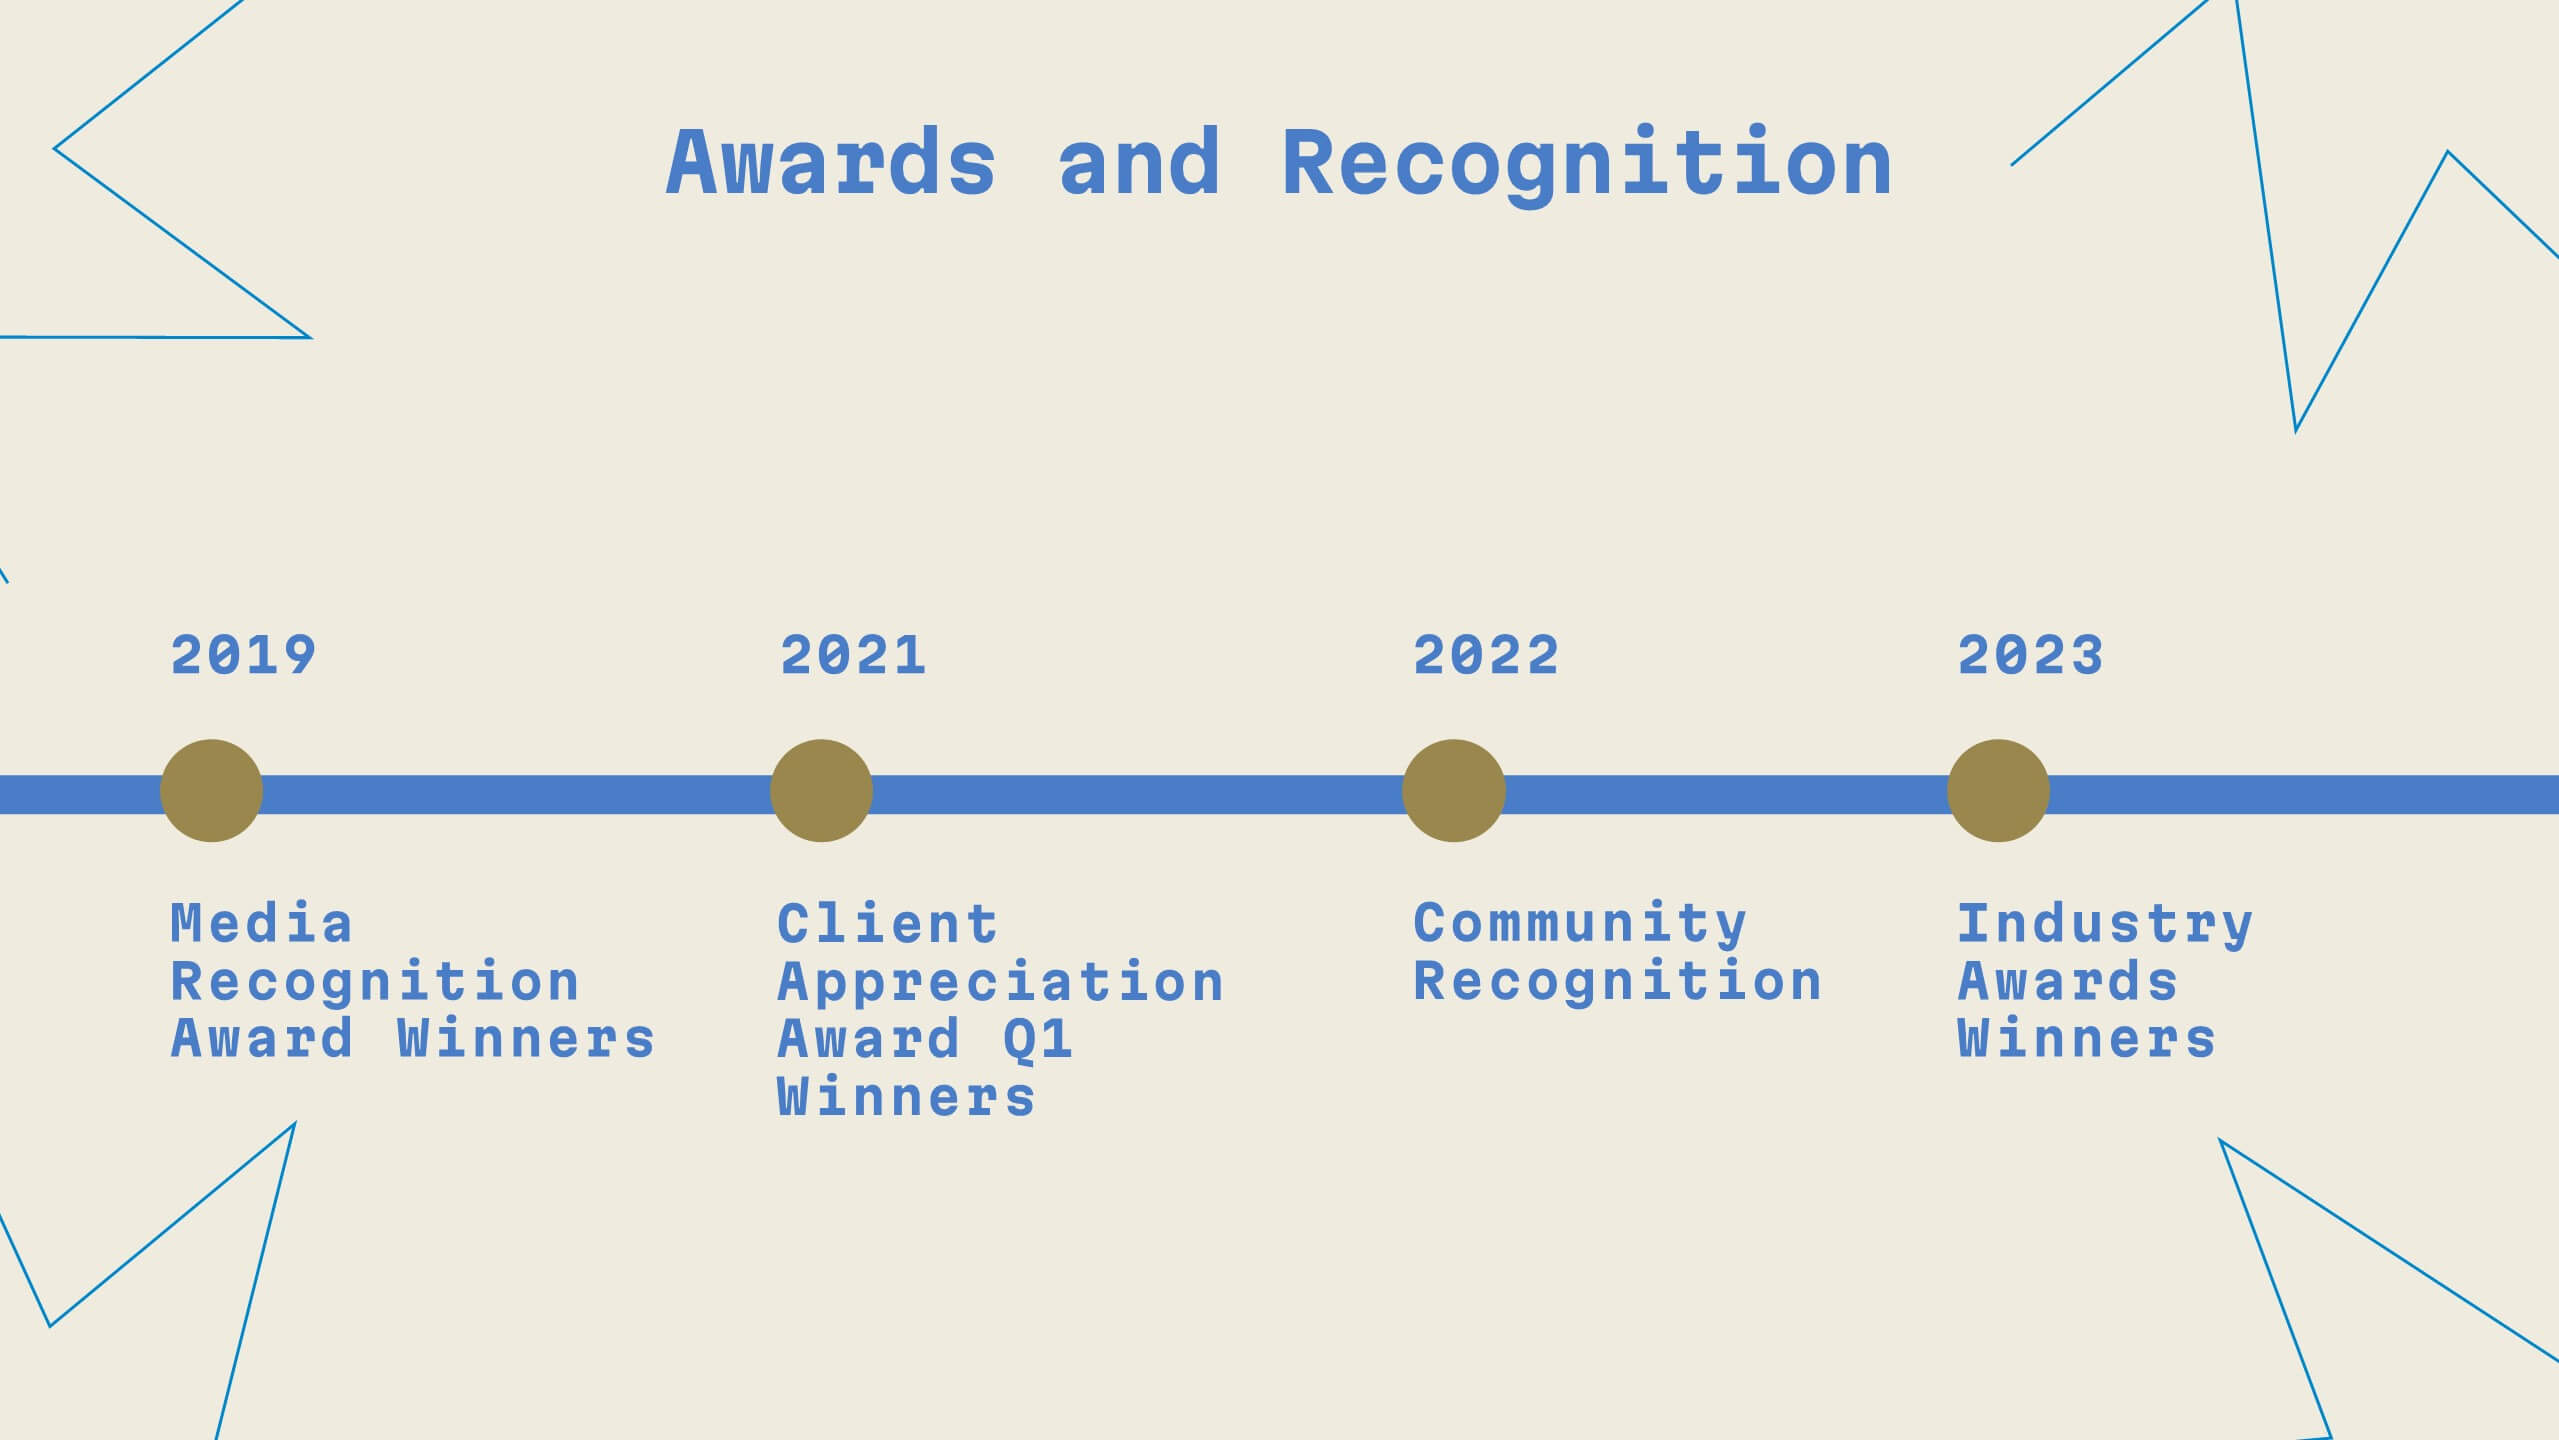
Unity Digital Agency Strategy Plan Presentation
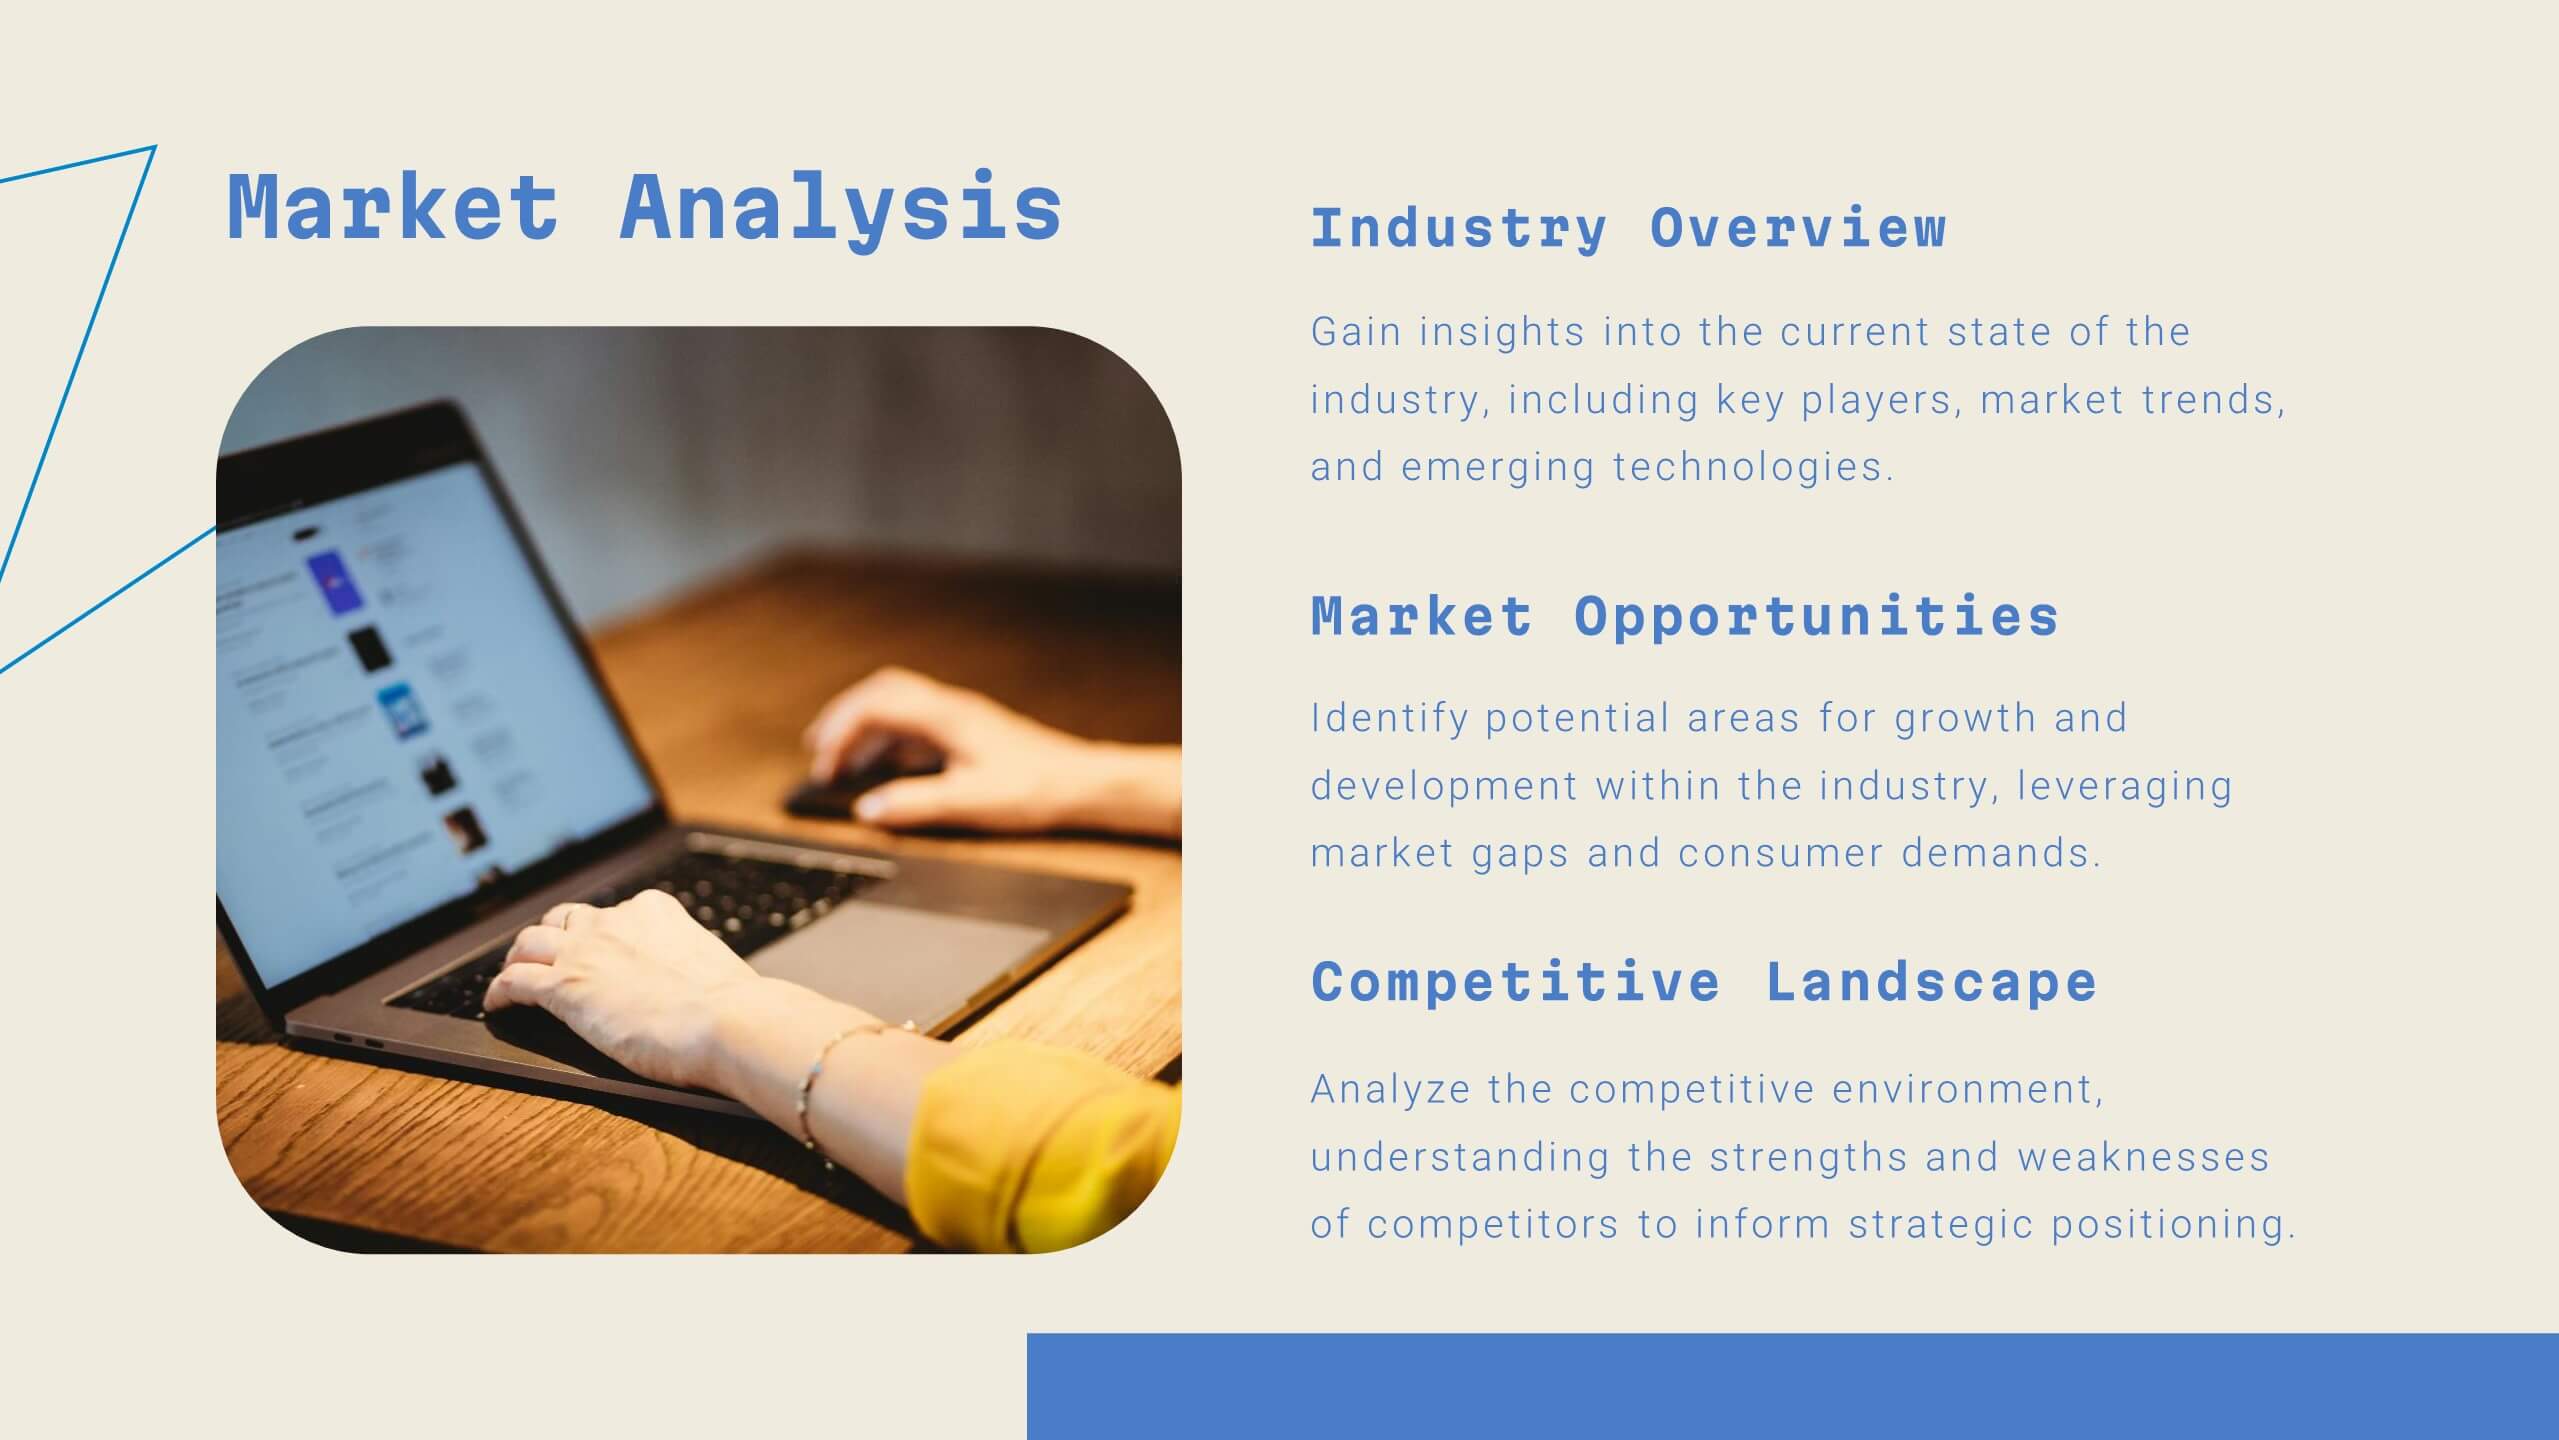
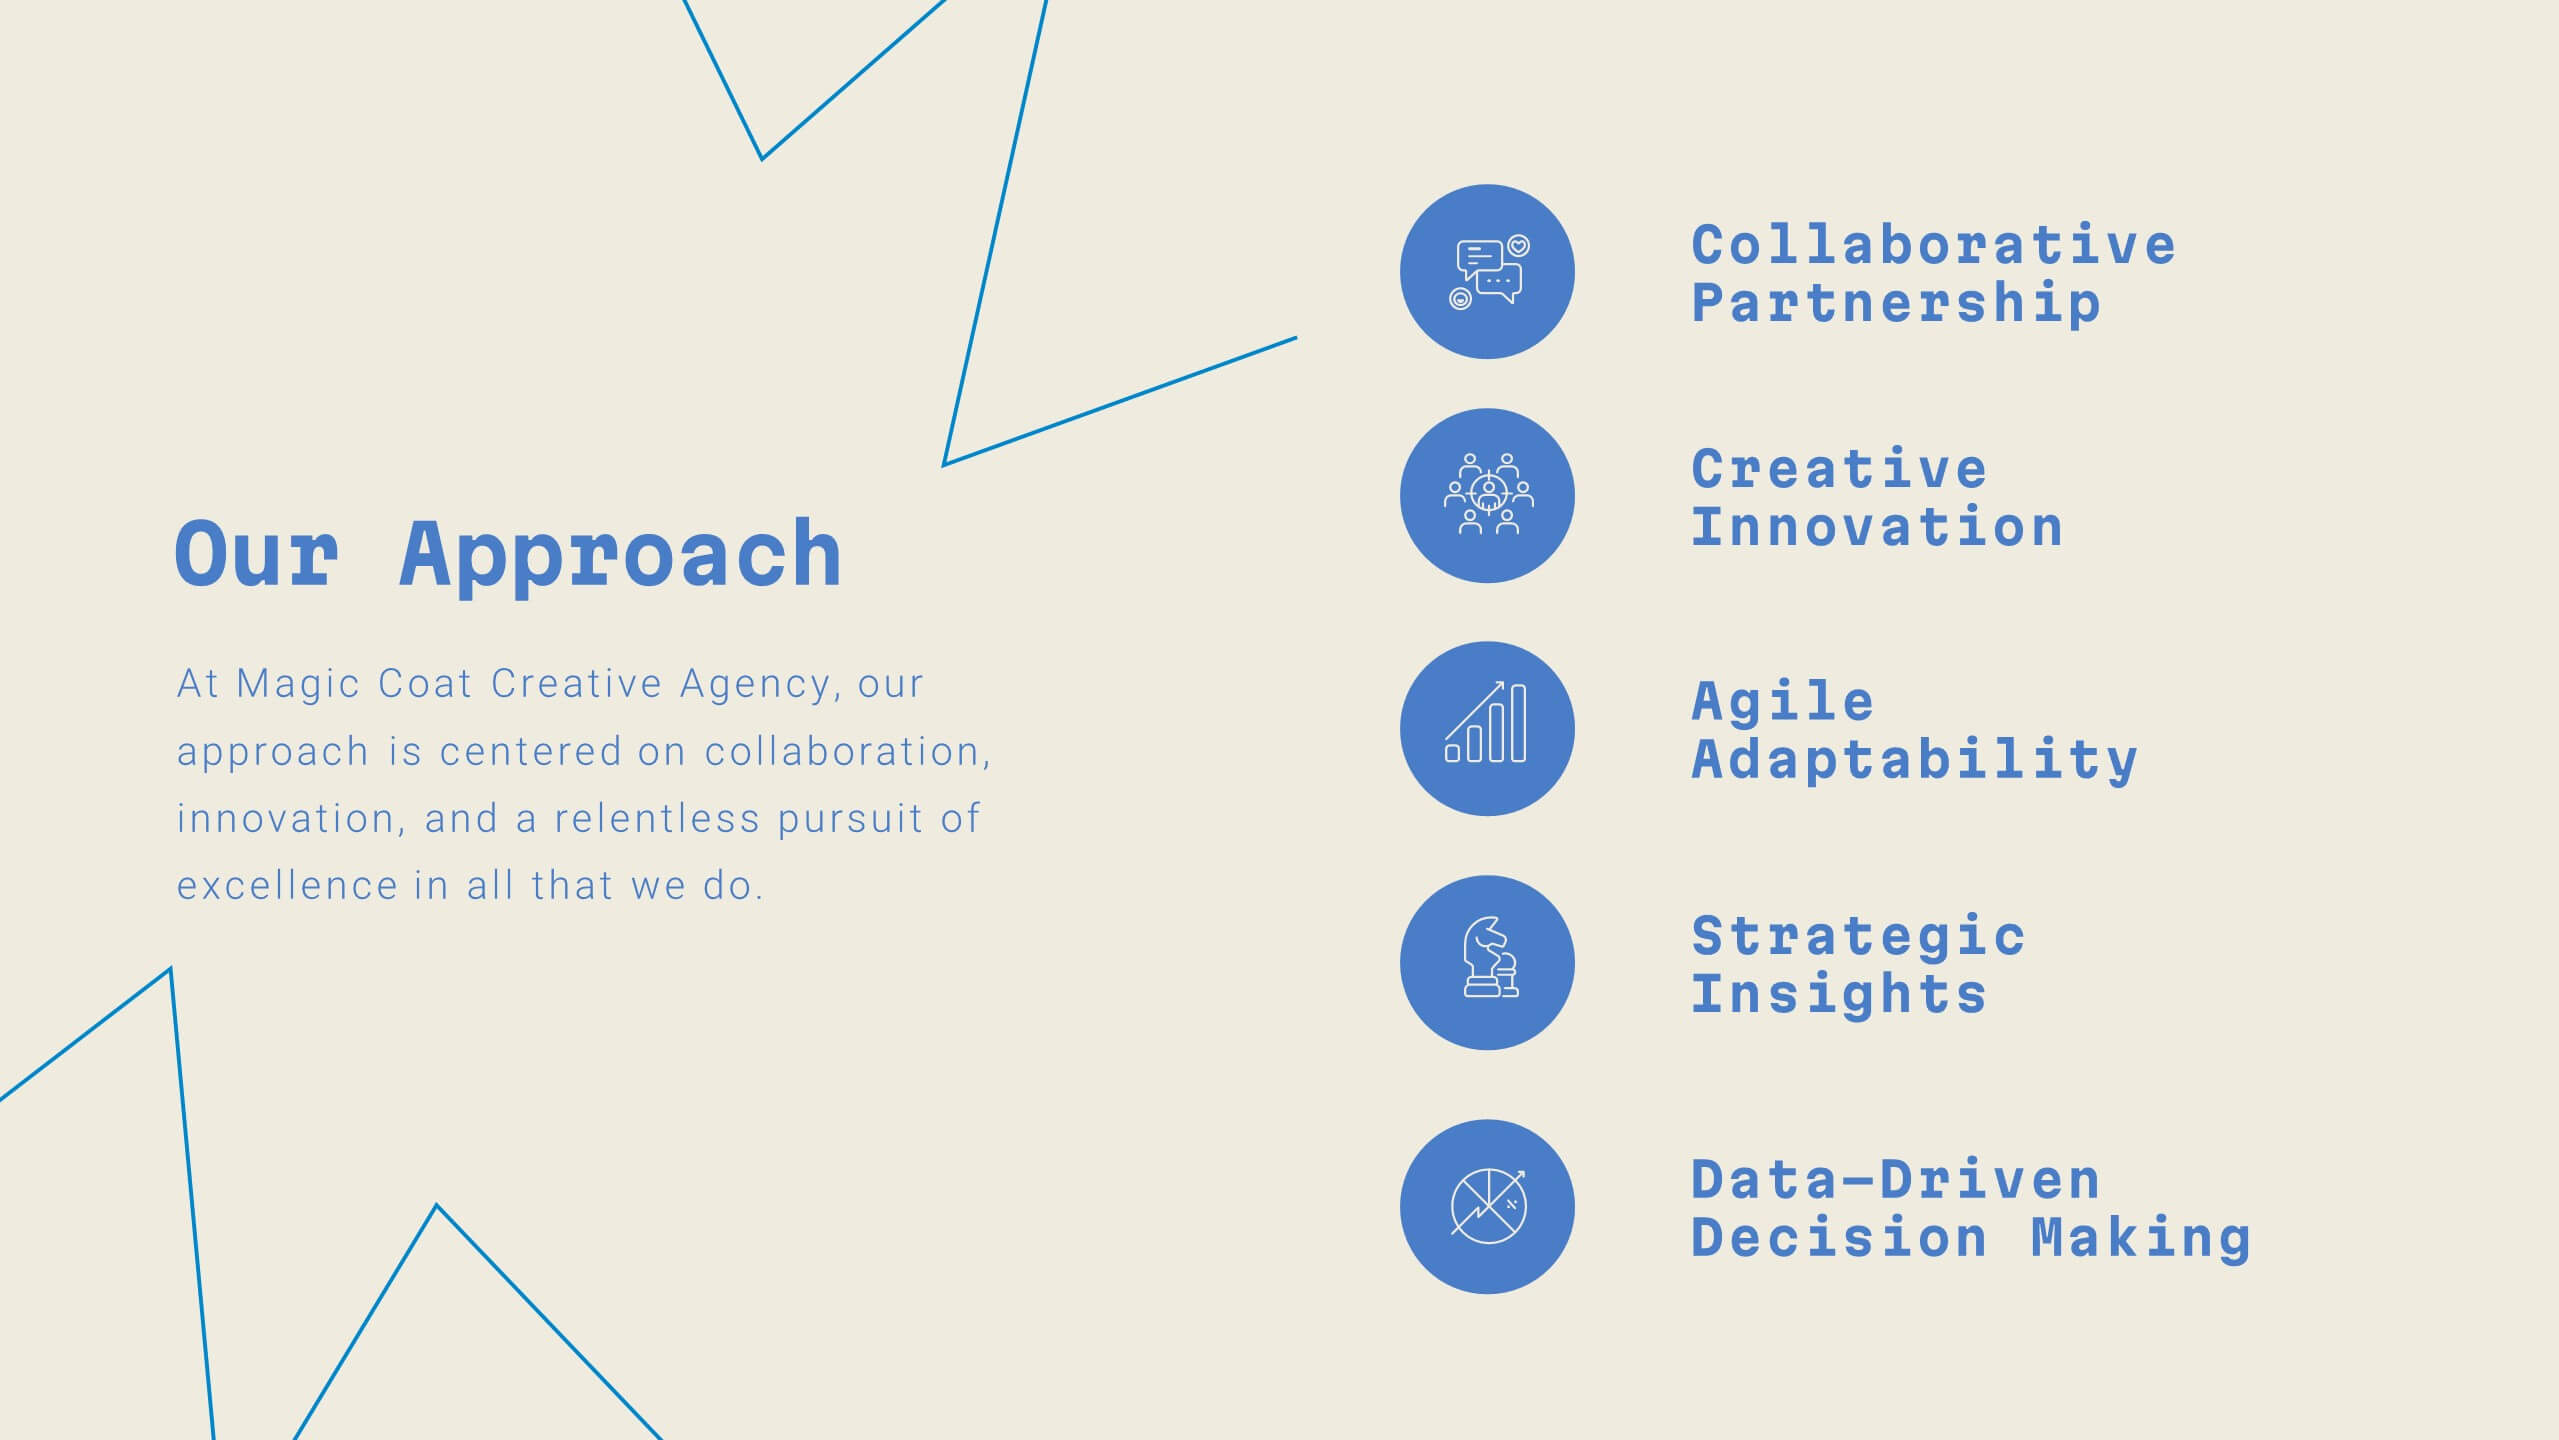
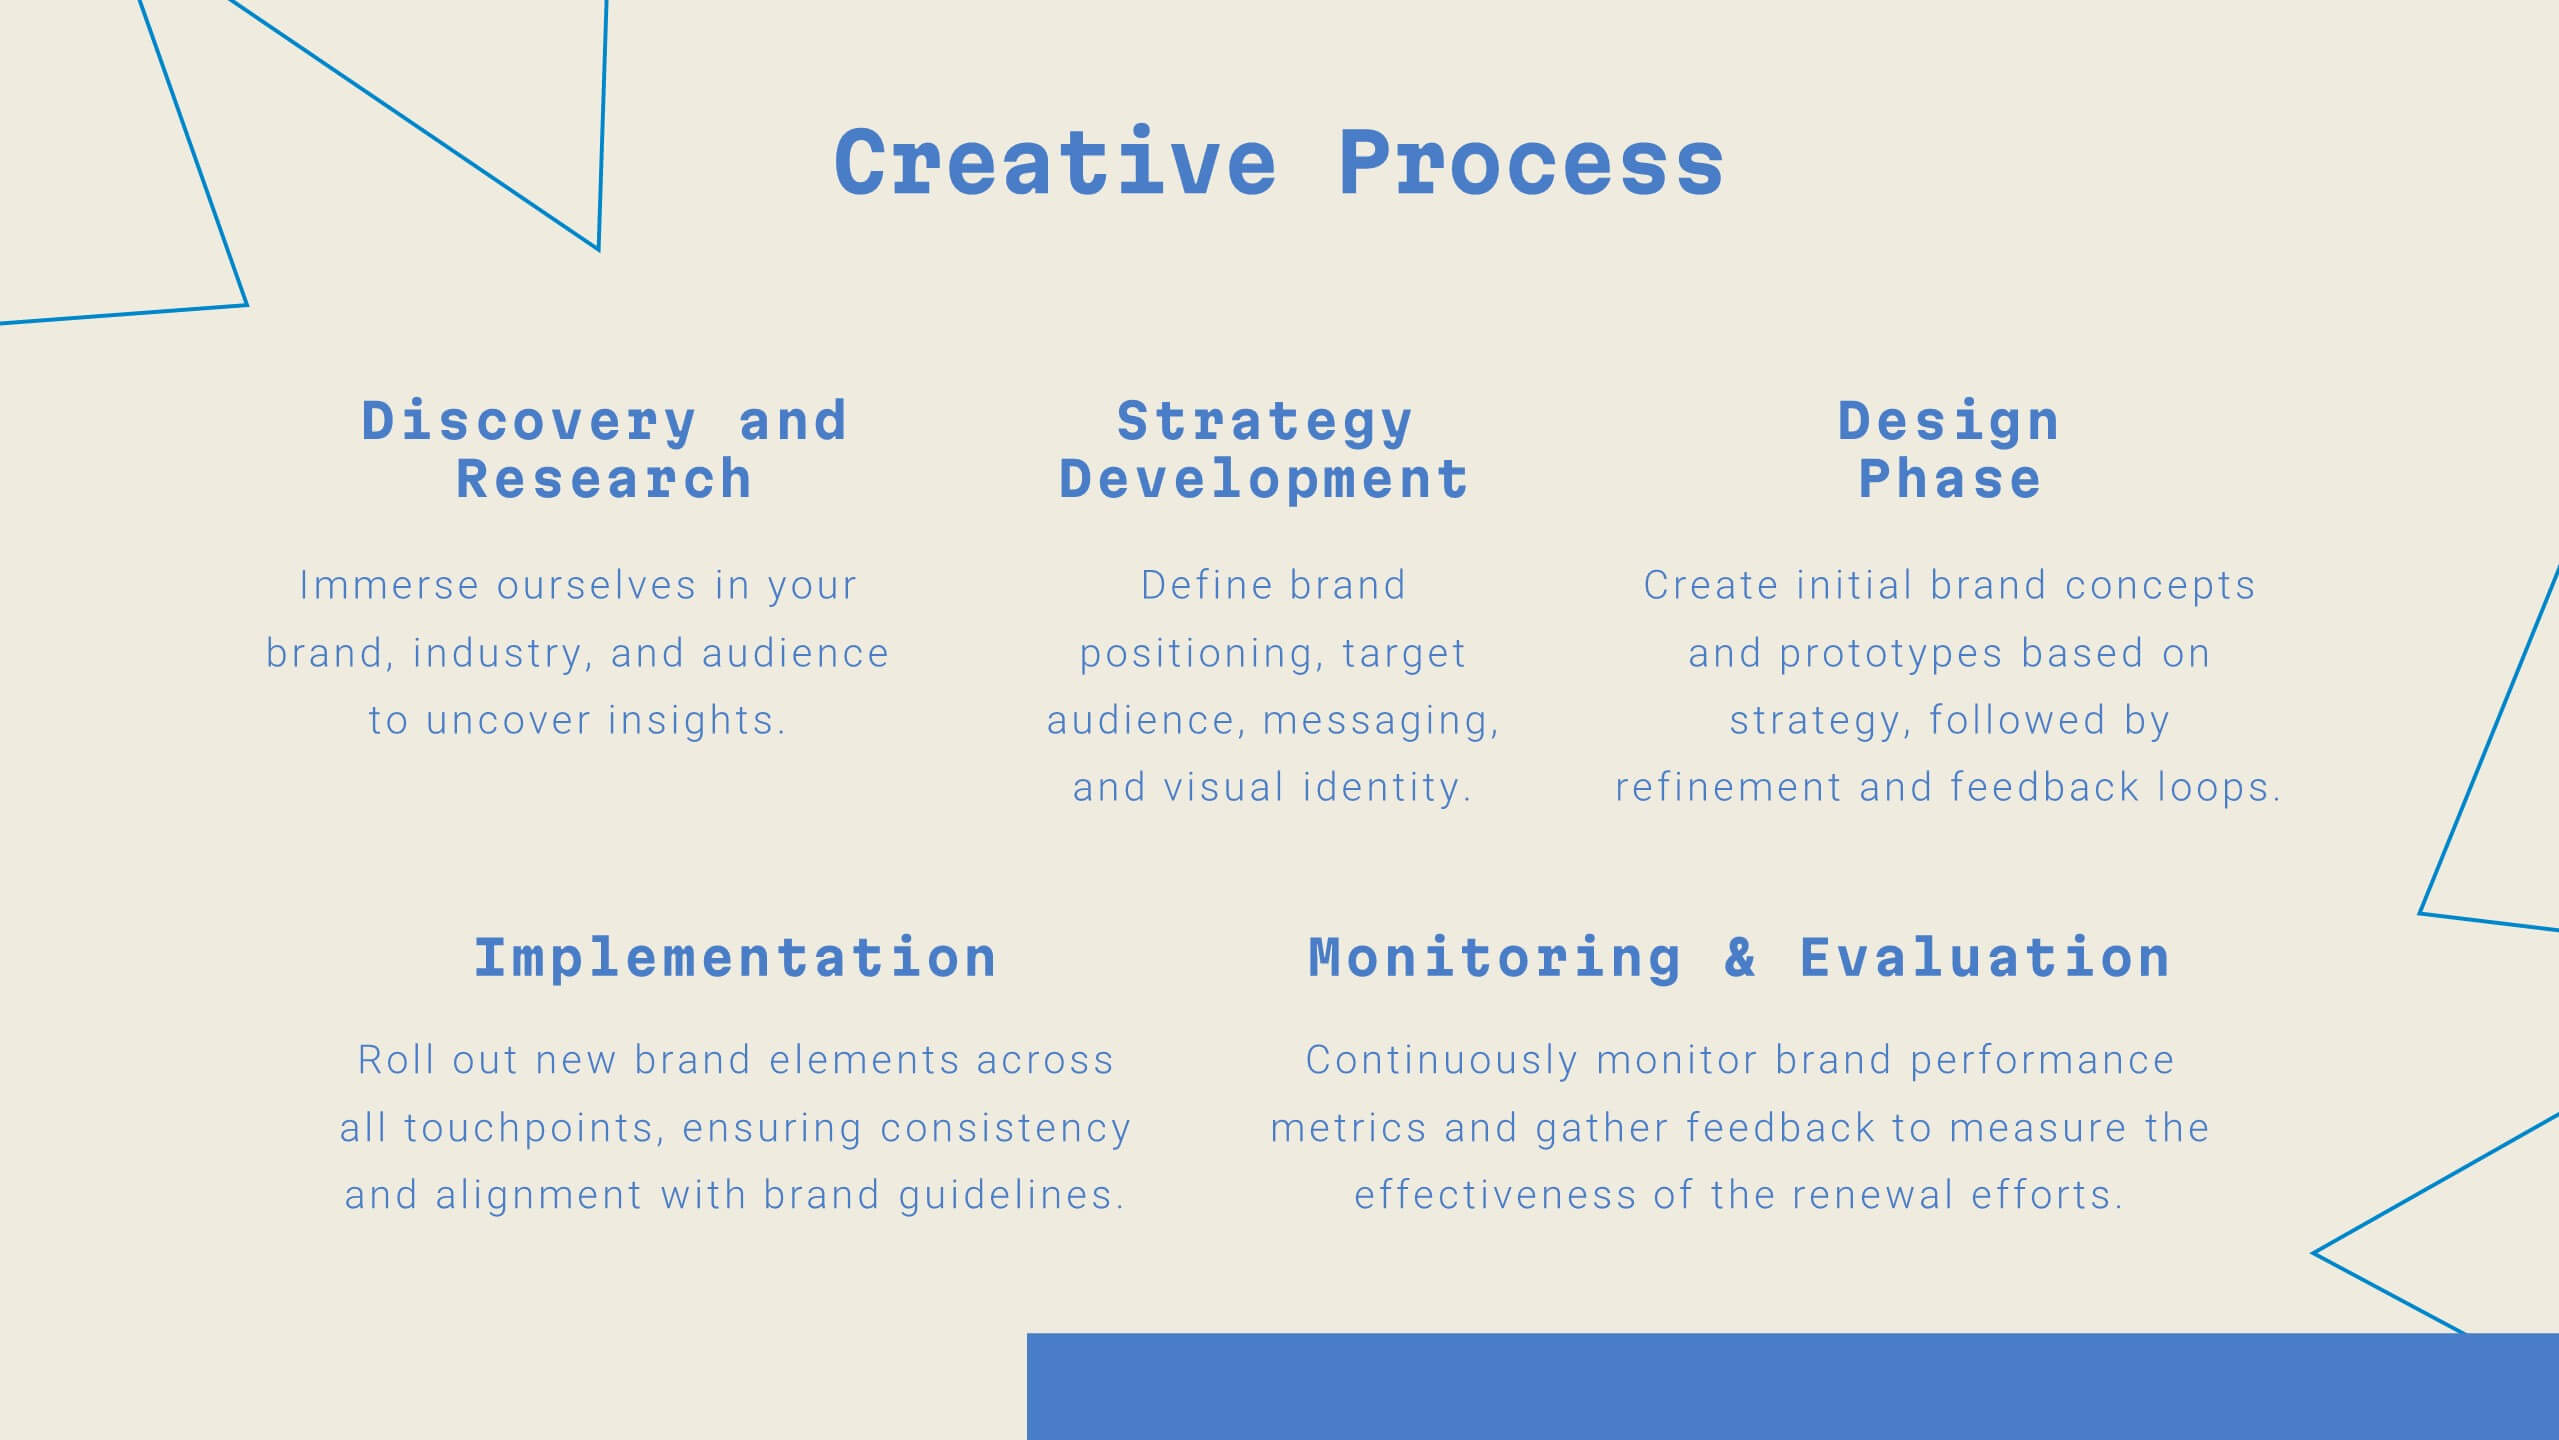
Step into the future of digital marketing with this sleek template! From case studies to strategy development, it offers a comprehensive guide for creating impactful presentations. Highlight client success stories, industry trends, and creative processes with ease. Perfect for showcasing your agency's expertise. Compatible with PowerPoint, Keynote, and Google Slides.


25 slides
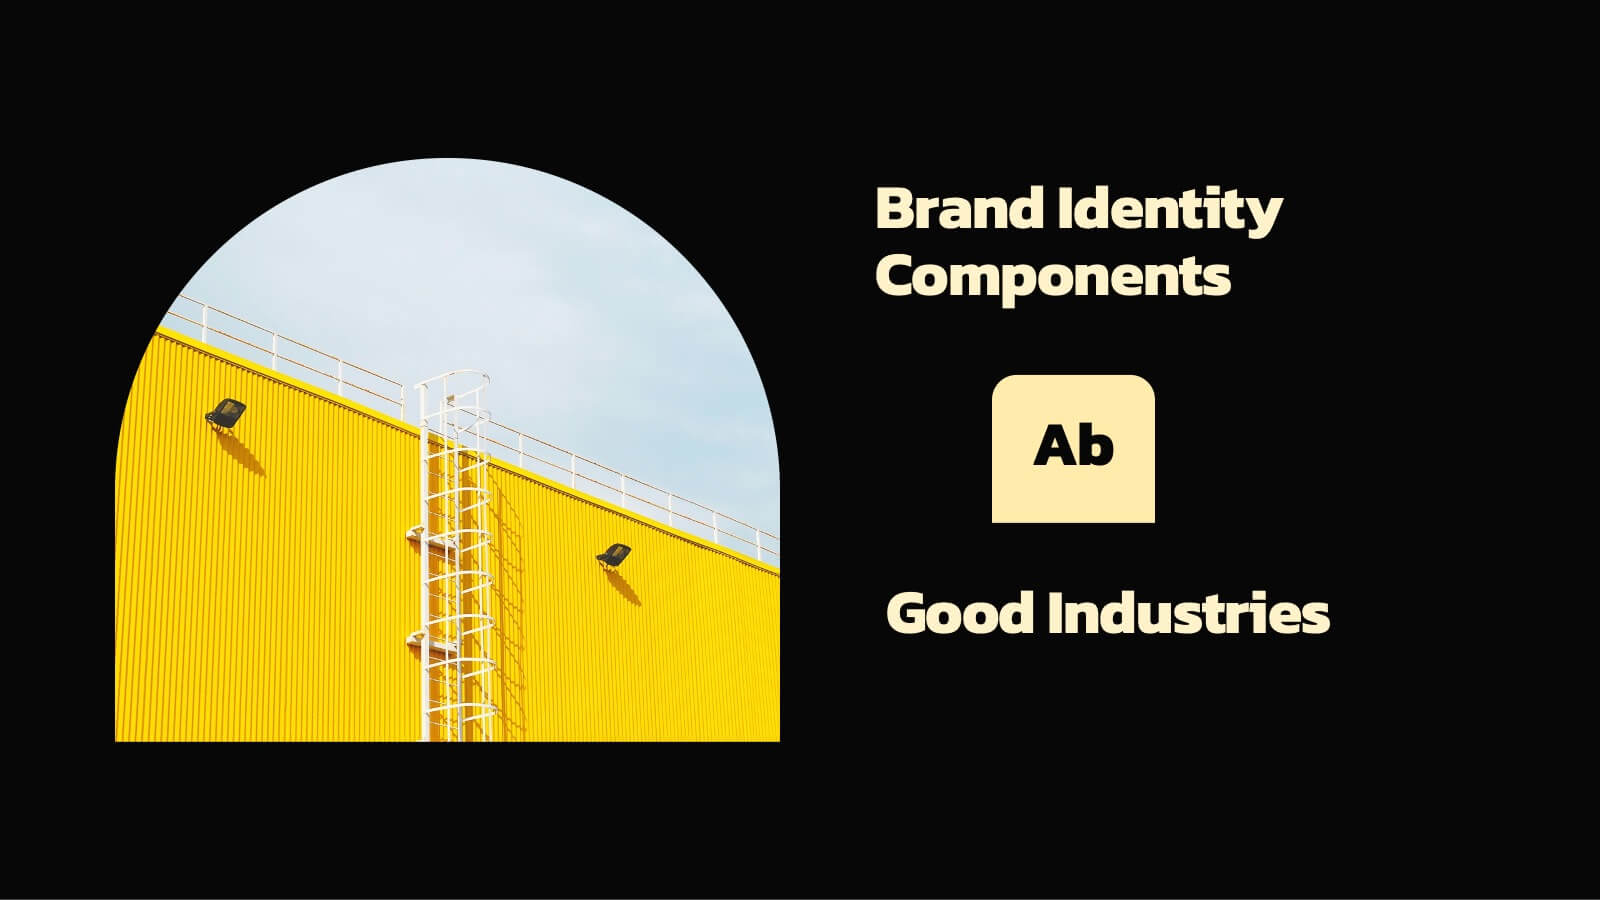
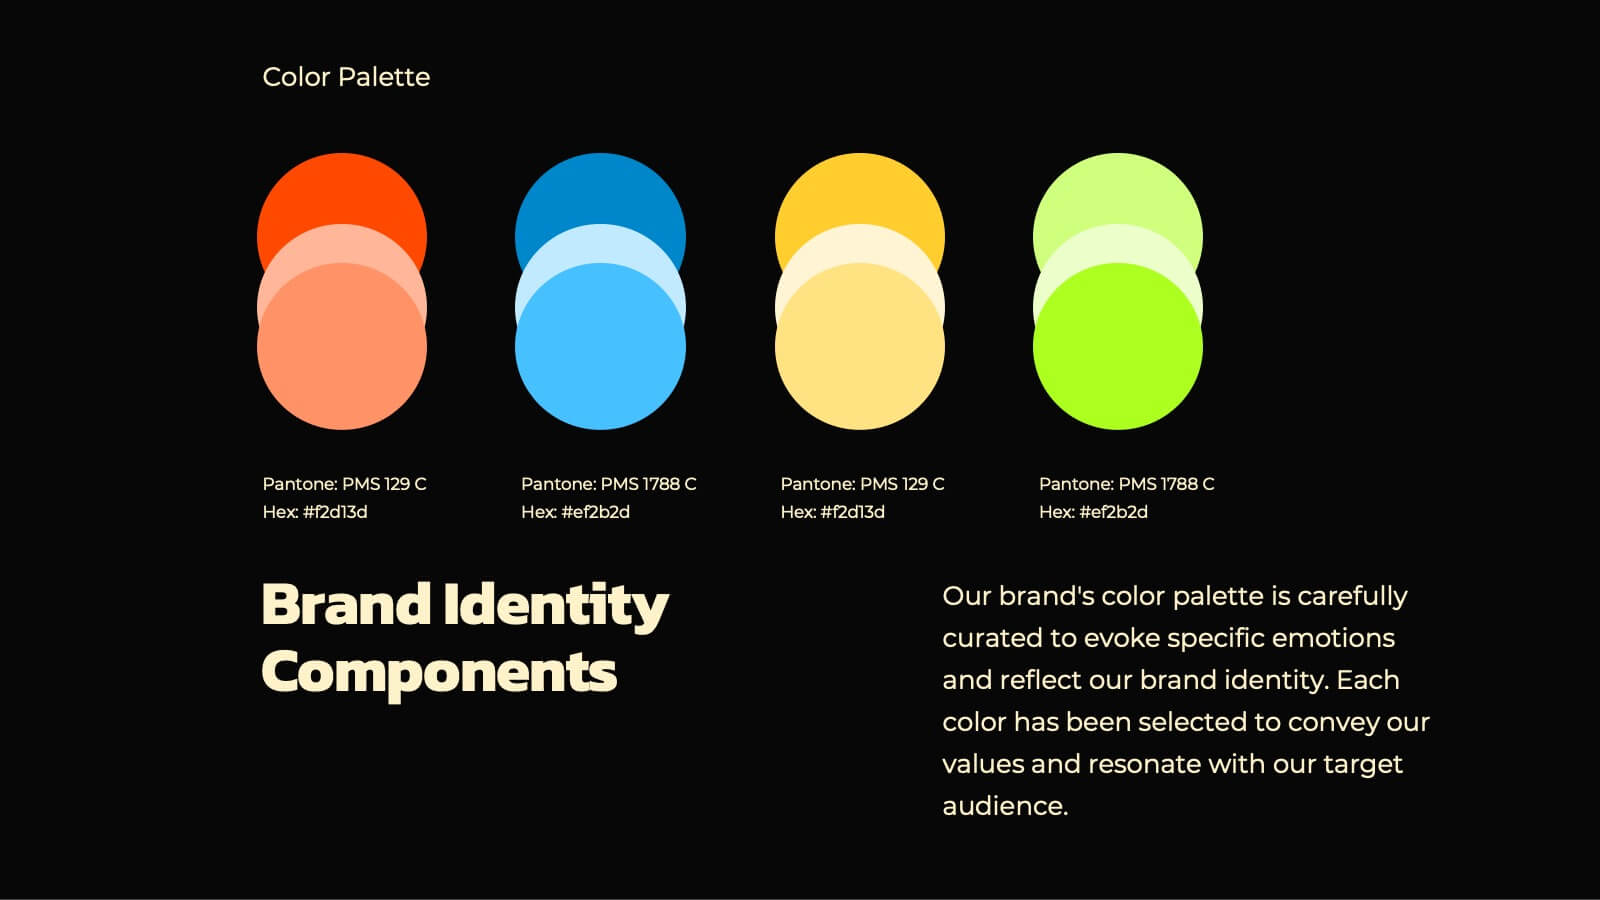
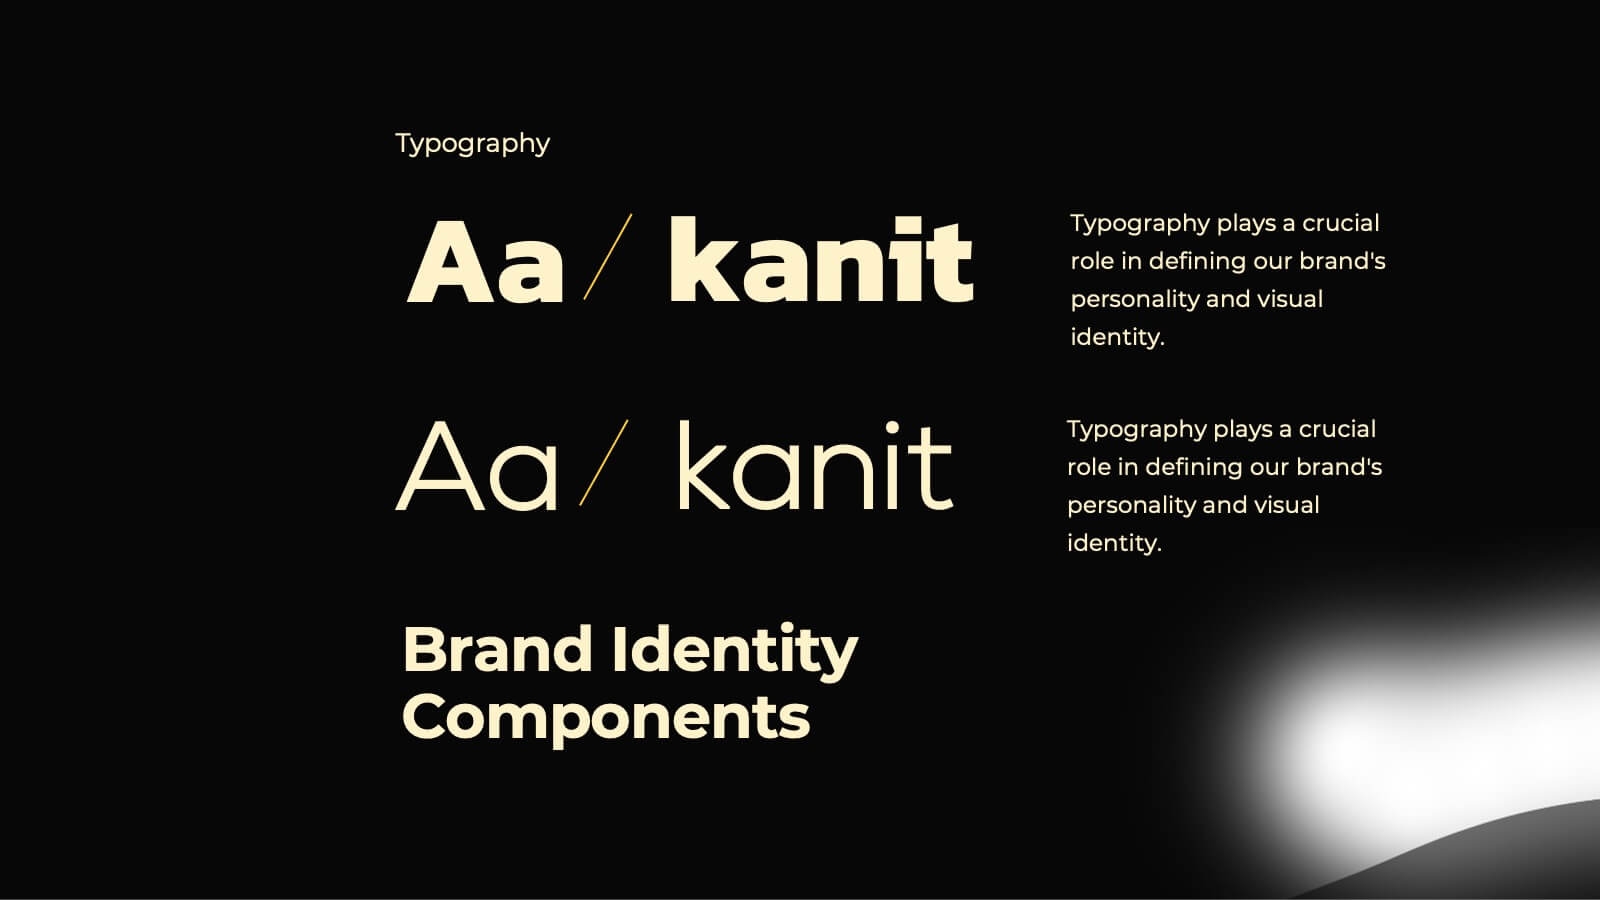
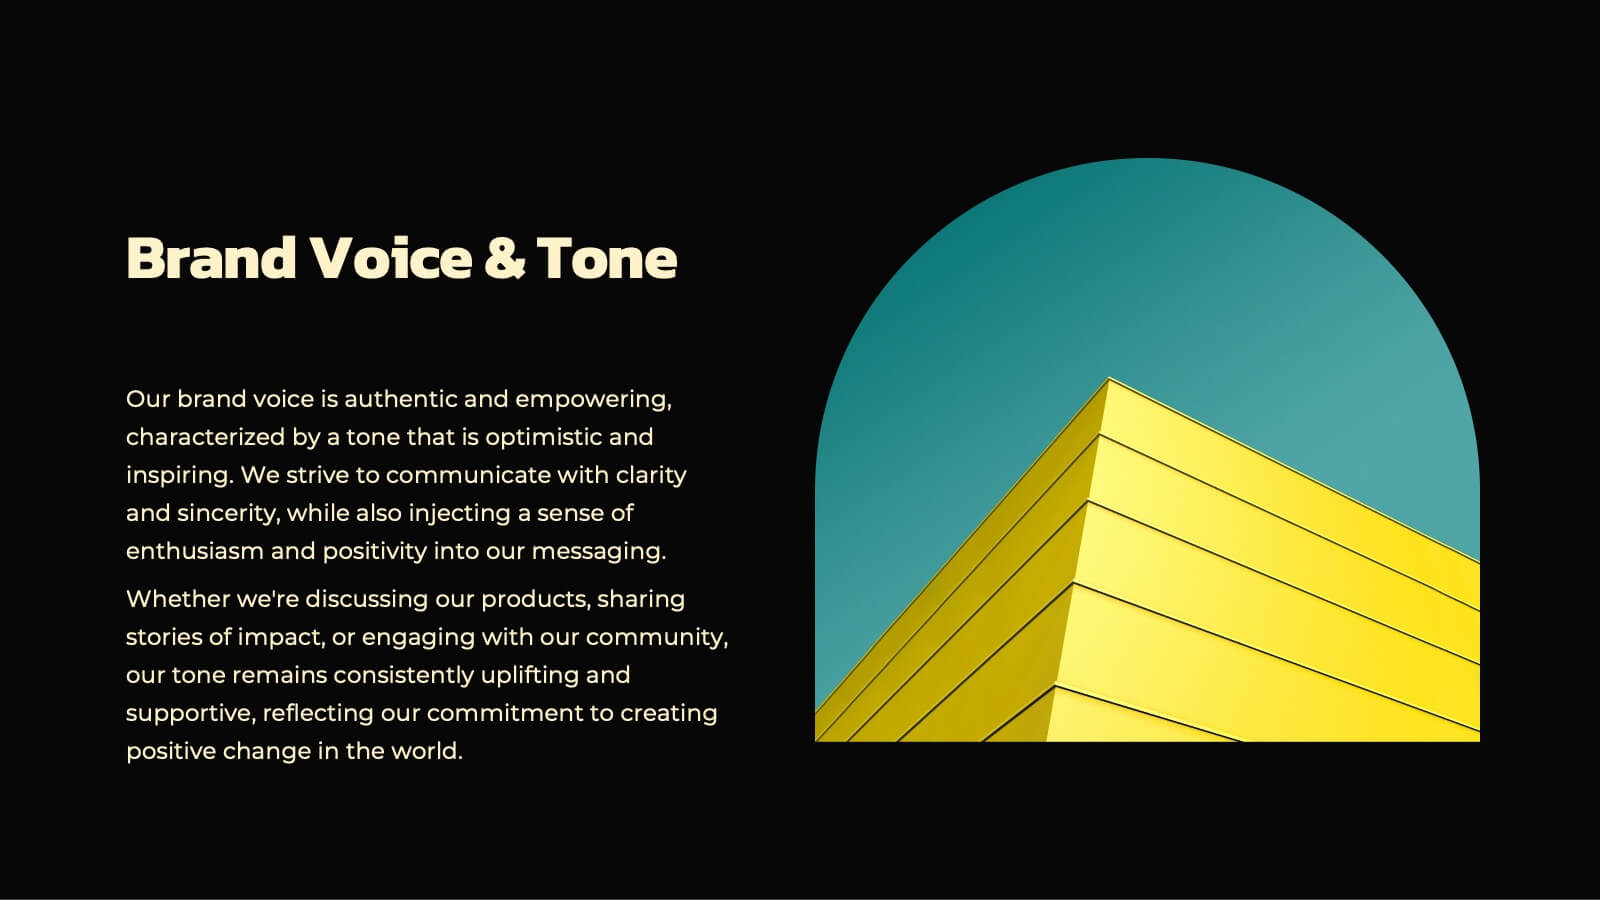
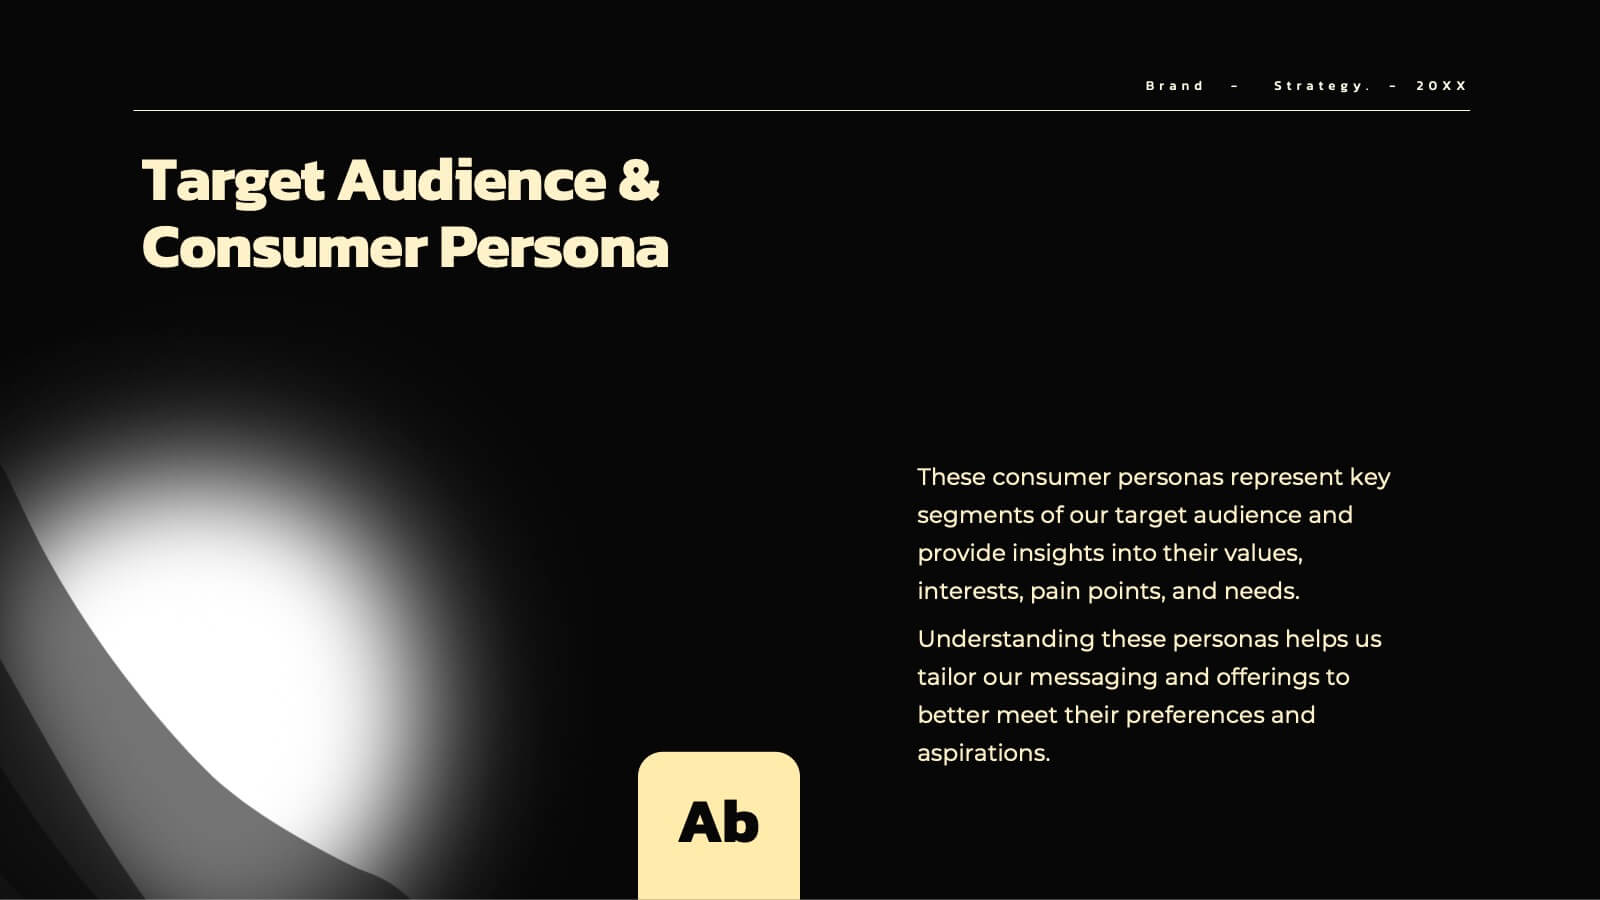
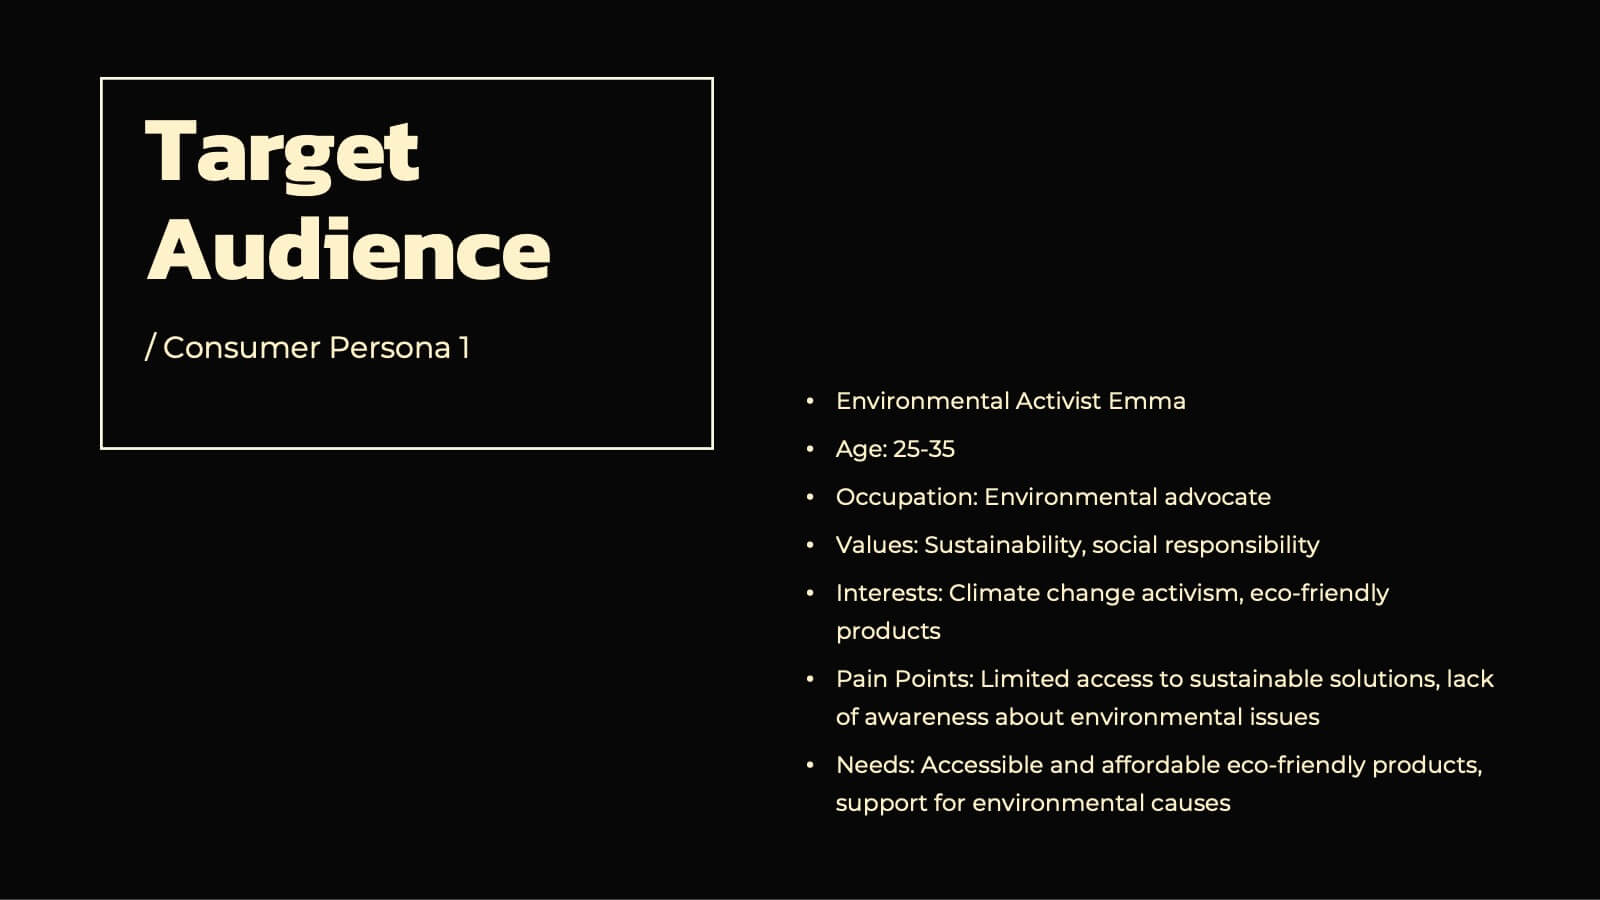
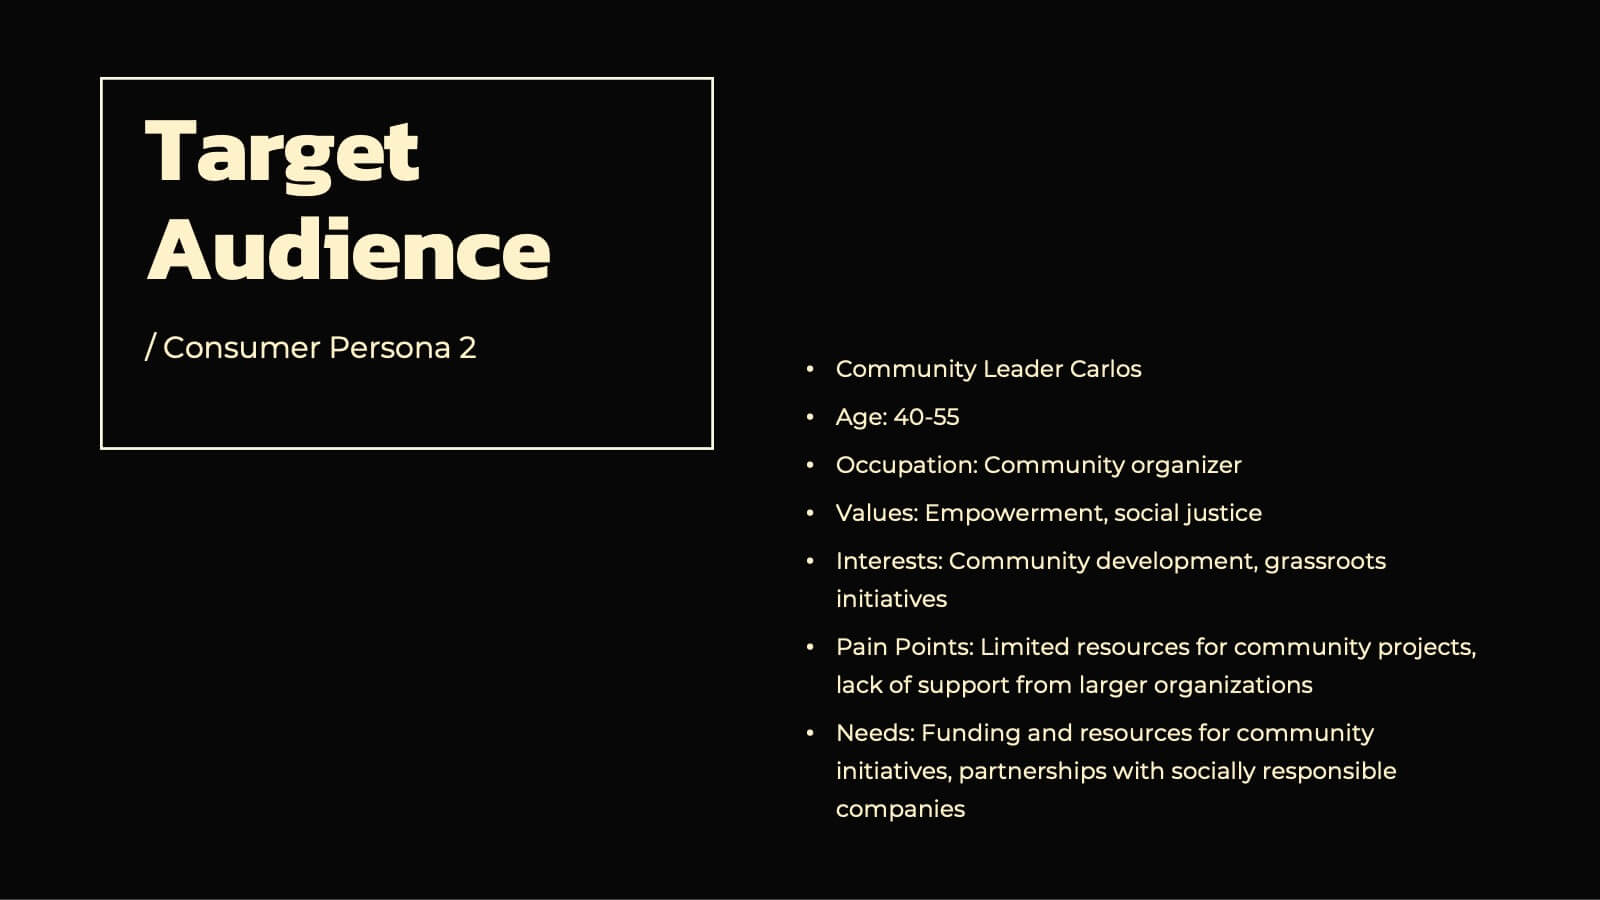
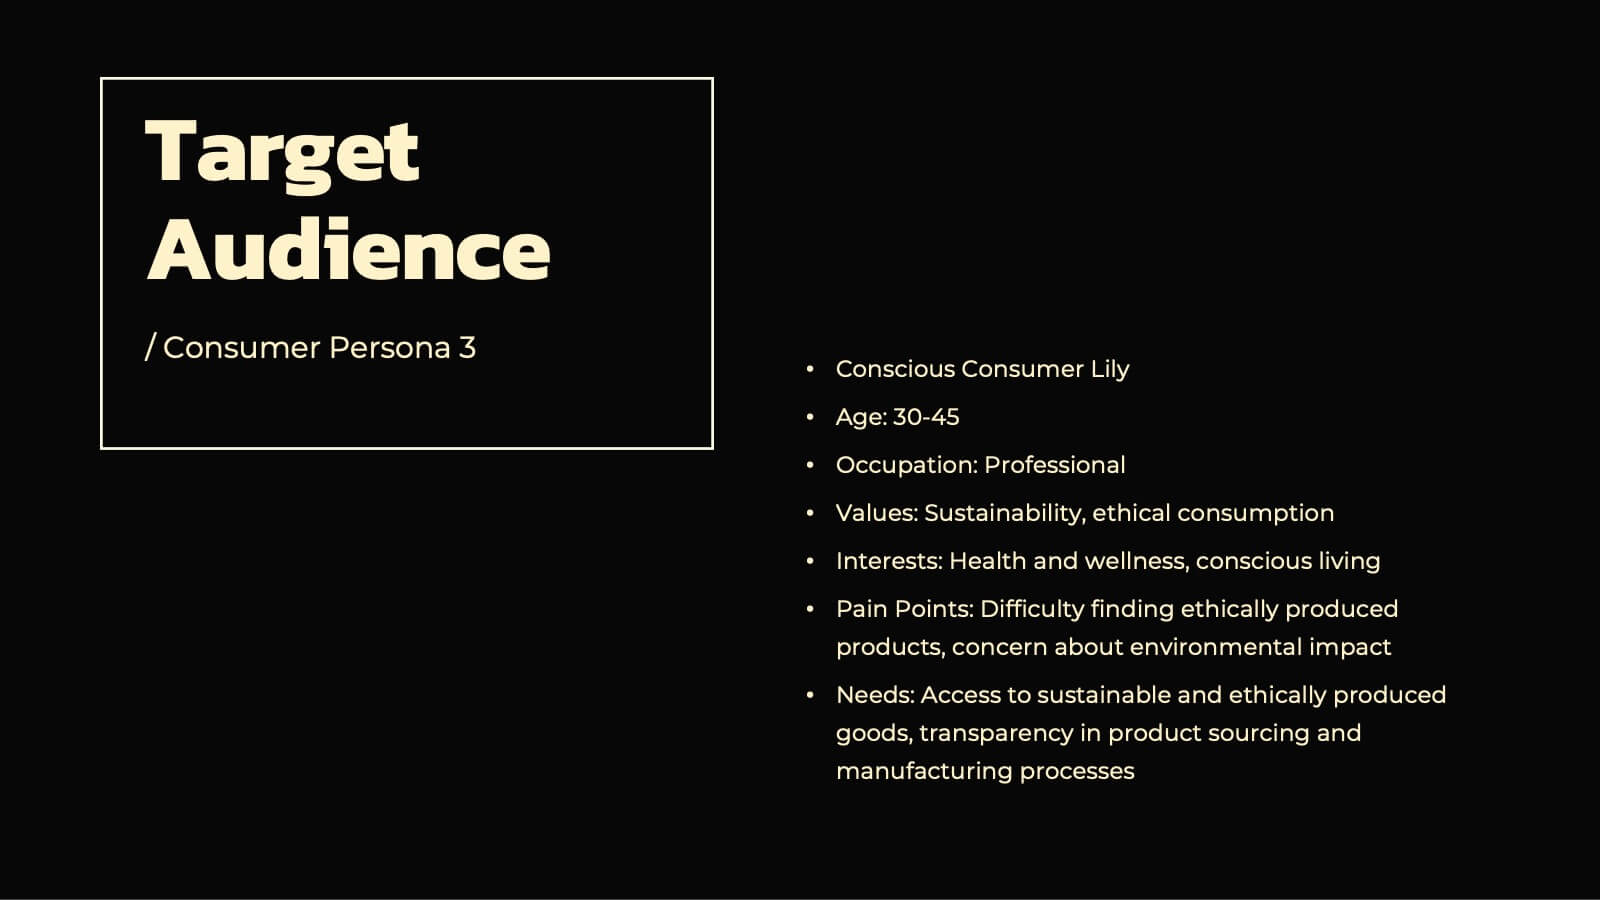
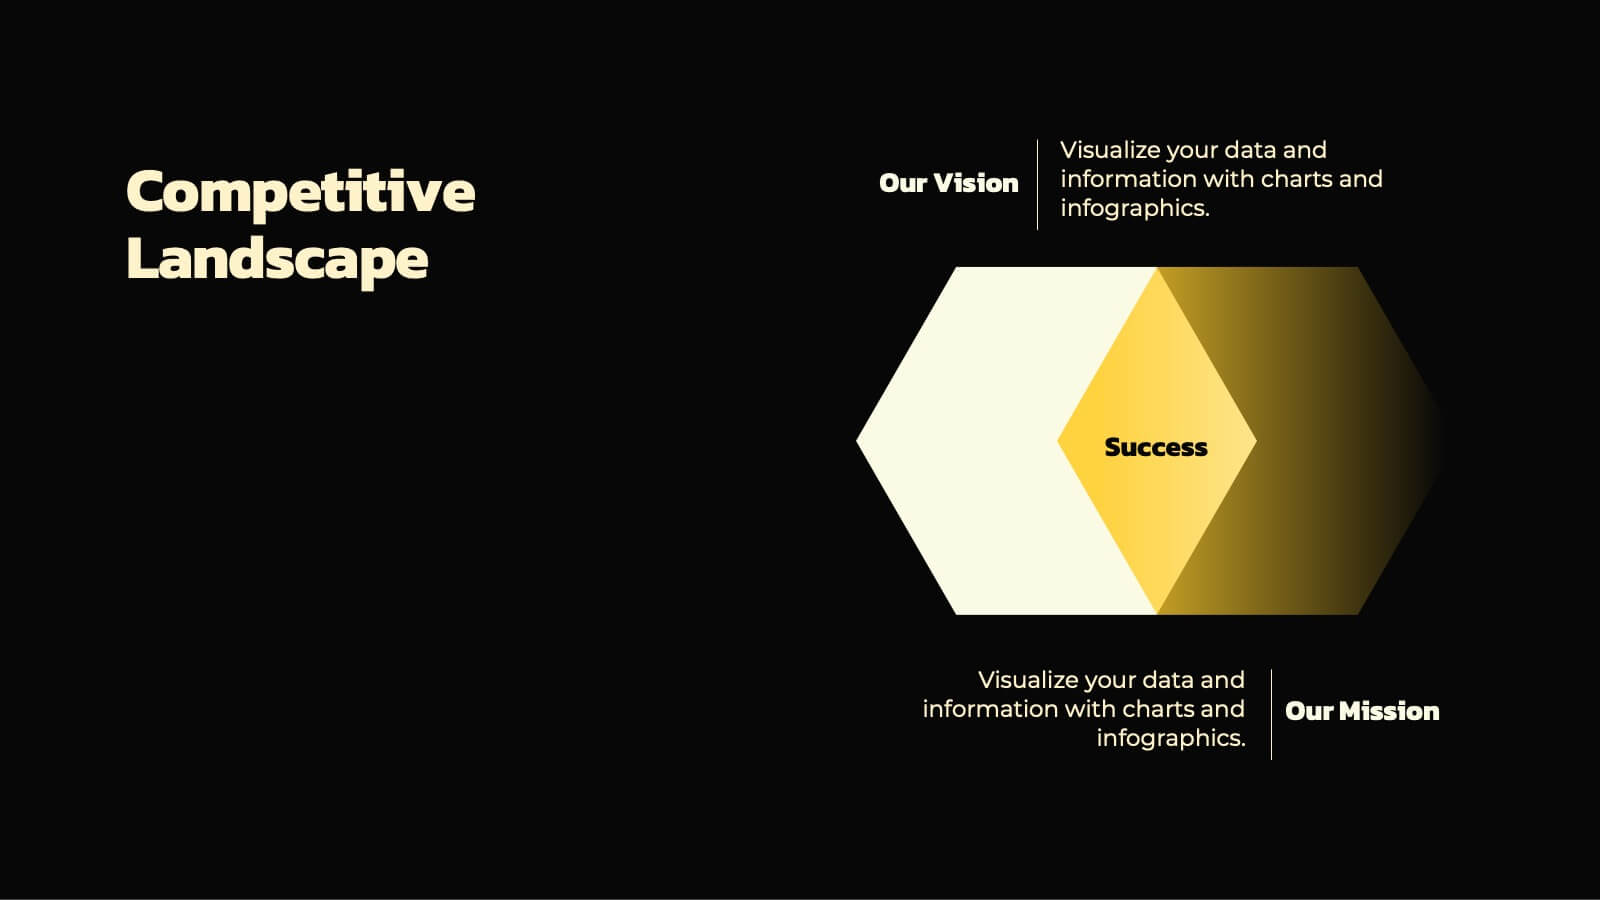
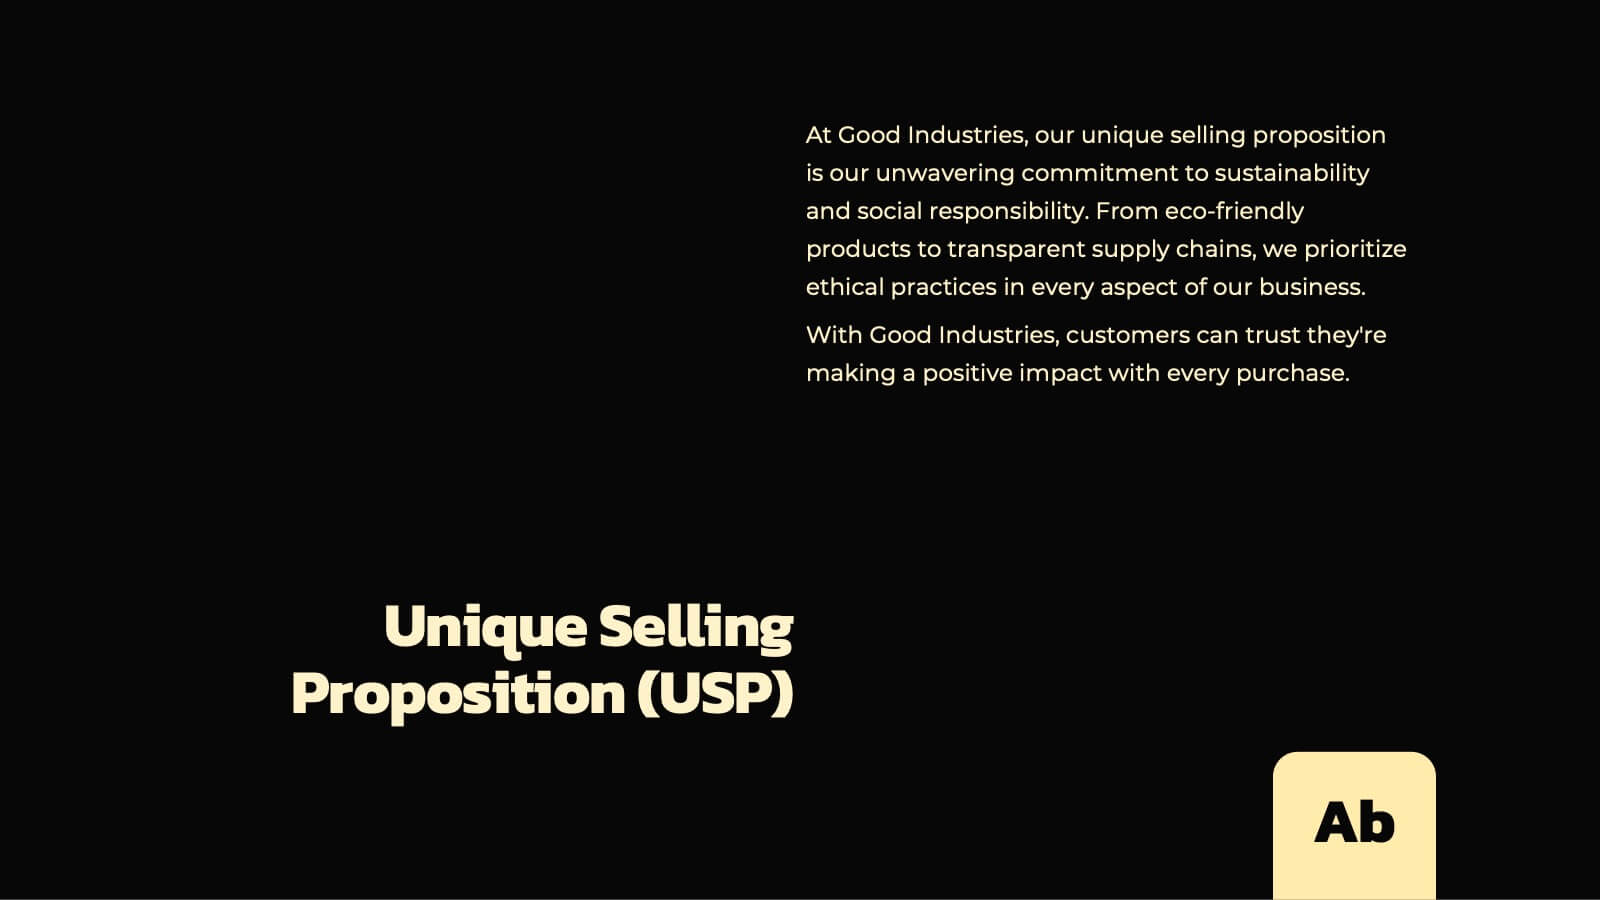
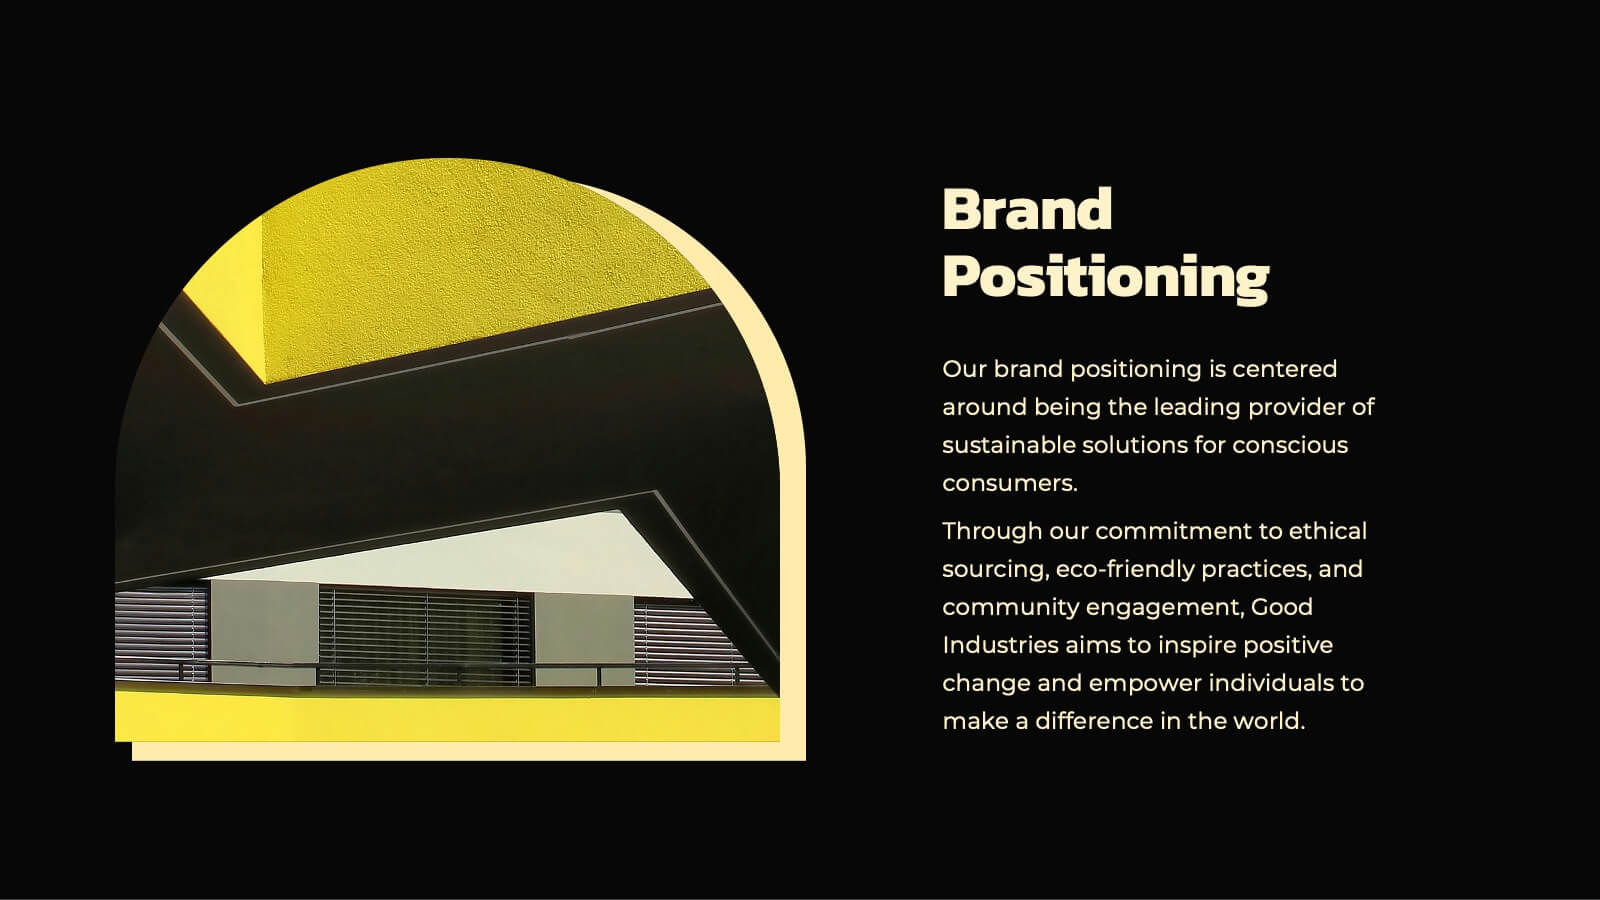
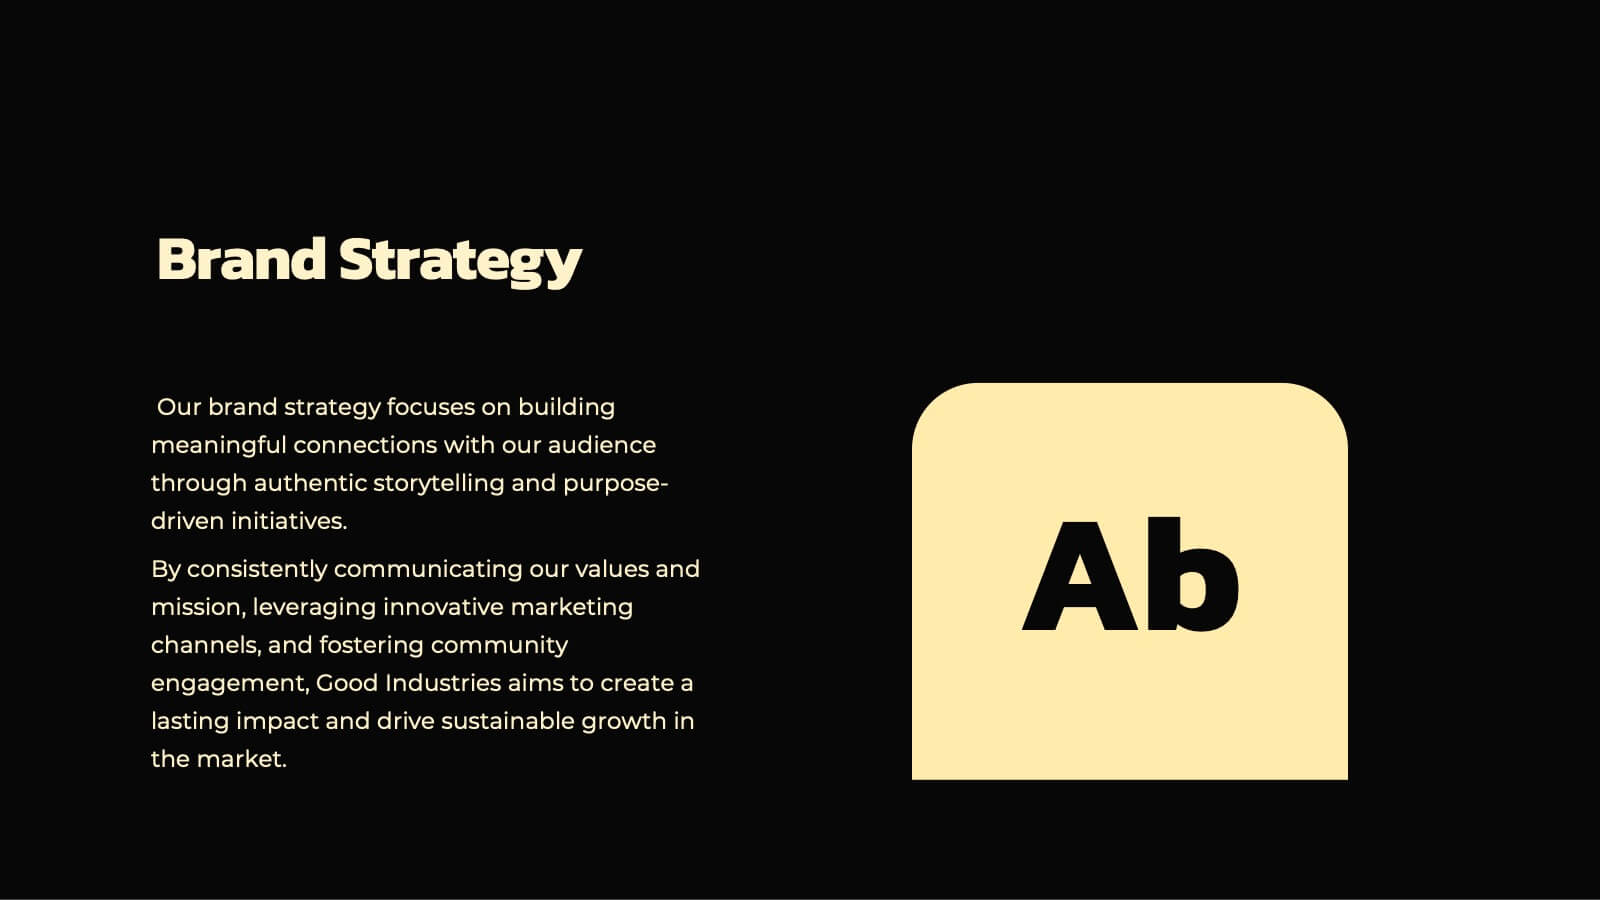
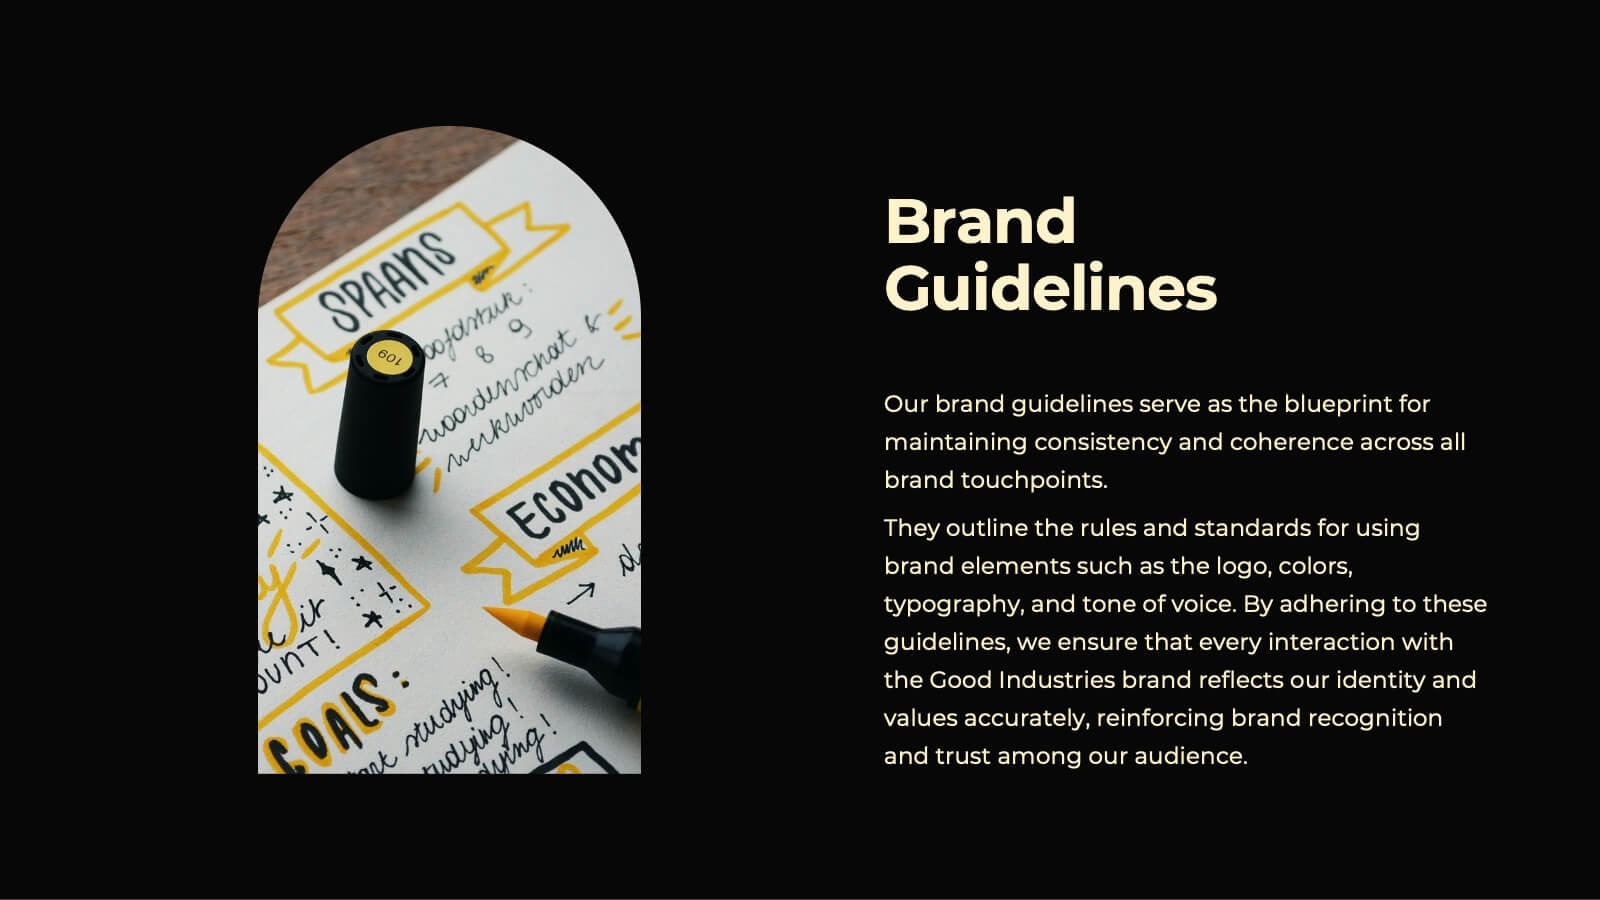
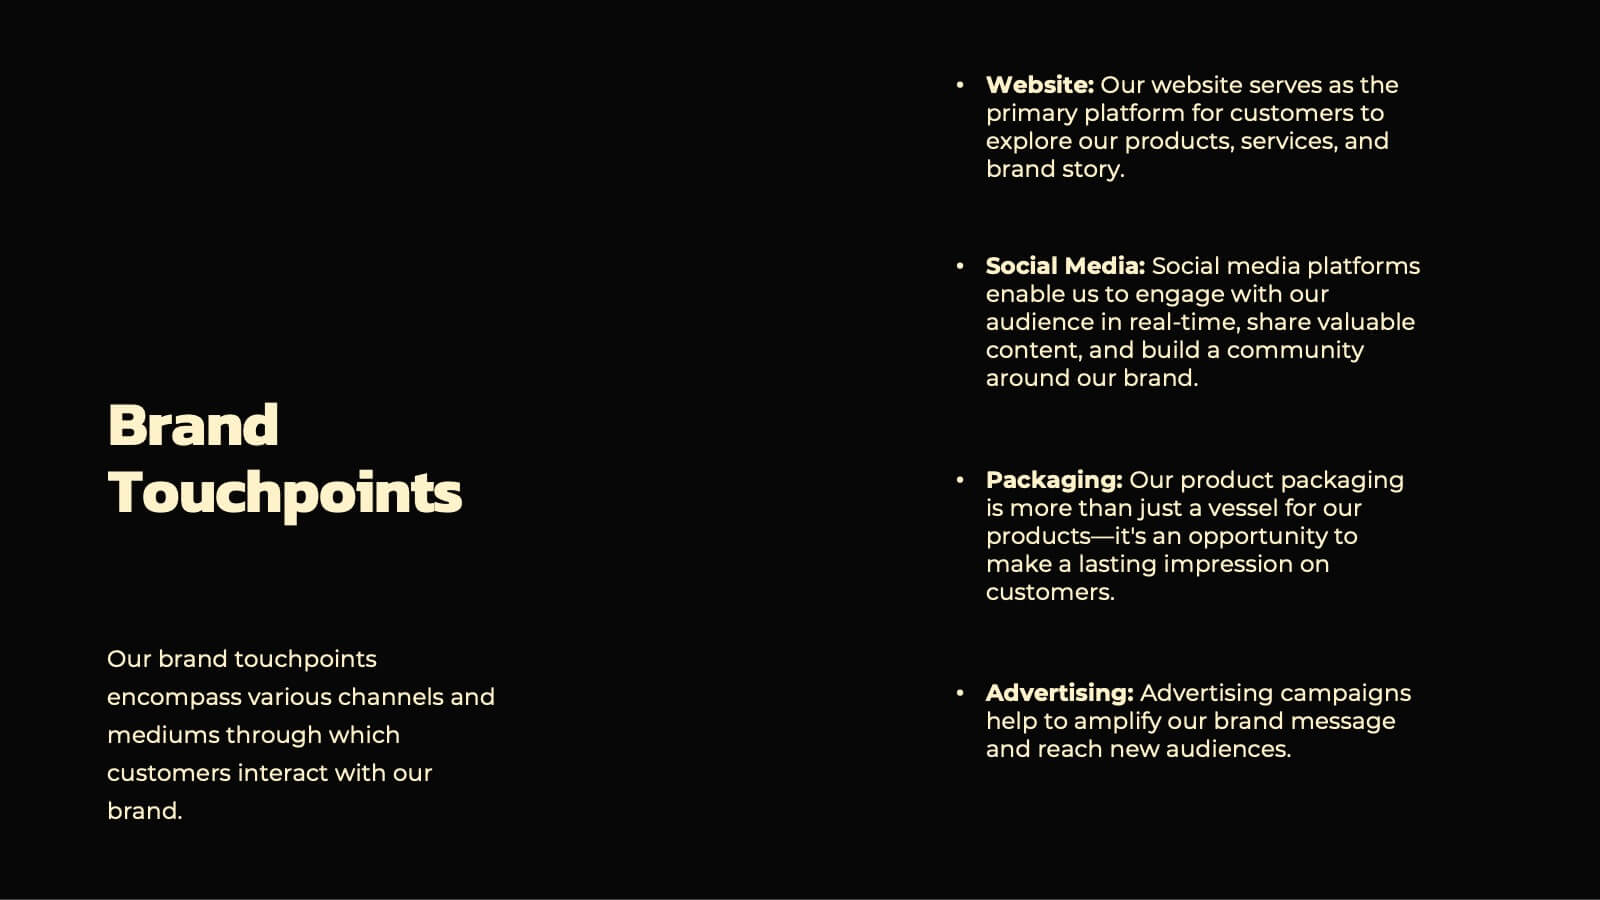
Hollowfern Brand Identity Presentation
Showcase your brand's unique essence with this structured and visually appealing brand identity presentation template. Highlight key elements like brand values, logo design, color palettes, and typography, providing a cohesive foundation for your brand's image. Dive deeper into the brand tone, consumer personas, and competitive positioning to ensure clarity and alignment with your target audience. This template offers dedicated sections for market analysis, unique selling proposition, and brand guidelines, helping you communicate your strategy with professionalism. Whether you're crafting a social media presence, building a website, or refining packaging designs, this template empowers you to stay consistent and compelling. Fully compatible with PowerPoint, Google Slides, and Keynote, it's tailored for seamless customization and presentation across platforms.


7 slides
Female Anatomy Infographic
Anatomy is the branch of biology that focuses on the structure and organization of living things. Step into a world of discovery with our infographic template, this is an enlightening visual guide that celebrates the intricate beauty and functionality of the female body. This infographic is designed to educate and empower, offering a clear and artistic representation of the anatomy that defines women. This template will take your audience through an educational journey through the various systems that make up a woman's body. This is fully customizable and compatible with Powerpoint, Keynote, and Google Slides.


27 slides
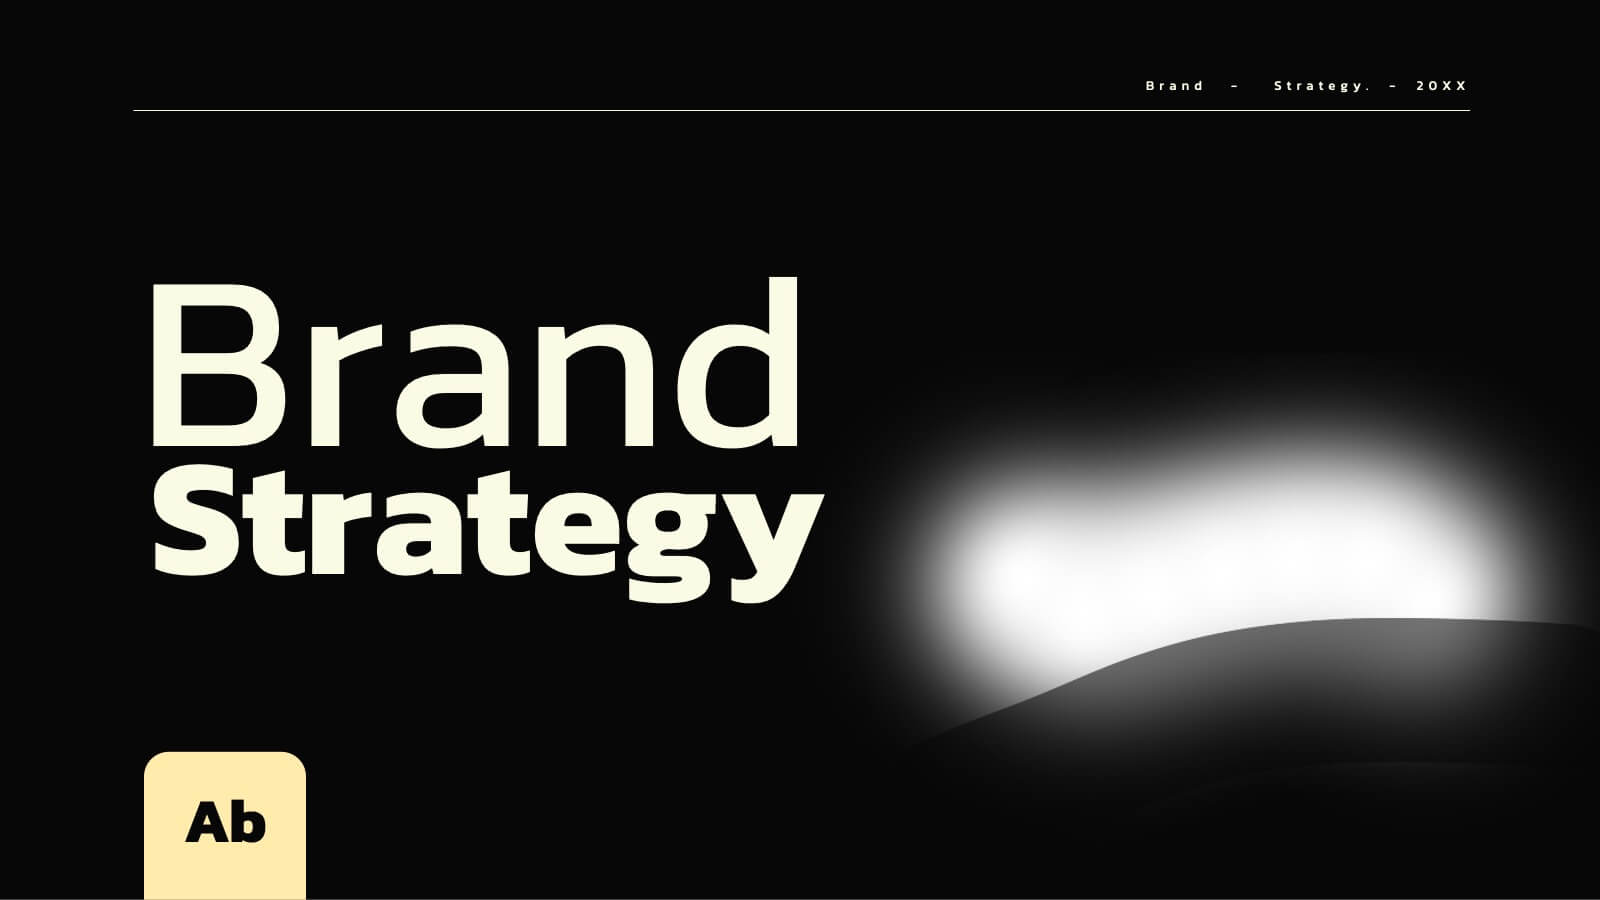
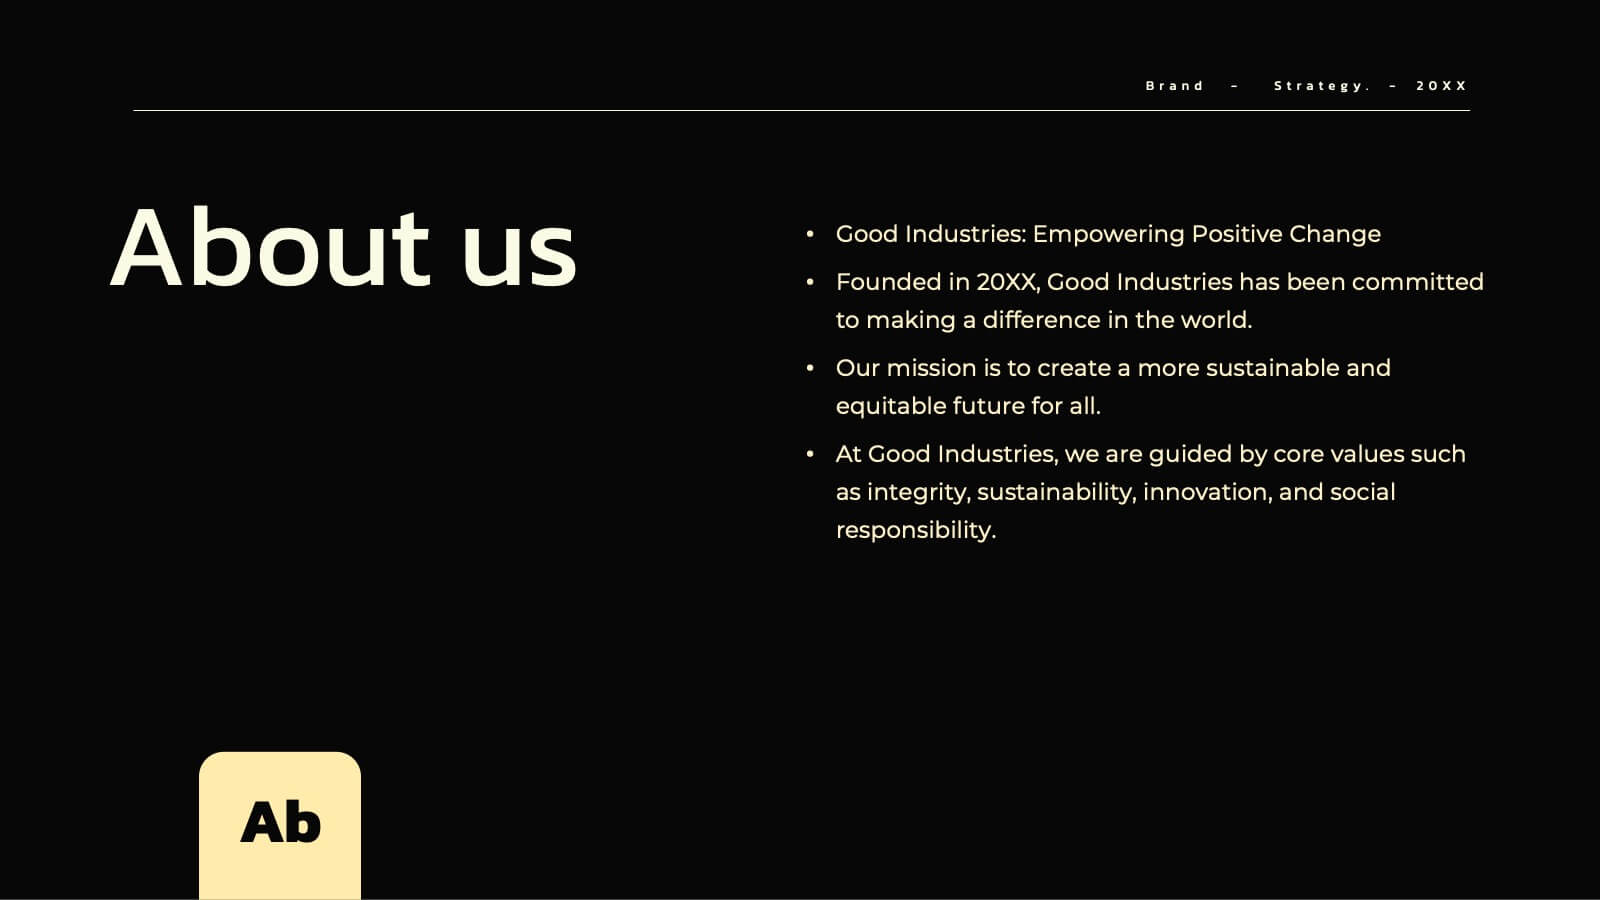
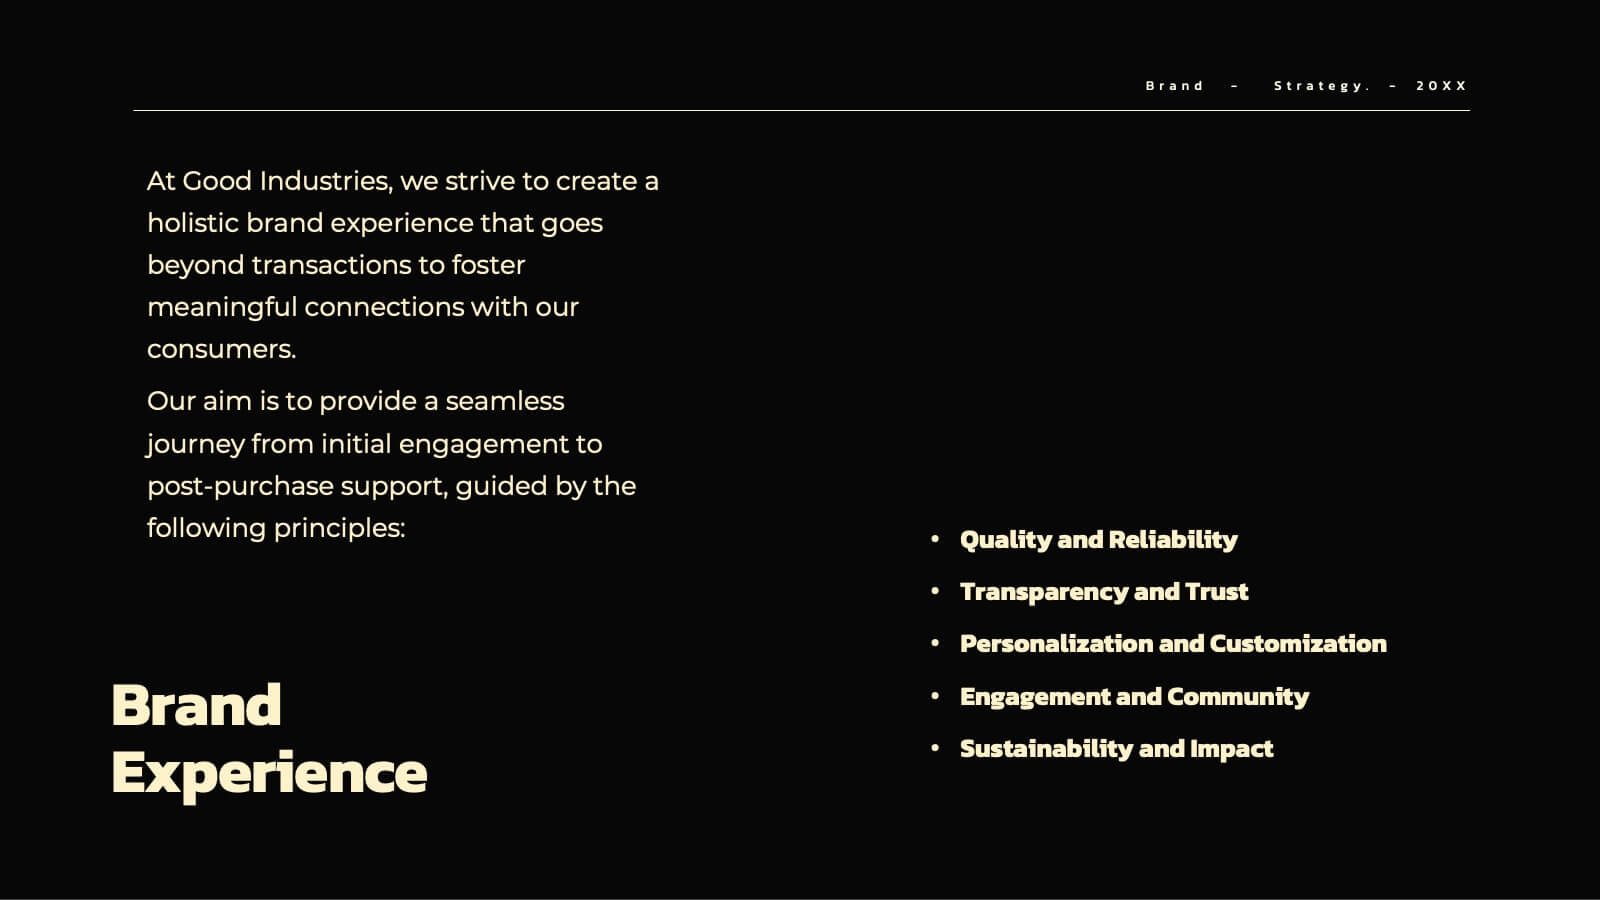
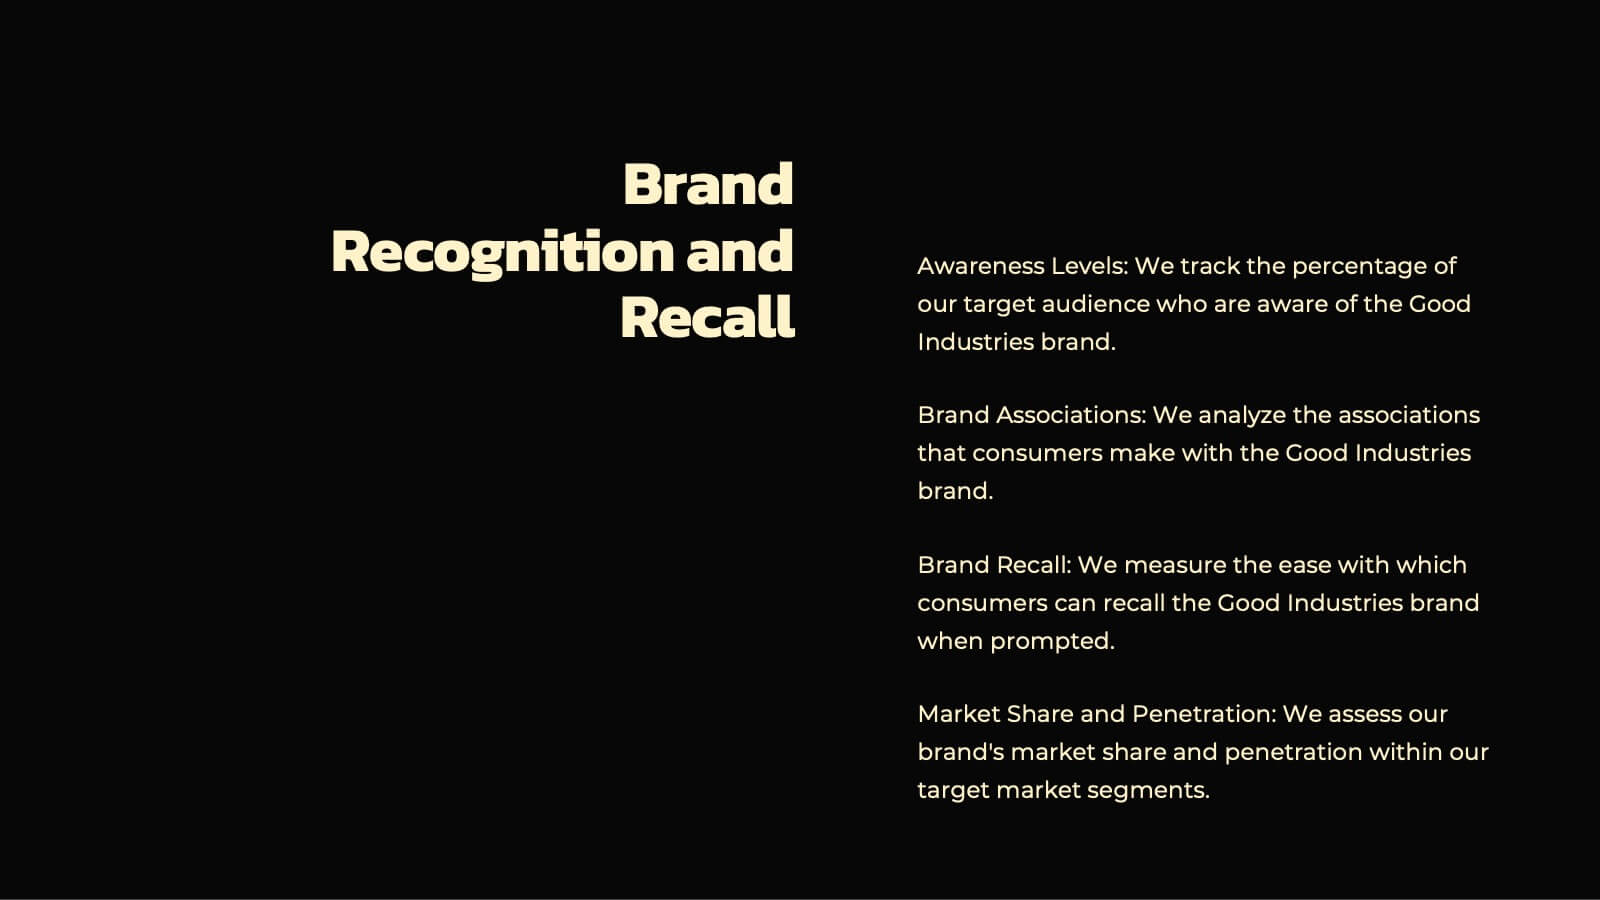
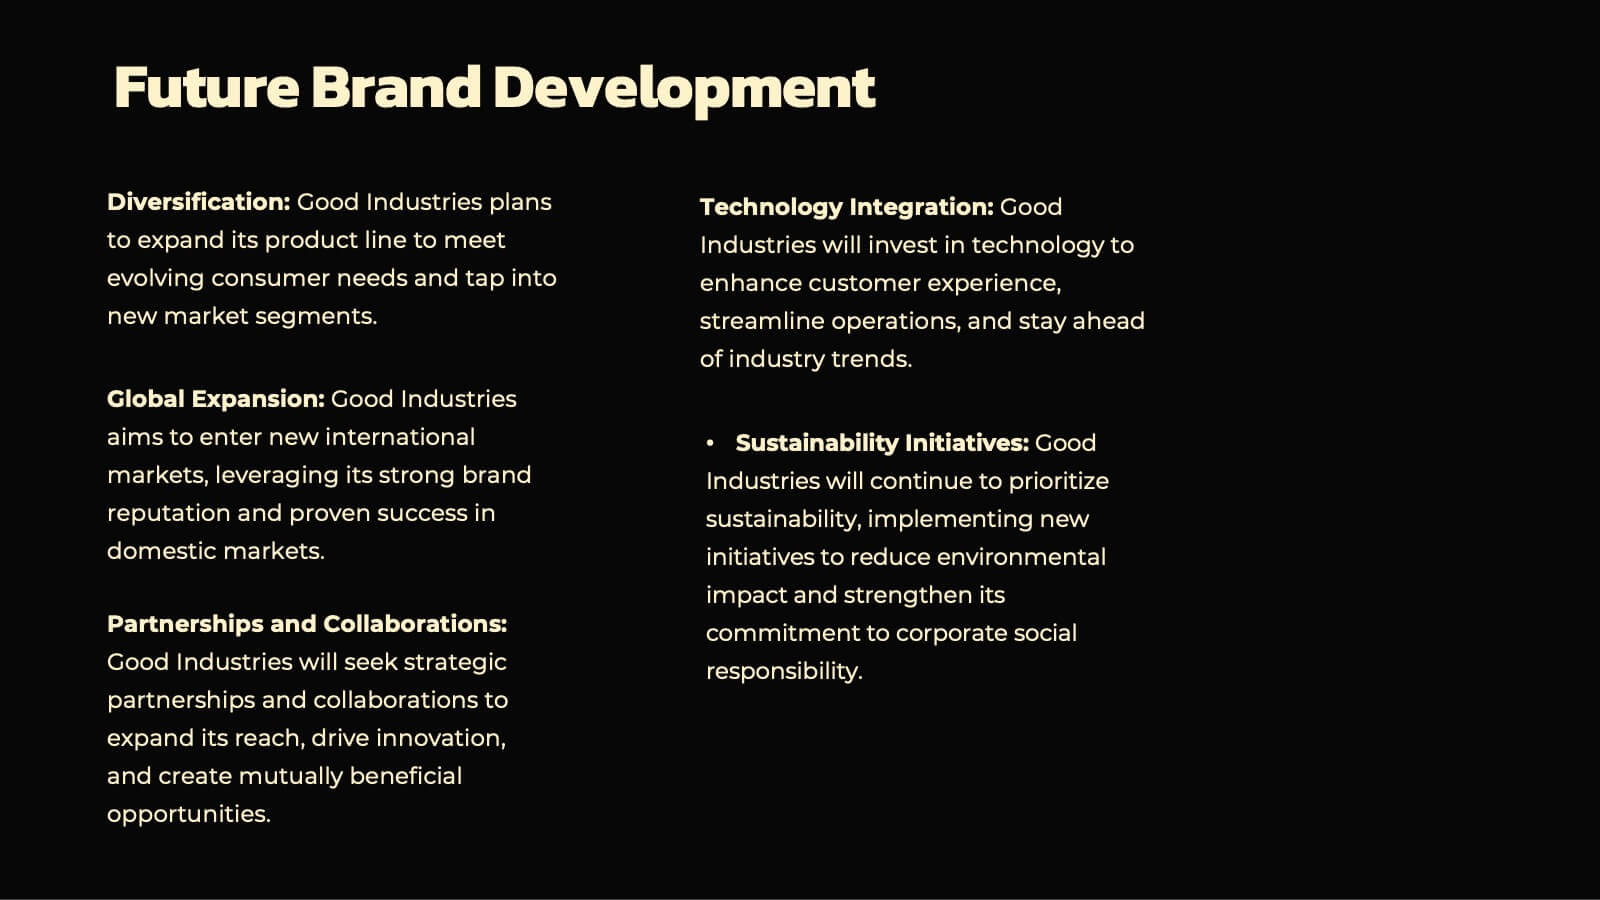
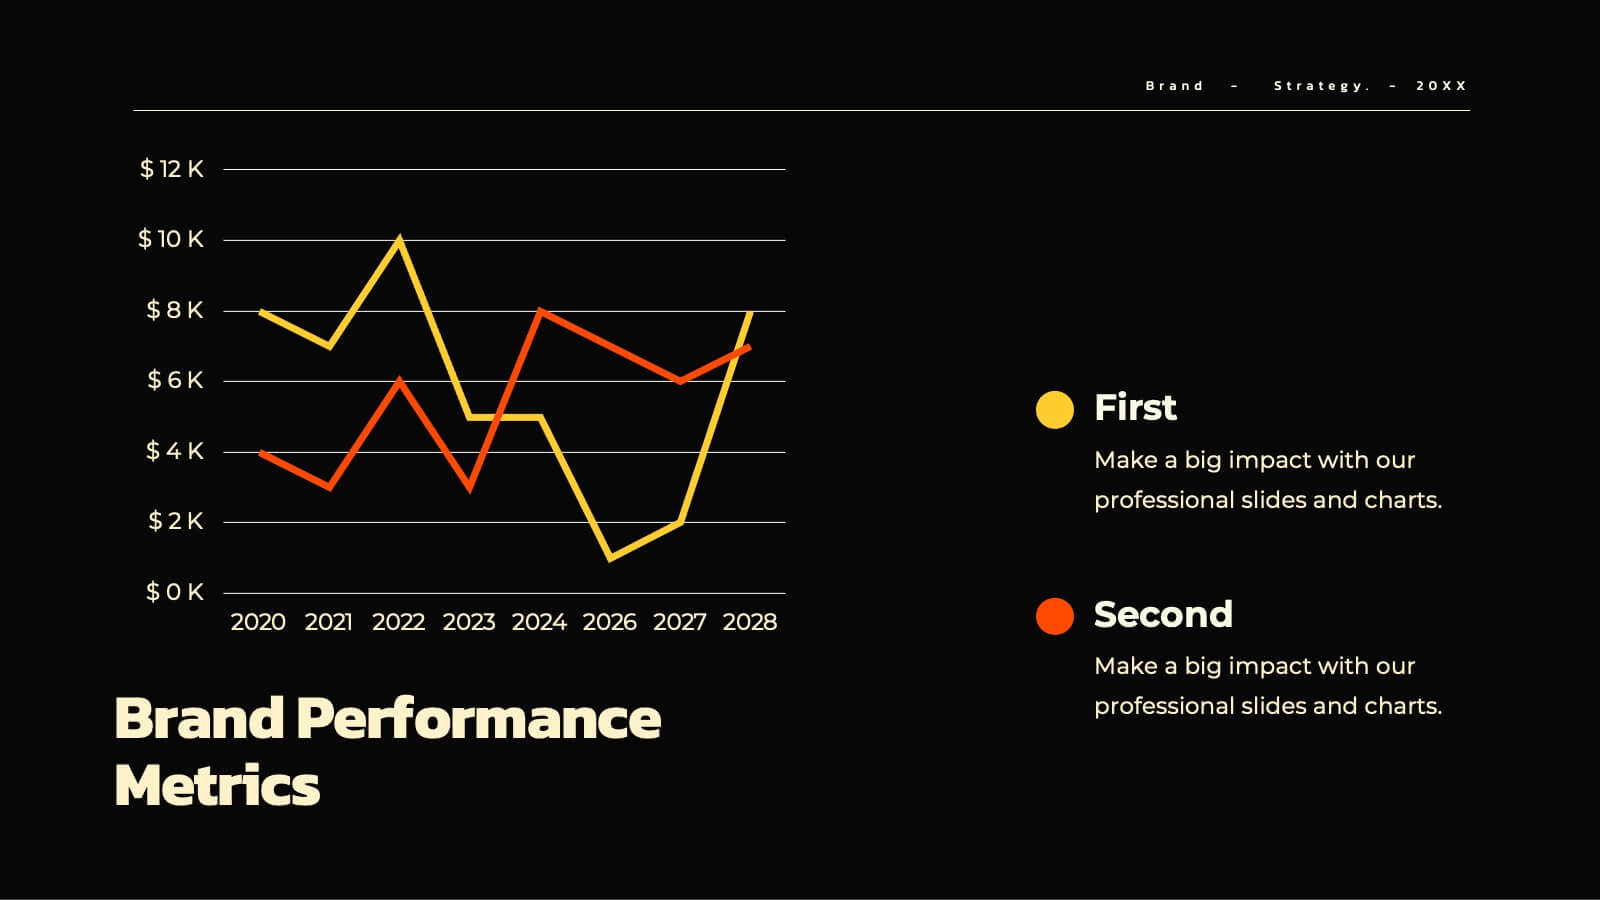
Aqua Brand Strategy Report Presentation
Make waves with this fresh, aqua-inspired presentation template, perfect for delivering a standout brand strategy report! Designed to help you showcase your brand's vision, market positioning, and strategic goals, it features a clean, modern layout that grabs attention. Compatible with PowerPoint, Keynote, and Google Slides for effortless customization.


5 slides
Editable Circular Flow Presentation
Streamline your presentations with this Editable Circular Flow template. Ideal for processes, workflows, and strategic planning, this diagram visually represents key steps in a structured format. Fully customizable and compatible with PowerPoint, Keynote, and Google Slides, it ensures clarity and professionalism for engaging, data-driven presentations.


5 slides
New Hire Employee Onboarding Flow Presentation
Make a lasting first impression with a clear, engaging flow that guides new hires through every step of their onboarding journey. Perfect for HR teams and managers, this presentation simplifies complex processes with visual structure and clarity. Fully compatible with PowerPoint, Keynote, and Google Slides for easy customization and use.


26 slides
Katlina Presentation Template
Everyone wants to be on top of their SEO game. This Katlina presentation template provides a way for you to teach your audience about the importance of Search Engine Optimization. Start creating your own slides with this template. With fun graphics that will also make the information more interesting and easy to understand charts and timelines.This presentation will help your audience see how they can increase their sites visibility in search results. It can also be use for your presentations at work or in class due to it's customizability. Get started today makeing an impact in your industry.


2 slides
Professional Cover Slide Design Presentation
Make a bold first impression with this clean and modern cover slide layout. Featuring a split design with customizable photo space and a vibrant call-to-action label, this slide balances professionalism with creativity. Perfect for proposals, company overviews, or keynote introductions. Easily personalize the title, color palette, and image. Fully compatible with PowerPoint, Keynote, and Google Slides.


7 slides
Customer Success Journey Infographic
A customer journey infographic is a visual representation of your customer's experience with your company. It can help you gain insight into where they're struggling and how they feel about your product or service. This infographic template will help you understand the top factors that influence your customers' decisions, including the most common problems they face. With this template you'll also learn how their behaviors change over time—and how to structure marketing campaigns that stay with them throughout their journey. Fully customizable and compatible with Powerpoint, Keynote, and Google Slides.


7 slides
Office Scenes Interview Infographic
Office Scenes refer to various activities, situations, or interactions that occur within a typical office environment. Embark on a visual journey through the dynamic world of interviews and office scenes with our office scenes interview infographic template. This visually appealing and informative template is tailored to give insights into the art of interviews, providing valuable tips and tricks for success within the corporate sphere. Compatible with Powerpoint, Keynote, and Google Slides. This template presents an enticing introduction to the world of interviews, setting the stage for a journey towards success and career growth.


6 slides
OKR Goal-Setting Framework
Clarify your goals and drive performance with this OKR-based layout that maps Objectives, Key Activities, and Results in a clear, actionable format. Ideal for teams, managers, and performance reviews. Each section is fully editable to match your organizational strategy. Compatible with PowerPoint, Keynote, and Google Slides.