


Features
- 5 Unique slides
- Fully editable and easy to edit in Microsoft Powerpoint, Keynote and Google Slides
- 16:9 widescreen layout
- Clean and professional designs
- Export to JPG, PDF or send by email


Do you have any questions?
Recommend


4 slides
Employee Performance Feedback
Showcase progress clearly with this Employee Performance Feedback presentation. Featuring skill-based metrics, productivity scores, and analysis ratings, this layout uses visual data bars to evaluate team performance at a glance. Perfect for HR reviews, team assessments, or quarterly check-ins. Fully editable in PowerPoint, Keynote, and Google Slides.


7 slides
Security Infographic Presentation Template
Security is the key to protecting your information and the future of your business. Security is the ability to defend a position and data from threats. This presentation template is a great way to show how important security is for your businesses. This includes physical security and digital security. With this template show how a strong security strategy is essential. Your first priority as a business owner should be the safety and security of your workplace. This template features the perfect security illustrations you need to get your point across when displaying this presentation.


6 slides
Concept Web with Spider Diagram Layout Presentation
Map out complex ideas with clarity using the Concept Web with Spider Diagram Layout Presentation. This dynamic radial format is perfect for showing interrelated components, skills analysis, or performance metrics at a glance. Ideal for brainstorming, strategy, or education—fully editable in Canva, PowerPoint, Keynote, and Google Slides.


10 slides
Profitability and Cost Analysis
Streamline your financial storytelling with this interlinked diagram template. Designed for business consultants, CFOs, and analysts, it helps visualize cost components and profit drivers across five stages. Each segment is clearly labeled and color-coded for easy comprehension. Fully customizable in PowerPoint, Keynote, and Google Slides.


6 slides
Effective Communication in Meetings Presentation
Communicate with impact using this circular diagram template designed to visualize six key elements or steps for better meeting communication. With centered speech bubble icons and balanced layout, it's ideal for sharing best practices, communication roles, or team feedback loops. Fully customizable in PowerPoint, Keynote, and Google Slides.


12 slides
Customer Satisfaction Smile Rating Presentation
Measure customer happiness with this engaging customer satisfaction smile rating template! Featuring a visual scale from dissatisfaction to delight, this design helps businesses track feedback and identify improvement areas. Ideal for reports, surveys, and performance reviews. Fully customizable and compatible with PowerPoint, Keynote, and Google Slides.


7 slides
Title Infographic
These presentation slides showcase a variety of title designs, each uniquely styled to suit different thematic contexts, using vibrant colors and dynamic typography to captivate and engage audiences. The designs are exceptionally versatile, making them suitable for a wide range of professional settings, including marketing, design, business strategy, and corporate overviews. Each slide is thoughtfully crafted to introduce sections, highlight key concepts, or set the stage for in-depth discussions, ensuring that every part of the presentation connects with the audience effectively. The strategic use of elements such as color blocks, minimalist layouts, and bold text helps in emphasizing the core message, making these slides an ideal choice for presenters looking to make an impactful introduction or to clearly delineate sections within their presentations.


5 slides
Data Breach Infographics
A data breach refers to an incident where unauthorized individuals gain access to sensitive, confidential, or protected information. This infographic is designed to educate and raise awareness about data breaches, their causes, impacts, and preventive measures. It presents complex information in an understandable way, making it accessible to a wide range of audiences. The template incorporates relevant statistics and data to provide a comprehensive understanding of the prevalence and scale of data breaches. It includes graphs, charts, and infographics to visualize the frequency, magnitude, and industries most affected by data breaches.


23 slides
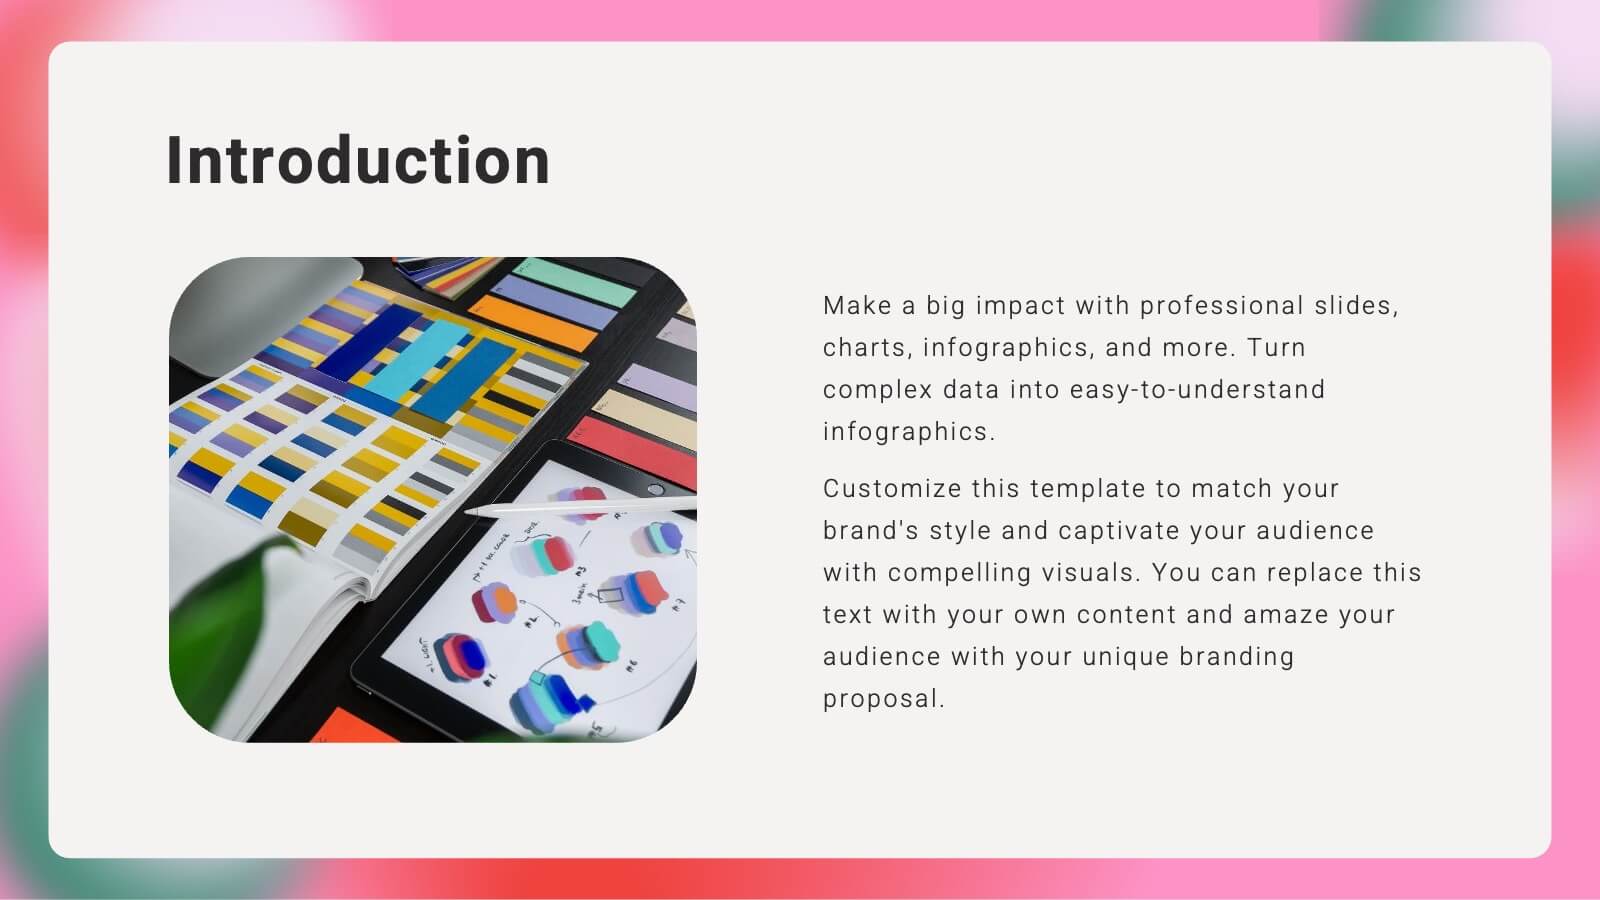
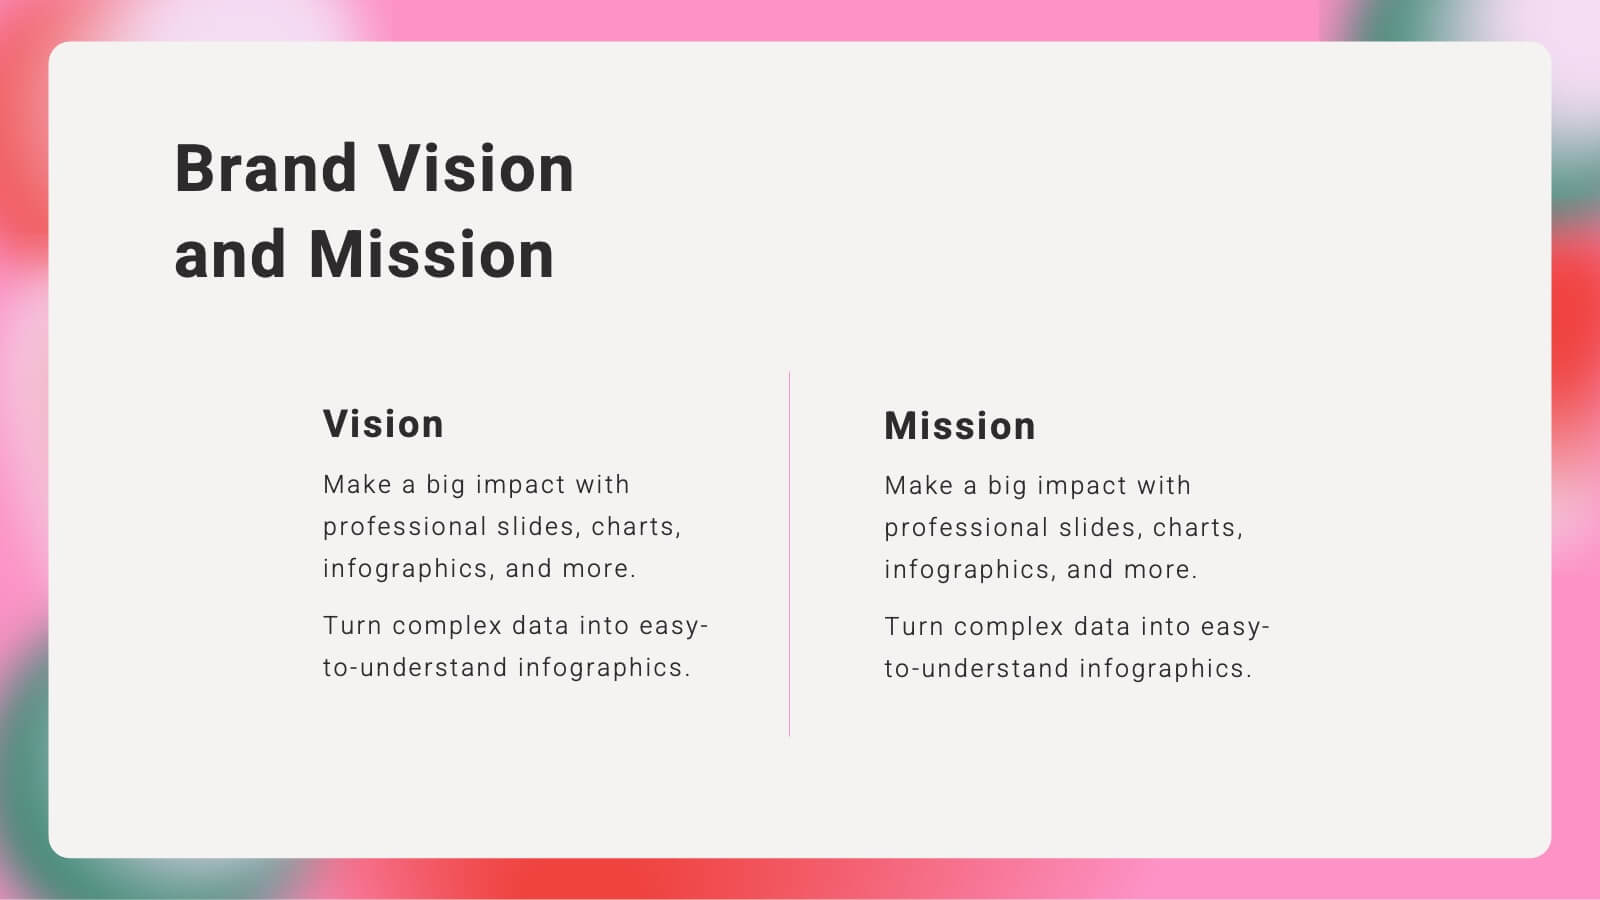
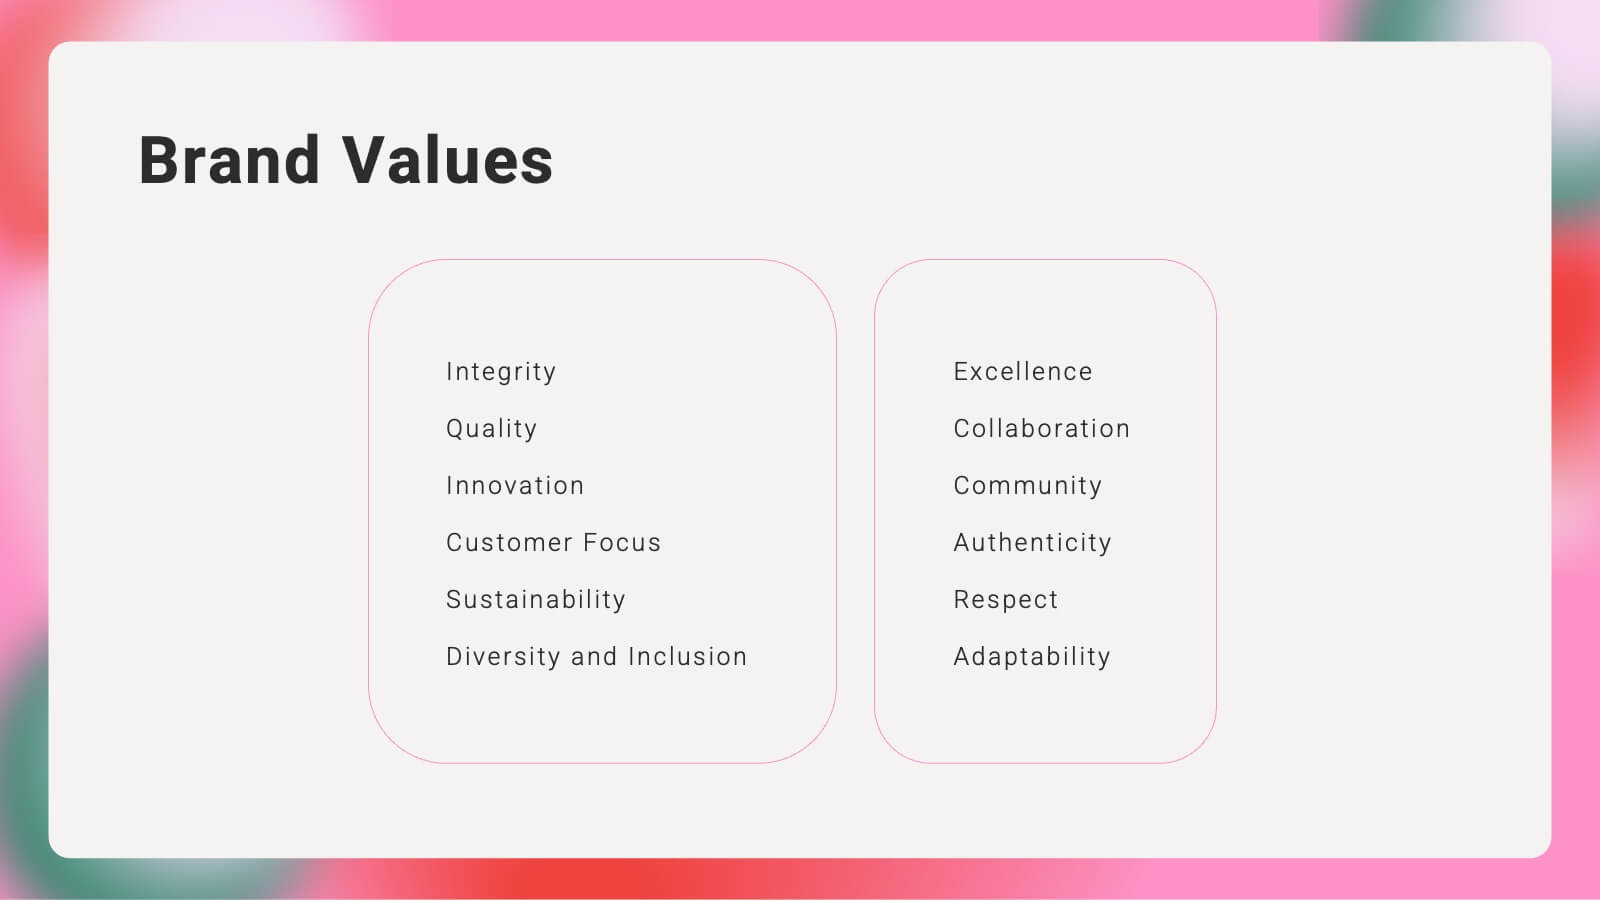
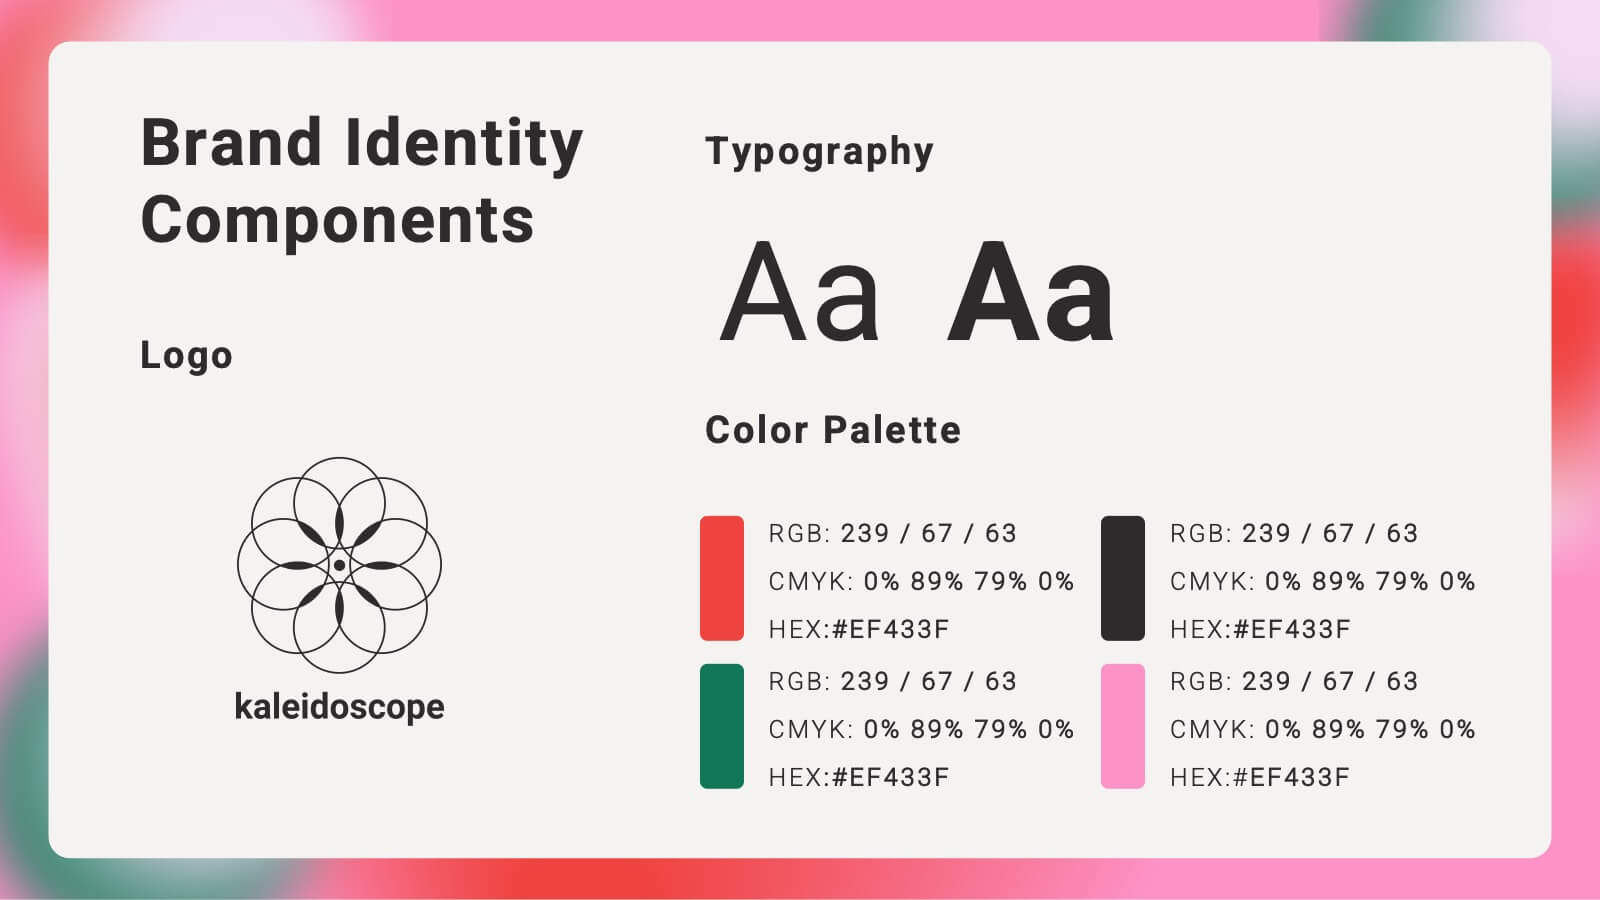
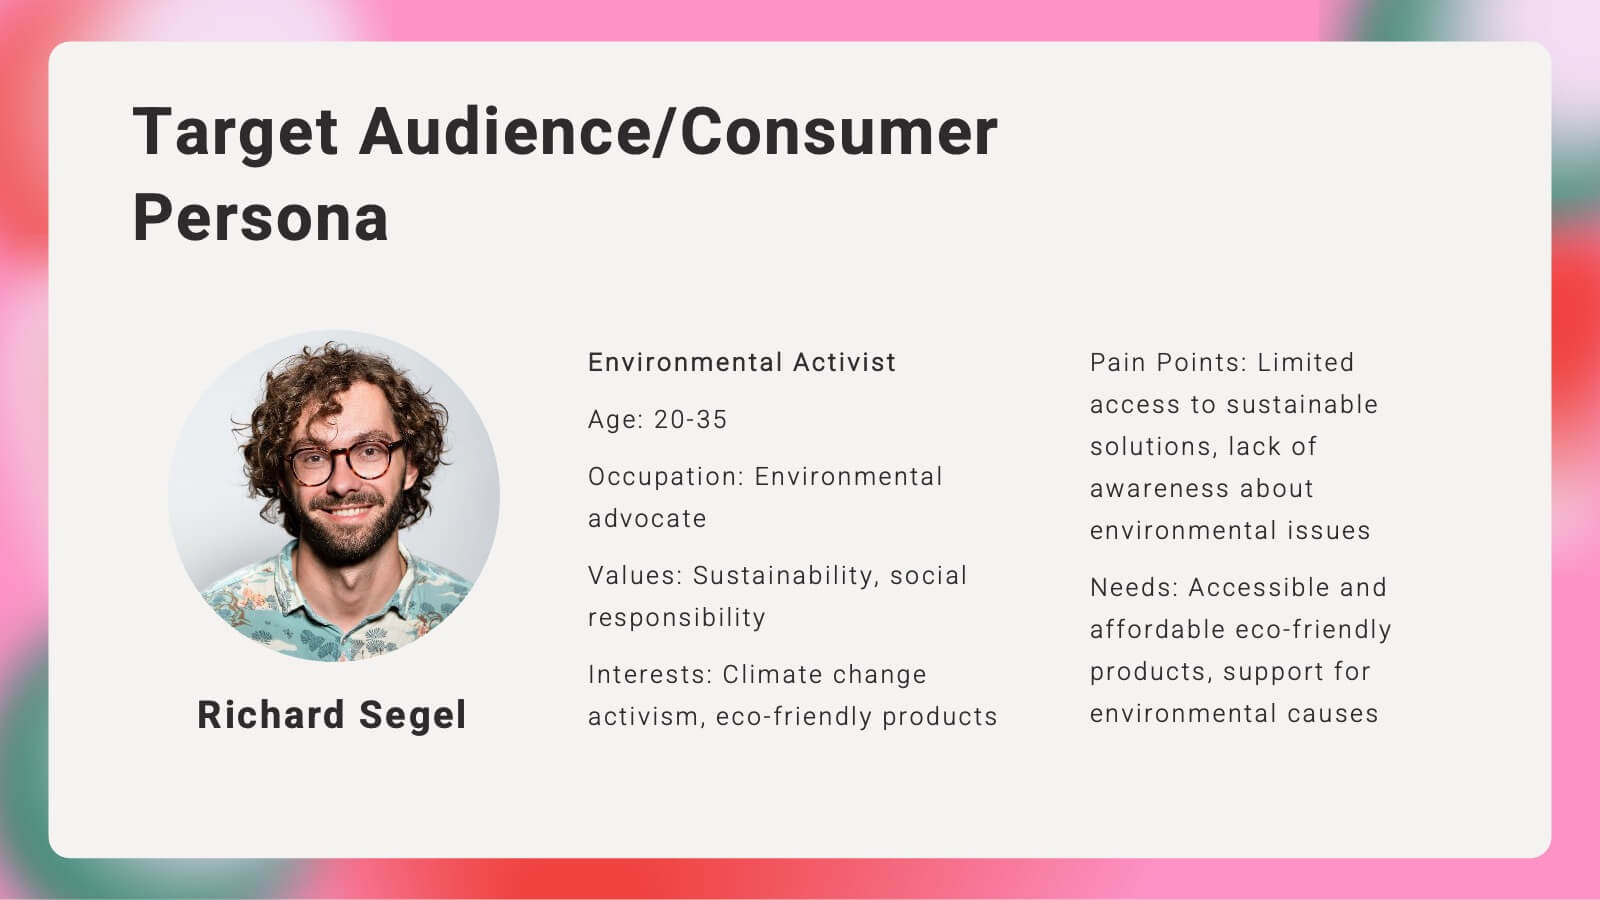
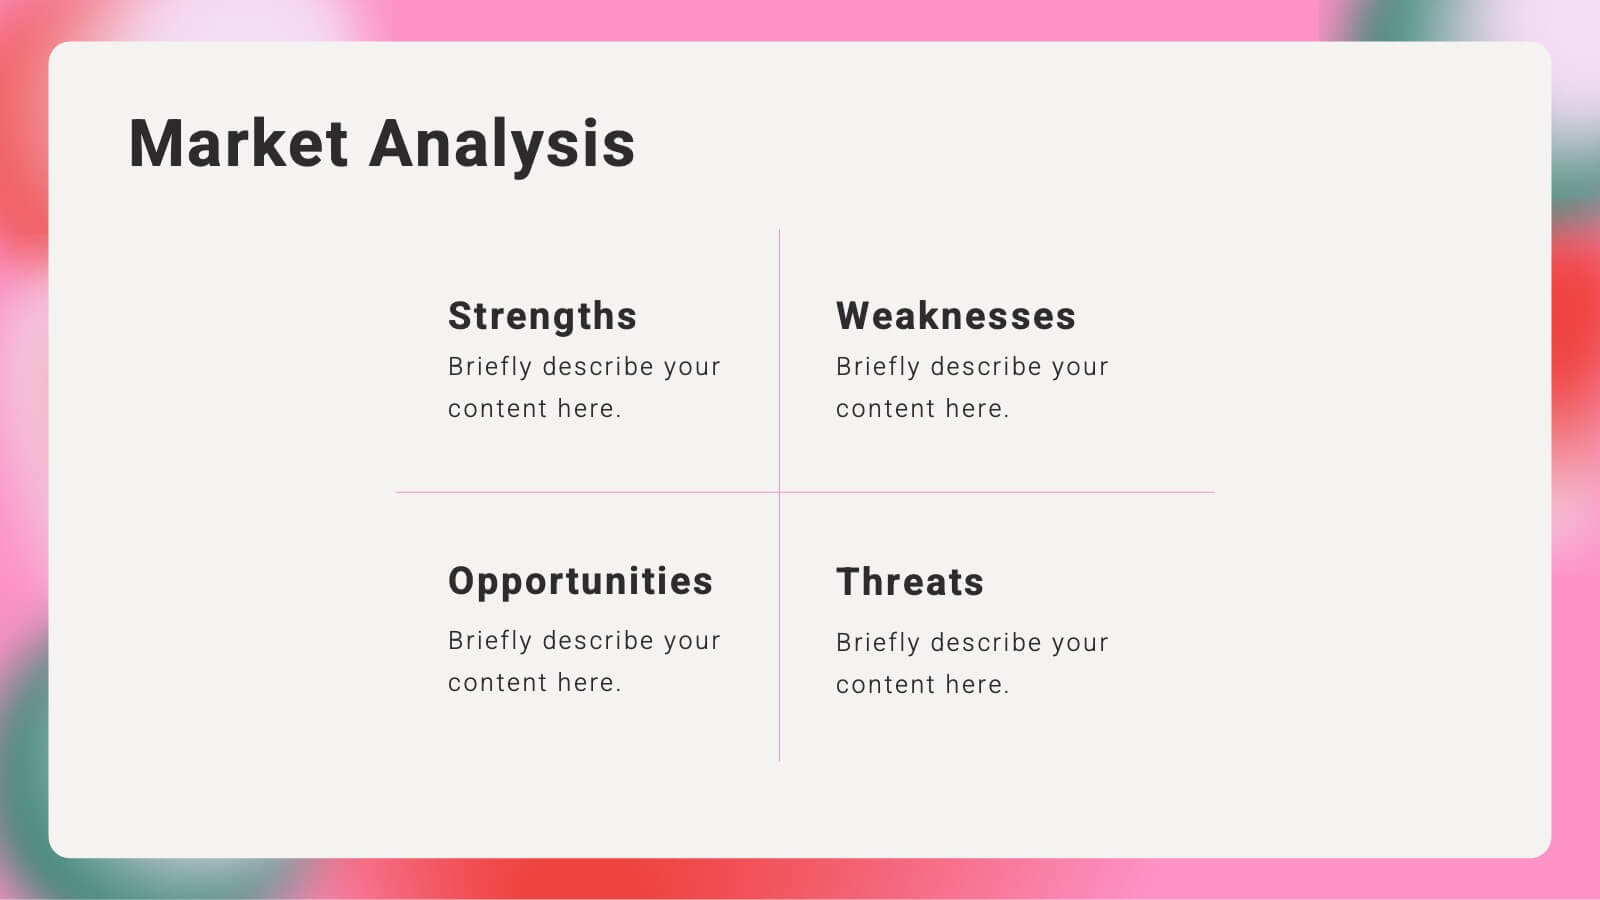
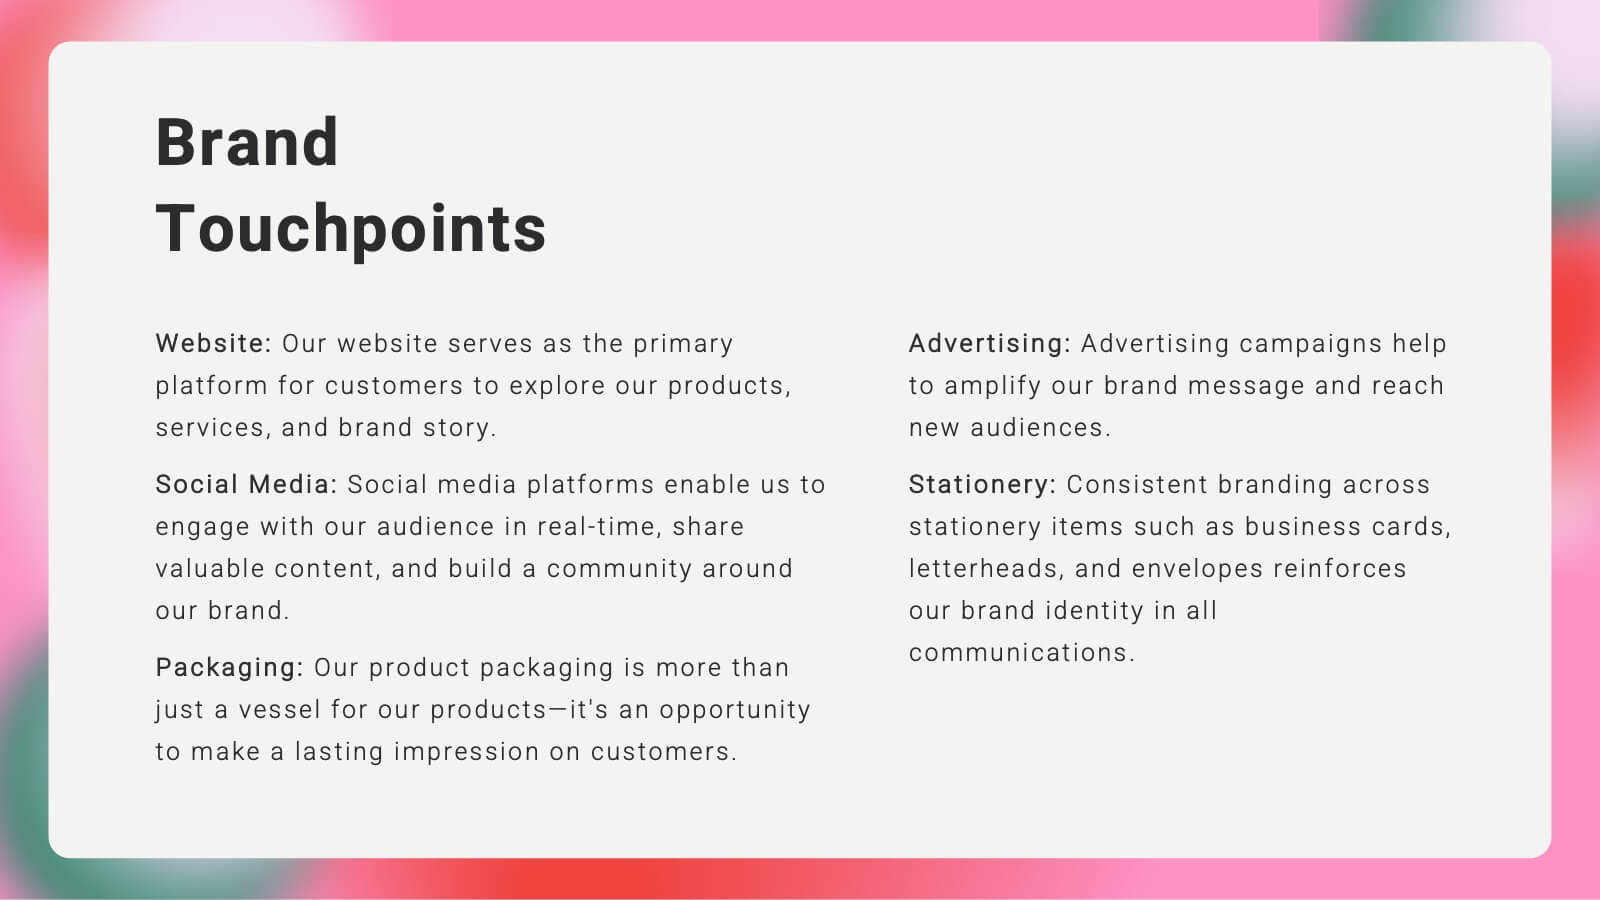
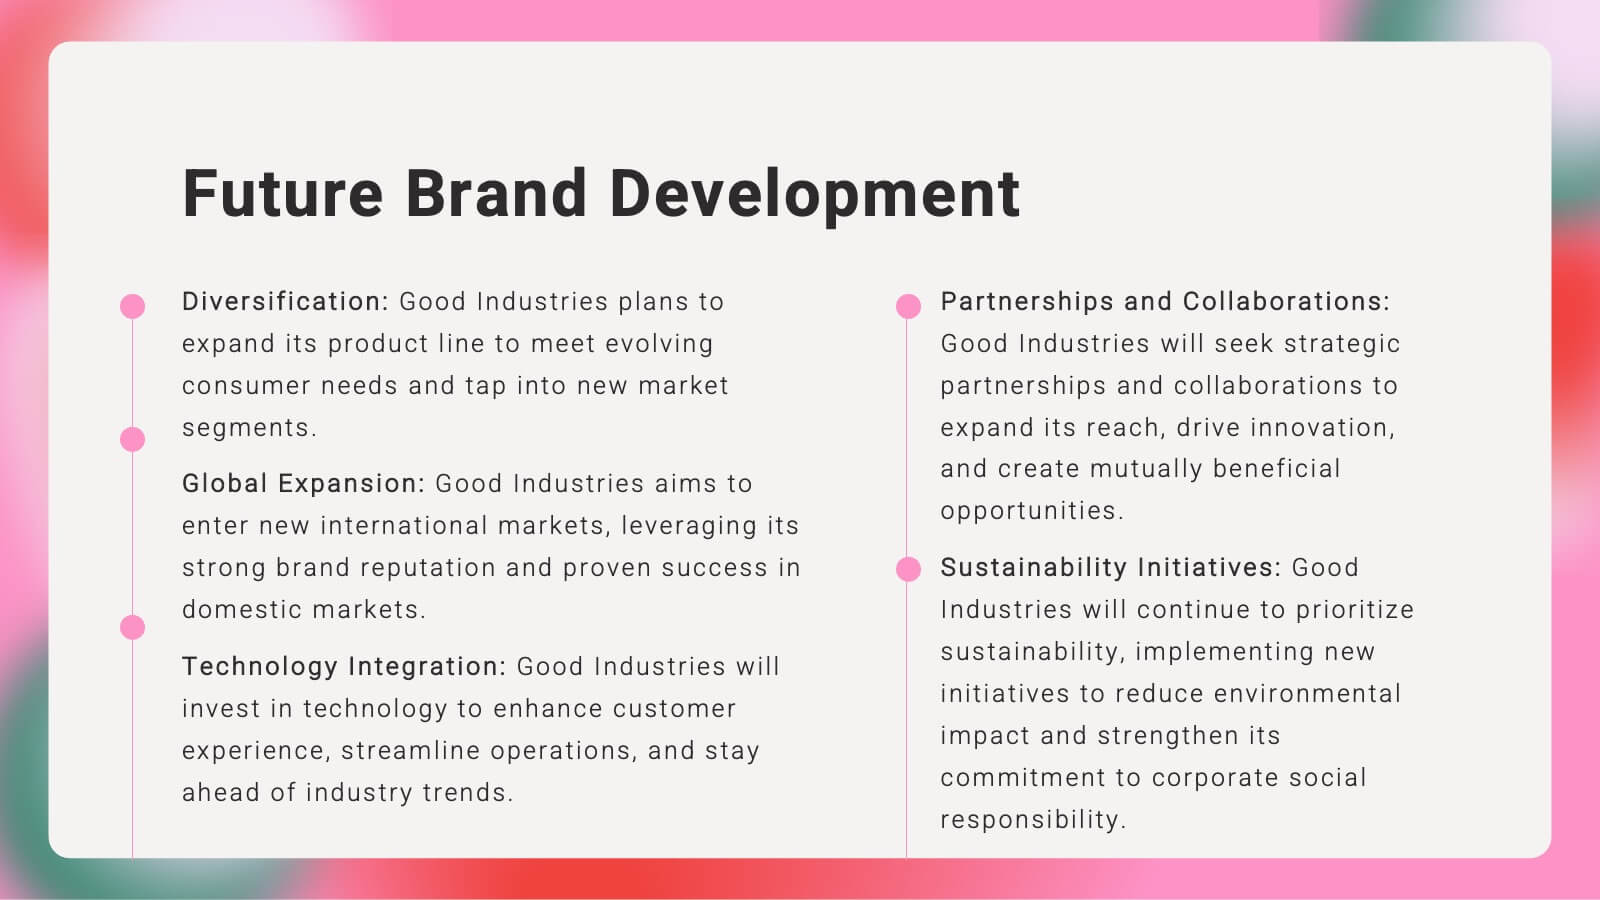
Kaleidoscope Brand Strategy Report Presentation
Craft a compelling narrative for your brand with this vibrant brand strategy presentation template. Designed to cover every facet of brand development, from vision and mission to market analysis and consumer personas, this template is an essential tool for businesses looking to establish a strong brand identity. It incorporates visually engaging slides that outline brand voice, values, and touchpoints, facilitating a thorough understanding of strategic branding. Compatible with platforms like PowerPoint, Google Slides, and Keynote, it is accessible across various devices, making it perfect for collaborative planning and presentations.


5 slides
Geographic Oceania Overview Presentation
Visualize your regional data with a sleek, easy-to-read map highlighting key areas across Oceania. Perfect for presenting geographic insights, business distribution, or market trends, this clean layout ensures every detail stands out clearly. Fully compatible with PowerPoint, Keynote, and Google Slides for simple editing and professional presentations.


26 slides
Jacob Free Powerpoint Template
Are you looking for a classy designer template? Then the Jacob is for you. The Jacob template is a chic, beautiful, modern and easy to use template. It's suitable for all types of businesses, from small business accounts, to large corporate companies and even personal use. It has a very hip aesthetic, with pink tones giving it a very fresh appealing look. The pictures and charts are easy to understand as well as easy to read without too much confusion on reading informative content. Easy to use high quality charts and graphs makes this template best for all types of businesses.


5 slides
Transportation Industry Market Trends Presentation
Visualize industry shifts and delivery dynamics with this road-themed presentation layout. Featuring a stylized highway path and moving vehicle graphic, this template helps you break down four key market trends in a clear, visual progression. Each stop on the route includes editable icons and text blocks for streamlined storytelling. Perfect for logistics analysts, transportation planners, and consultants. Fully customizable in PowerPoint, Keynote, and Google Slides.


21 slides
Mythspire Market Research Presentation
This market research template offers a clean design for presenting objectives, data collection, analysis, and findings. Perfect for showcasing research methodologies, visualizations, and actionable recommendations. Fully customizable and ideal for business or academic presentations. Compatible with PowerPoint, Keynote, and Google Slides.


7 slides
North America Political Map Infographic
This North America Political Map infographic template provides a visual representation of various data points across the continent. It is compatible with PowerPoint, Google Slides, and Keynote, making it versatile for different presentation platforms. The template includes different styles of maps and charts, such as population statistics, demographic data, and economic indicators. Color-coded for easy interpretation, it allows presenters to highlight specific regions and data with clarity. The design is clean and professional, with icons and graph elements that enhance the presentation of geographical and statistical information.


6 slides
Sales Strategy 30-60-90 Day Plan Presentation
Drive sales success with this structured 30-60-90 day strategy template! Designed to help sales teams and professionals set clear objectives, track progress, and optimize performance, this layout ensures a smooth transition from planning to execution. Fully customizable and compatible with PowerPoint, Keynote, and Google Slides for seamless presentations.


4 slides
Customer Type Identification Strategy Deck Presentation
Visualize your customer segmentation strategy with this layered targeting slide. Perfect for identifying different customer types based on behavior or loyalty levels, this layout uses a human silhouette and concentric zones to highlight proximity to the core user. Fully editable and compatible with PowerPoint, Keynote, and Google Slides.


6 slides
Big Data Analytics Presentation
The "Big Data Analytics Presentation" template is expertly designed to visualize global data analytics strategies across different regions. The map highlights key areas in distinct colors, drawing attention to where data initiatives are being implemented or where significant market trends are observed. Each region on the map corresponds to specific titles that can be customized to represent various analytical focuses such as market penetration, user demographics, or revenue growth. Accompanying the map are percentage circles that quantify planning, execution, and success rates, making this template invaluable for analysts, data scientists, and corporate strategists who need to present complex data in an easily digestible format. This visual tool is perfect for enhancing presentations, strategic meetings, and reports with a clear, concise, and visually engaging representation of data-driven insights.