


Features
- 5 Unique slides
- Fully editable and easy to edit in Microsoft Powerpoint, Keynote and Google Slides
- 16:9 widescreen layout
- Clean and professional designs
- Export to JPG, PDF or send by email


Do you have any questions?
Recommend
6 slides
Team Objective Tracker and Milestone Plan Presentation
Stay on top of team goals with the Team Objective Tracker and Milestone Plan Presentation. Designed for performance reviews, progress reports, or planning meetings, this template visualizes KPIs with clarity. Each slide is fully customizable in PowerPoint, Keynote, or Google Slides—ideal for project leads and department managers.


26 slides
Digital Art Tools and Techniques Presentation
Unleash your creativity with this vibrant presentation on digital art tools and techniques. Covering essential topics like graphic design software, digital brushes, layering methods, and creative workflows, this template helps artists and designers enhance their skills. Fully customizable and compatible with PowerPoint, Keynote, and Google Slides for a seamless and visually stunning presentation experience.


4 slides
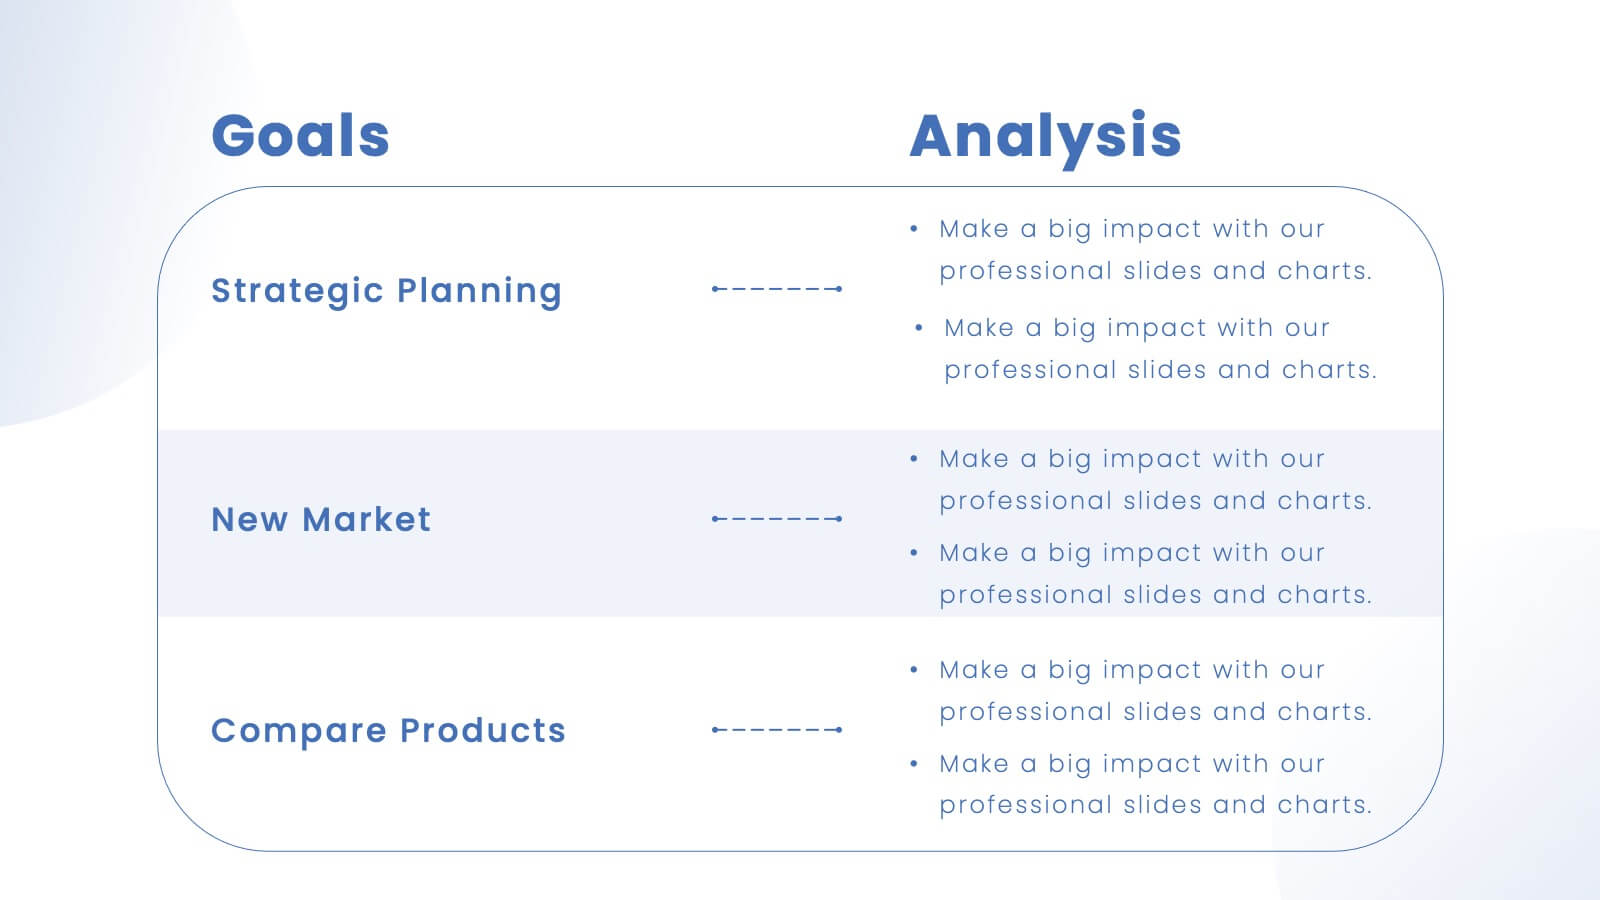
Product List Table for Quick Overview
Showcase product highlights at a glance with the Product List Table for Quick Overview Presentation. This sleek, column-based layout allows you to compare up to three product categories or service features side by side. Each section includes an icon, title, and space for three concise text rows—ideal for summarizing specifications, benefits, or pricing tiers. Fully editable in PowerPoint, Keynote, and Google Slides.


6 slides
Spider Diagram for Concept Mapping
Map complex relationships with ease using the Spider Diagram for Concept Mapping Presentation. This slide features a central radial chart connected to six surrounding nodes—each paired with editable titles, icons, and detailed text sections. Perfect for visualizing project scopes, idea clustering, strategic alignment, or team functions. Customize colors, icons, and text directly in PowerPoint, Keynote, or Google Slides. The clean, professional layout ensures clear communication across all types of presentations.


6 slides
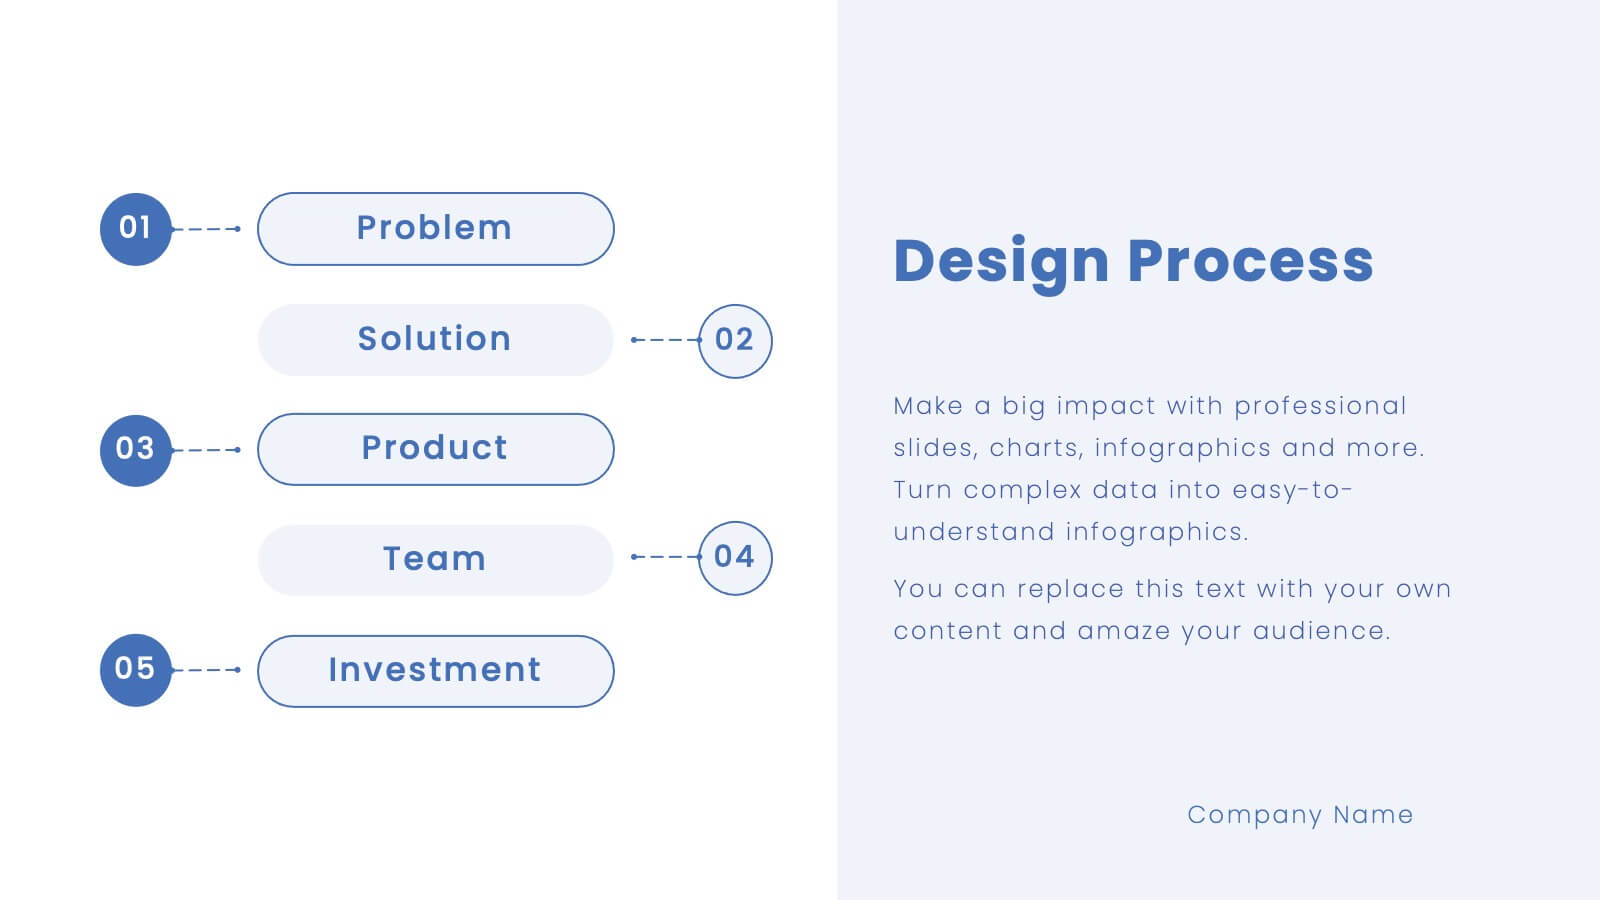
Innovative Design Thinking Steps Presentation
Bring structure to creativity with a bold, modern layout that walks your audience through each phase of innovation. Perfect for showcasing processes, strategy development, or brainstorming frameworks, this presentation makes complex ideas feel simple and engaging. Fully compatible with PowerPoint, Keynote, and Google Slides for effortless editing and presentation.


7 slides
3D Modeling Infographic
3D modeling is the process of creating three-dimensional representations of objects or scenes using specialized computer software. This infographic template is crafted to demystify the world of 3D modeling, providing a comprehensive understanding of the techniques, applications, and the creative process that brings ideas to life in the third dimension. Compatible with Powerpoint, Keynote, and Google Slides. This infographic is an invitation to the captivating universe of 3D artistry and innovation. Use this template to step into the realm where imagination meets the third dimension.


20 slides
Harmony Sales Forecast Presentation
Elevate your sales forecasting presentations with this vibrant and engaging template! Designed to captivate your audience, it covers all critical areas such as objectives, strategy, performance metrics, and opportunities. Keep your team motivated with visually striking layouts and an easy-to-follow structure. Compatible with PowerPoint, Keynote, and Google Slides for seamless integration!


7 slides
McKinsey 7S Management Infographic Presentation
The McKinsey 7S model is designed to help organizations understand the various components that need to be aligned for effective performance. This Infographic is a visually engaging way to describe the 7S framework. Use it to deliver an informative message and get your ideas across clearly using the well designed graphics. This template is fully customizable to portray your company's key points and challenges in your specific business domain. It has all the elements to make a powerful business presentation and can create engaging templates with Powerpoint, Keynote, Google Slides and more.


4 slides
Step-by-Step 30-60-90 Milestones Presentation
Present clear onboarding or strategic progressions with the Step-by-Step 30-60-90 Milestones Presentation. This layout is ideal for showcasing phased plans, goal tracking, and employee integration milestones over time. Each segment highlights a distinct 30-, 60-, and 90-day focus, helping visualize stepwise achievement clearly. Fully editable in PowerPoint, Keynote, and Google Slides.


26 slides
Leadership and Management Skills Presentation
Elevate your leadership and management training with a presentation template that's as organized and efficient as it is visually appealing. The design is tailored for clarity, with a clean, contemporary layout that speaks to professionals eager to enhance their skills. Each slide is crafted with purpose, using a smart blend of graphics and space to highlight key concepts in leadership and management. This template includes a variety of slides to cover all training aspects: from the core qualities of a leader to the intricacies of team management. Graphs and charts provide a clear representation of management theories, while comparison slides help illustrate different leadership styles. Whether for a corporate training session, a workshop for budding entrepreneurs, or a classroom lecture, this set is ready for use in PowerPoint, Keynote, and Google Slides, making it a valuable tool for any leadership development program.
3 slides
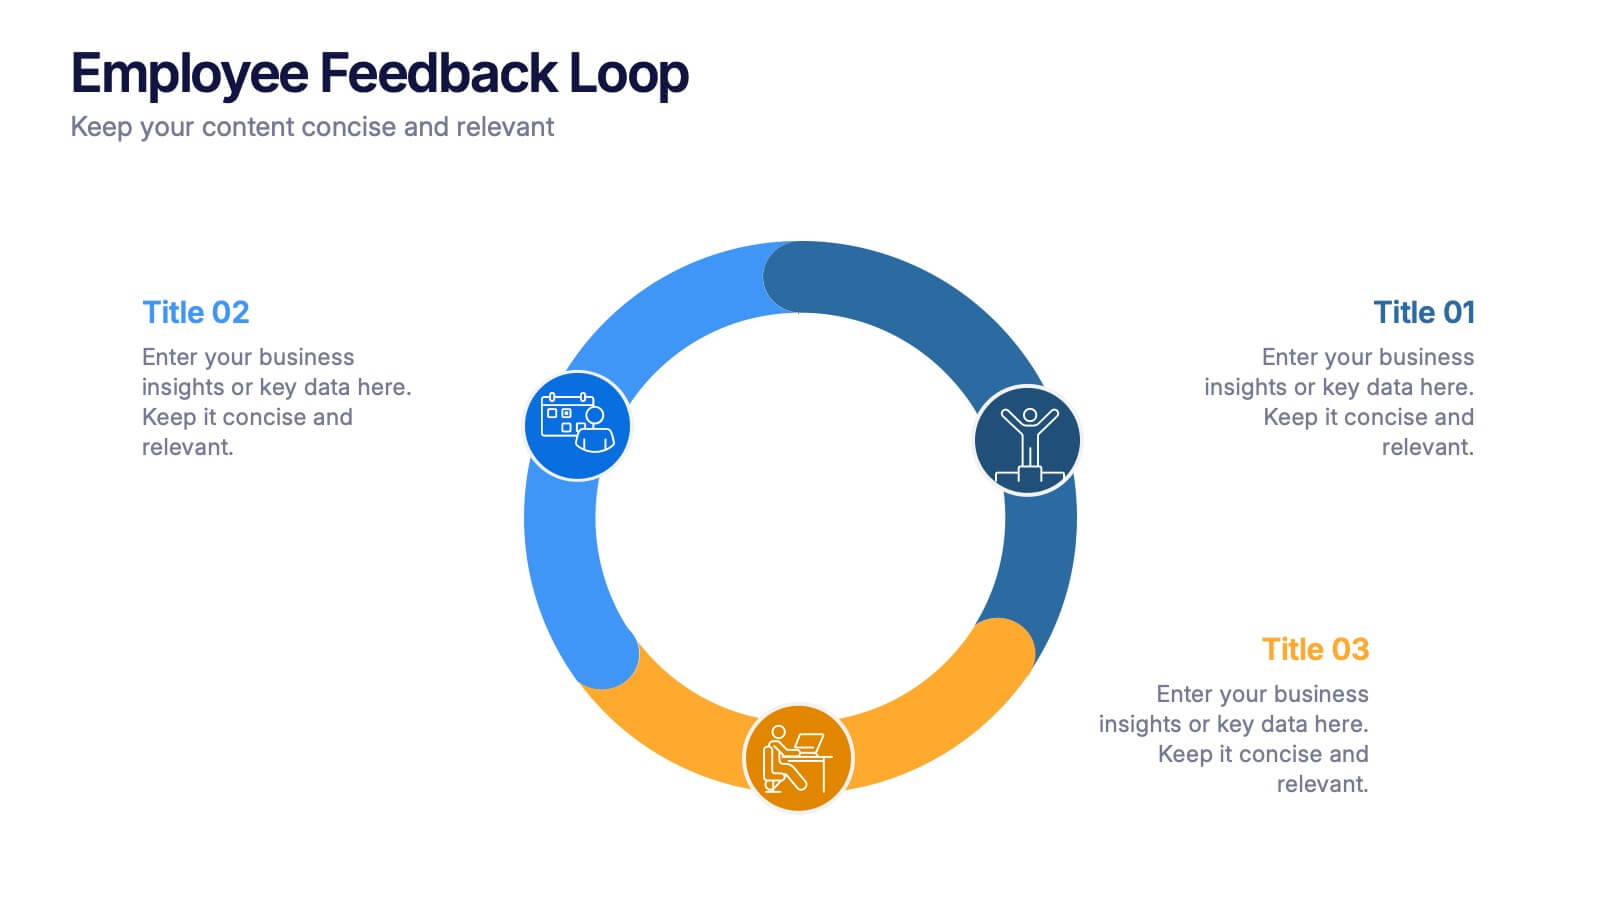
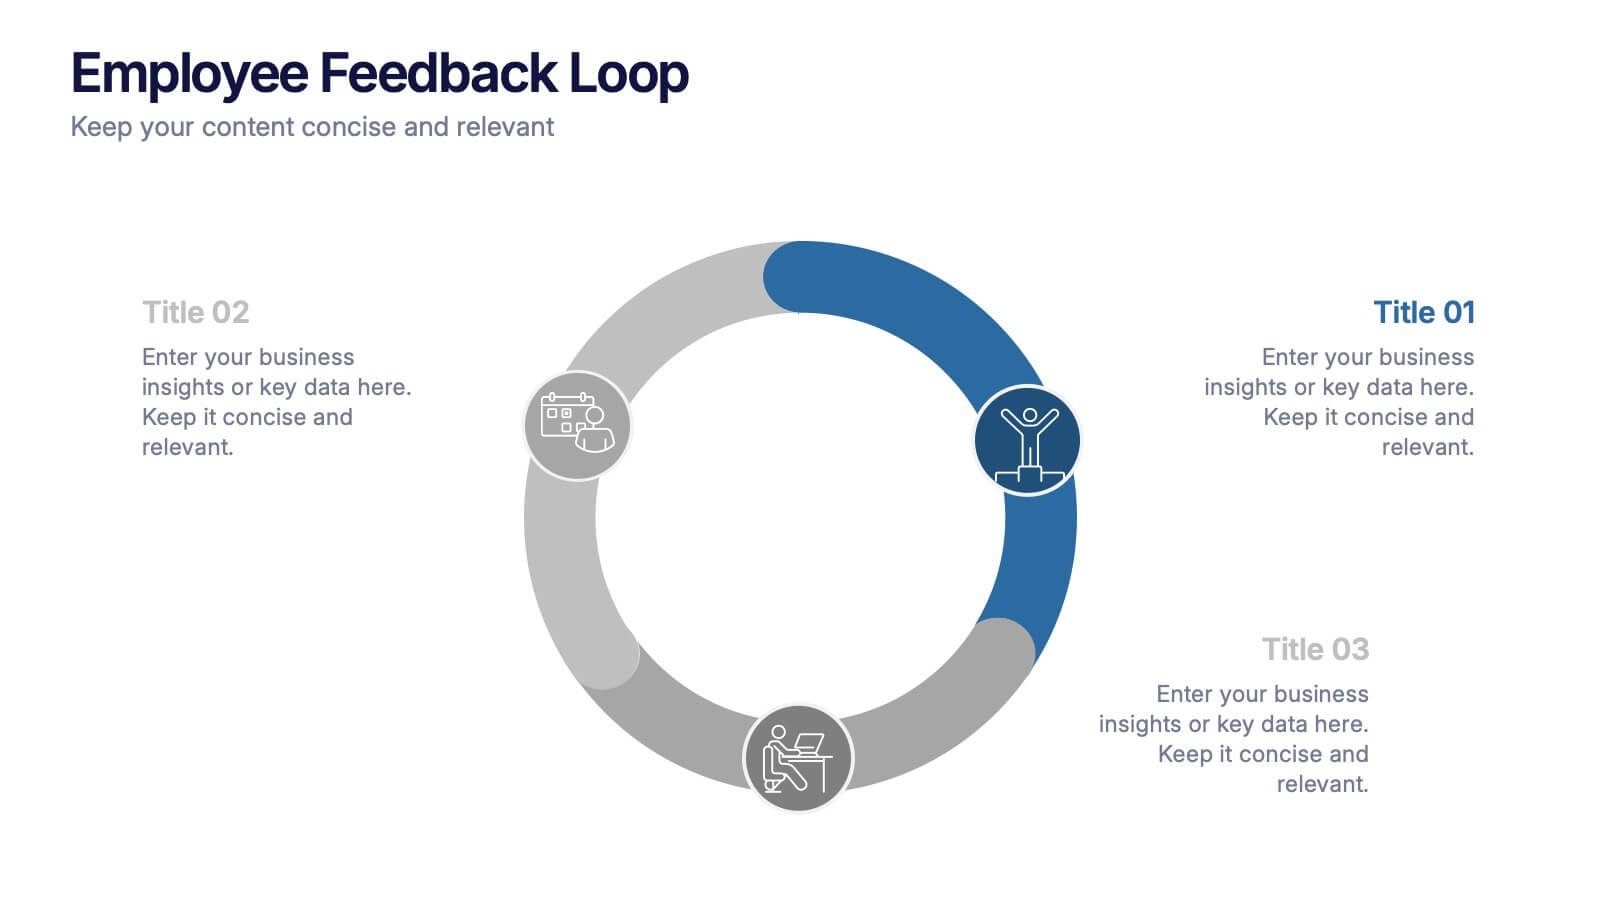
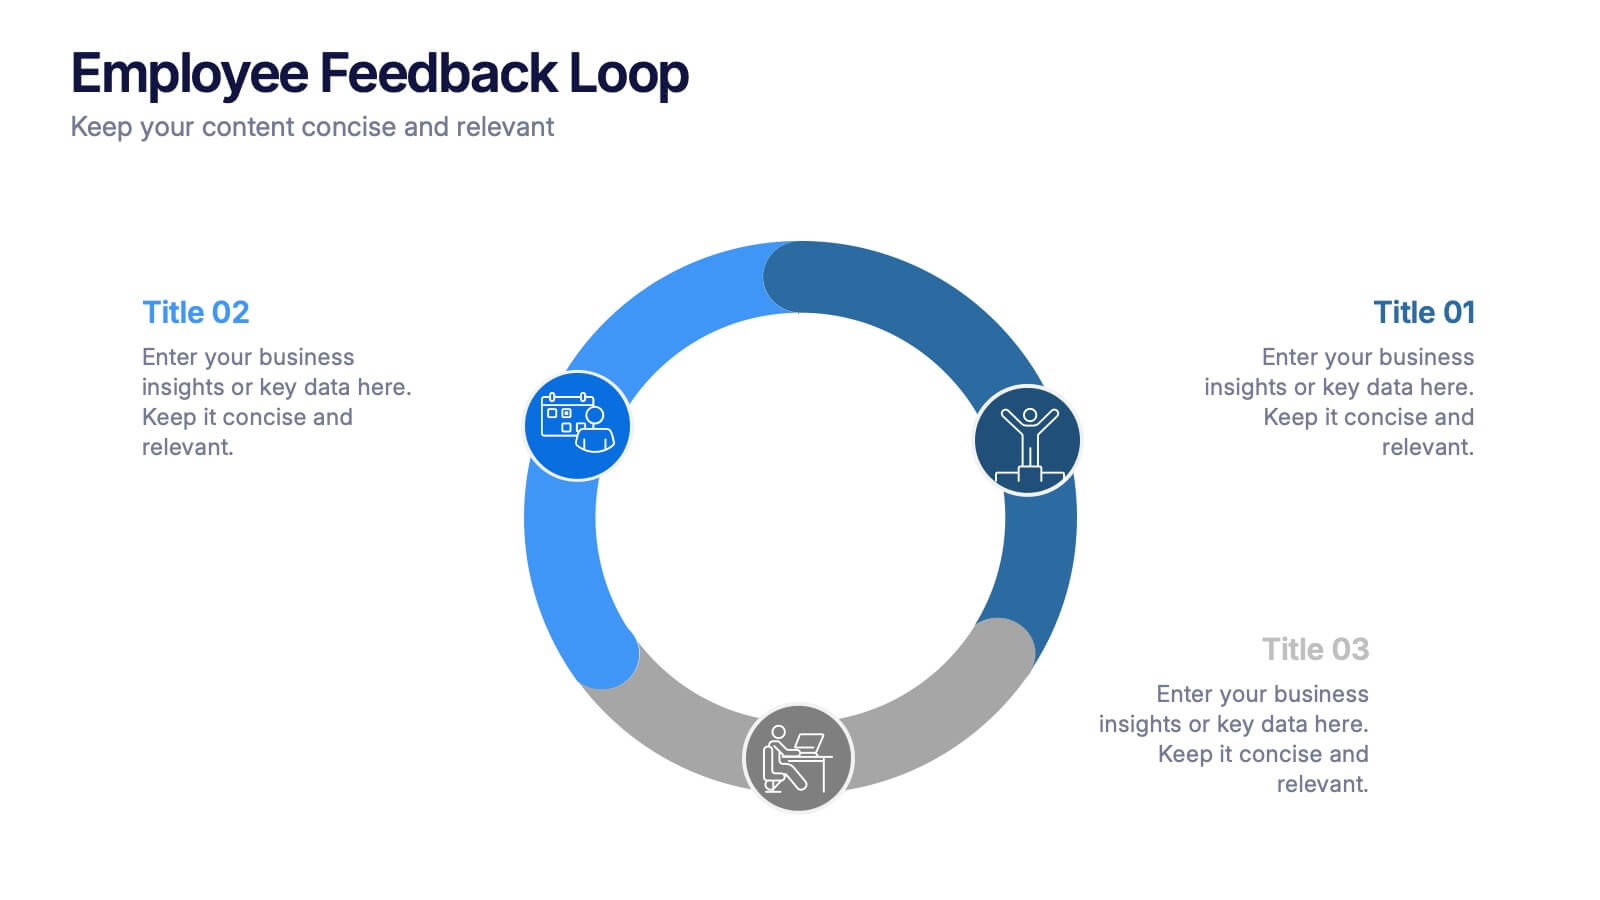
Employee Feedback Loop Presentation
Keep your team connected and continuously improving with this engaging presentation design. Ideal for showcasing communication strategies, feedback cycles, and performance insights, it helps visualize the process of collecting and acting on employee input. Fully customizable and compatible with PowerPoint, Keynote, and Google Slides for effortless, professional presentations.


5 slides
Climate Change Effects Infographics
Climate Change refers to long-term shifts in weather patterns and average temperatures on Earth. These infographic templates aim to raise awareness about the urgent need for climate action and illustrate the consequences of environmental changes. These can serve as impactful tools for discussing the consequences of climate change. Whether used in educational settings, environmental campaigns, or climate conferences, this template effectively communicates the urgency of the situation and encourages individuals and communities to take action to mitigate the impacts of climate change. Compatible with Powerpoint, Keynote, and Google Slides.


28 slides
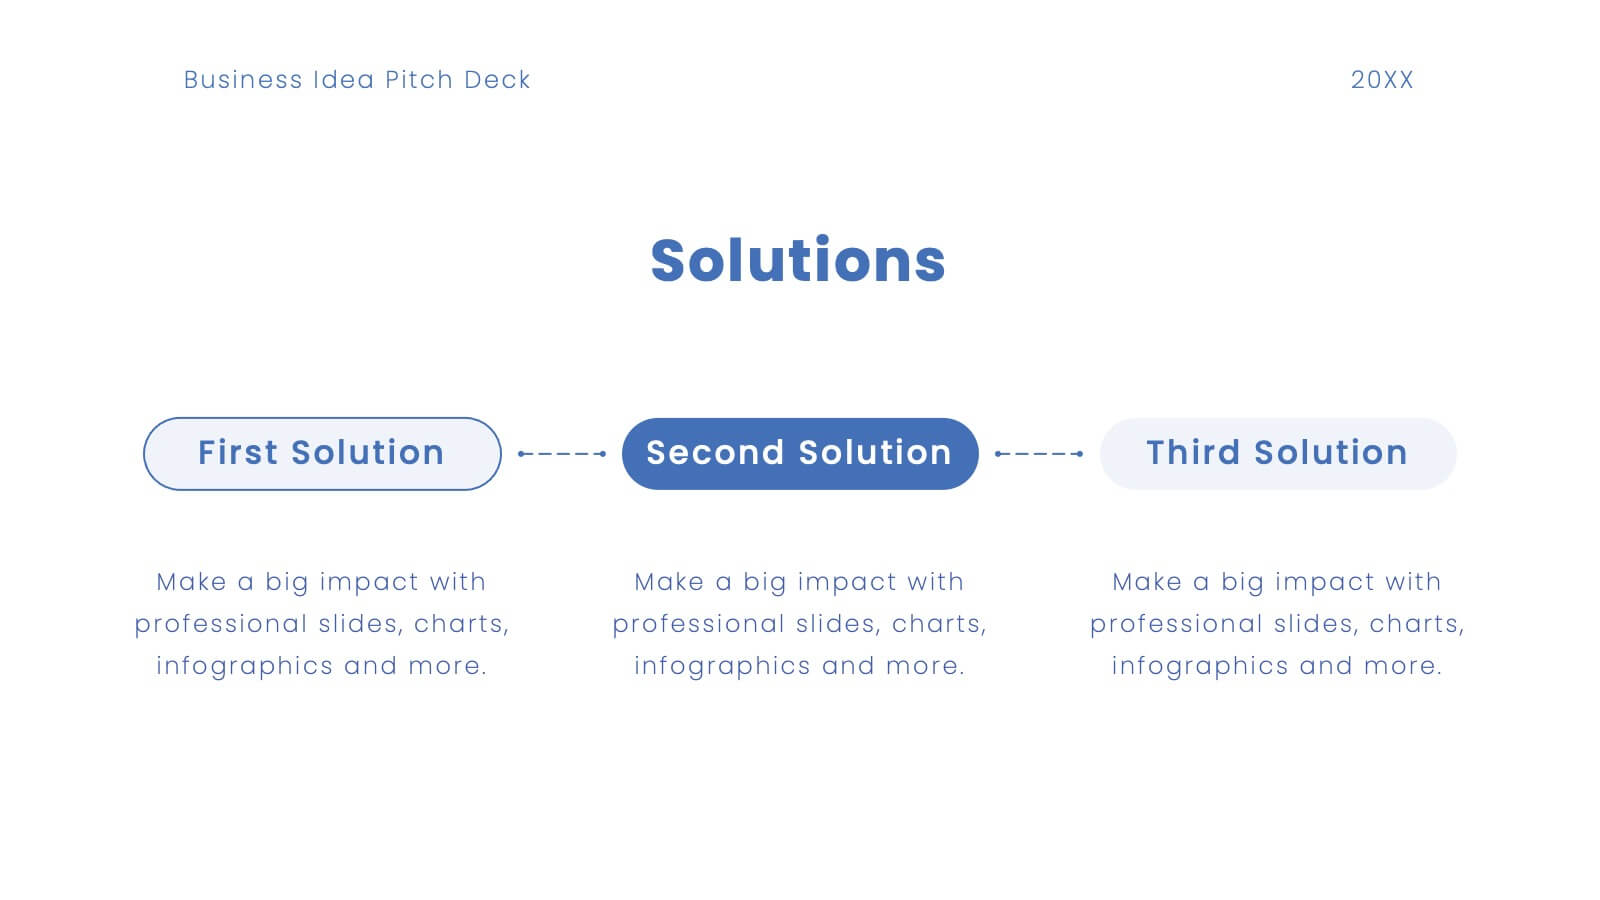
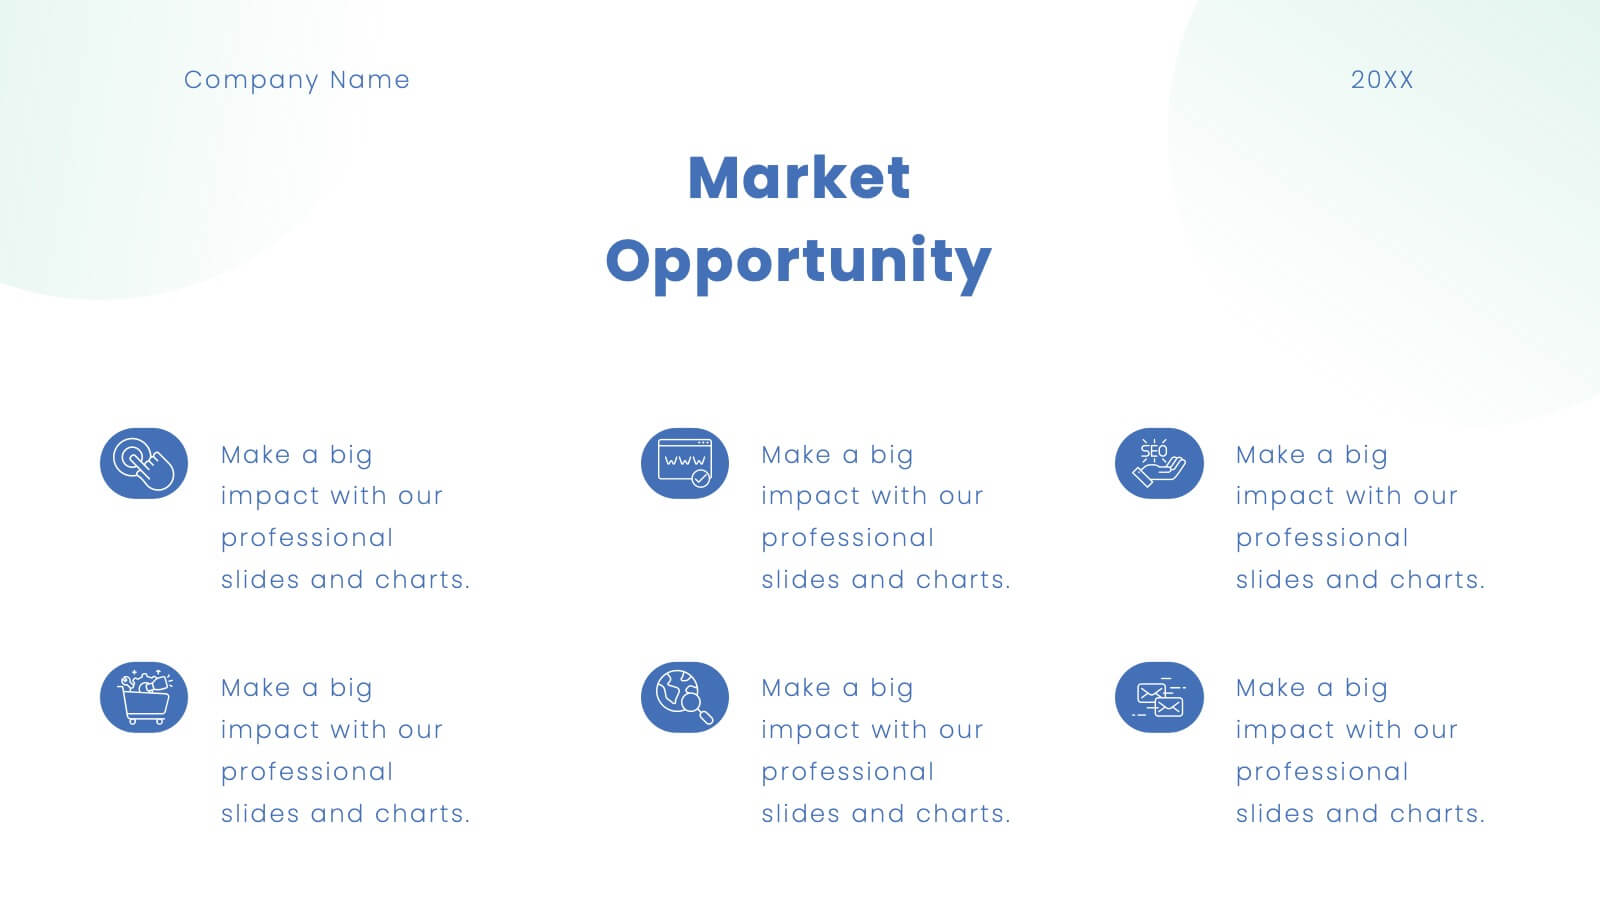
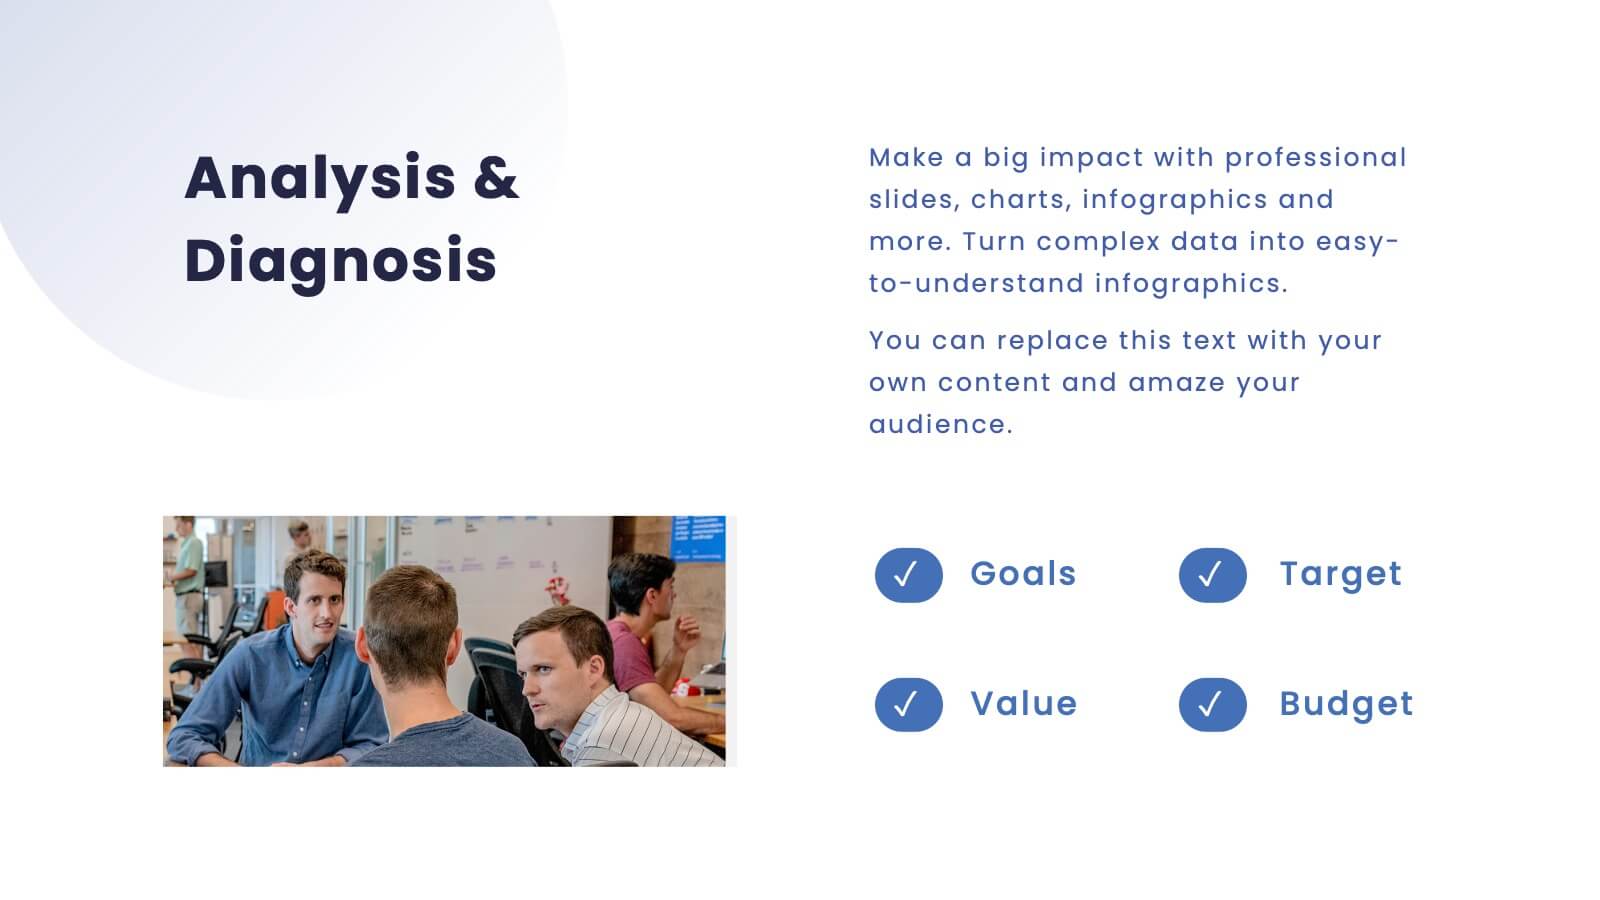
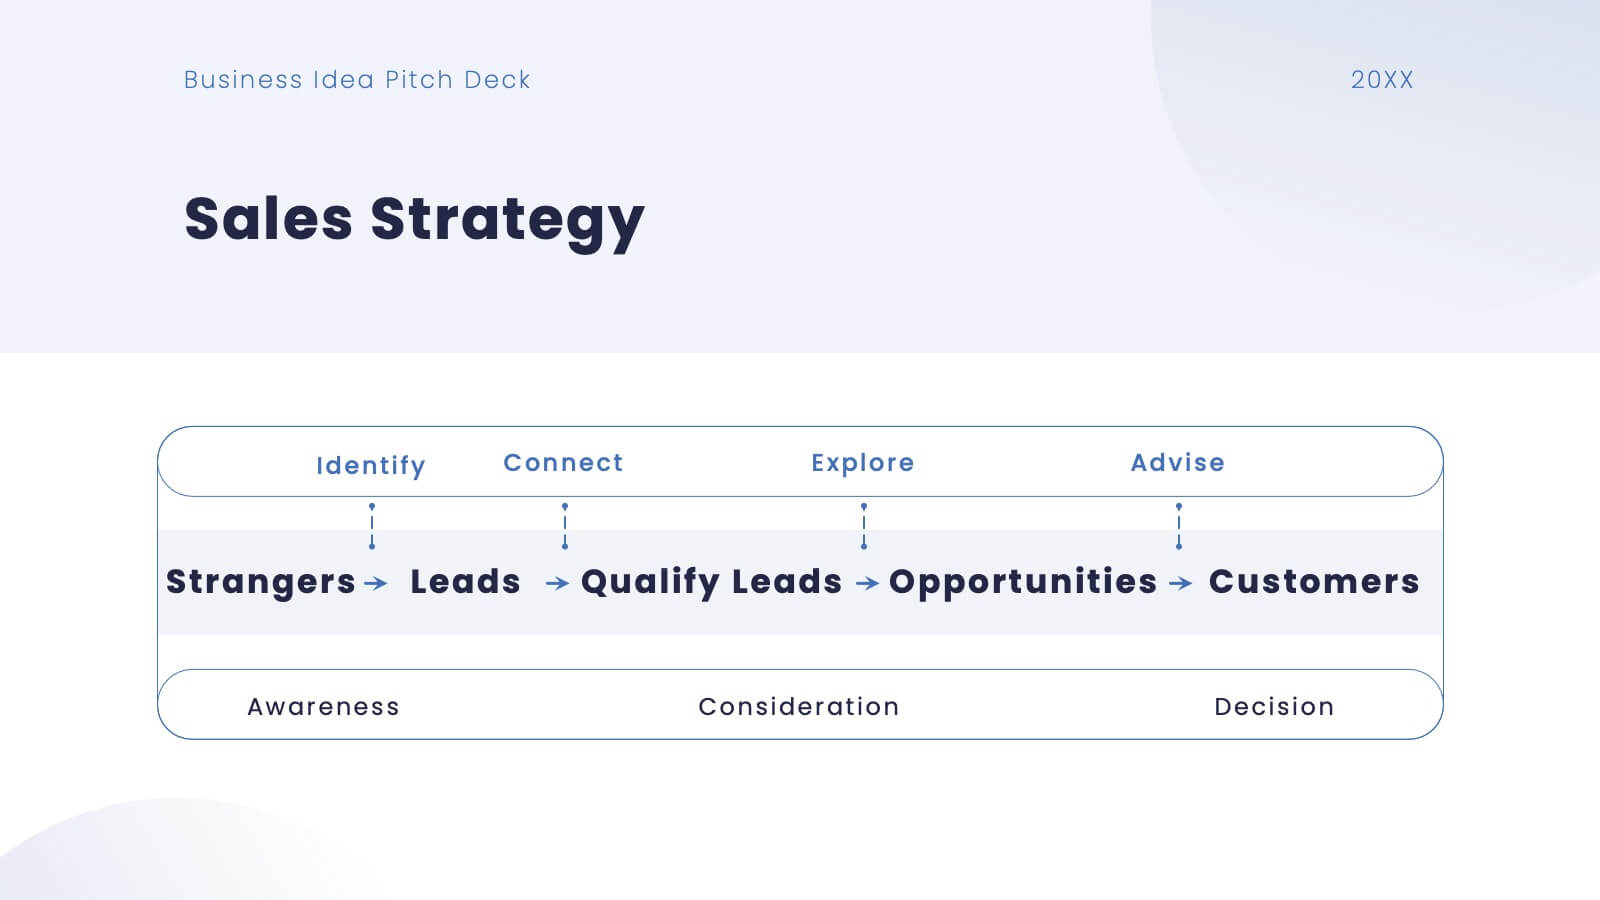
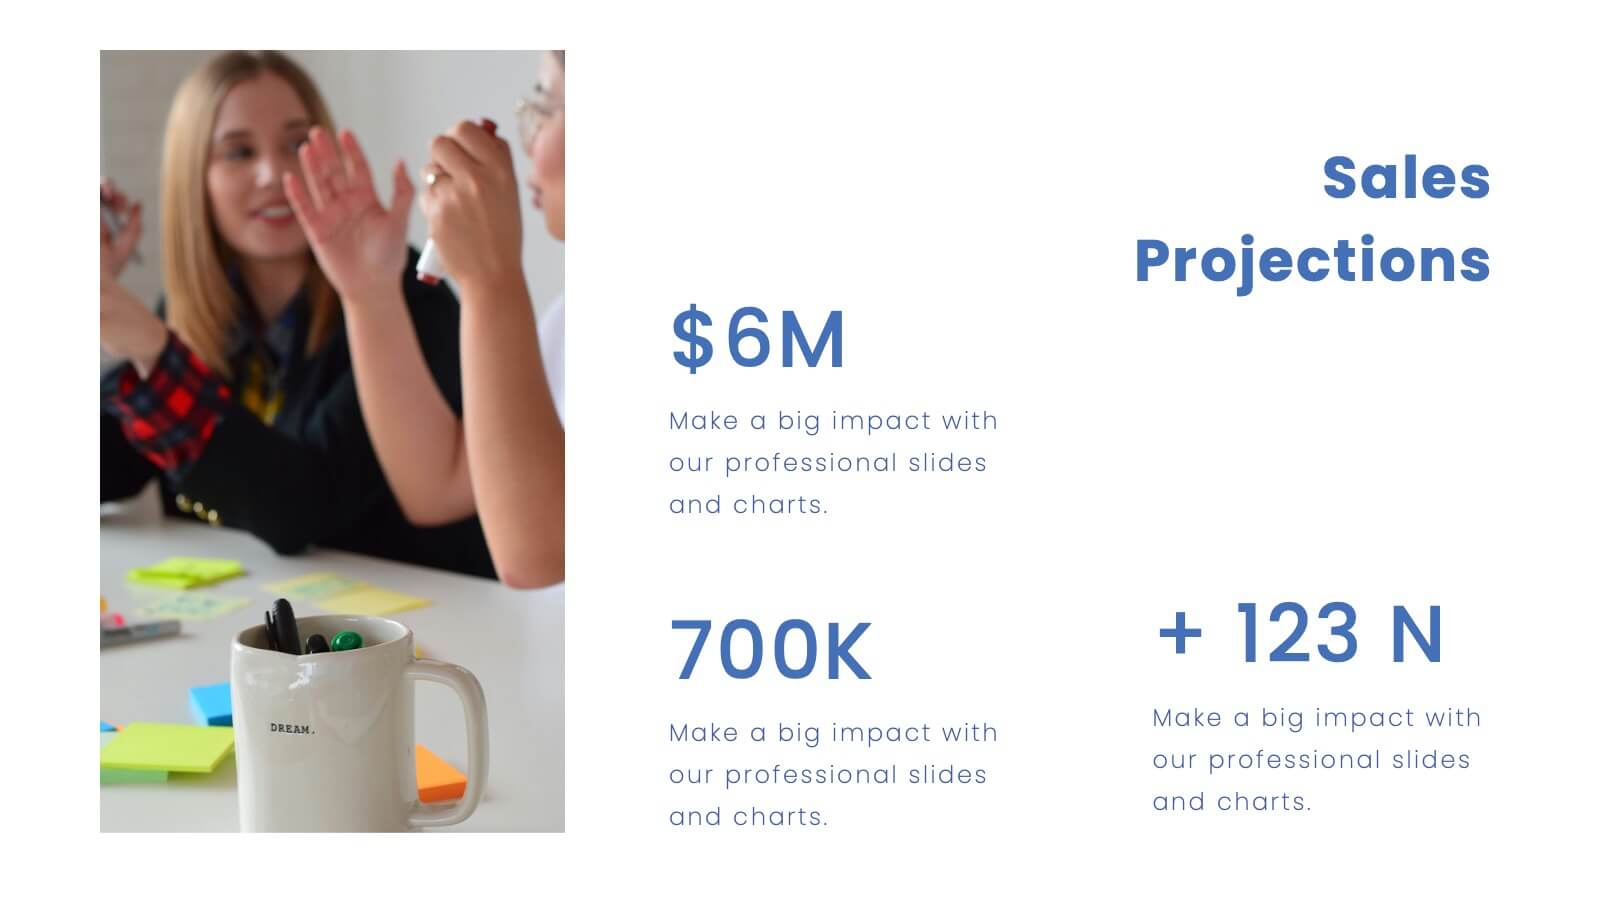
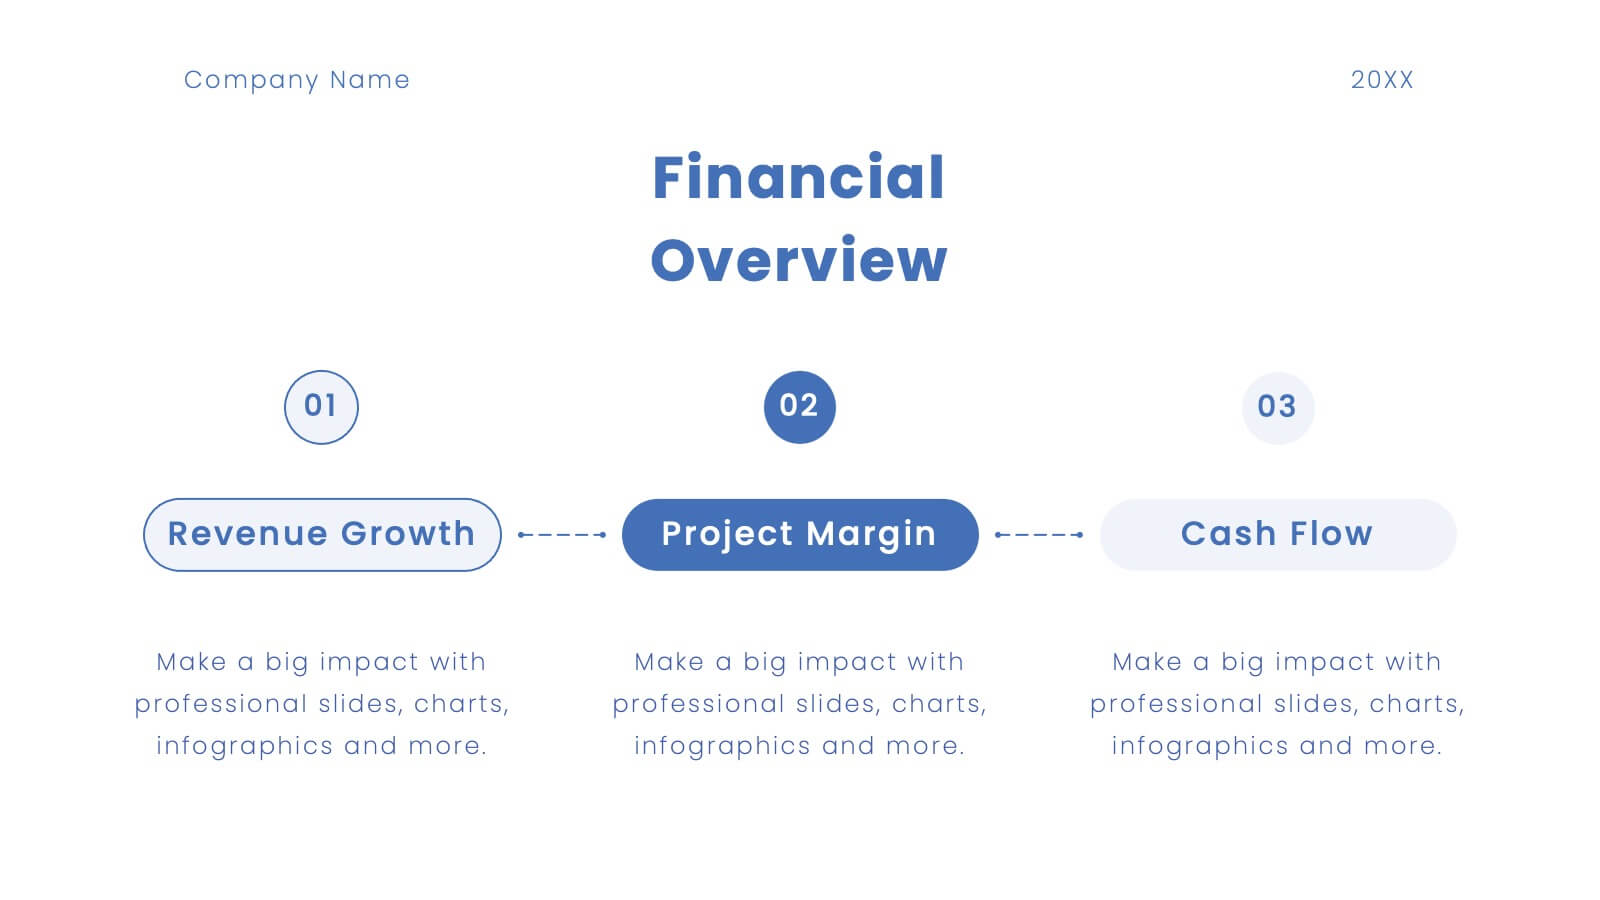
Platinum Business Idea Pitch Deck Presentation
Present your business idea with this sleek and professional pitch deck template! It includes everything from market opportunities to financial projections and sales strategies, providing a comprehensive structure for your pitch. Fully customizable and compatible with PowerPoint, Keynote, and Google Slides, this template is ideal for impressing investors and stakeholders.


5 slides
Process Improvement Infographics
Introducing our Process Improvement Infographics, these are visual representations of the steps involved in enhancing the efficiency of a process. This template is designed to help businesses identify bottlenecks and areas of improvement in their operations. These infographics consist of vertically arranged sections or columns that outline the different stages of the process improvement journey. Each section provides a brief explanation of the stage along with relevant icons, illustrations, or diagrams to enhance understanding. The layout is designed to showcase the sequential flow of activities involved in the improvement process.


5 slides
SMART Objectives Slide Presentation
Kick your planning into gear with a bold, structured layout that makes goal-setting feel energetic and achievable. This presentation helps you outline clear objectives, track progress, and communicate strategy with a clean, organized flow designed for teams and leaders. Fully compatible with PowerPoint, Keynote, and Google Slides.


7 slides
Innovation Technology Infographics
Innovation technology refers to the application of technology or the use of innovative approaches to create new products, services, processes, or business models. This infographic template is designed to showcase the cutting-edge technologies shaping our future. Let the vibrant visuals and insightful content guide you through the exciting realm of innovation and technology. Compatible with Powerpoint, Keynote, and Google Slides. Fully customizable, explore this infographic and step into the future. The visuals are designed to ignite your imagination and enlighten your audience about the limitless potential of innovation and technology.


4 slides
Consumer Psychology in Marketing
Ever wonder what’s really going on inside a shopper’s mind? This infographic presentation explores the psychology behind consumer decisions, helping you visualize key buying patterns, emotional triggers, and marketing insights with clear, modern visuals. Fully customizable and easy to edit in PowerPoint, Keynote, and Google Slides.