


Features
- 6 Unique slides
- Fully editable and easy to edit in Microsoft Powerpoint, Keynote and Google Slides
- 16:9 widescreen layout
- Clean and professional designs
- Export to JPG, PDF or send by email


Do you have any questions?
Recommend


5 slides
Law and Justice Education Infographics
Law and Justice play a critical role in ensuring that people are treated fairly and that their rights are protected. This unique vertical Infographic template is designed to visually present information about legal education and the justice system. The template includes various graphics, charts, and icons that can be customized to fit your specific data and message. Use this to cover different topics related to law and justice, such as legal education, the court system, criminal justice, and more. The infographics are designed to make your information easy to understand and visually appealing.
8 slides
3-Step Arrow Diagram Presentation
Streamline your presentations with the 3-Step Arrow Diagram Presentation. Designed for process flows, strategic planning, and step-by-step guides, this visually engaging template simplifies complex ideas into clear, structured steps. Customize colors, text, and icons effortlessly to match your brand. Fully compatible with PowerPoint, Keynote, and Google Slides for seamless editing and professional results.


6 slides
Three-Point Framework Triangle Diagram Presentation
Break down complex strategies with the Three-Point Framework Triangle Diagram template. This visually structured design helps you present key business components in a clear, logical format, making it ideal for decision-making, planning, and analysis. Fully customizable and easy to use, it's compatible with PowerPoint, Keynote, and Google Slides for seamless integration.


7 slides
Customer Profile Infographics Presentation Template
A customer profile is a detailed description of your current customers. By researching their demographics, psychographic data, and behaviors you can build on this knowledge to target similar customers in your sales and marketing campaigns. Use this template to create a customer profile, this will help you better understand your ideal customer. This template will tell you everything about the people you want to bring onto your customer list. This template is designed to walk you through writing your ideal customer profile, so that you can start attracting the right customers for your business.


9 slides
Font Alphabet Infographic
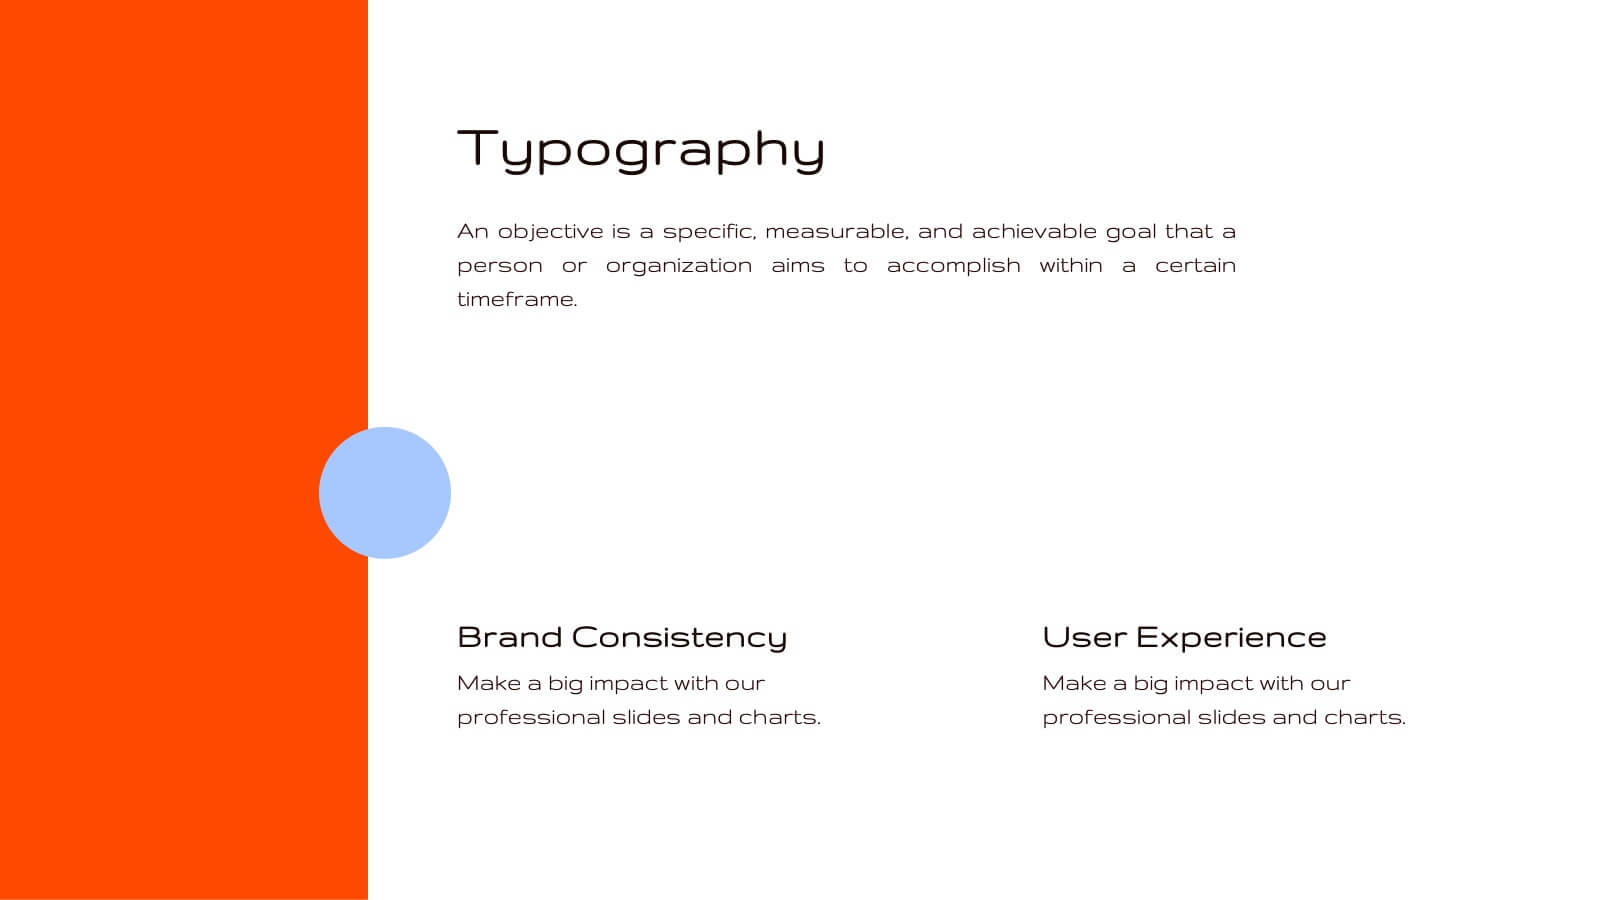
Typography plays a pivotal role in conveying mood, tone, and personality. Our font alphabet infographic is a dazzling blend of red, green, yellow, and blue, providing a vibrant showcase of diverse font styles. Each alphabet letter is uniquely stylized, making it an ideal resource for graphic designers, educators, and marketing professionals looking to make a statement. Whether you're teaching the basics of typography or showcasing a brand's versatility, this infographic serves as a visual treat. Seamless integration with PowerPoint, Keynote, and Google Slides ensures you can weave this colorful font journey into any presentation.


22 slides
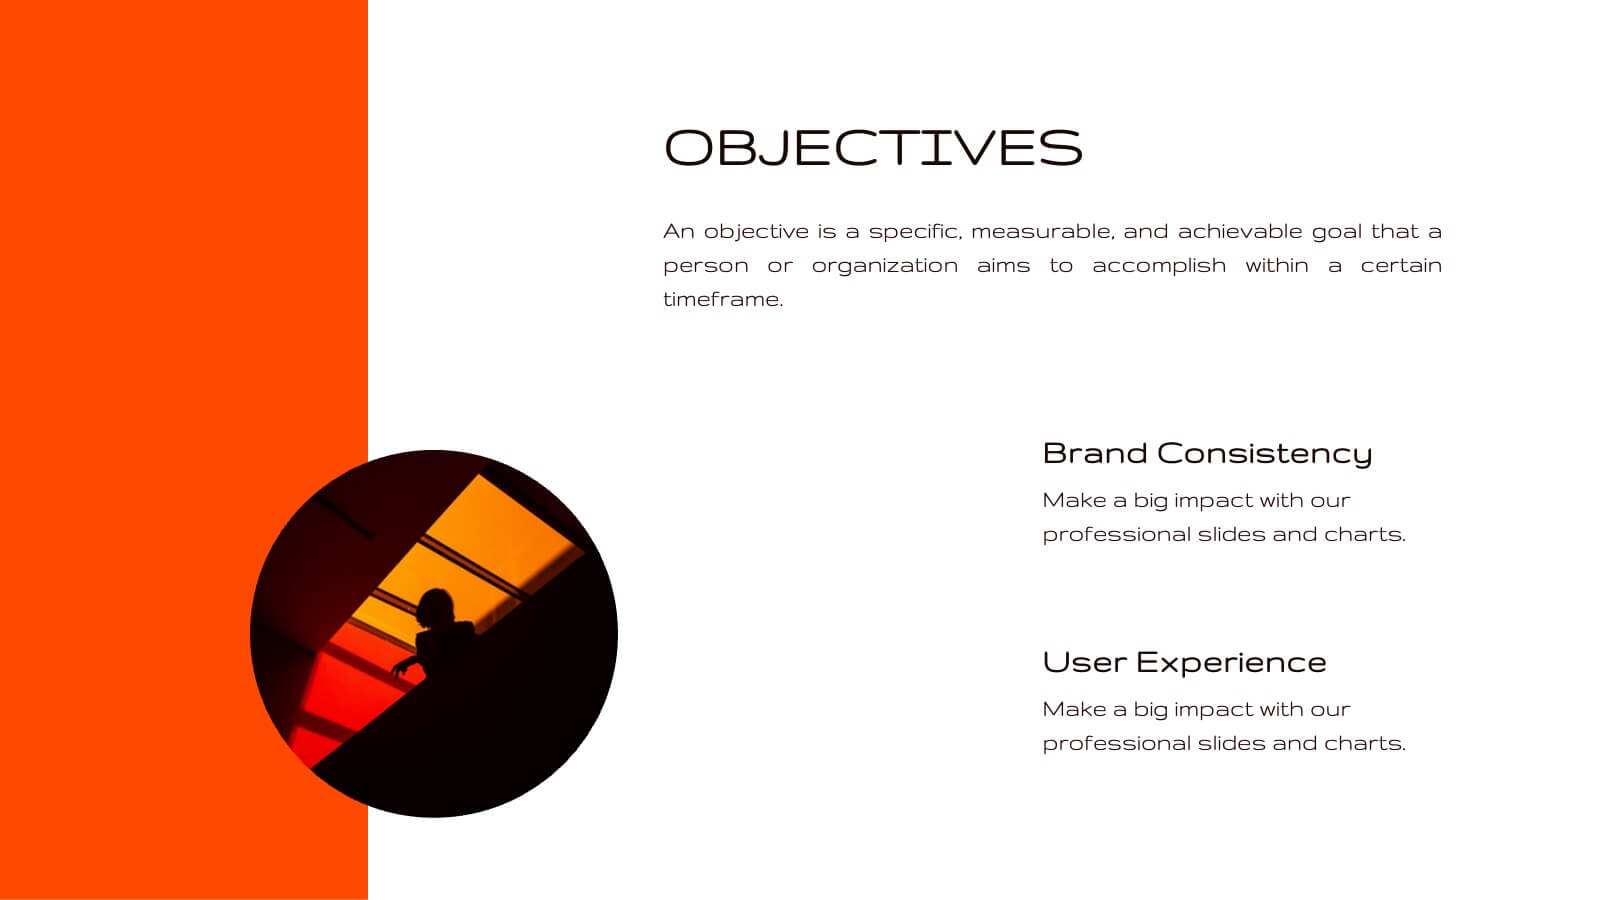
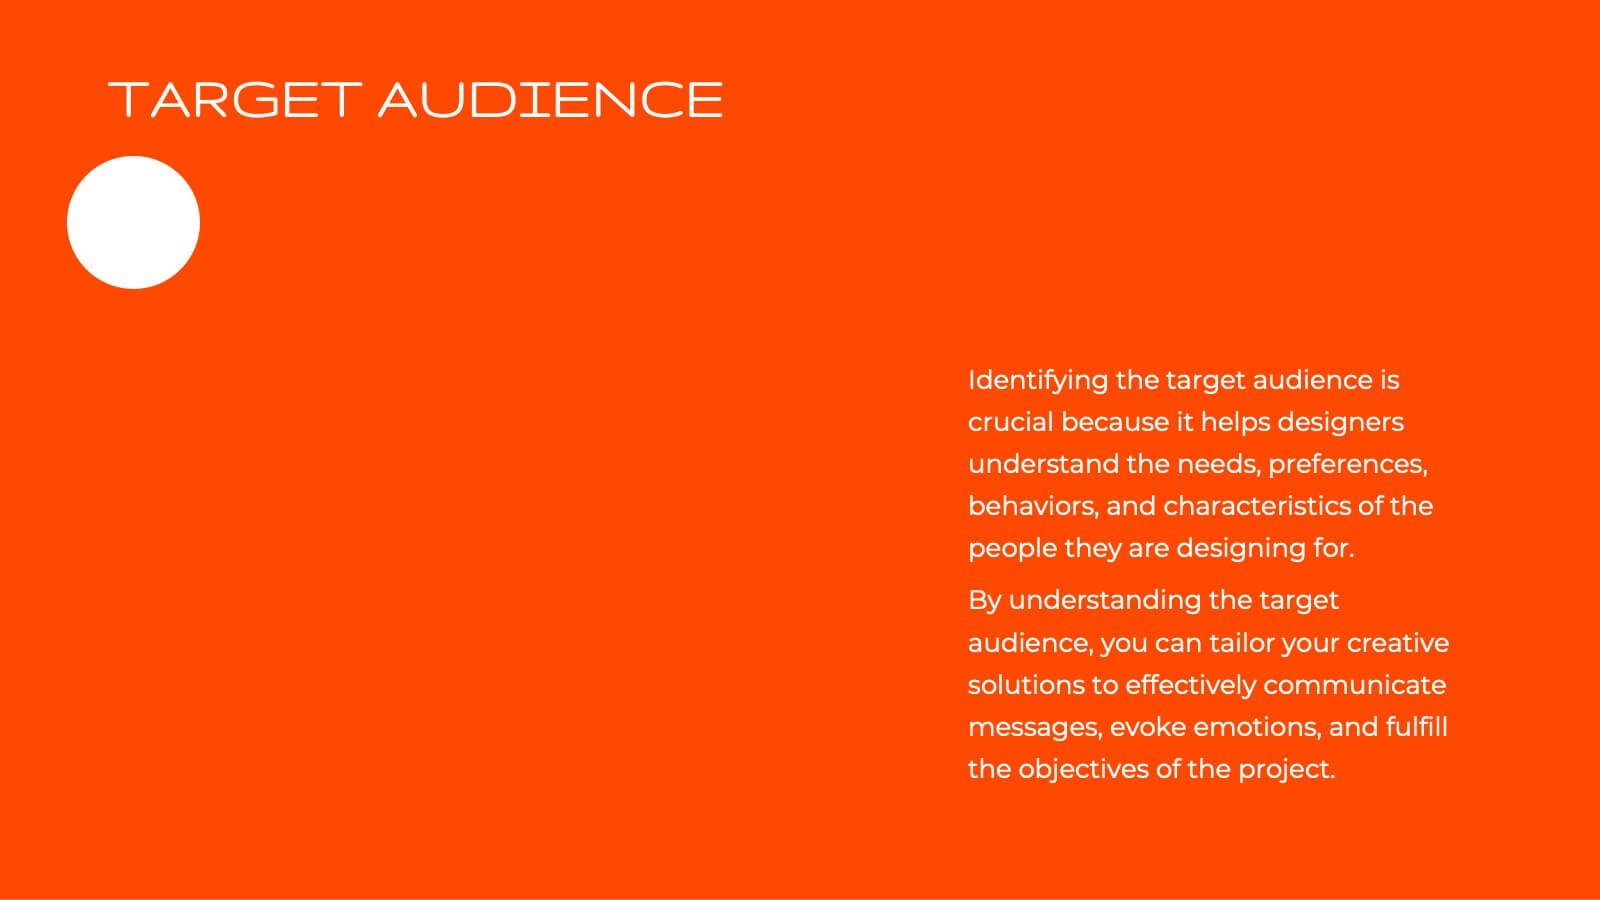
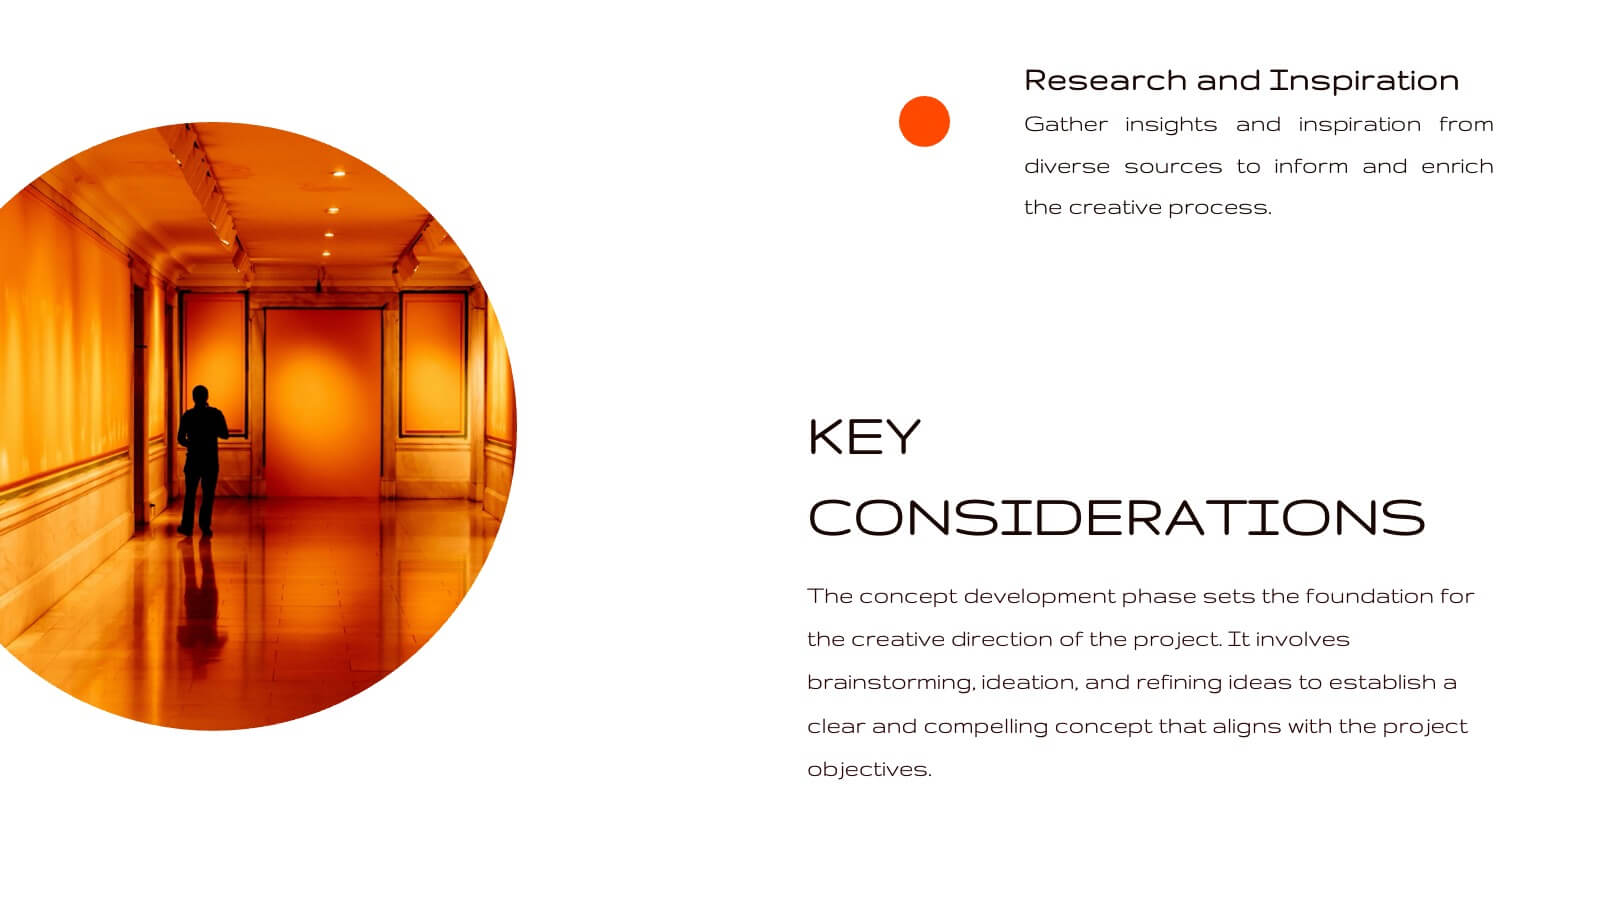
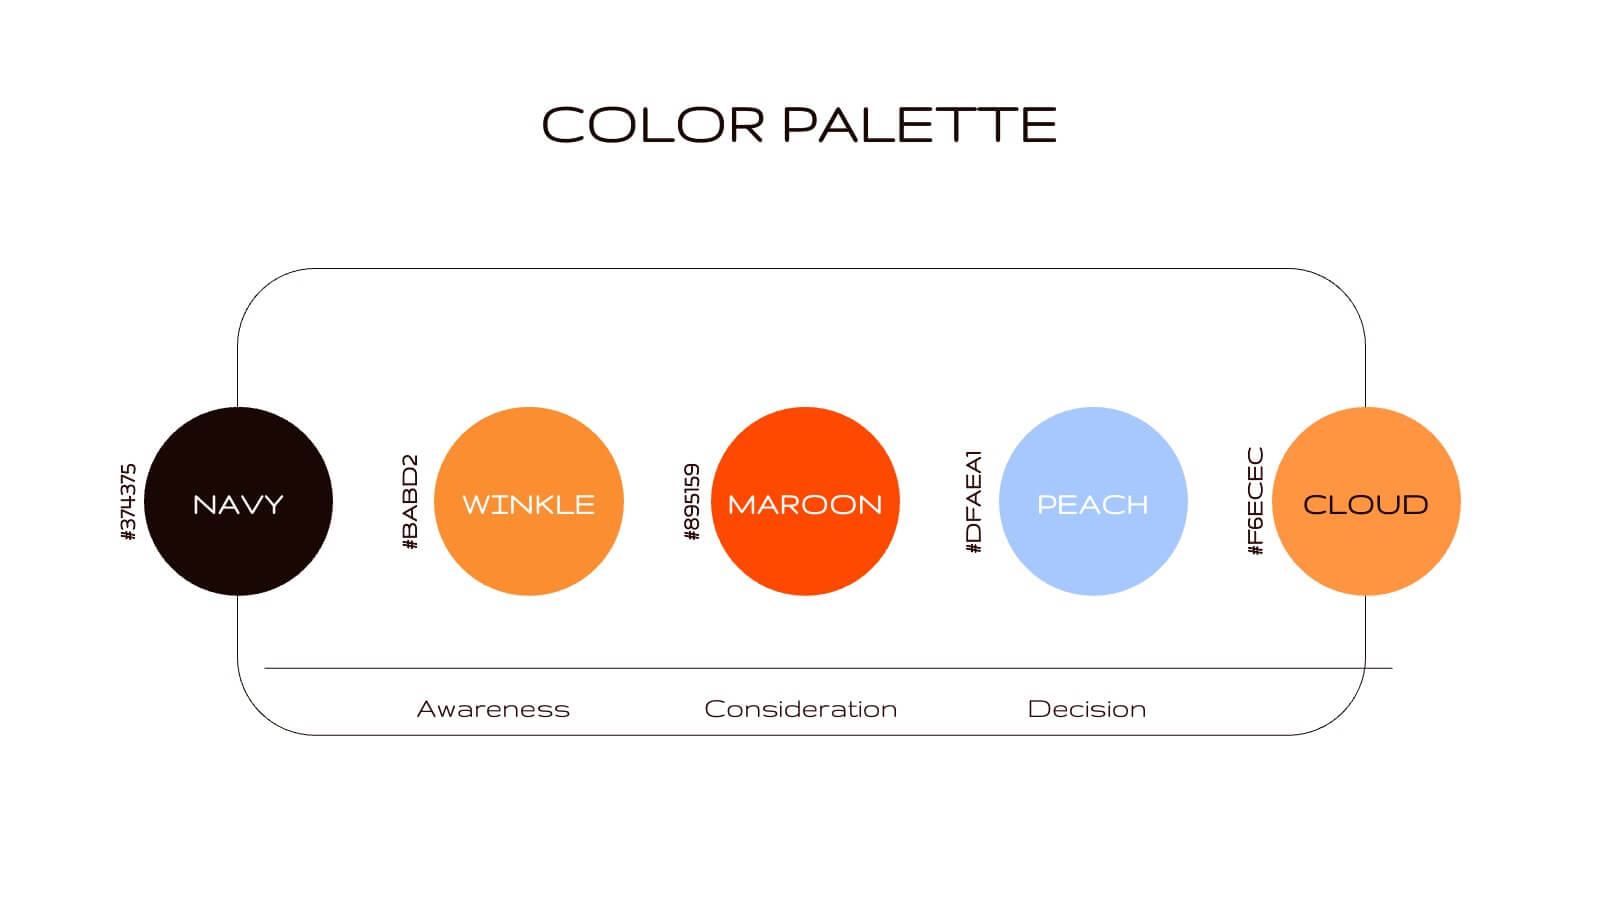
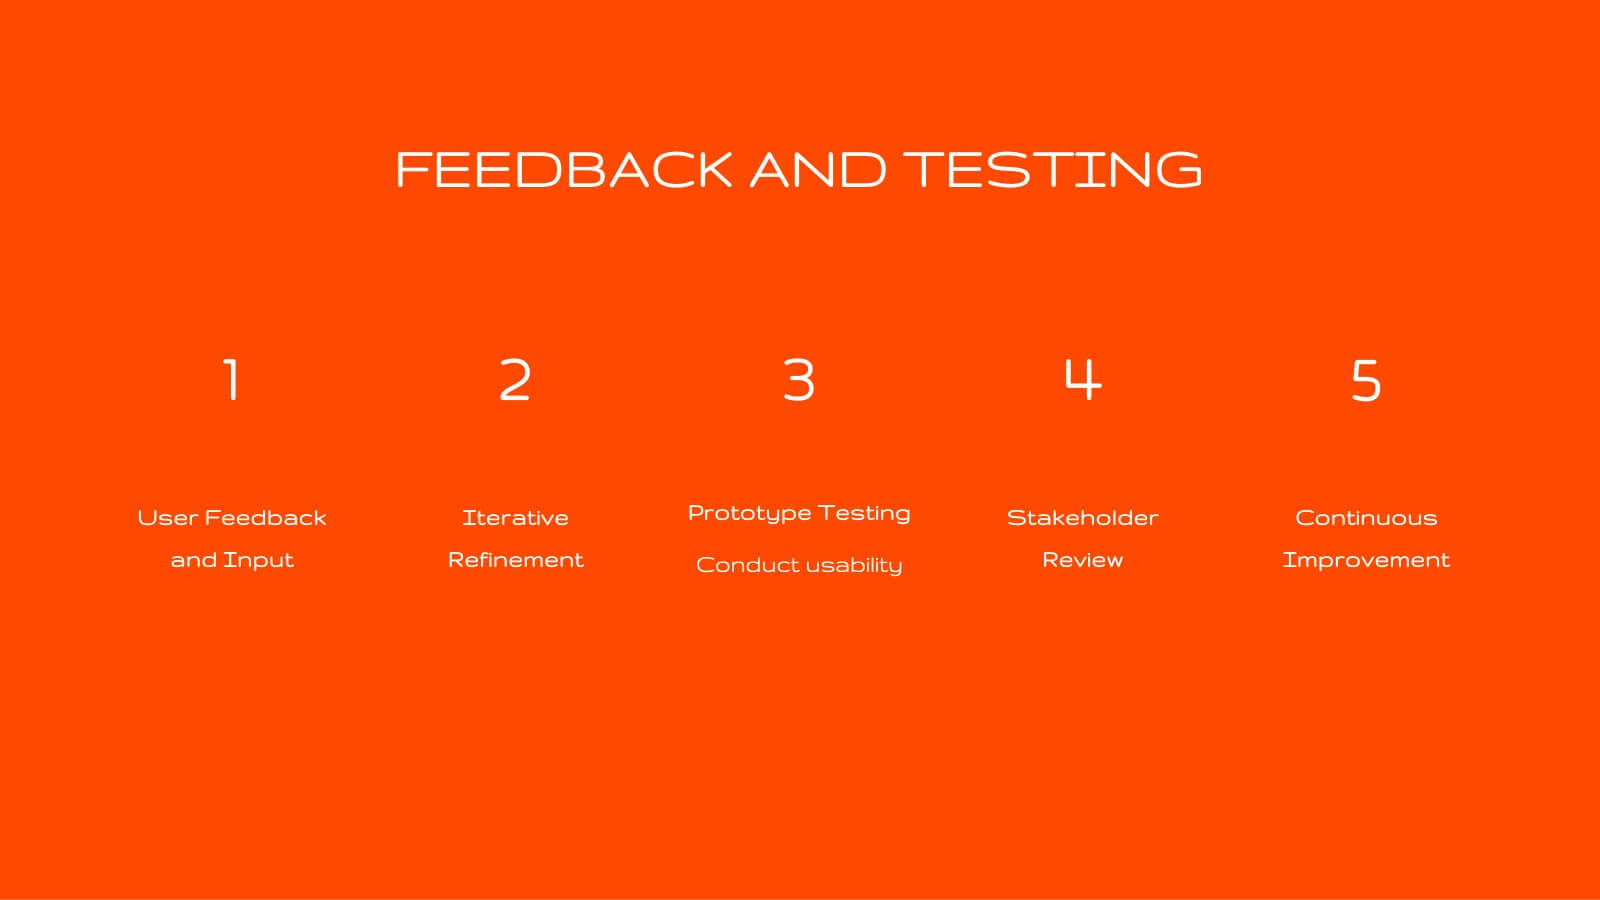
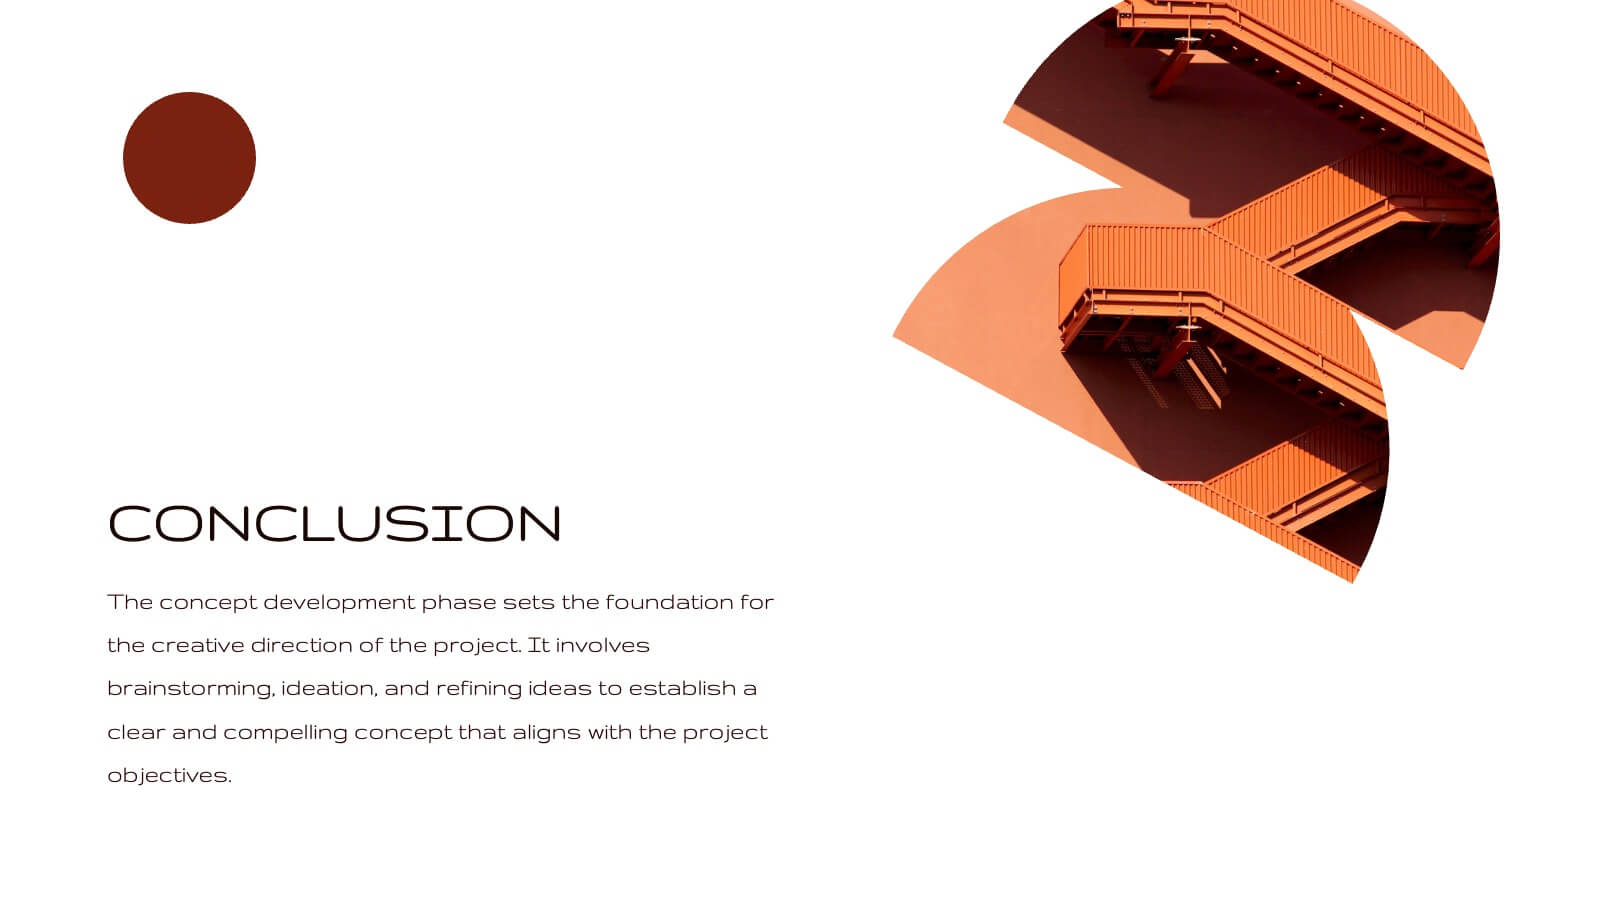
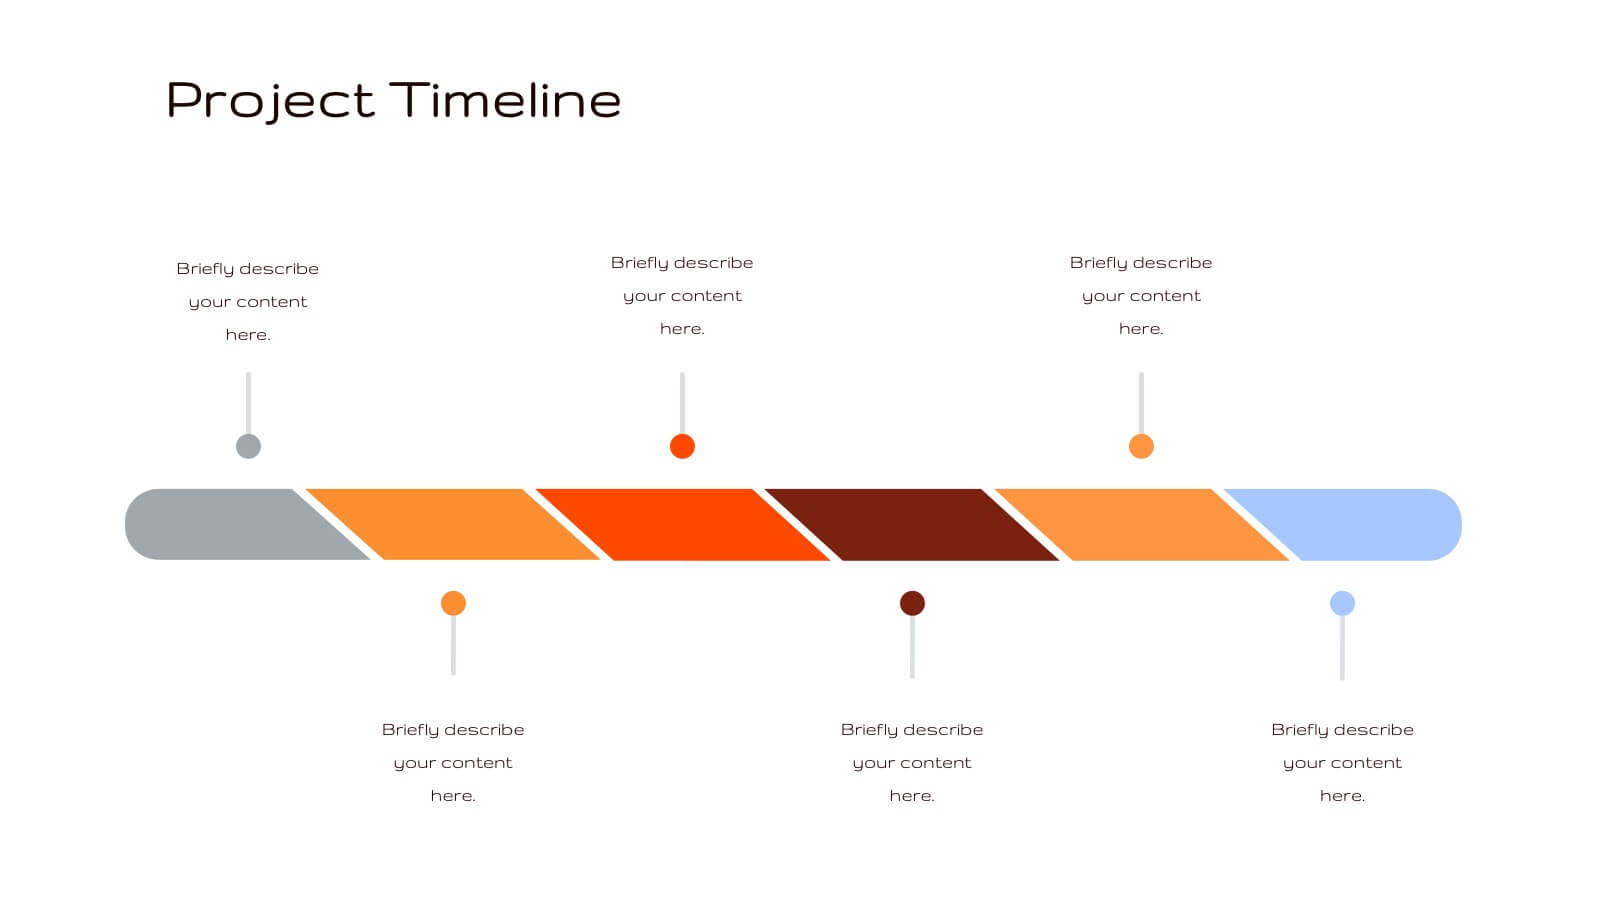
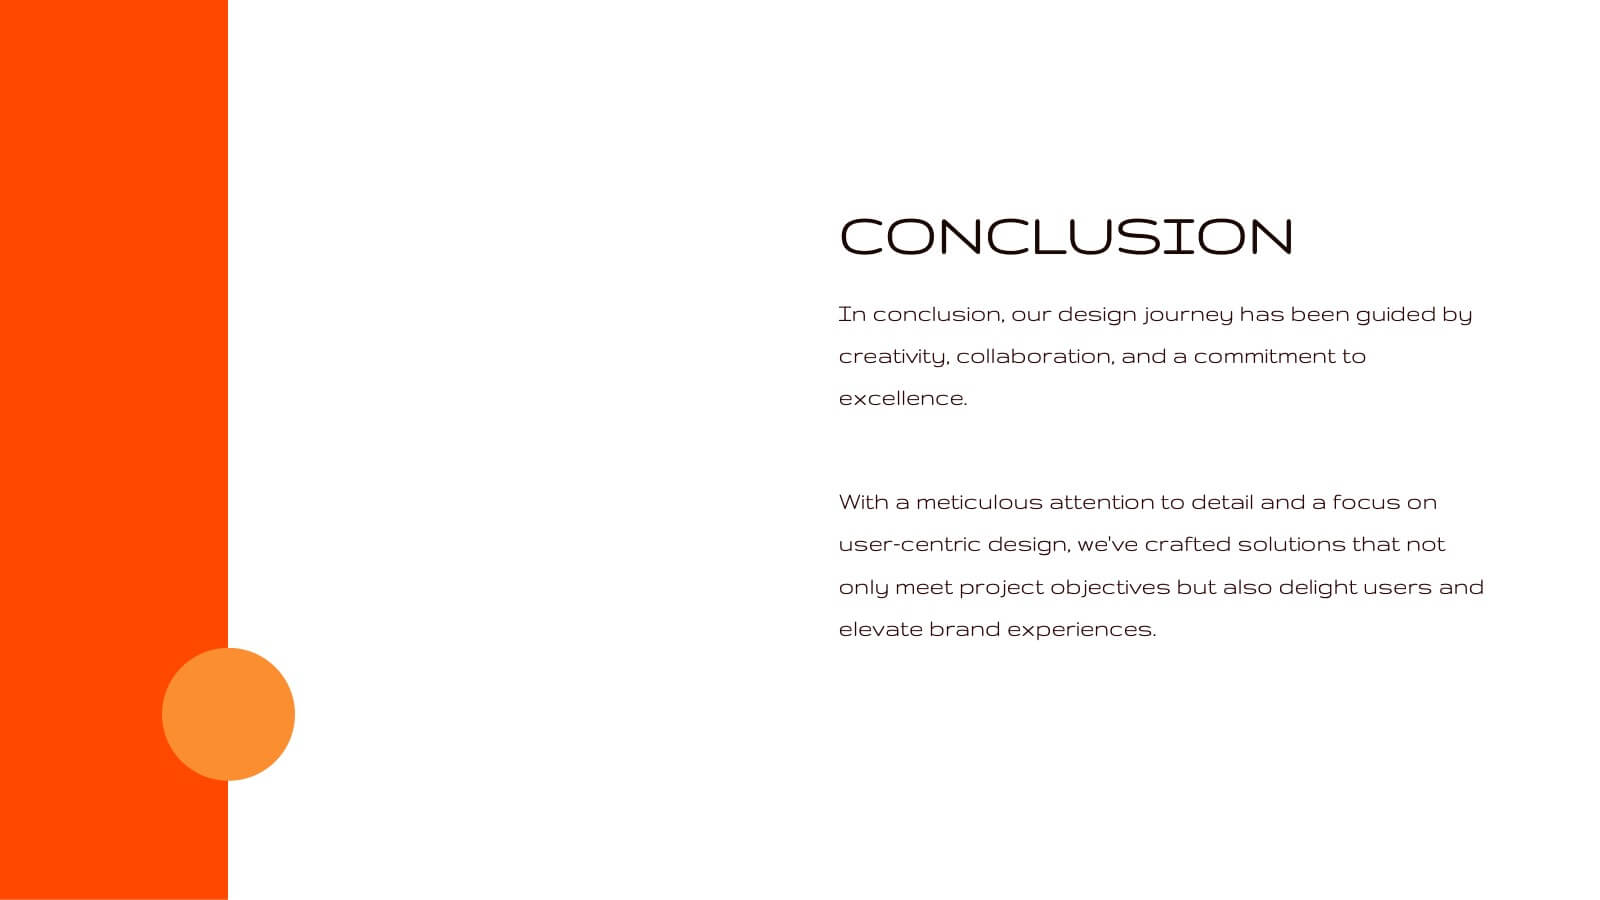
Radiance Creative Design Report Presentation
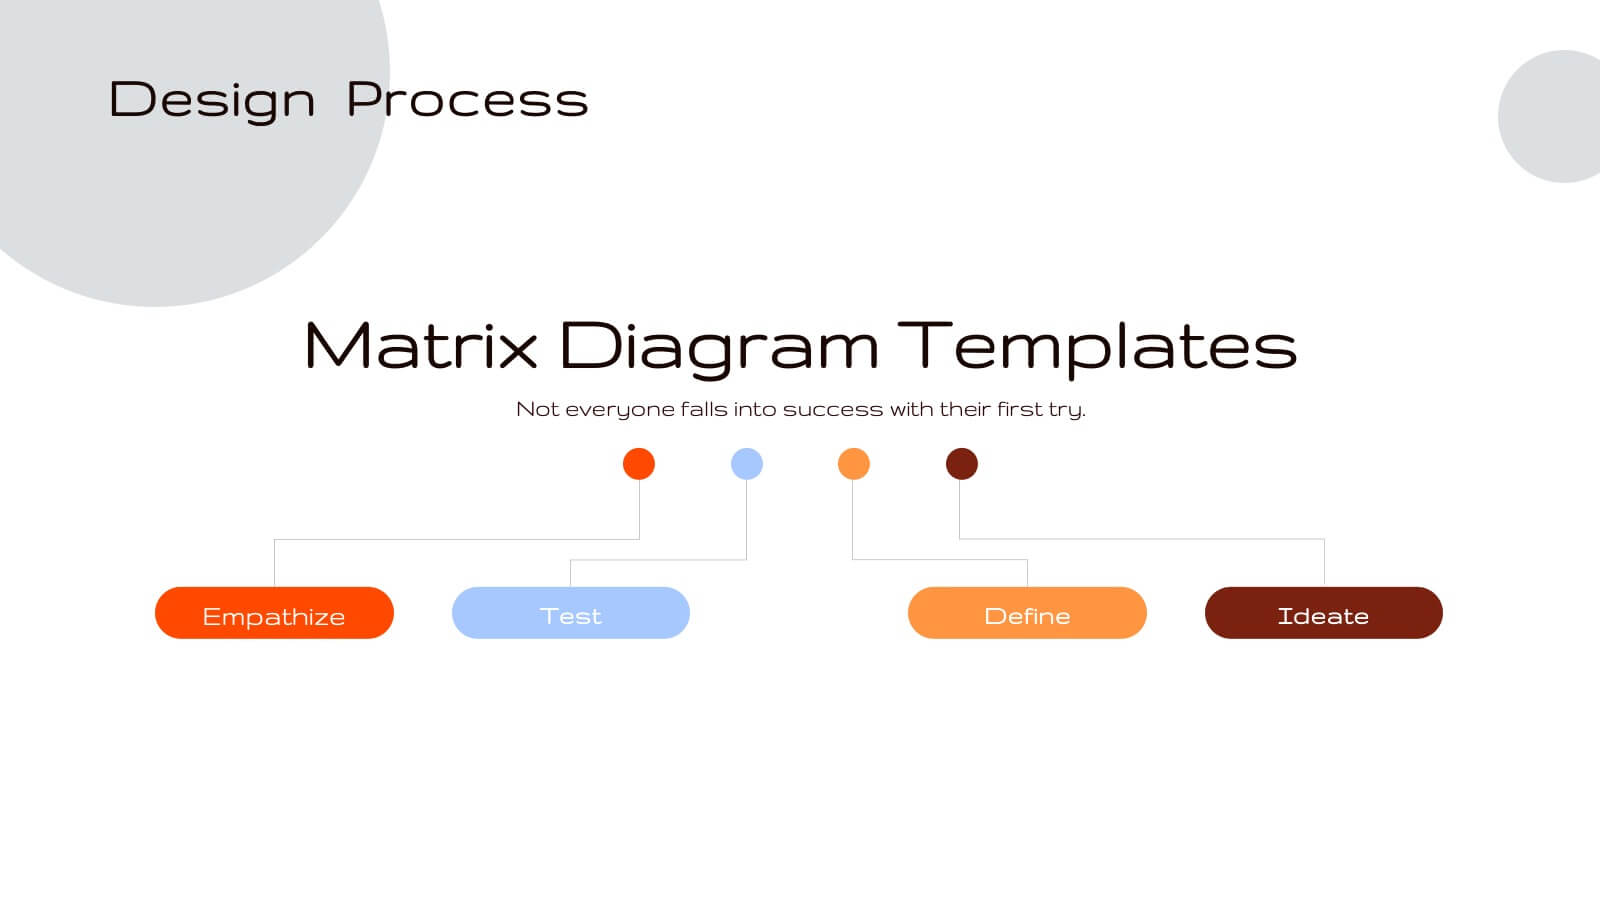
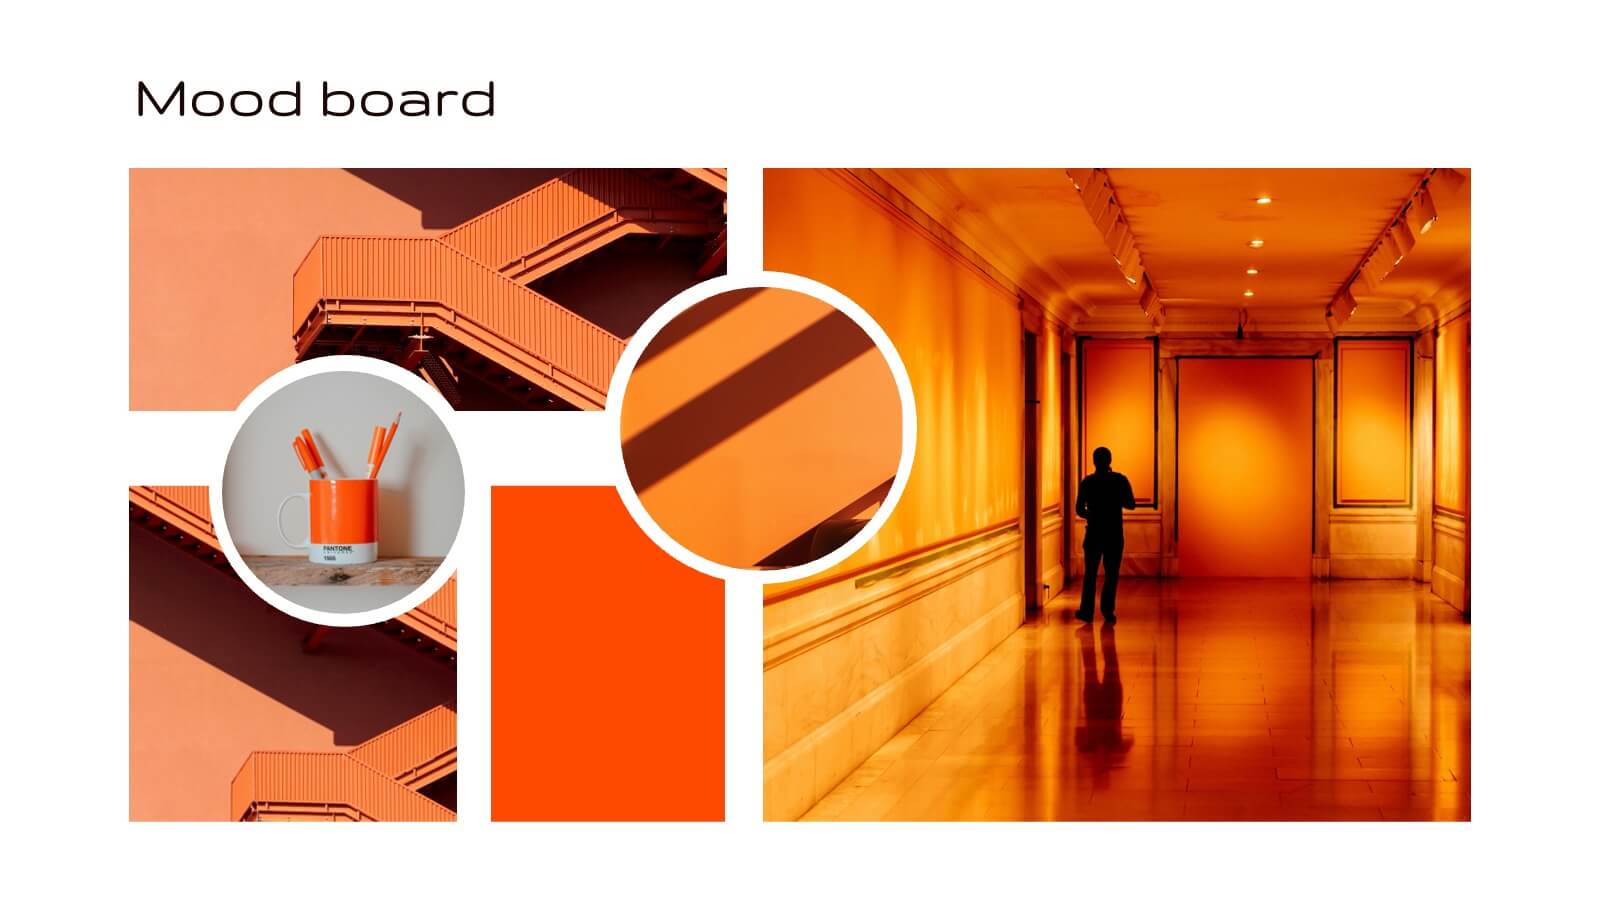
Bring your design ideas to life with this vibrant, engaging presentation template. Ideal for showcasing creative processes, concept development, and project timelines, it features a striking color palette and clean layout. This template is designed to captivate your audience and clearly communicate your design vision. Compatible with PowerPoint, Keynote, and Google Slides, it’s perfect for any platform.


7 slides
Europe Map Infographic Presentation Template
Europe is a continent located in the northern part of the globe and surrounded by water on three sides. It is bordered by the Atlantic Ocean to the west, the Arctic Ocean to the north, and the Mediterranean Sea to the south. Europe is divided into roughly forty four countries and dependent territories, each one with its own unique identity, cuisine and culture. This European map template is a vector map of an outline of Europe, with color-coded and labeled countries and a legend. This map template can be used for presentations, reports and blogs about tourism it's a simple and clean style map.


5 slides
Annual Achievements and Highlights Presentation
Celebrate your progress with the Annual Achievements and Highlights Presentation. This timeline-style layout guides viewers along a visual path of milestones year by year. Each pin represents a key accomplishment, backed by icons and editable text for context. Perfect for end-of-year reviews or company retrospectives. Compatible with PowerPoint, Google Slides, and Canva.


3 slides
Medical Report Summary and Review Deck Presentation
Present health data clearly with this Medical Report Summary and Review Deck. Designed for healthcare professionals, this layout features checklist icons, charts, and clinical visuals to highlight reports or patient insights. Fully editable in PowerPoint, Keynote, and Google Slides, it ensures your medical updates remain professional, concise, and easy to follow.


7 slides
Veterinary Medical Center Infographic
Dive into the world of animal healthcare with our comprehensive veterinary medical center infographic. Infused with refreshing shades of green, blue, and white, this template provides a clear snapshot of veterinary services, pet care essentials, and more. Designed especially for veterinarians, pet care professionals, and educators, its captivating graphics and icons make complex medical topics more digestible and engaging. With adorable pet-themed elements, it ensures audiences instantly connect with the content. Perfect for presentations, workshops, and seminars, it's optimized for PowerPoint, Keynote, and Google Slides, making information dissemination both appealing and efficient.


7 slides
Inversion Table Infographic
A table infographic is a visual representation of data or information presented in a tabular format, using a combination of text, numbers, and visual elements to make the information more engaging and easily understandable. This infographic template is great for comparing two or more variables and is a powerful way to convey your data. This infographic is designed to show your audience the key points of your data in a visually appealing way. This template is a good option if you want to present your information as an easy-to-read table with labels and numbers. The bright colors and fun design make it easy to see at a glance.


5 slides
Data Distribution with Pie Chart Visuals Presentation
Visualize complex metrics with ease using the Data Distribution with Pie Chart Visuals Presentation. This slide design integrates a clean side-by-side layout of a colorful pie chart and a five-point legend, making it ideal for showcasing proportions, segments, or performance breakdowns. Each item features an icon and customizable text to clearly label your data points. Perfect for business analysts, marketers, and financial teams, the slide is editable in PowerPoint, Keynote, and Google Slides. It’s a great choice for delivering data-driven insights in a simple, visual format.


4 slides
Visual Relationships in Venn Format Presentation
Highlight similarities and differences between two or more ideas using this clean, two-circle Venn diagram layout. Ideal for comparing concepts, teams, or strategies. Customize icons, text, and color themes effortlessly. Compatible with PowerPoint, Keynote, and Google Slides—perfect for business meetings, educational content, and marketing comparisons.


5 slides
Music History Infographics
Music History is important for its cultural, educational, and historical significance. It deepens our understanding and appreciation of music, connects us with the past, and inspires us to create and explore new musical possibilities. These unique vertical Infographics are visual representations of the history of music, including key events, influential artists, and genres. They feature a guitar timeline, icons, text boxes, and illustrations to convey your information in an engaging way. You can cover a broad range of topics with this template, from the development of 70's music to the rise of rock and roll!


21 slides
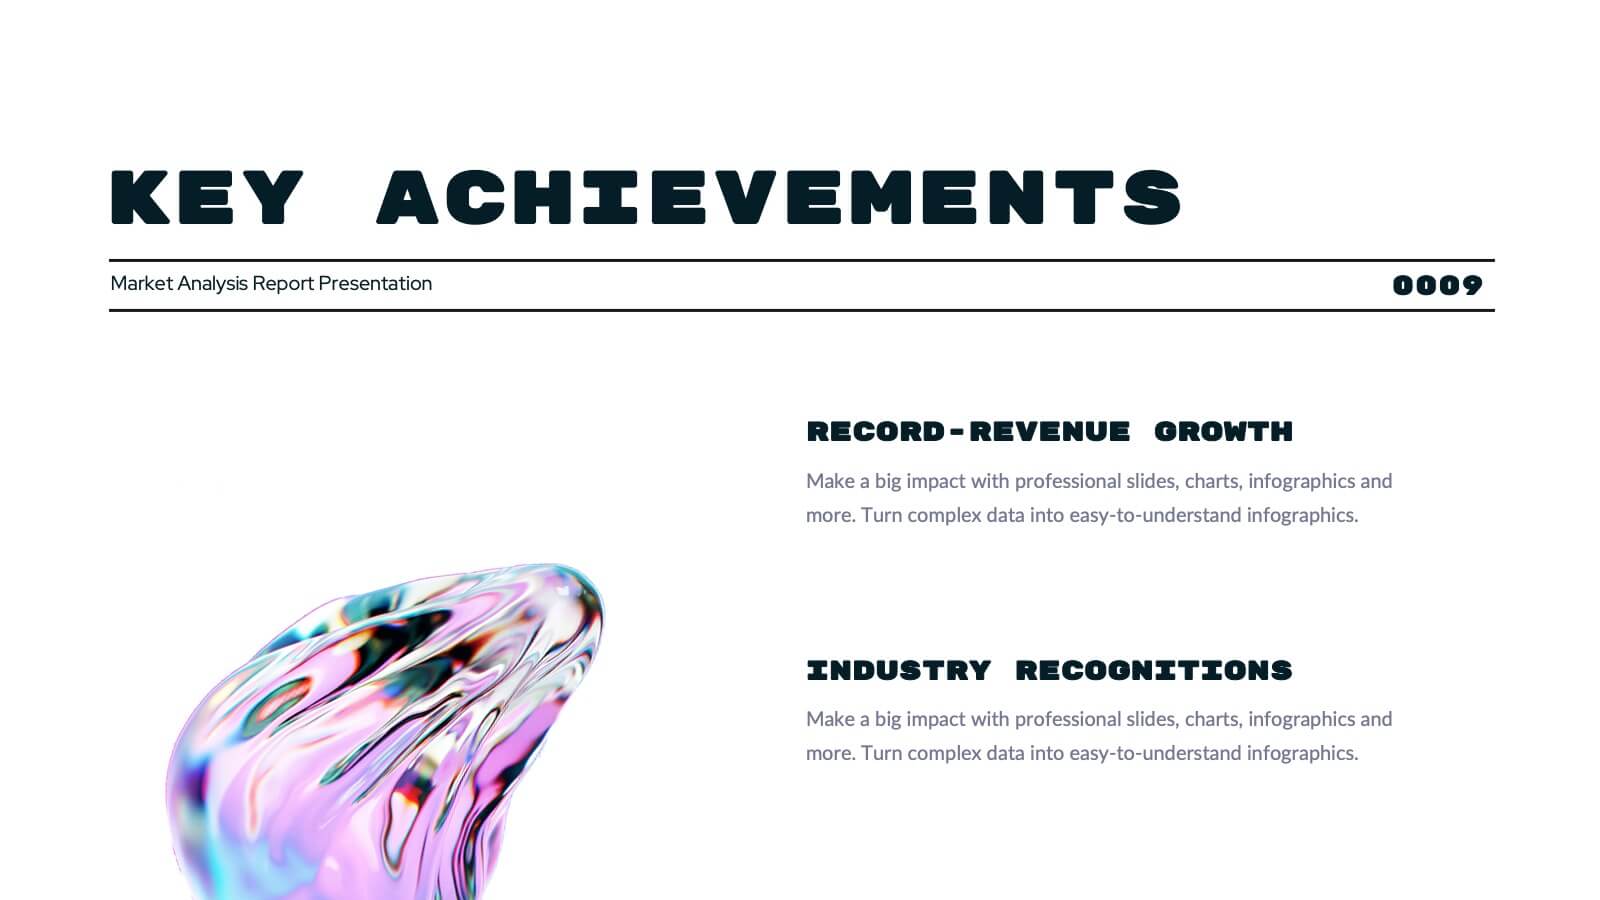
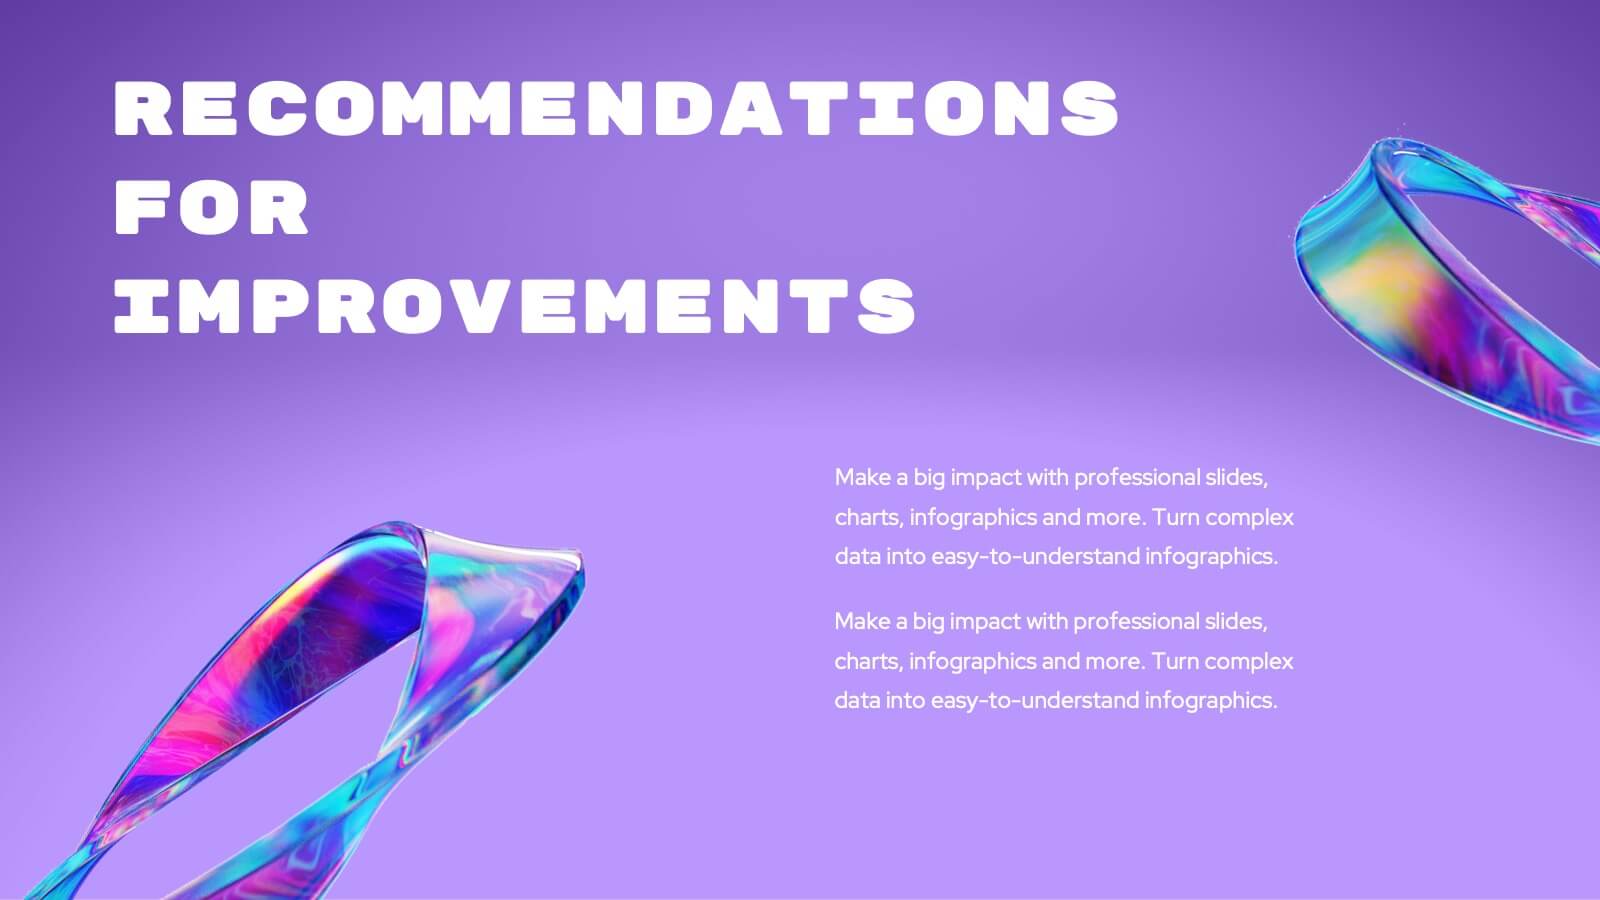
Turquoise Market Analysis Report Presentation
This sleek report presentation template covers essential sections like key performance metrics, market analysis, and strategic initiatives. It’s designed for a professional yet modern look, perfect for showcasing updates and insights. Compatible with PowerPoint, Keynote, and Google Slides, it’s ideal for delivering engaging and impactful business reports.


7 slides
McKinsey 7S Model Infographic Presentation Template
The McKinsey 7S model is a management framework developed by the consulting firm McKinsey & Company. The model consists of seven interdependent factors that are important for an organization's success: strategy, structure, systems, shared values, skills, staff, and style. The template can be used to visualize the 7S model hierarchy and the importance of each component to your business. This inventive presentation is designed to take an economic approach, If you’re interested in taking this strategic step to evaluating your processes and measuring performance, this presentation is for you.


8 slides
Asia Geographics and Business Analysis Map Presentation
Visualize regional insights with this Asia map template. Highlight business data, performance indicators, or strategic regions using callouts and color-coded zones. Perfect for market analysis, logistics, or geographic reporting. Fully customizable in PowerPoint, Keynote, or Google Slides to match your branding and presentation goals with clear, location-based storytelling.