


Features
- 5 Unique slides
- Fully editable and easy to edit in Microsoft Powerpoint, Keynote and Google Slides
- 16:9 widescreen layout
- Clean and professional designs
- Export to JPG, PDF or send by email


Do you have any questions?
Recommend


3 slides
Business Project Proposal Pitch Presentation
Win Your Next Big Deal! The Business Project Proposal Pitch Presentation is designed to impress, featuring sleek data visuals, key insights, and a structured layout for persuasive storytelling. Ideal for startups, corporate pitches, and investment proposals, this template is fully customizable and works with PowerPoint, Keynote, and Google Slides for seamless editing.


4 slides
Customers Journey Map Presentation
Take your audience on a smooth, visual adventure that clearly outlines each stage of the customer experience. This presentation helps you map behaviors, highlight key interactions, and explain decision points with clarity and style. Designed for easy customization and fully compatible with PowerPoint, Keynote, and Google Slides.


23 slides
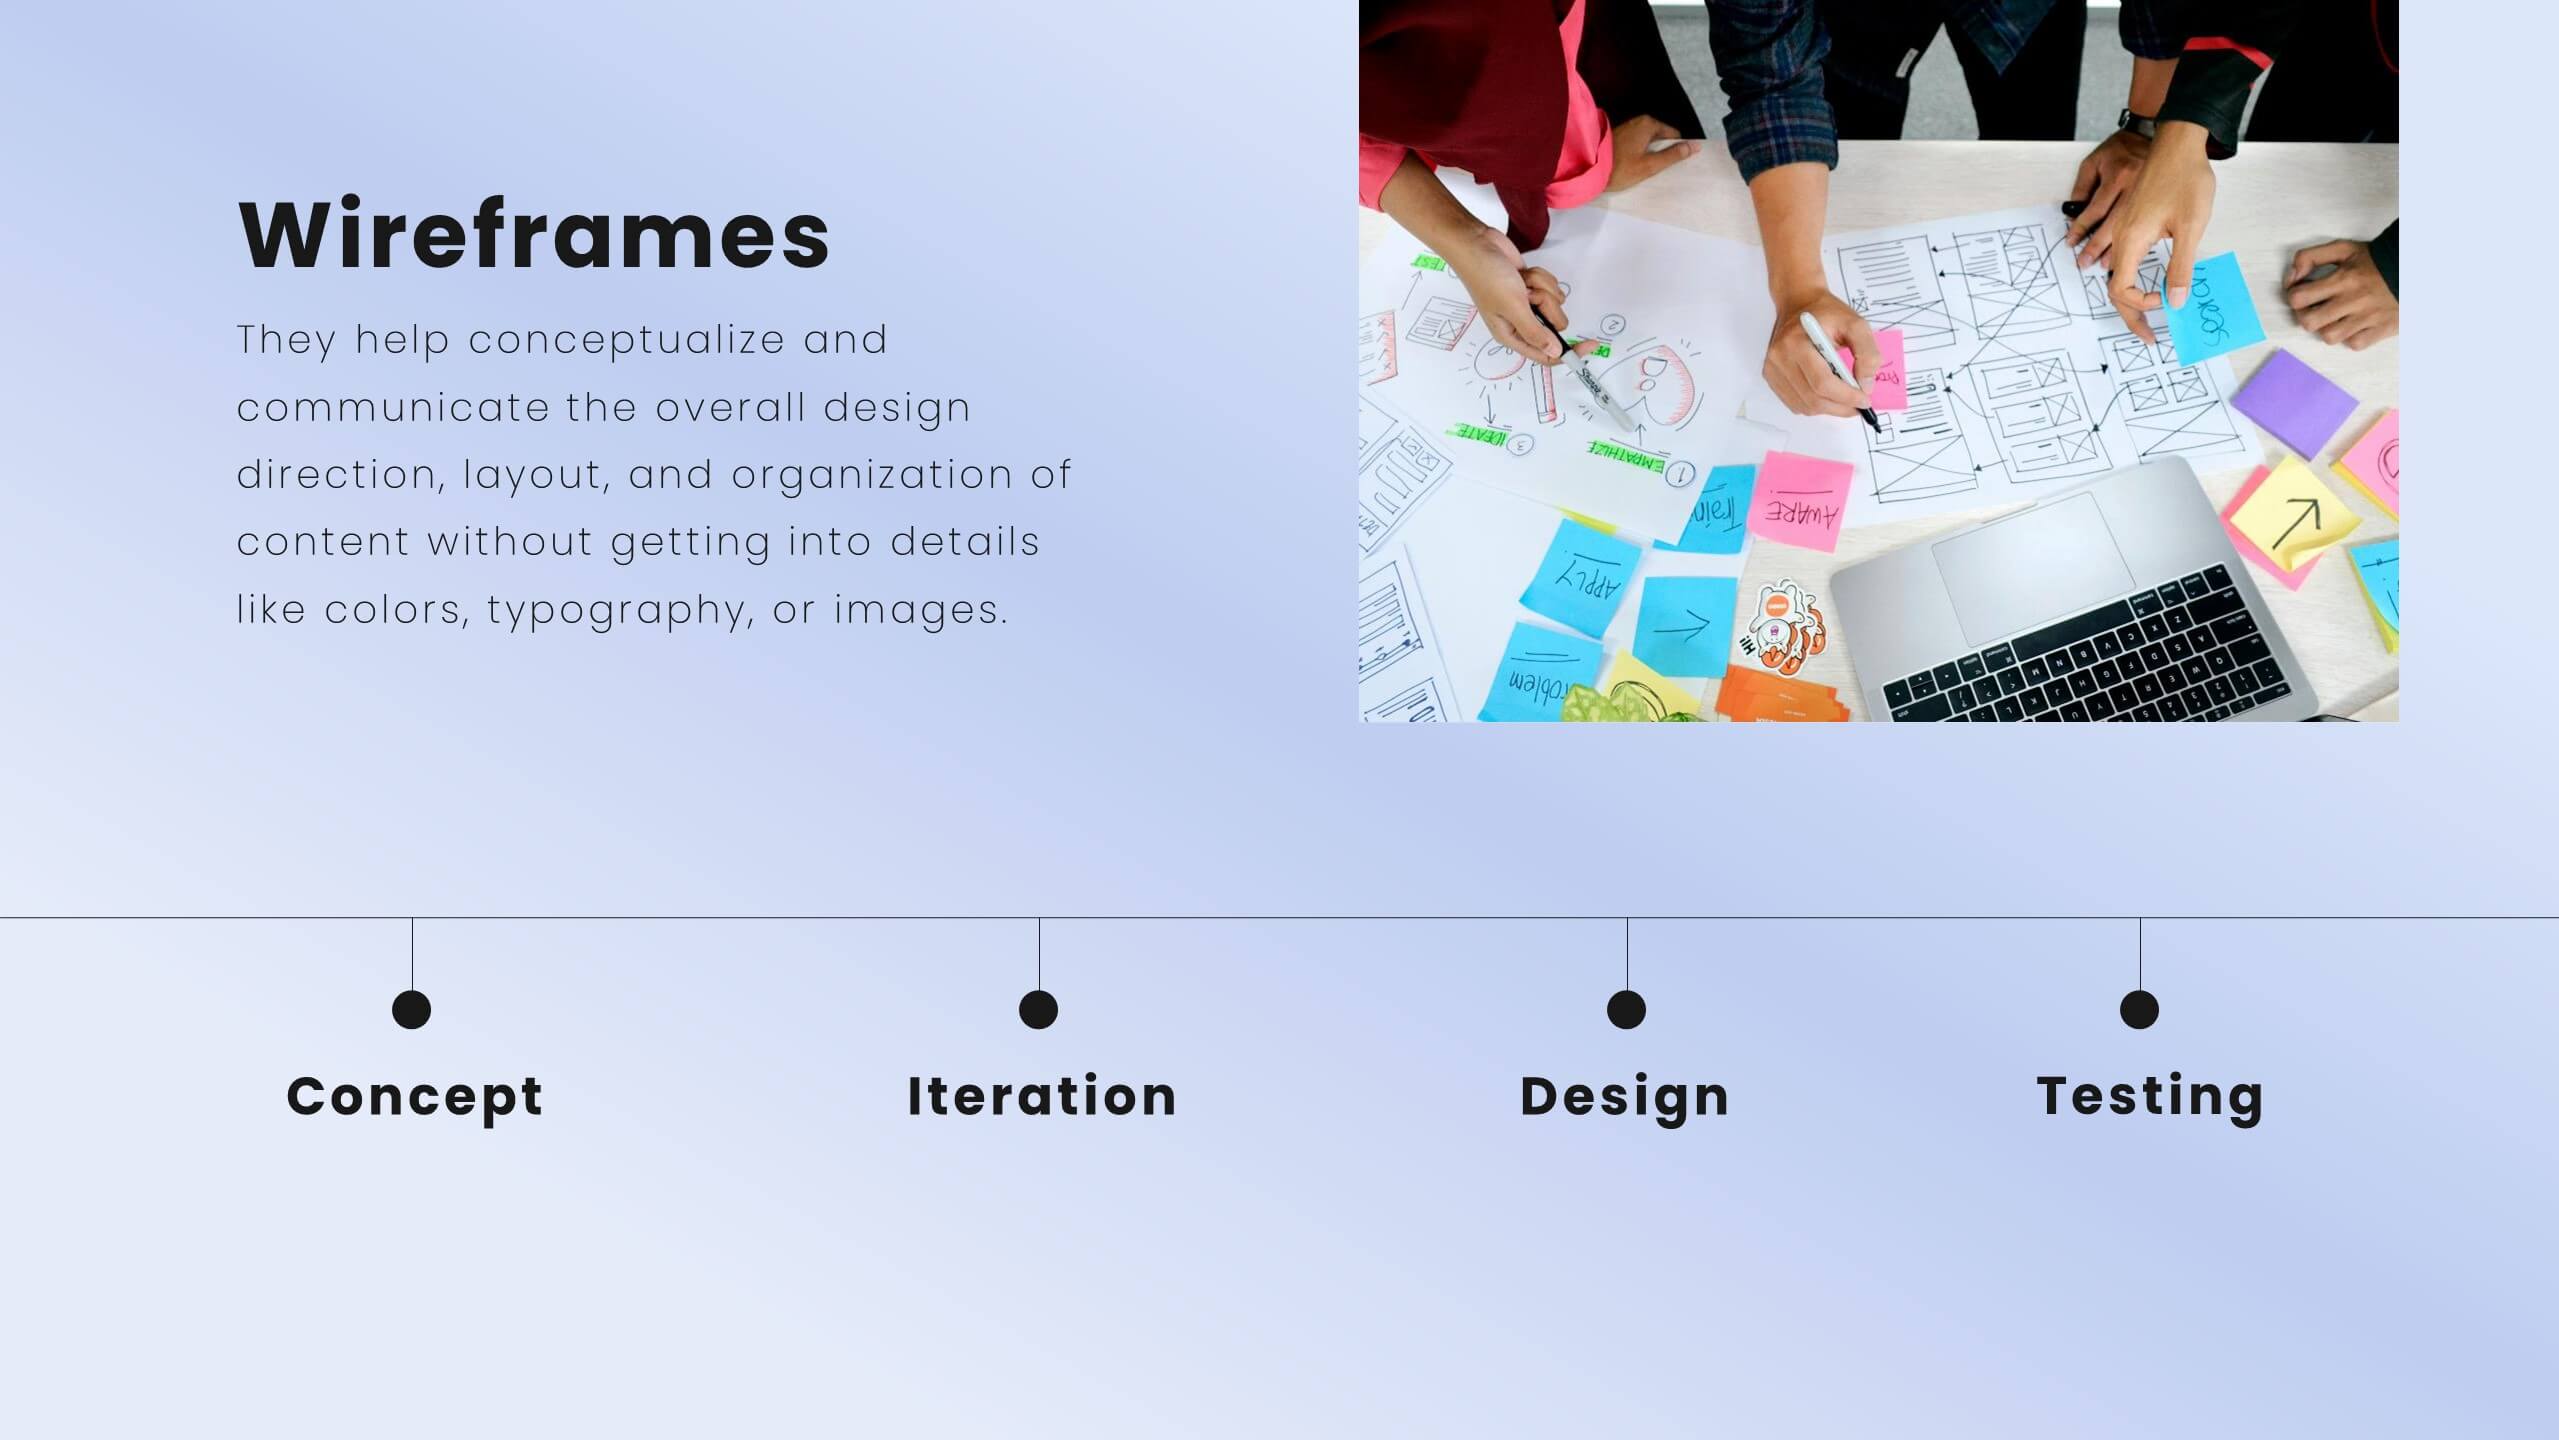
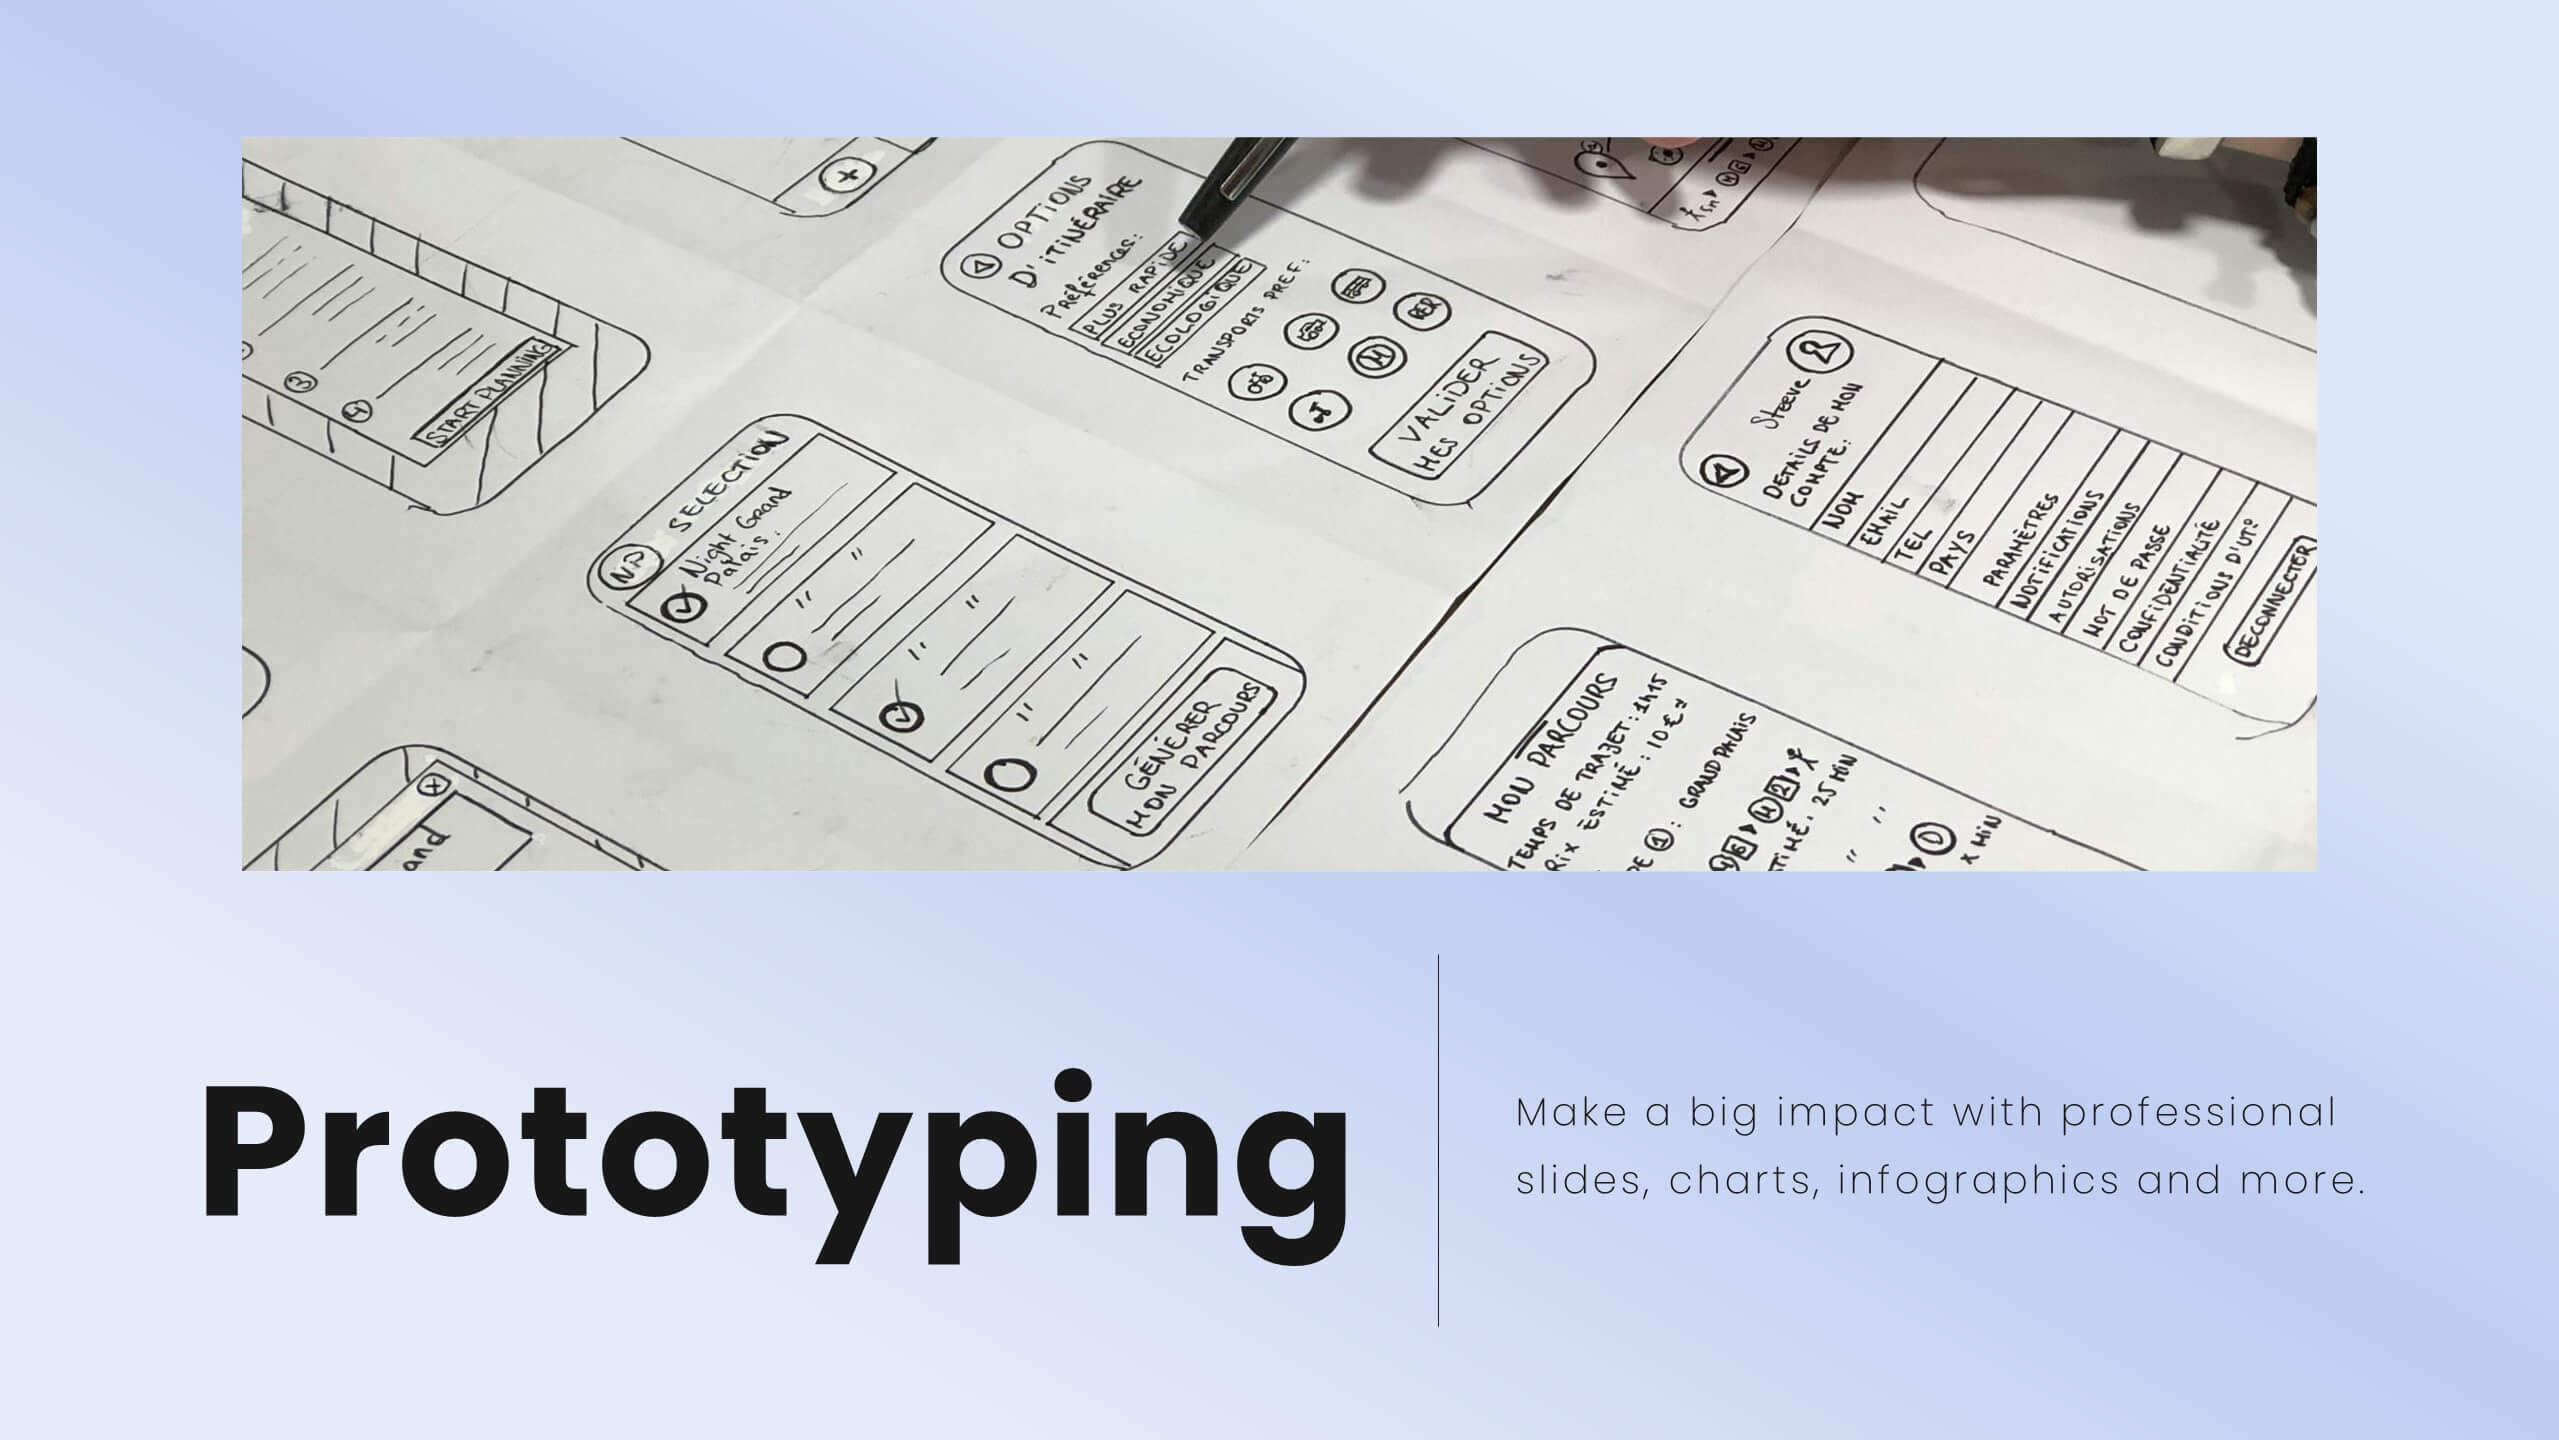
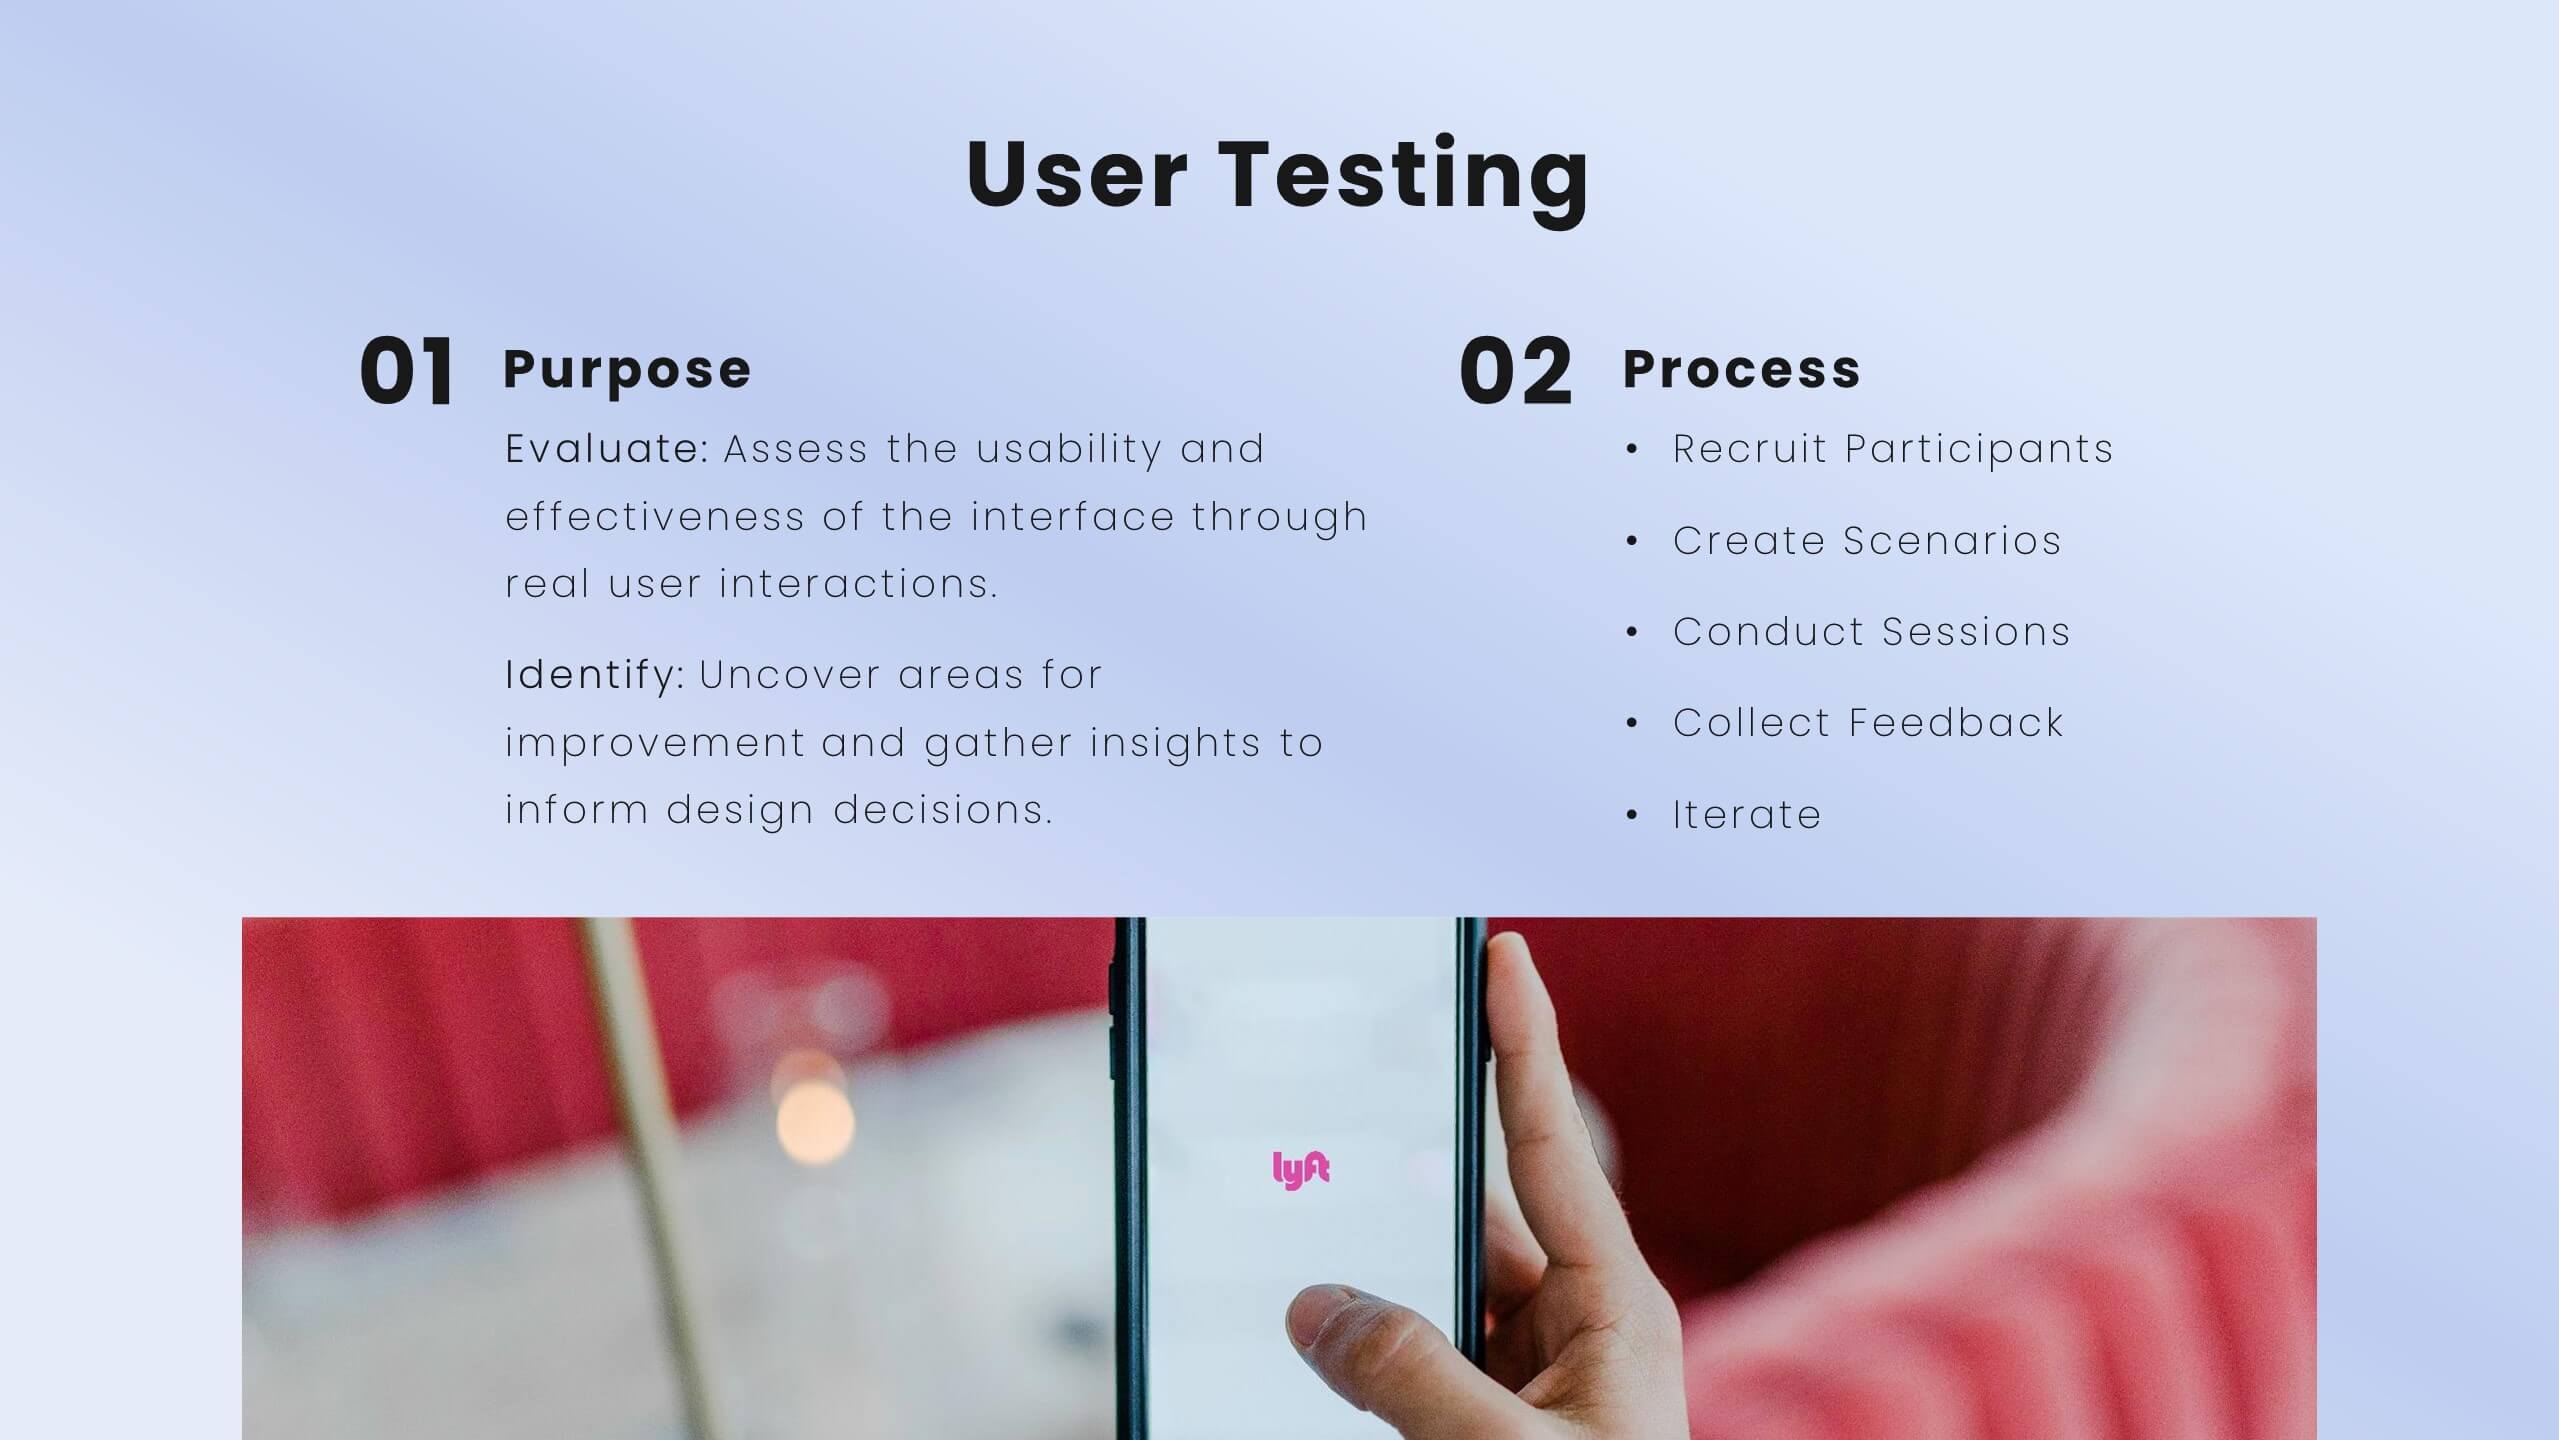
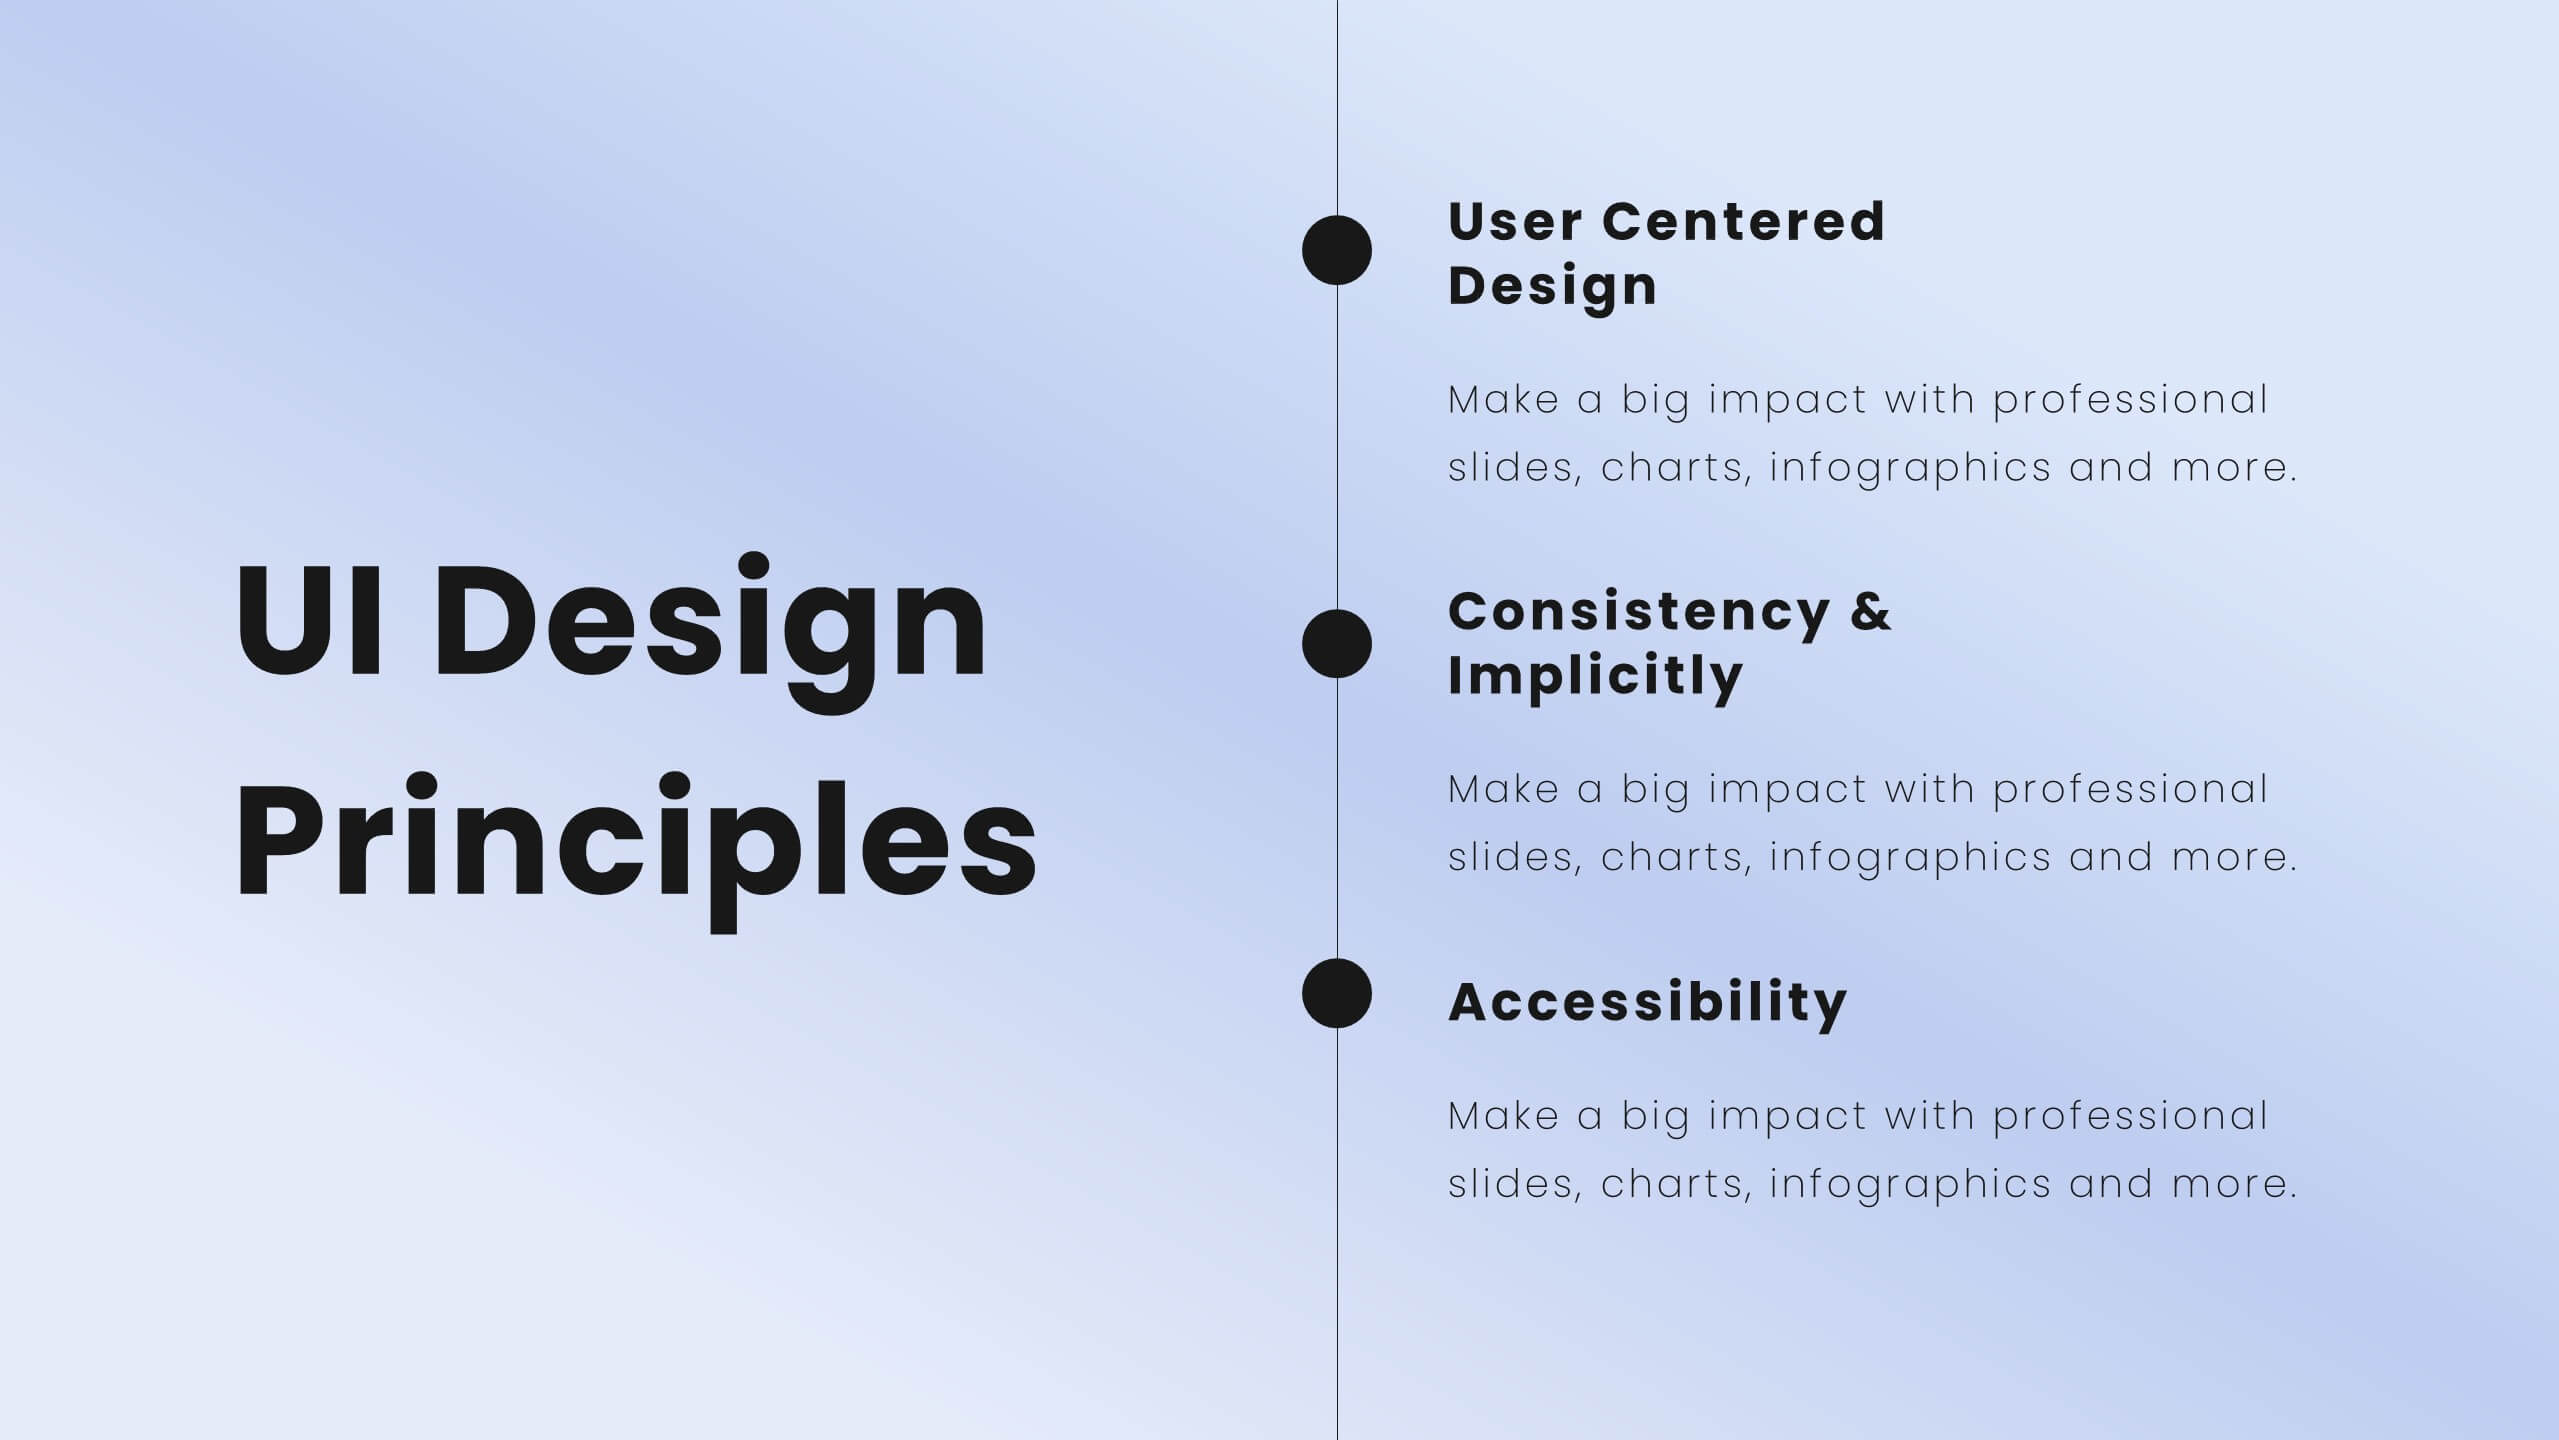
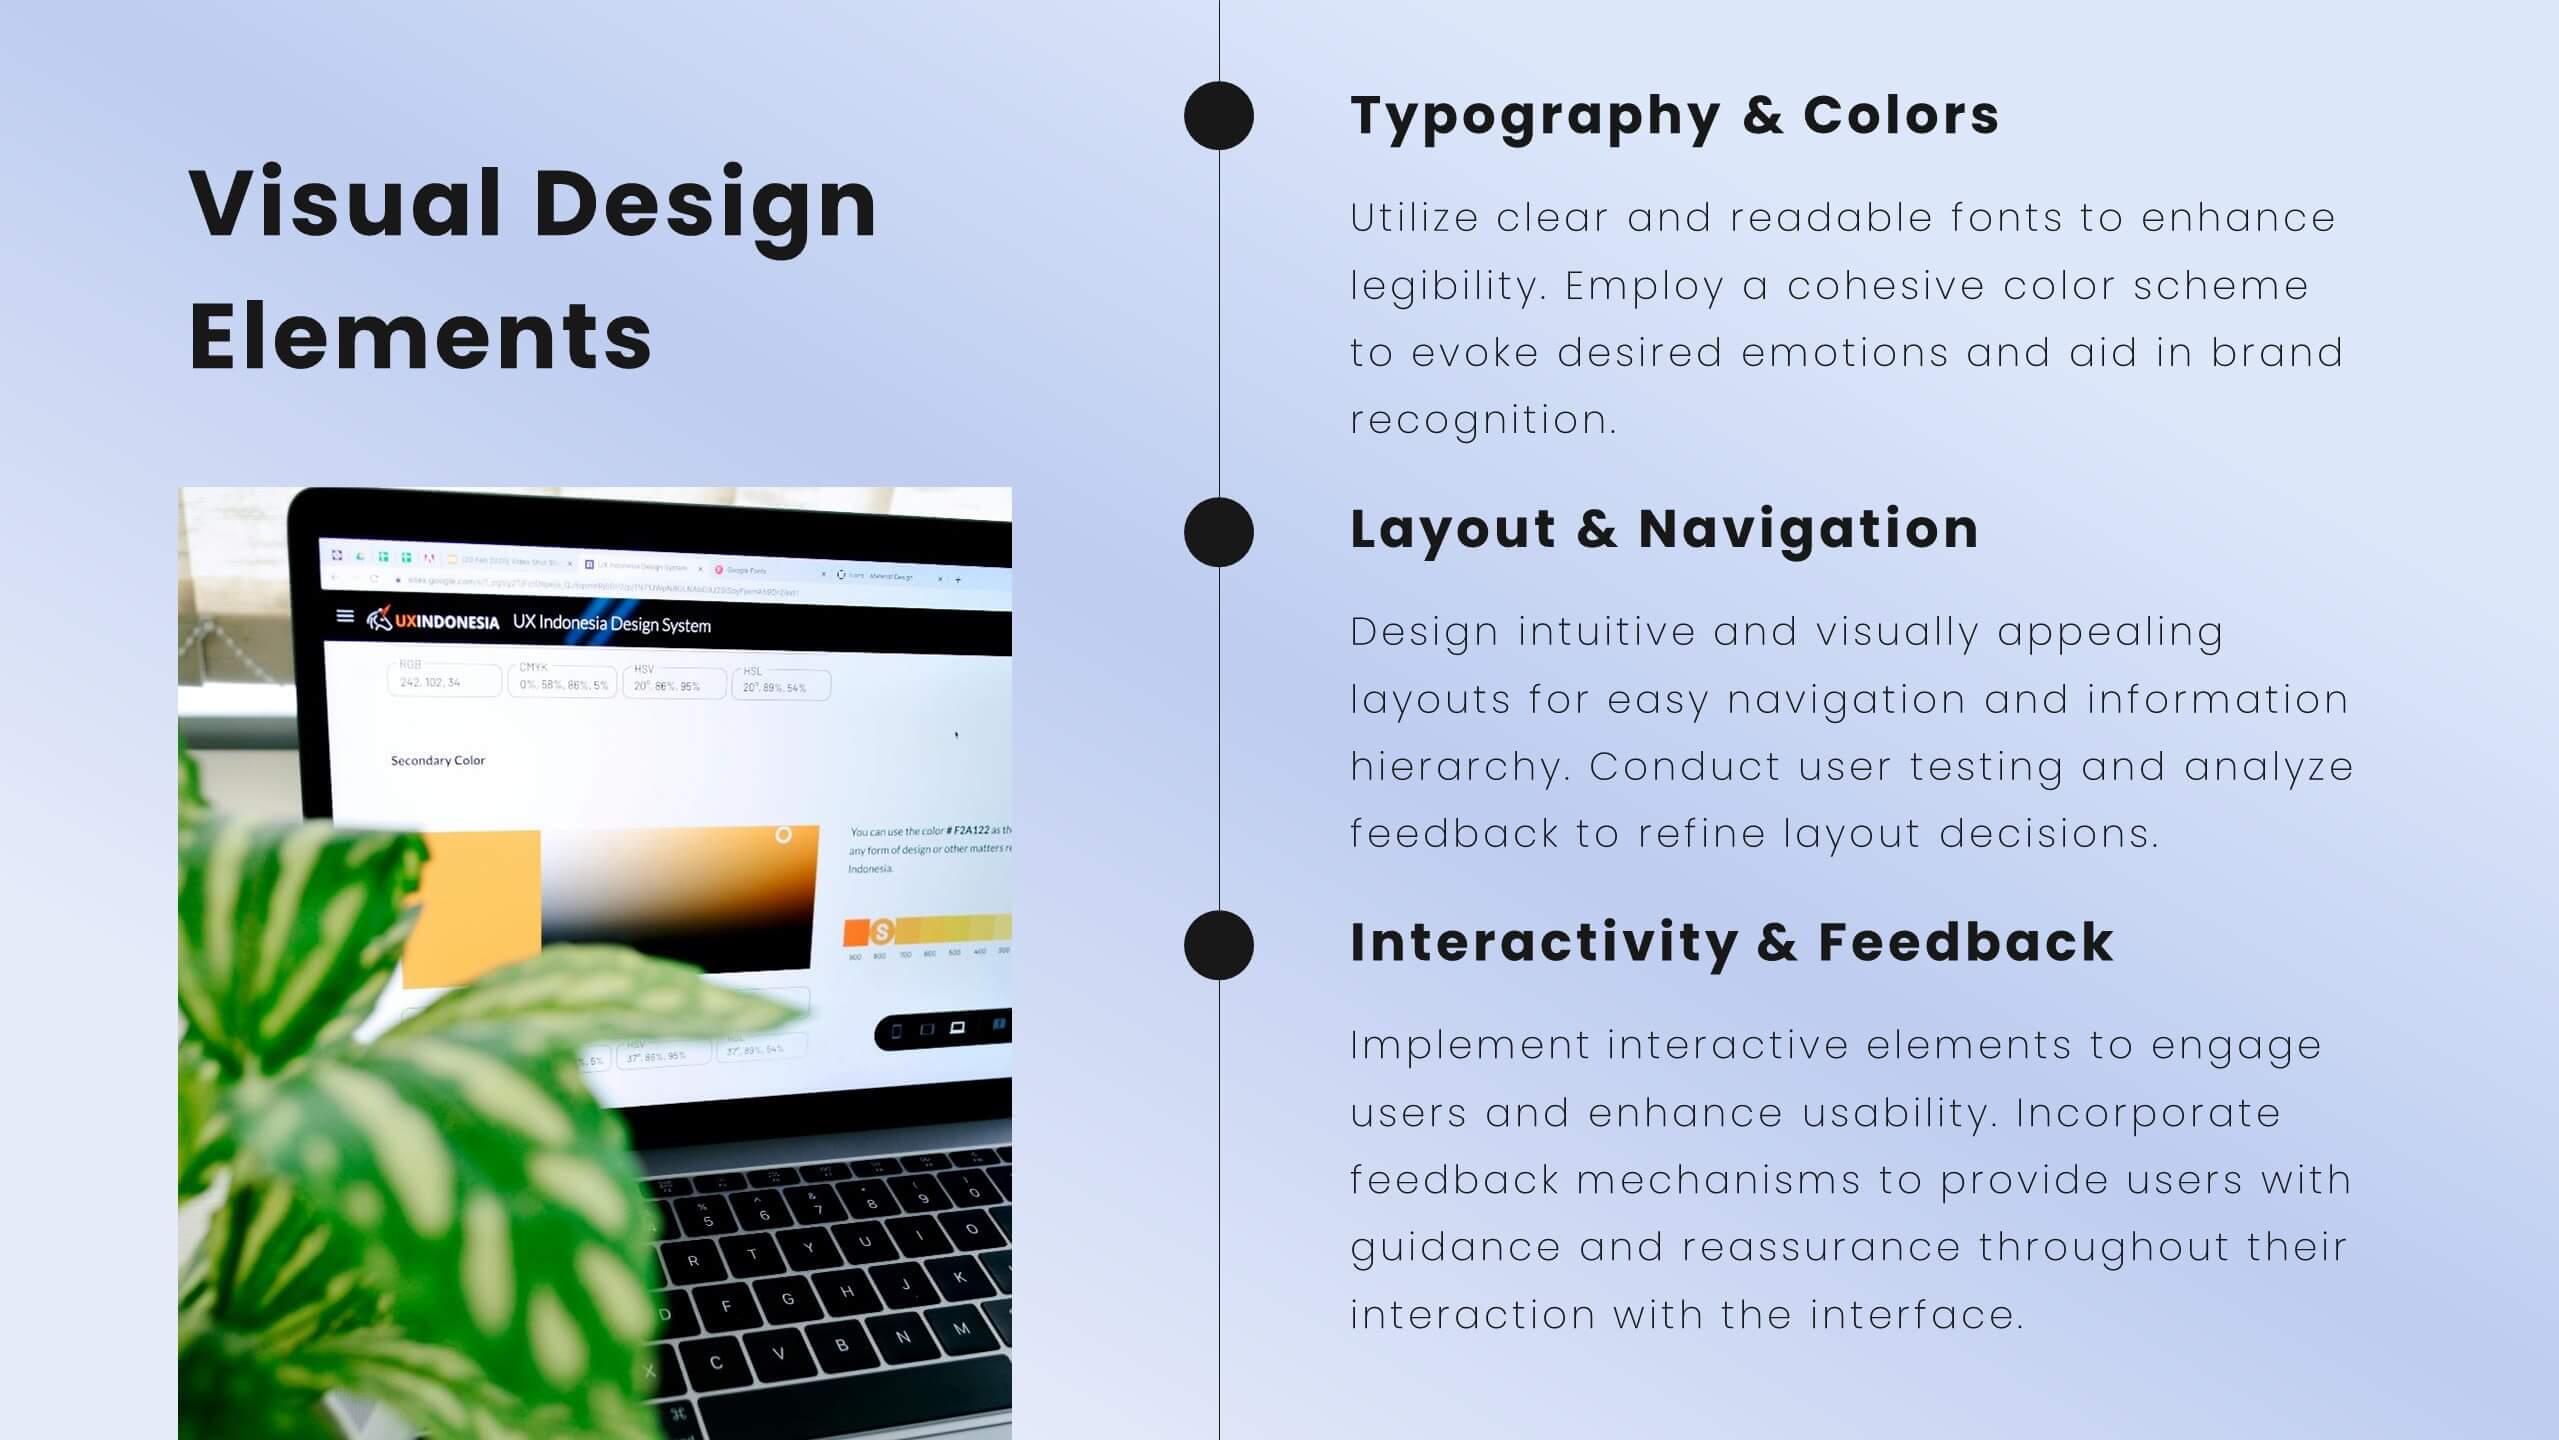
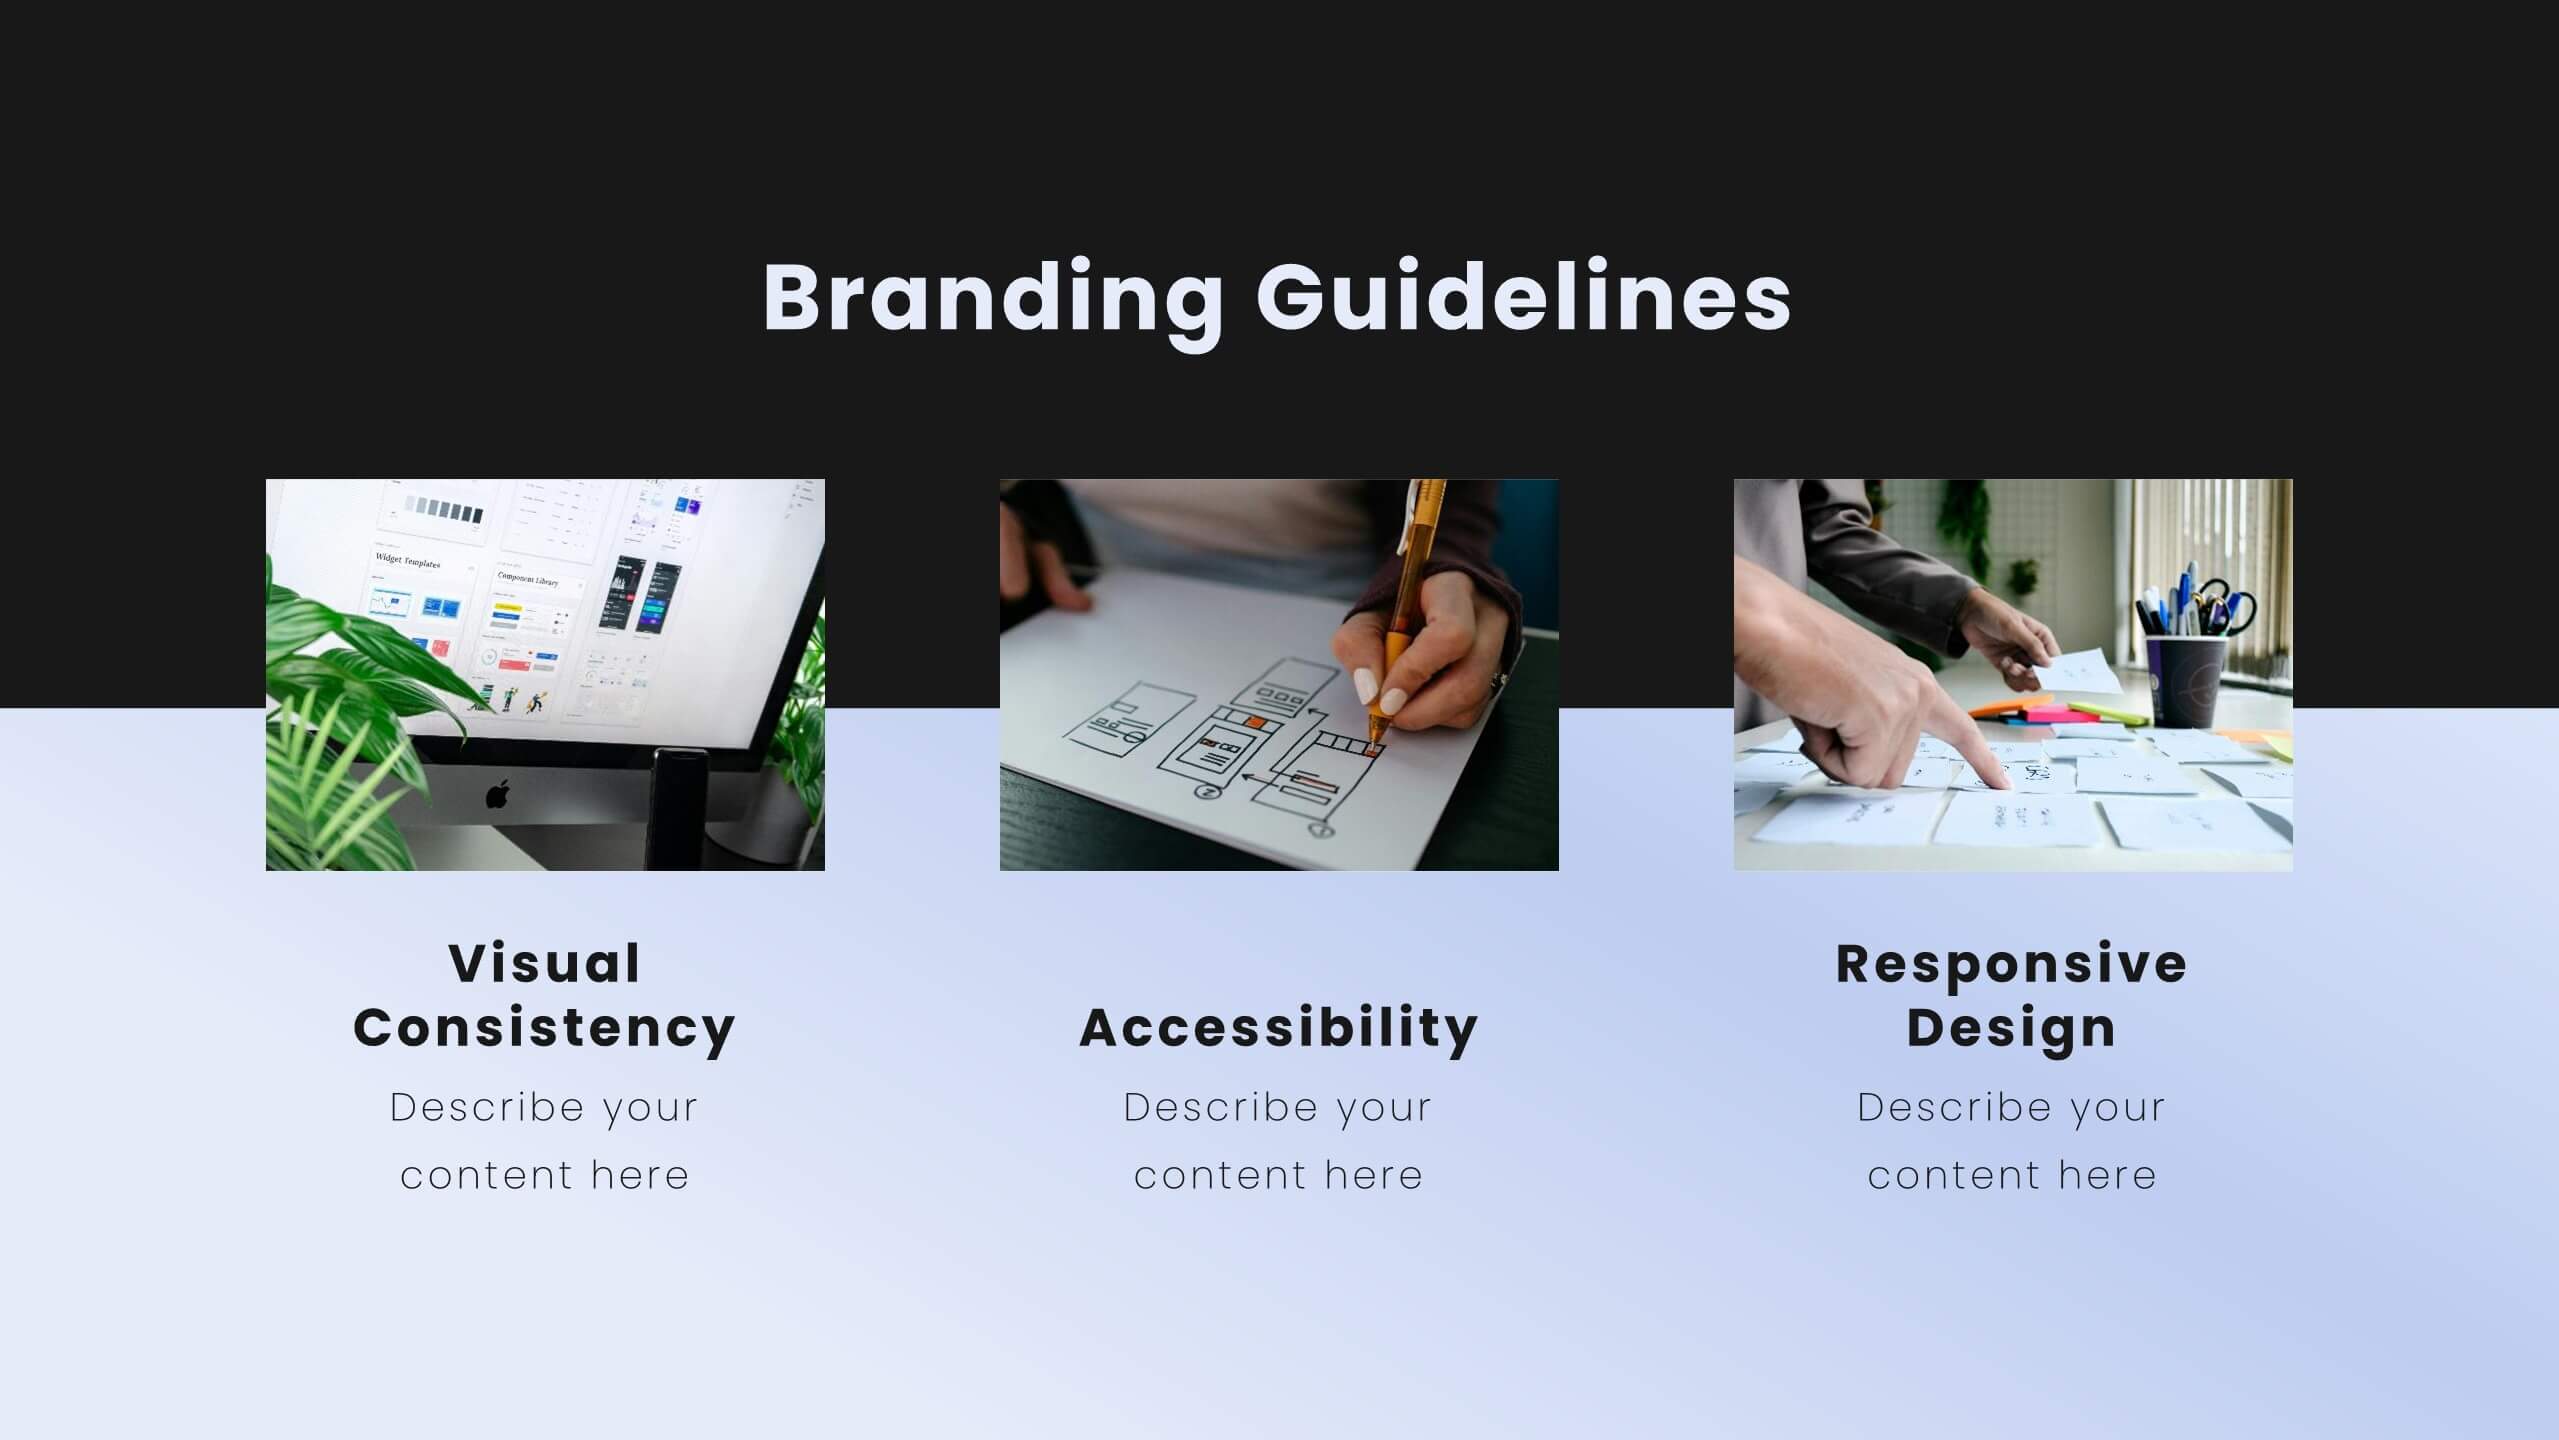
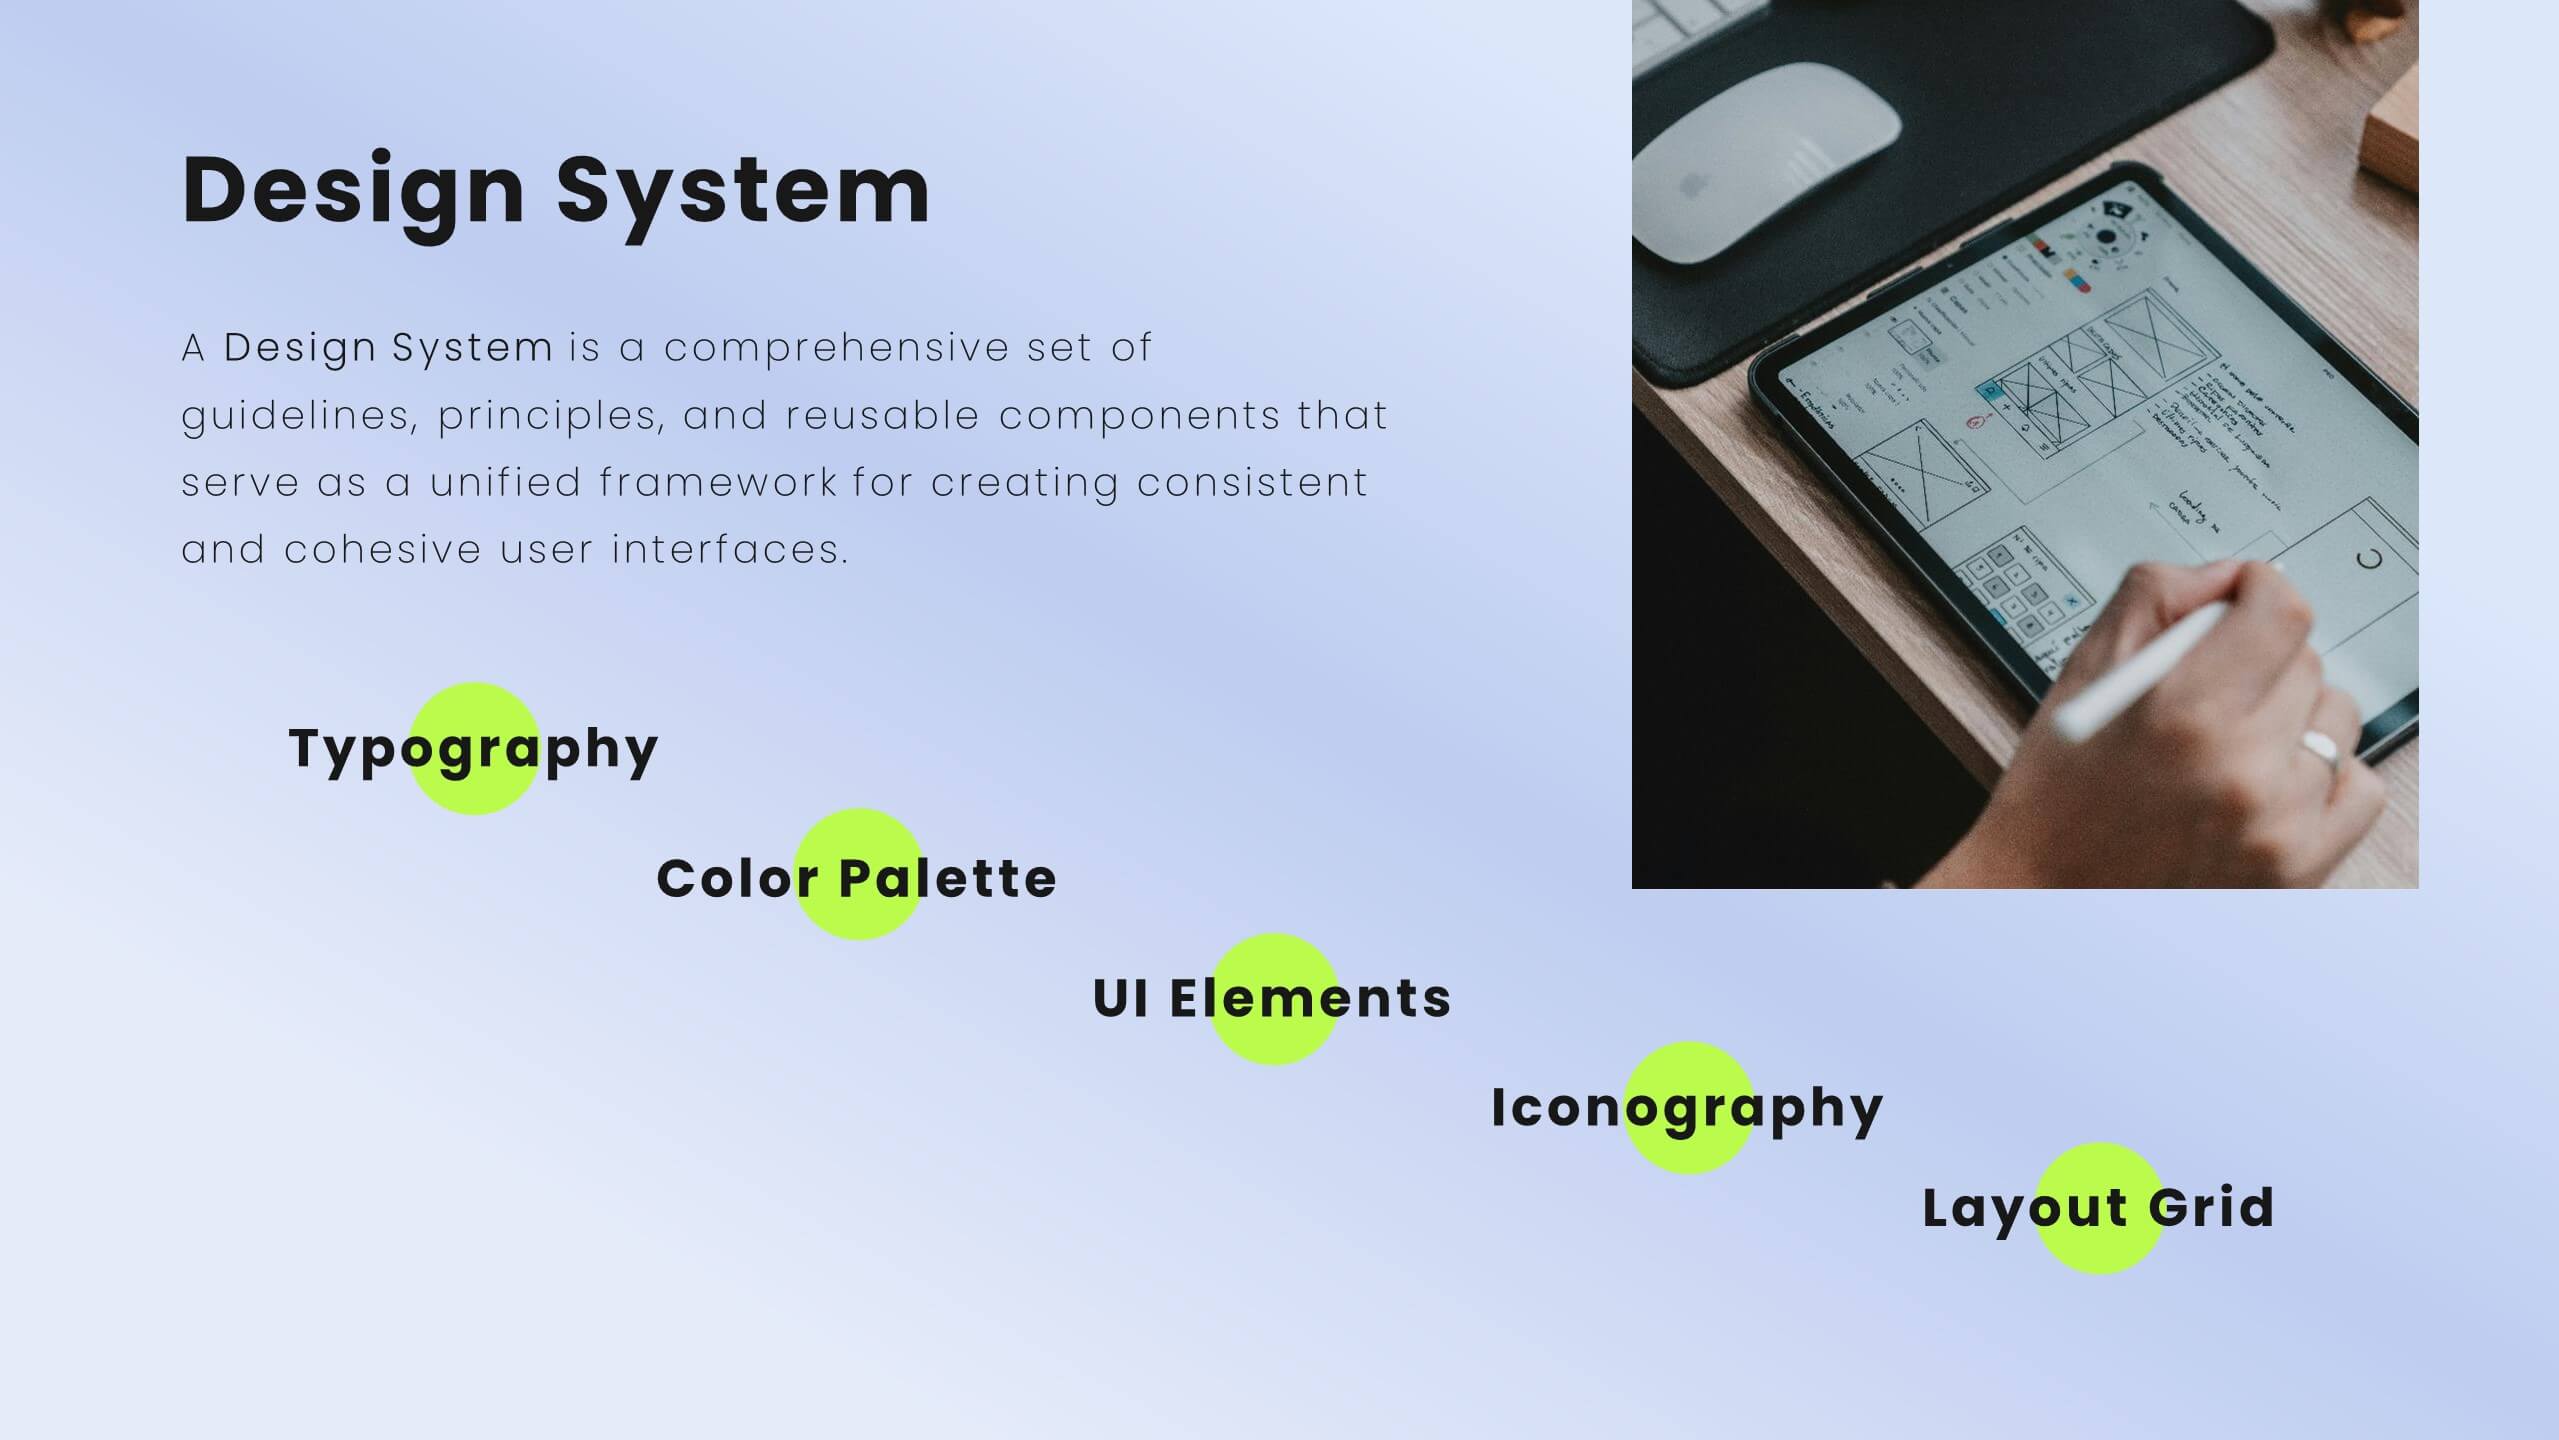
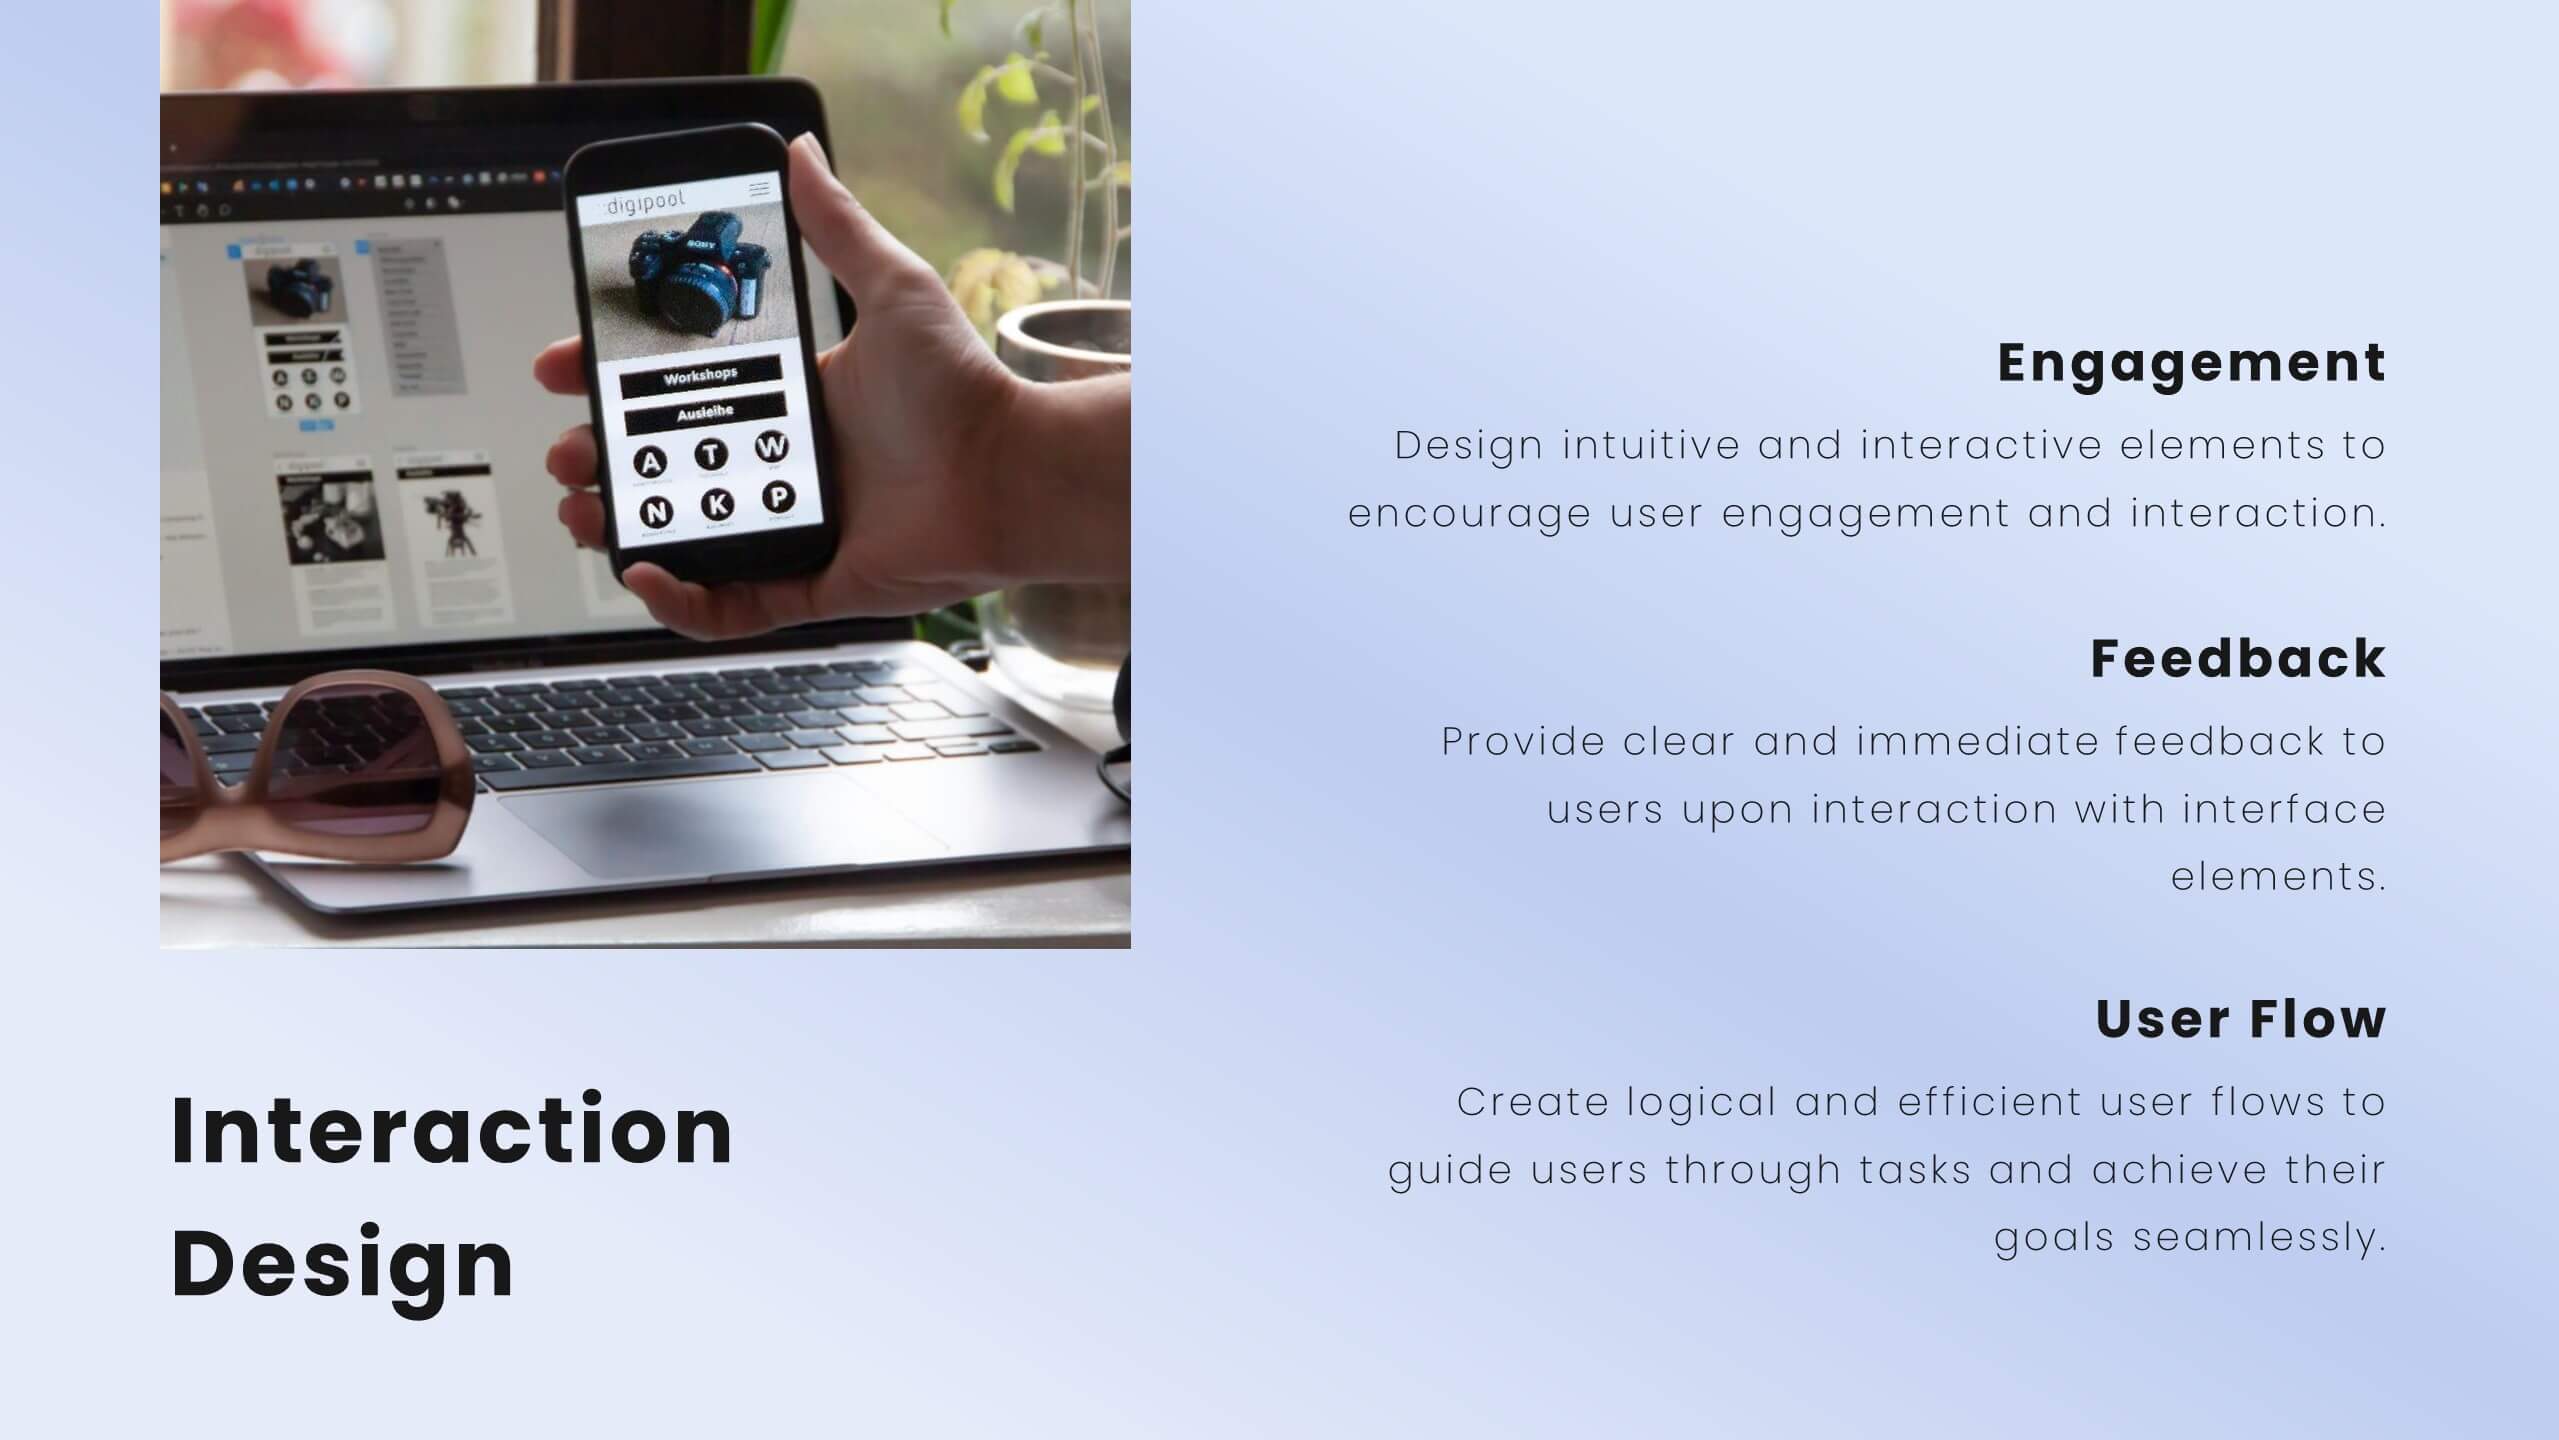
Jigsaw User Experience Proposal Presentation
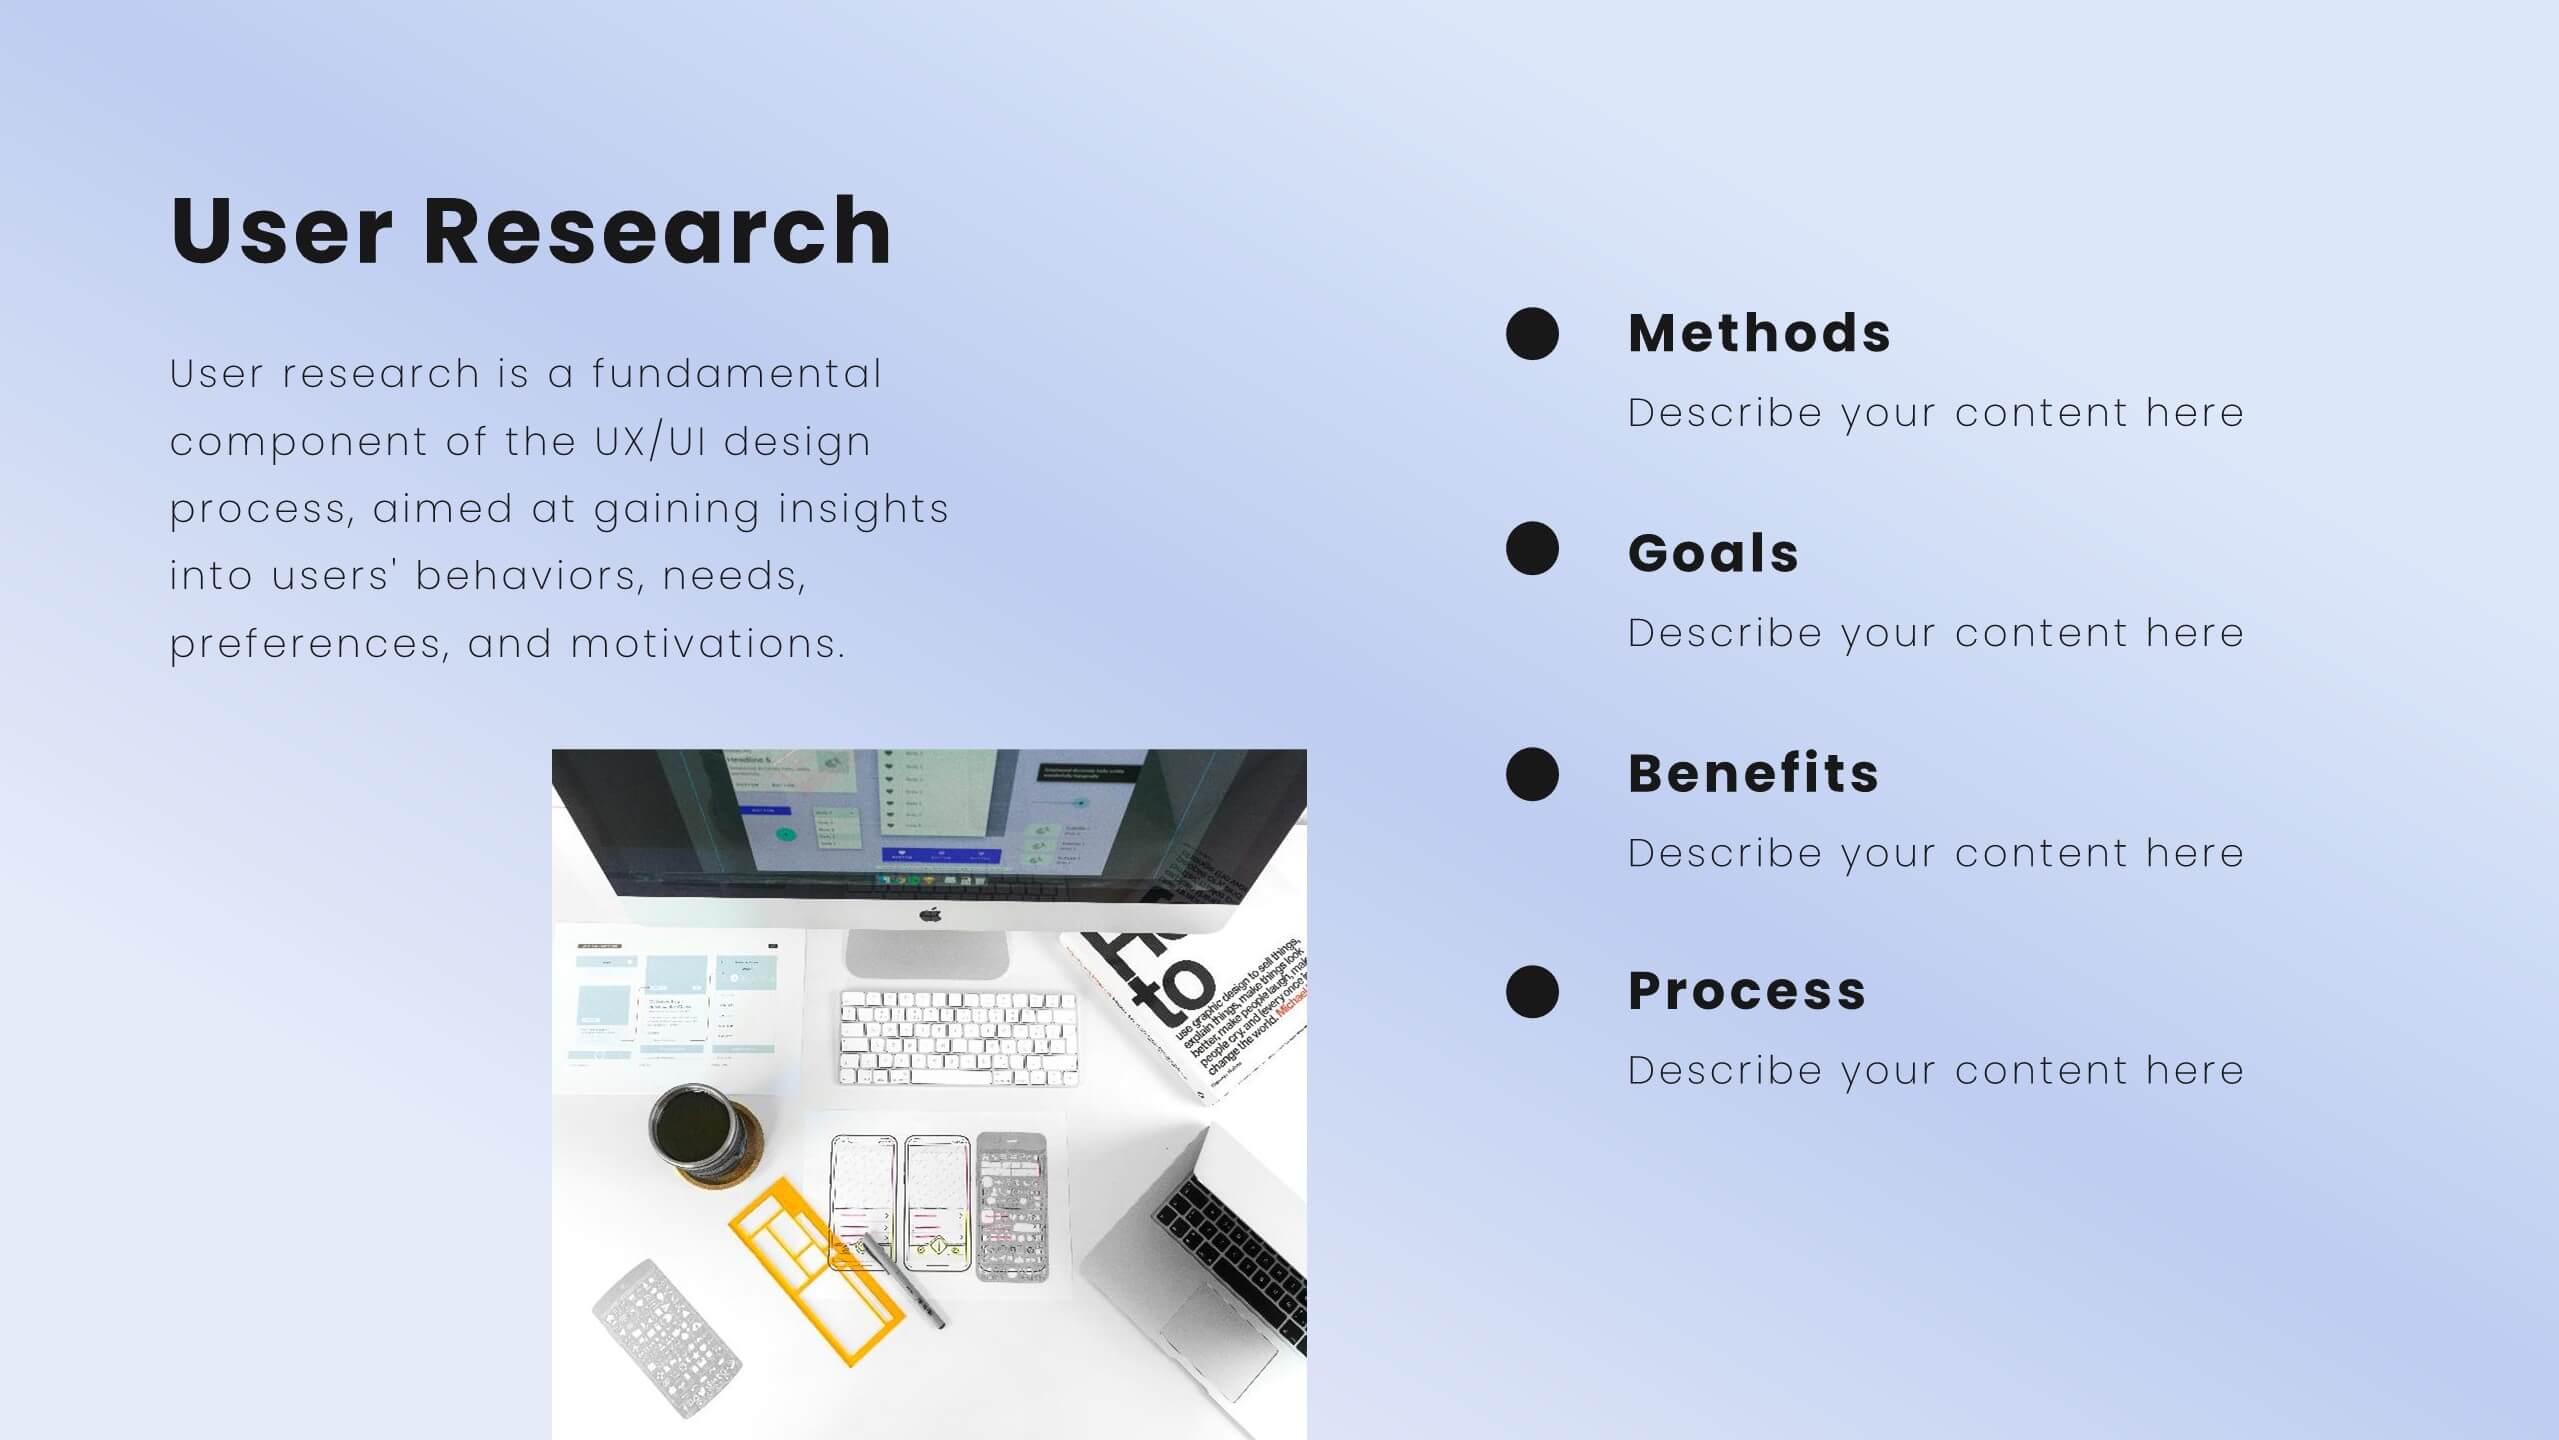
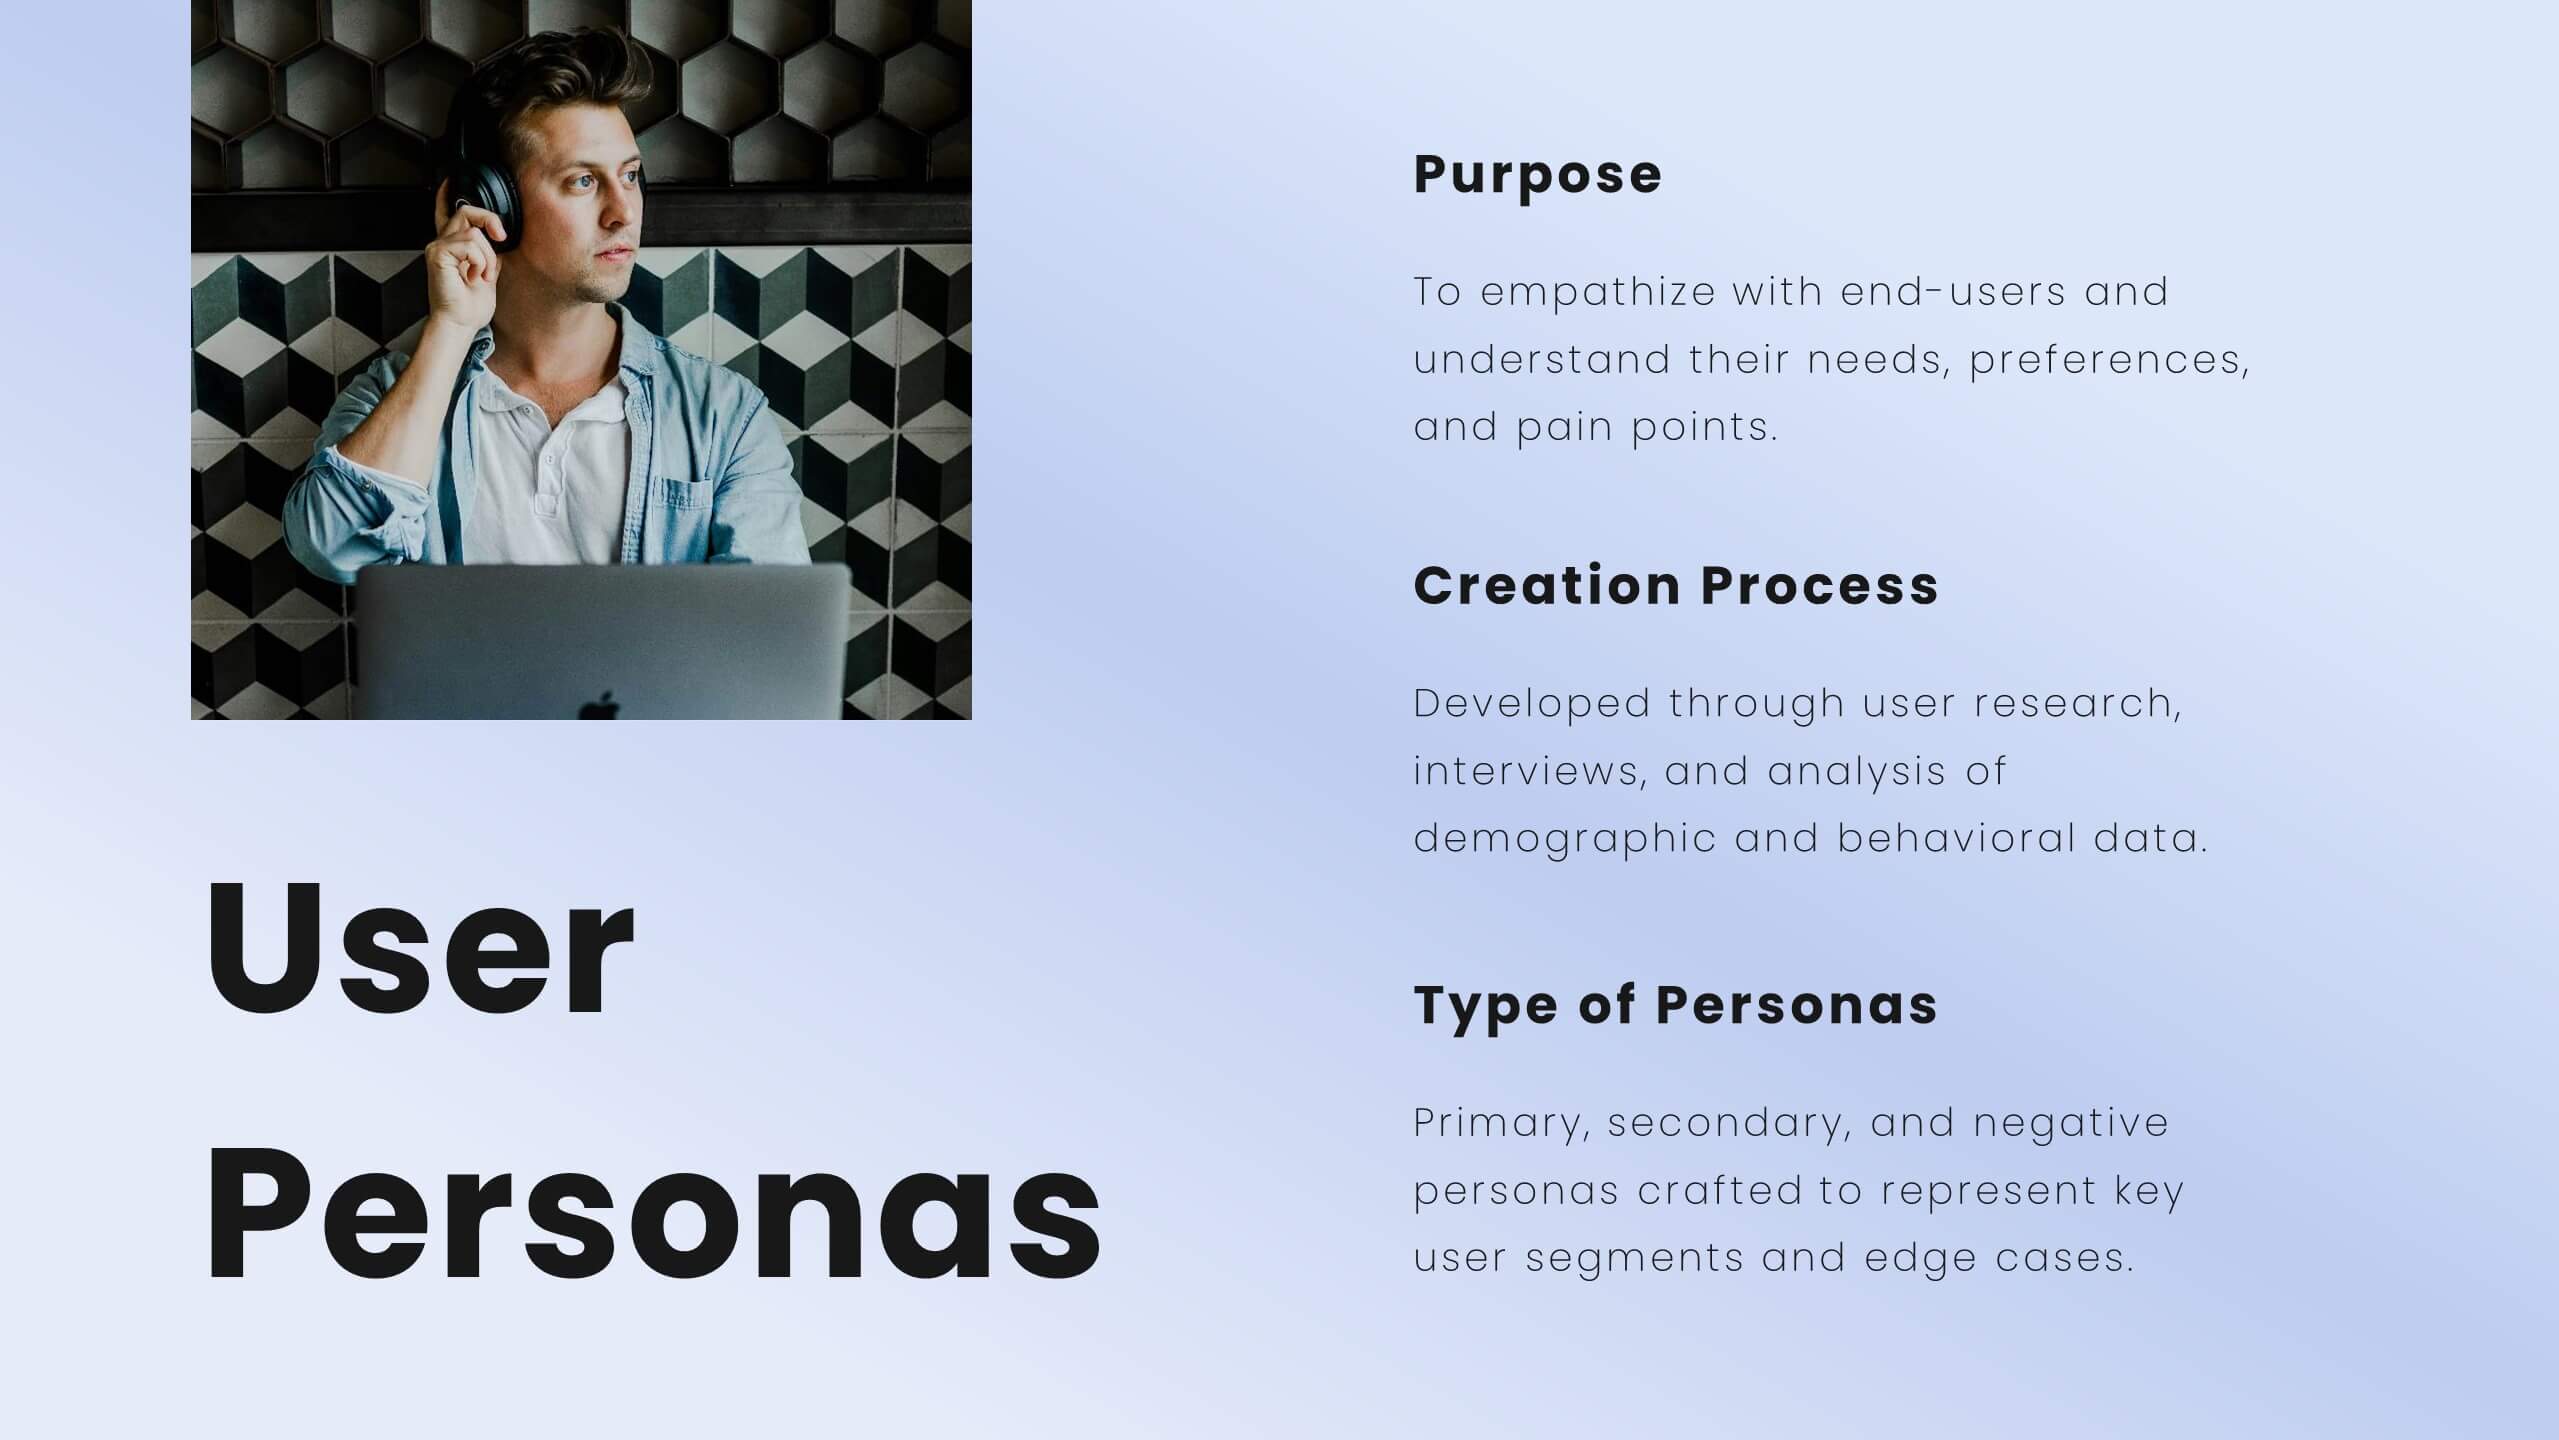
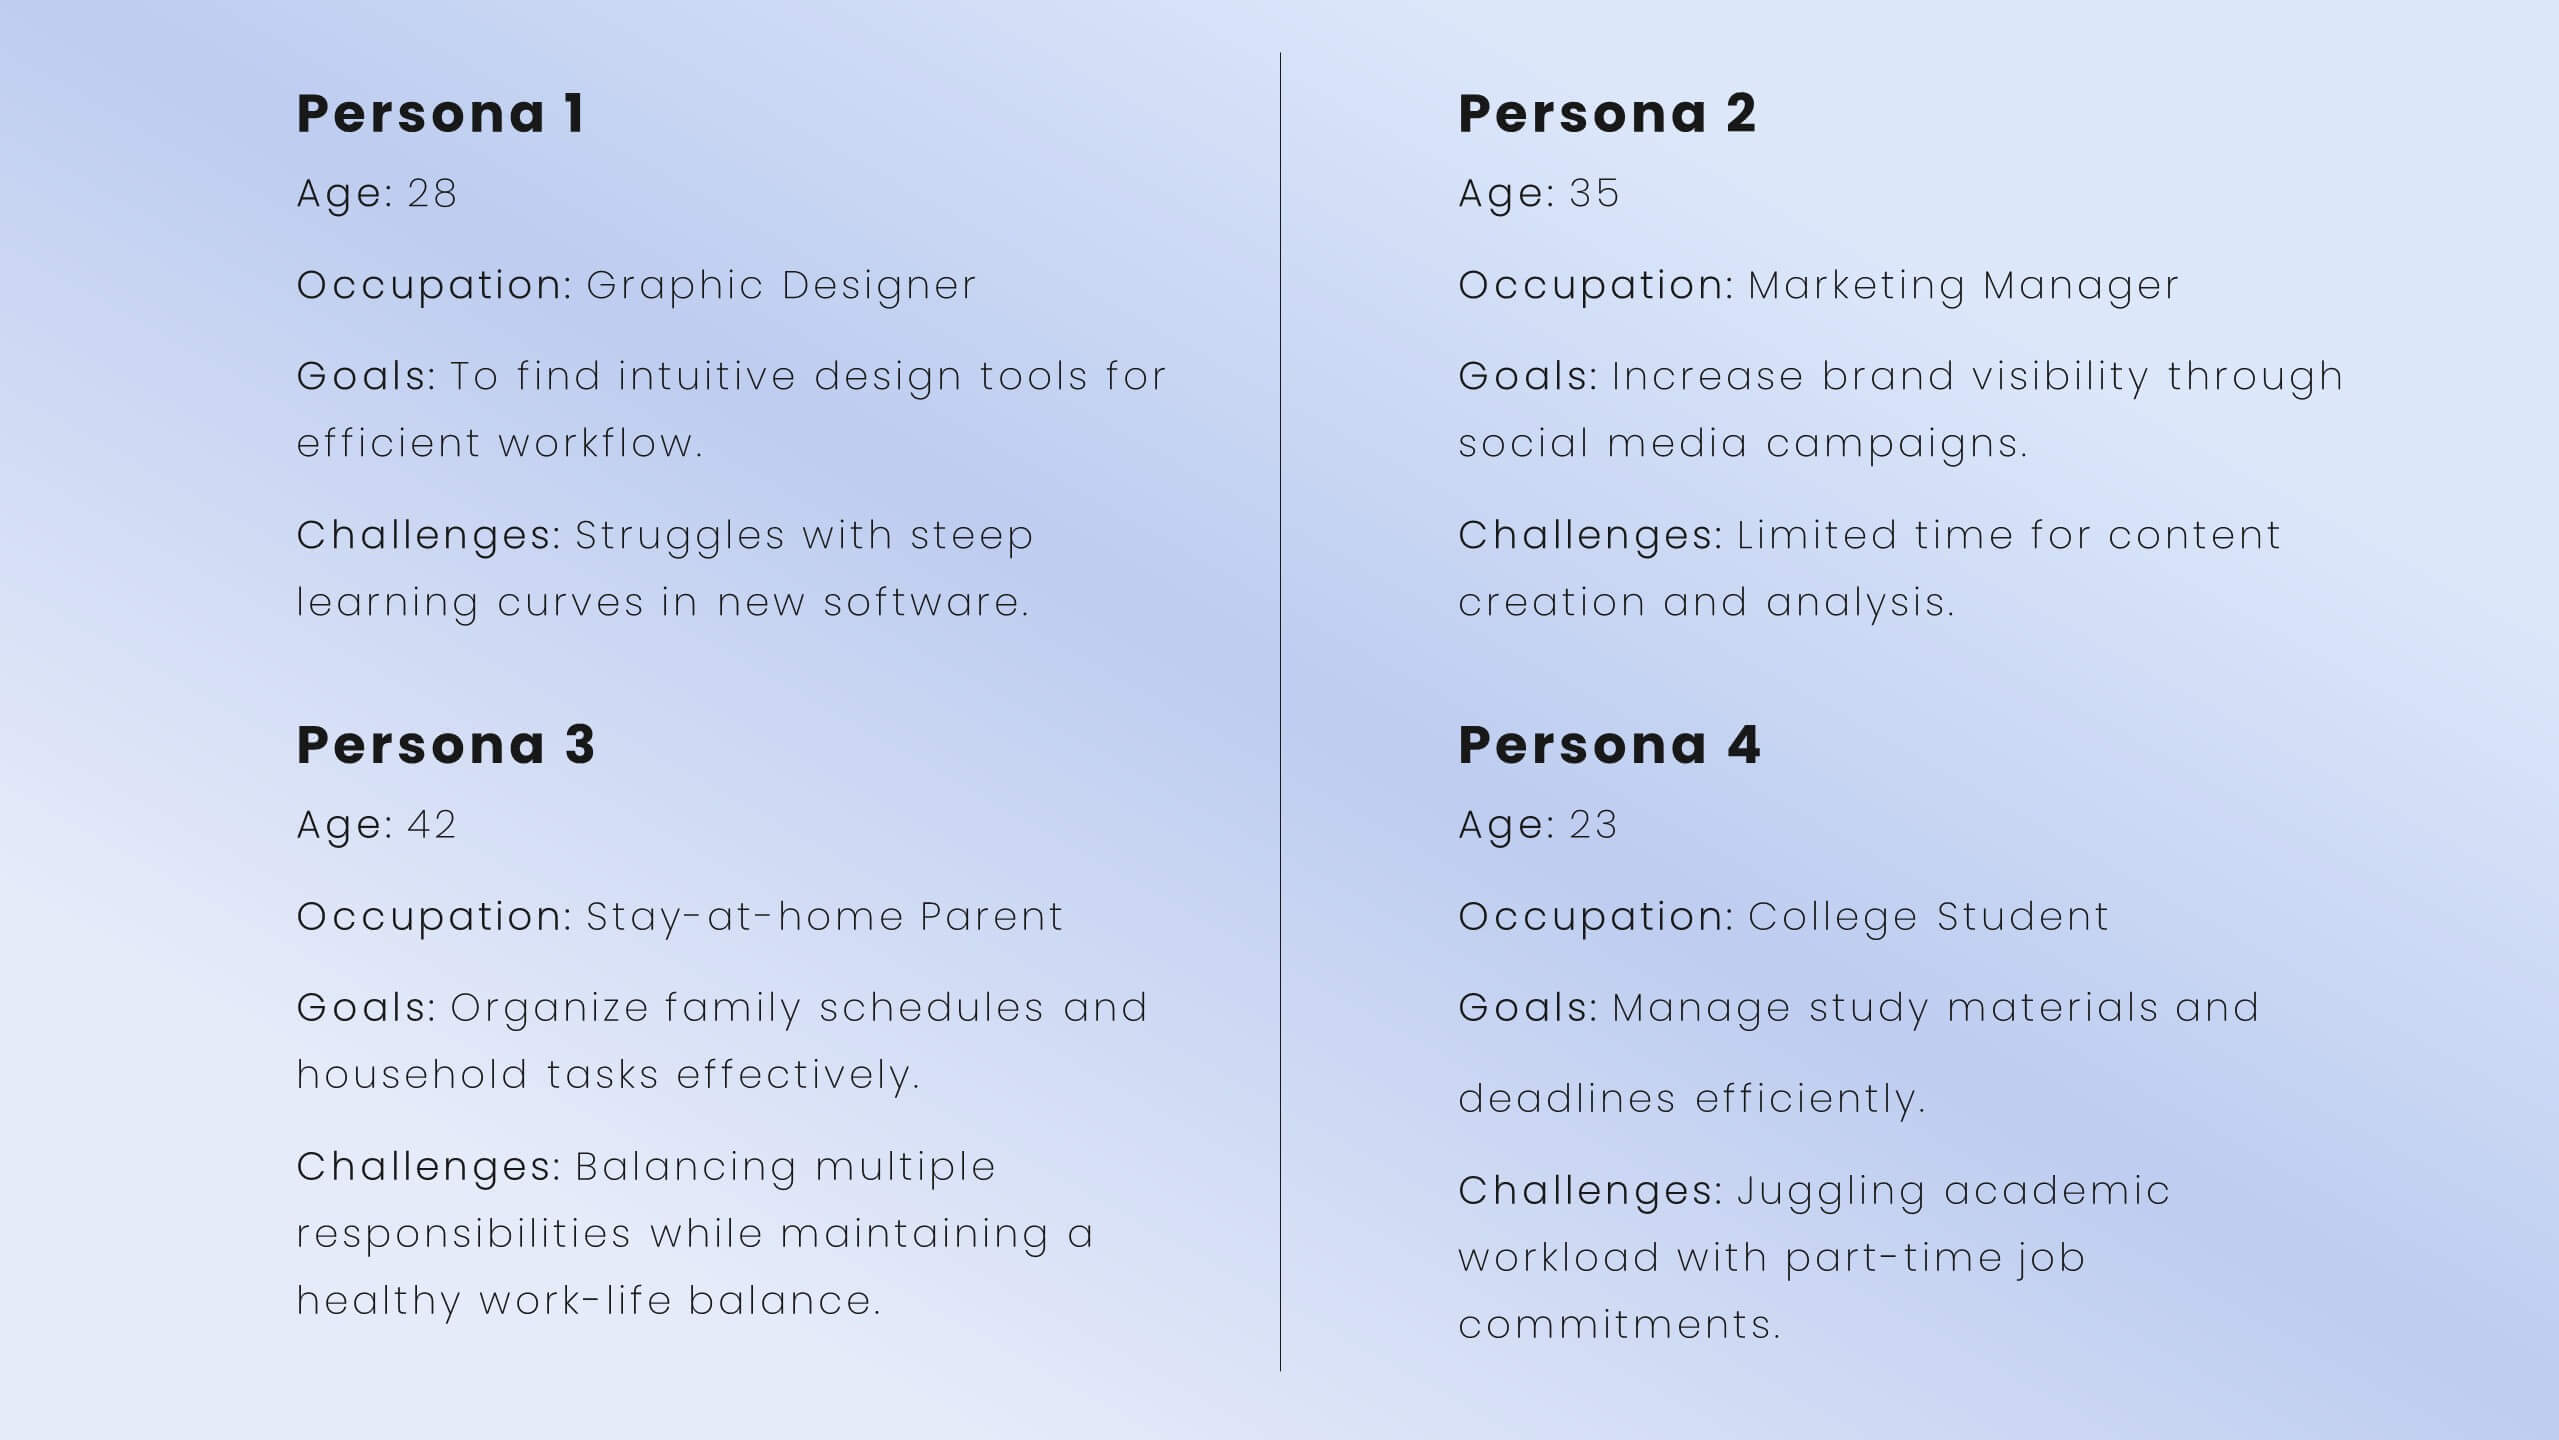
Enhance user experience with this comprehensive UX proposal template! Perfect for outlining user research, personas, and design principles. Ideal for UX/UI designers aiming to present their strategies and solutions. Compatible with PowerPoint, Keynote, and Google Slides, this template ensures your UX proposals are clear, professional, and impactful. Create exceptional user experiences today!


7 slides
Digital Marketing Infographic
Digital marketing refers to the use of digital channels, such as the internet, social media, search engines, email, and mobile devices, to promote products, services, and brands. This infographic showcases key concepts and strategies in the field of digital marketing. It is designed to help businesses and marketers effectively communicate and educate their audience about the various aspects of digital marketing. This template can be used to cover a wide range of digital marketing topics, including social media marketing, search engine optimization, content marketing, email marketing, paid advertising, analytics, and more.


8 slides
Business Data Analytics Dashboard
Monitor performance with clarity using this Business Data Analytics Dashboard. Featuring data bars, numeric highlights, and color-coded insights, this slide is perfect for quarterly updates, data reviews, or executive summaries. Clean and professional, it's fully editable in PowerPoint, Keynote, and Google Slides.


7 slides
Brain Structure Infographic
Unlock the marvels of the human mind with our brain structure infographic. Resting on a pristine white canvas and enriched by the calming green, profound blue, and enlightening yellow, this template meticulously dissects the intricacies of brain anatomy. Adorned with detailed infographics, illustrative icons, and specific image placeholders, it dives deep into the regions and functions of the brain. Impeccably tailored for Powerpoint, Keynote, or Google Slides. An indispensable resource for neuroscientists, educators, medical students, or anyone with an intrigue for cerebral wonders. Venture with insight; let each slide be your guide through the labyrinth of the human brain.


12 slides
Risk Management and Security Compliance Presentation
Enhance your organizational resilience with the 'Risk Management and Security Compliance' presentation template. This intuitive design helps you communicate complex compliance standards and risk mitigation strategies effectively. Ideal for training sessions, board meetings, and compliance audits, ensuring your team stays informed and proactive in managing risks.


4 slides
Property Listing and Comparison Presentation
A sleek, modern way to spotlight property details comes to life in this clean presentation design, making comparisons feel effortless and engaging. It clearly organizes features, differences, and key selling points so audiences can make informed decisions fast. Fully editable and easy to use, this presentation works seamlessly in PowerPoint, Keynote, and Google Slides.


2 slides
Meeting and Business Planning Services Illustrations
Take your planning game to the next level with our meeting and business planning services illustrations pack! This illustrations pack is perfect for companies that need a way to visualize their ideas quickly and easily. Fully compatible with Powerpoint, Keynote, and Google Slides. Boost your productivity and make your meetings more exciting—download the meeting and business planning services illustrations pack today!


6 slides
ABC Alphabet Infographic
An "Alphabet Infographic" is a visually engaging way to present the letters of the alphabet along with corresponding words or images that start with each letter. This type of infographic is often used in educational settings to teach young children the alphabet and basic vocabulary. Display the letters of the alphabet in a clear and appealing layout. You can arrange them in rows or columns, using a bold and easily readable font. Use colorful and child-friendly illustrations for the images associated with each letter. This will make the infographic more captivating and engaging for young learners.


26 slides
Emery Presentation Template
Ready to make an impression? Style and professionalism are all wrapped up in Emery. New businesses and startups will find it useful - from real estate to travel agencies and everything in-between. Emery is a bold, colorful minimalistic aesthetic template. It's easy to customize, clean and bold template for you to use for your company website. It's flexible and makes an easy quick start. Fill in your details with our easy to edit text, pictures, timelines, charts and we'll set you up for success. Use this fantastic template to promote your business or project and create the perfect document.


4 slides
Problem Tracing with Fishbone Diagram Presentation
Identify root causes clearly with the Problem Tracing with Fishbone Diagram Presentation. This template features a horizontal, fish-shaped layout with six categories represented in vertical columns, helping you trace issues back to their source. Ideal for quality control, brainstorming, and strategic reviews. Fully editable in PowerPoint, Keynote, and Google Slides.


3 slides
Market Size and Scaling Insights Presentation
Understand your market potential with the Market Size and Scaling Insights Diagram. This visually engaging template helps you analyze market segments, growth trends, and scaling opportunities with clarity. Ideal for business strategists, analysts, and investors, this slide ensures a concise and professional presentation of key market data. Fully customizable and compatible with PowerPoint, Keynote, and Google Slides.


6 slides
Ideal Customer Profile Infographic
A customer profile, also known as a buyer persona, is a detailed and semi-fictional representation of your ideal customer. This infographic template can help businesses visualize and communicate their target audience characteristics and preferences. This template is a valuable tool for educating your team and clients about your ideal customer profile. This customer profile infographic can help your team align their efforts towards effectively targeting and engaging the right audience for your products or services. Compatible with Powerpoint, Keynote, and Google Slides. Incorporate your brand's logo and color scheme to maintain consistency.


7 slides
Investment Infographic Presentation Template
This Investment Infographic template is a professionally designed presentation made to present your ideas in an easy to understand format. This template features a professional design, easy color customization and a number of other useful elements to help you create an amazing infographic. This template is designed to include a variety of charts and graphs to visually demonstrate key points, and incorporates animated elements that make it more interesting for the viewer. This is the perfect presentation to introduce your company's investment portfolio to potential investors.


6 slides
Transportation and Logistics Jobs Infographic
Transportation and logistics jobs involve managing the movement of goods, materials, and people from one location to another. This infographic template is essential in ensuring the efficient and smooth operation of supply chains, distribution networks, and transportation systems. This infographic is an informative representation of the various job roles and career opportunities available within the transportation and logistics industry. This template is designed to provide valuable insights to individuals seeking careers in this field, as well as professionals looking to explore different career paths within transportation and logistics.


5 slides
4-Stage Gap Identification Presentation
A clear, engaging way to map progression, this presentation helps you illustrate each stage of identifying business gaps with structure and clarity. It guides audiences through challenges, priorities, and opportunities in a simple step-by-step flow that’s easy to follow and present. Fully compatible with PowerPoint, Keynote, and Google Slides.