


Features
- 6 Unique slides
- Fully editable and easy to edit in Microsoft Powerpoint, Keynote and Google Slides
- 16:9 widescreen layout
- Clean and professional designs
- Export to JPG, PDF or send by email


Do you have any questions?
Recommend


5 slides
Business Hierarchy Pyramid Presentation
Present your business structure or priorities with clarity using our "Business Hierarchy Pyramid Presentation" template. This infographic elegantly segments different layers or levels within your organization, project, or planning strategy, with a pyramid design that visually emphasizes the foundational to advanced stages. Each level of the pyramid is distinctly colored and labeled, allowing you to easily insert key points or data relevant to each segment. Ideal for corporate presentations, strategic meetings, and management training, this template ensures your key concepts are organized and clearly communicated. Compatible with PowerPoint, Keynote, and Google Slides, it integrates effortlessly into your professional toolkit.


22 slides
Mistgrove Digital Agency Strategy Plan Presentation
Craft an impactful strategy for your digital agency with this sleek and professional presentation template. Highlight your agency's mission, vision, and services while showcasing success stories through client testimonials and case studies. Dive into essential sections like market analysis, industry trends, and competitive positioning to communicate a forward-thinking strategy effectively. This template includes dedicated slides for creative processes, strategy development, and campaign execution, ensuring you present your approach clearly and confidently. With options for measurement and analytics, future outlooks, and social impact initiatives, it empowers you to convey the value and growth potential of your strategies. Fully compatible with PowerPoint, Google Slides, and Keynote, this template offers seamless customization to align with your agency's unique brand identity and goals.


21 slides
Janus Project Timeline Presentation
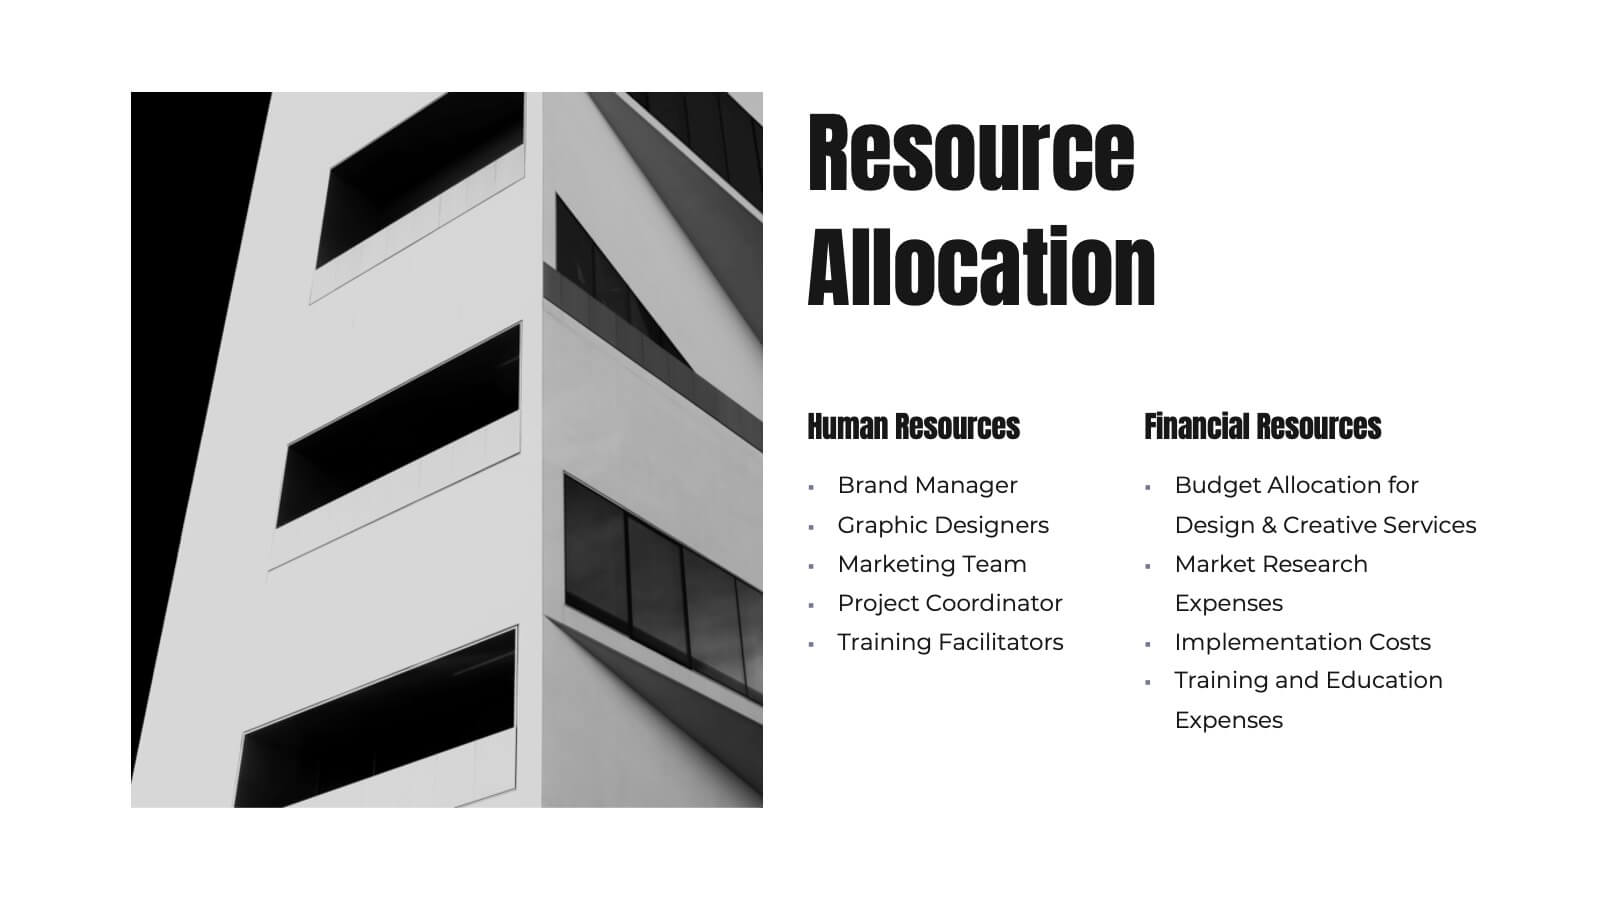
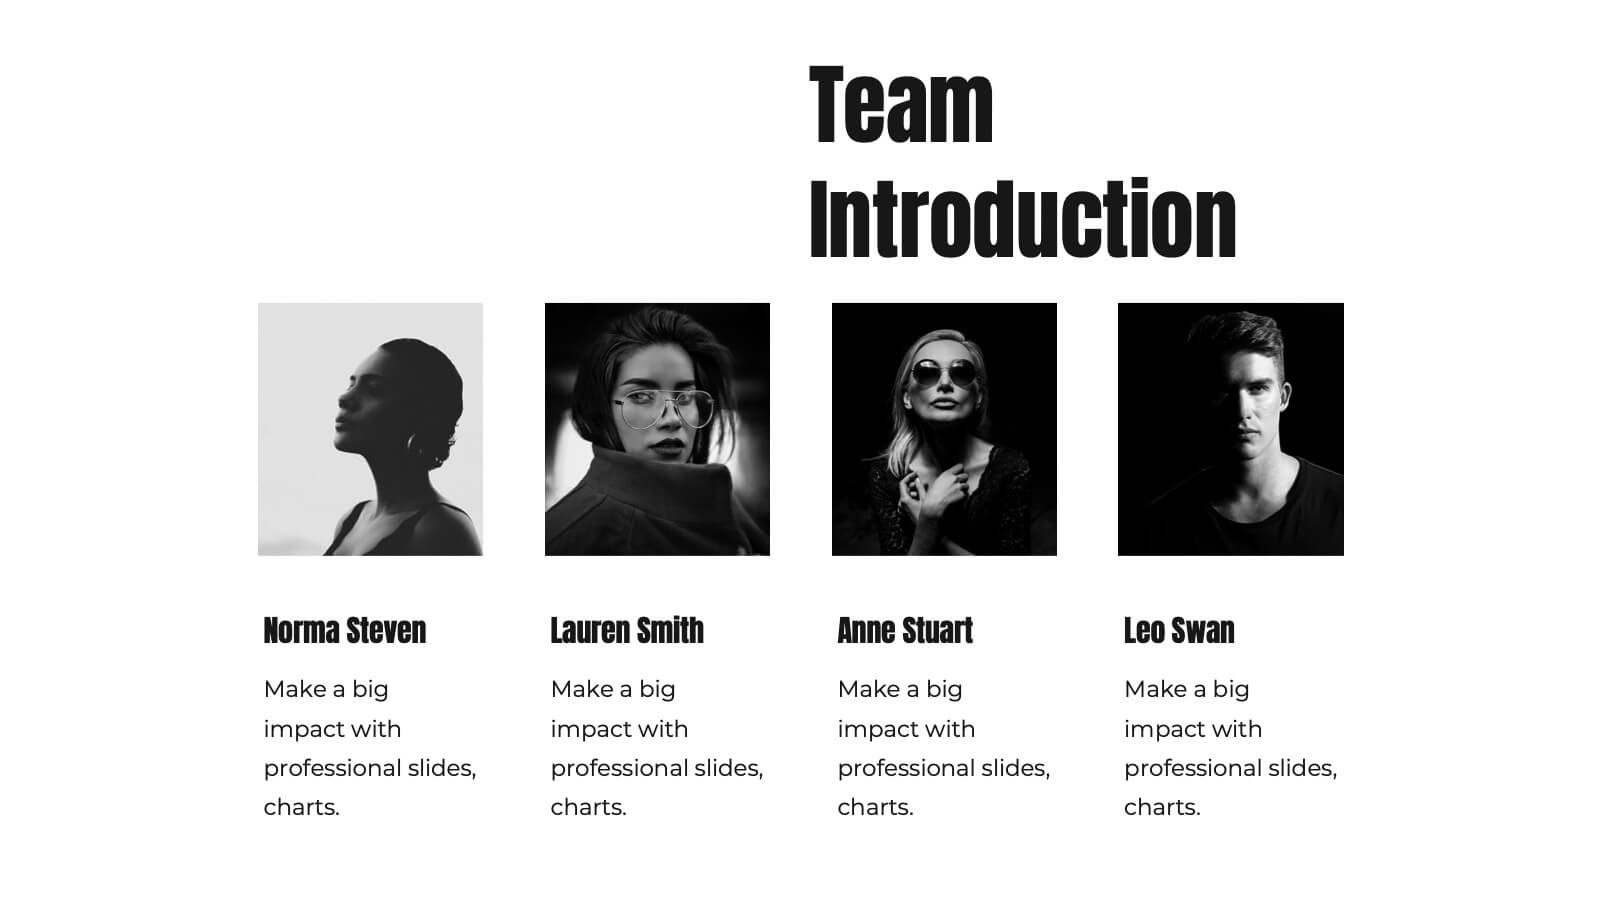
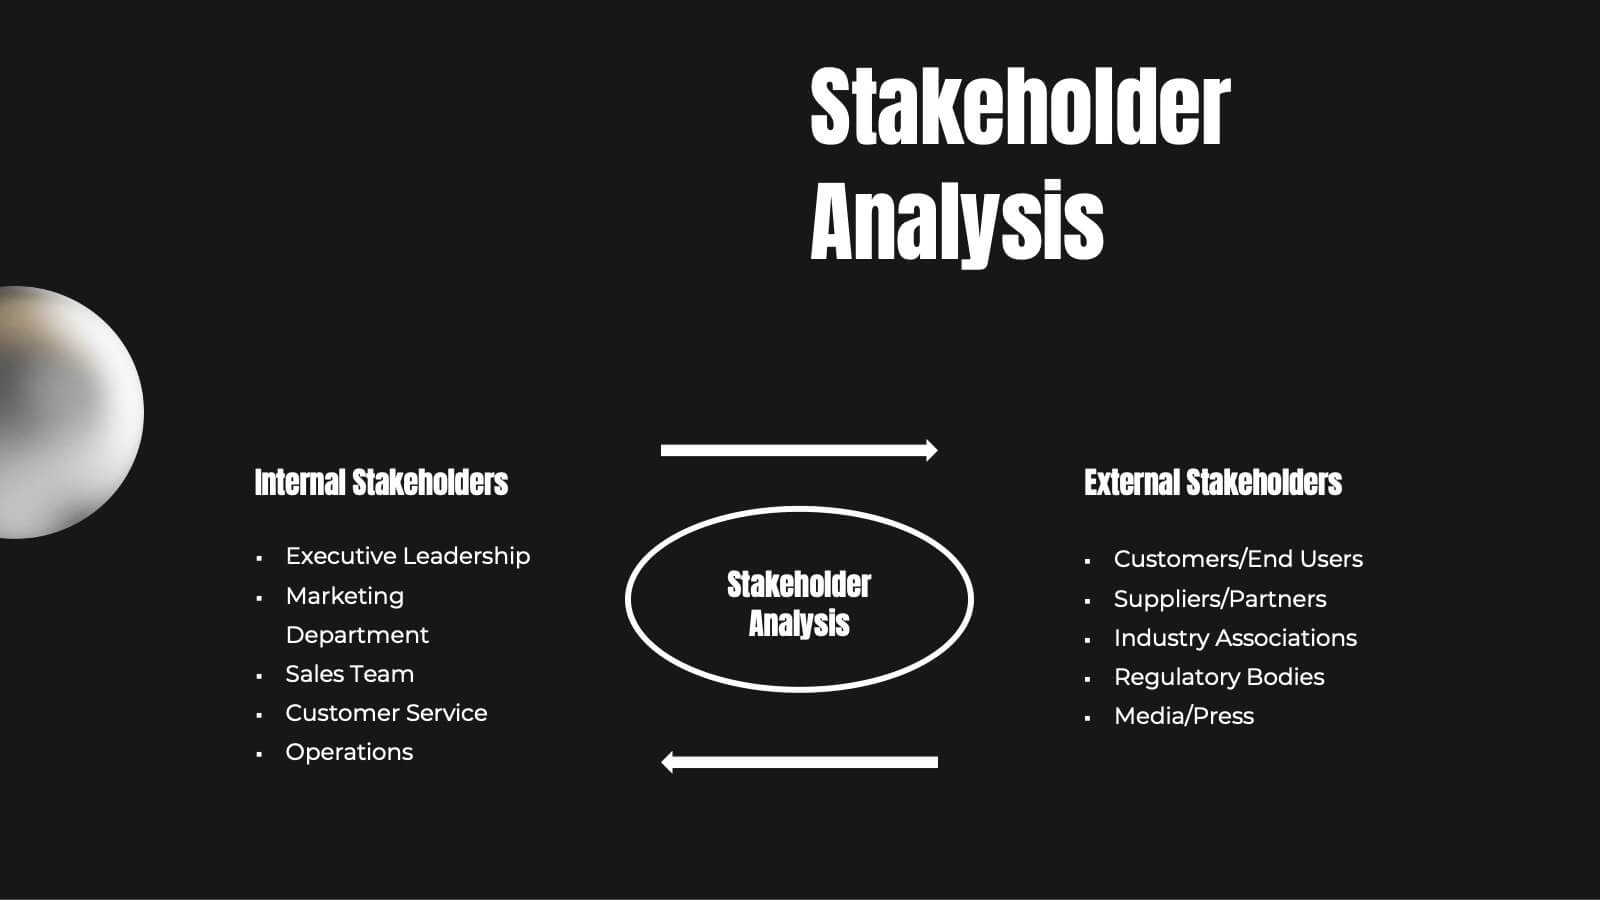
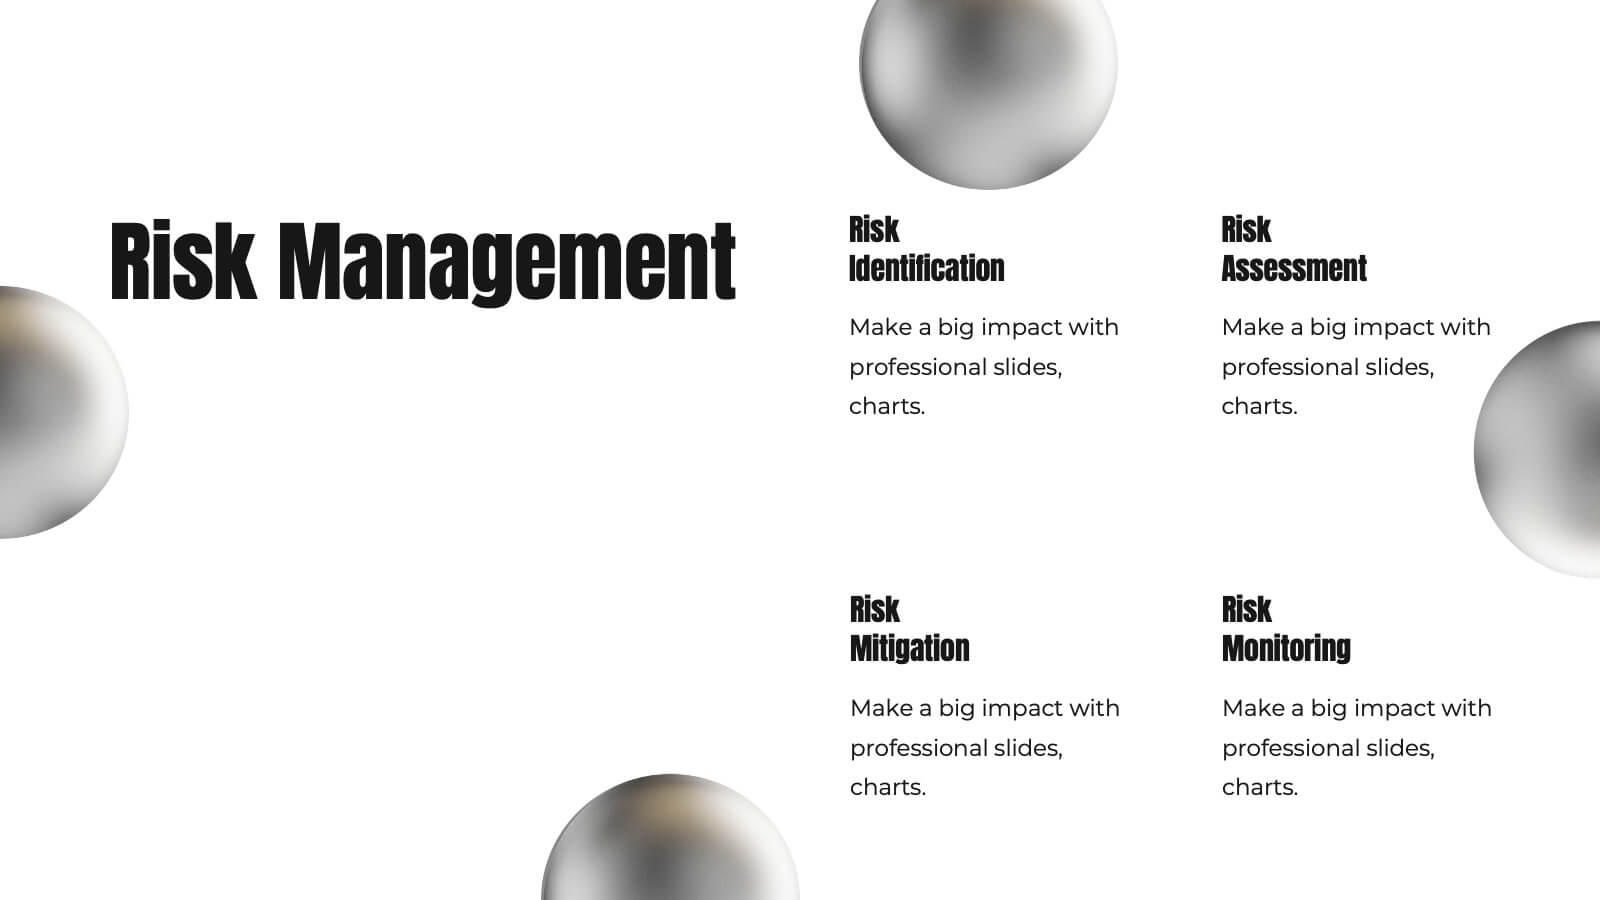
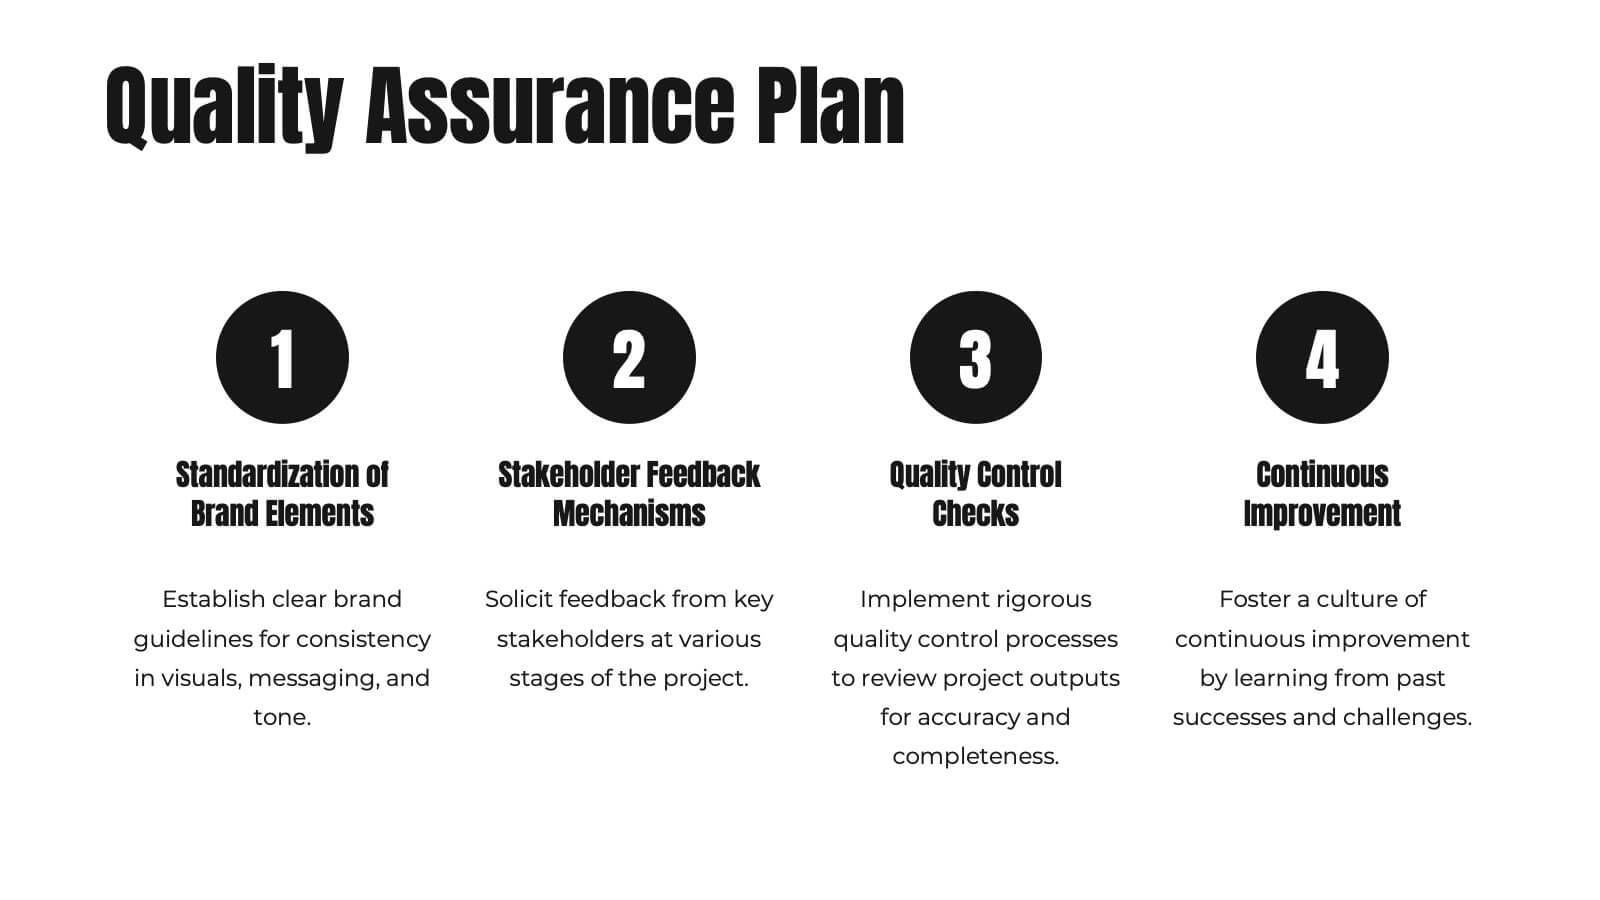
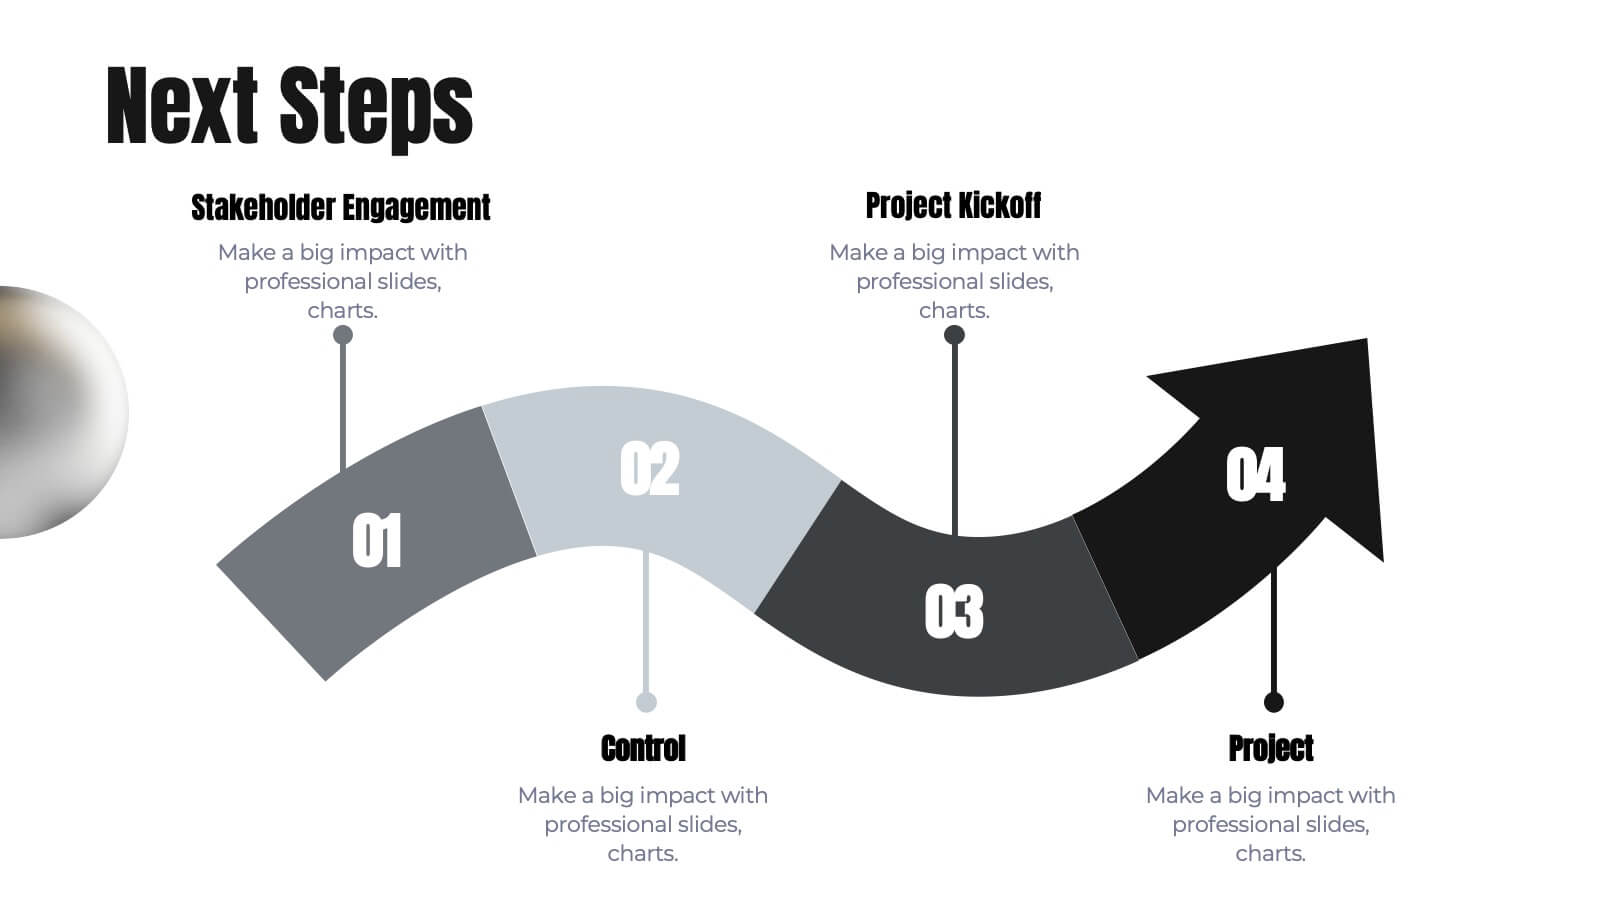
Craft a seamless project plan with this sleek and professional presentation template! Designed to guide you through every step, from project overview and scope of work to risk management and resource allocation, this template covers all the essentials. It's perfect for keeping your team on track with clear deliverables, timelines, and evaluation criteria. Compatible with PowerPoint, Keynote, and Google Slides for effortless presentations.


6 slides
Table of Content Layout Presentation
Kick off your presentation with a clean, modern layout that instantly guides your audience through each section with clarity and style. This design highlights key topics in a structured, easy-to-follow sequence, making navigation simple and intuitive. Fully compatible with PowerPoint, Keynote, and Google Slides for seamless use.


23 slides
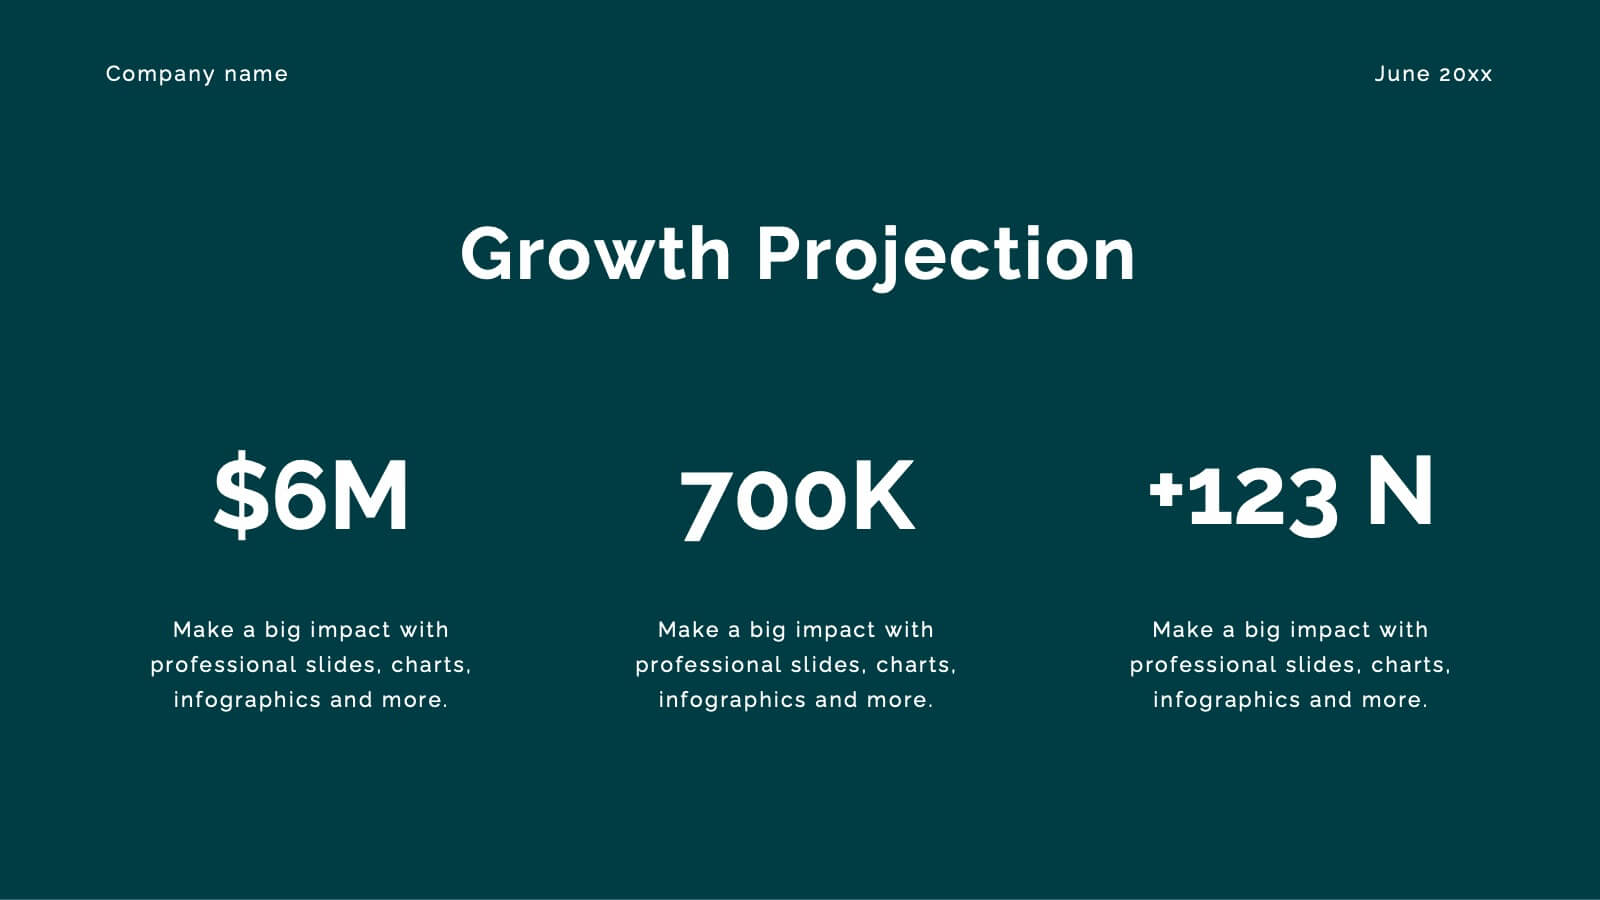
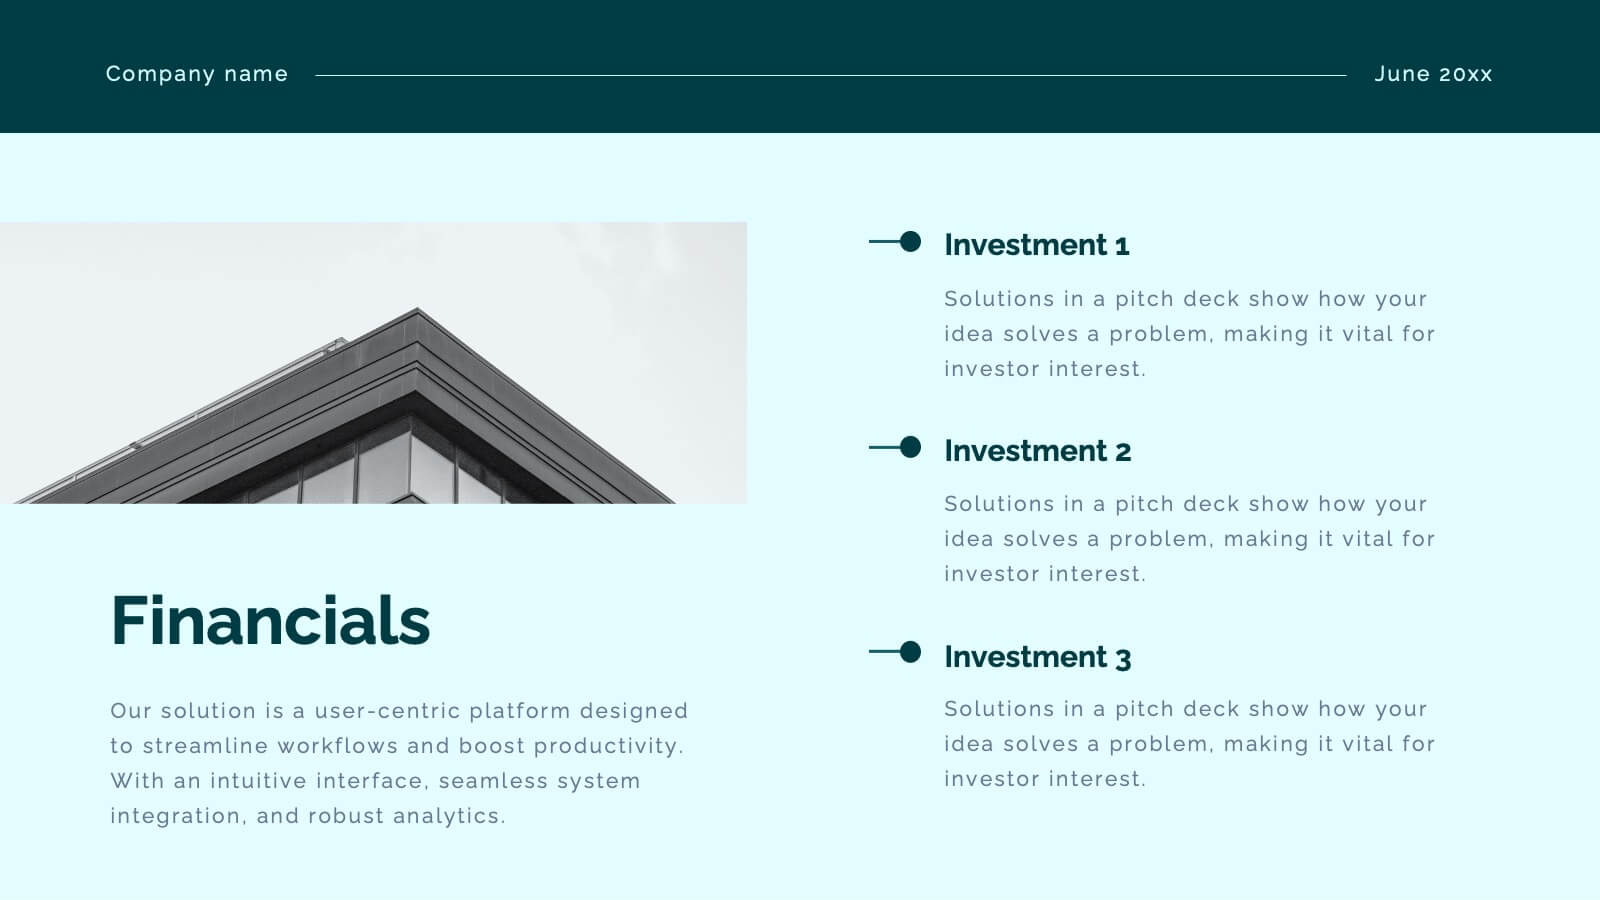
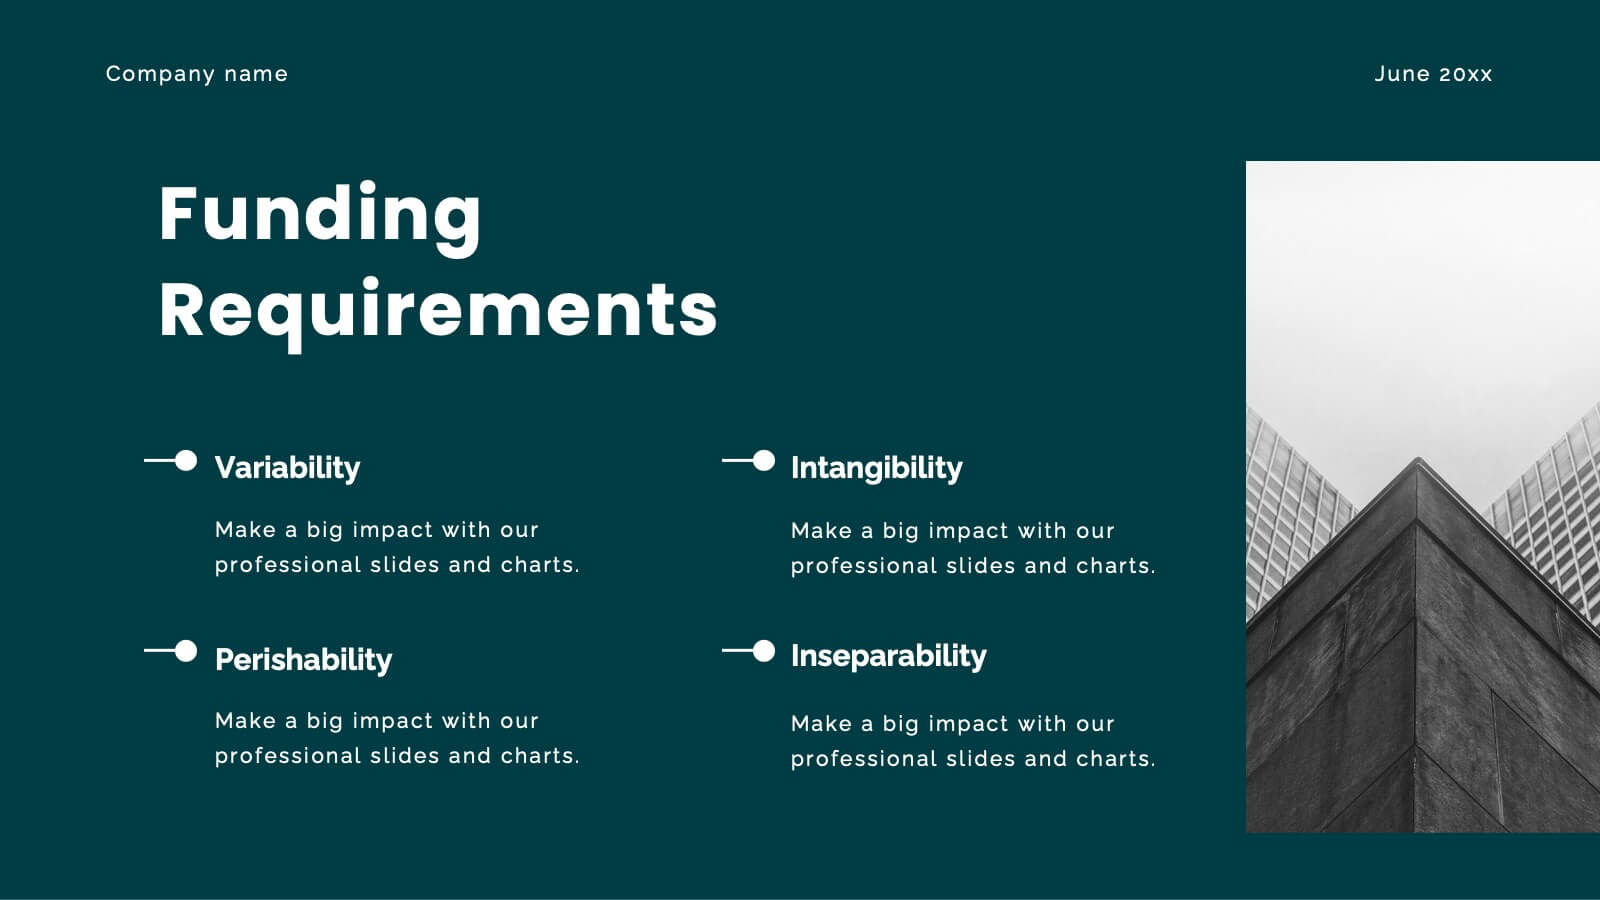
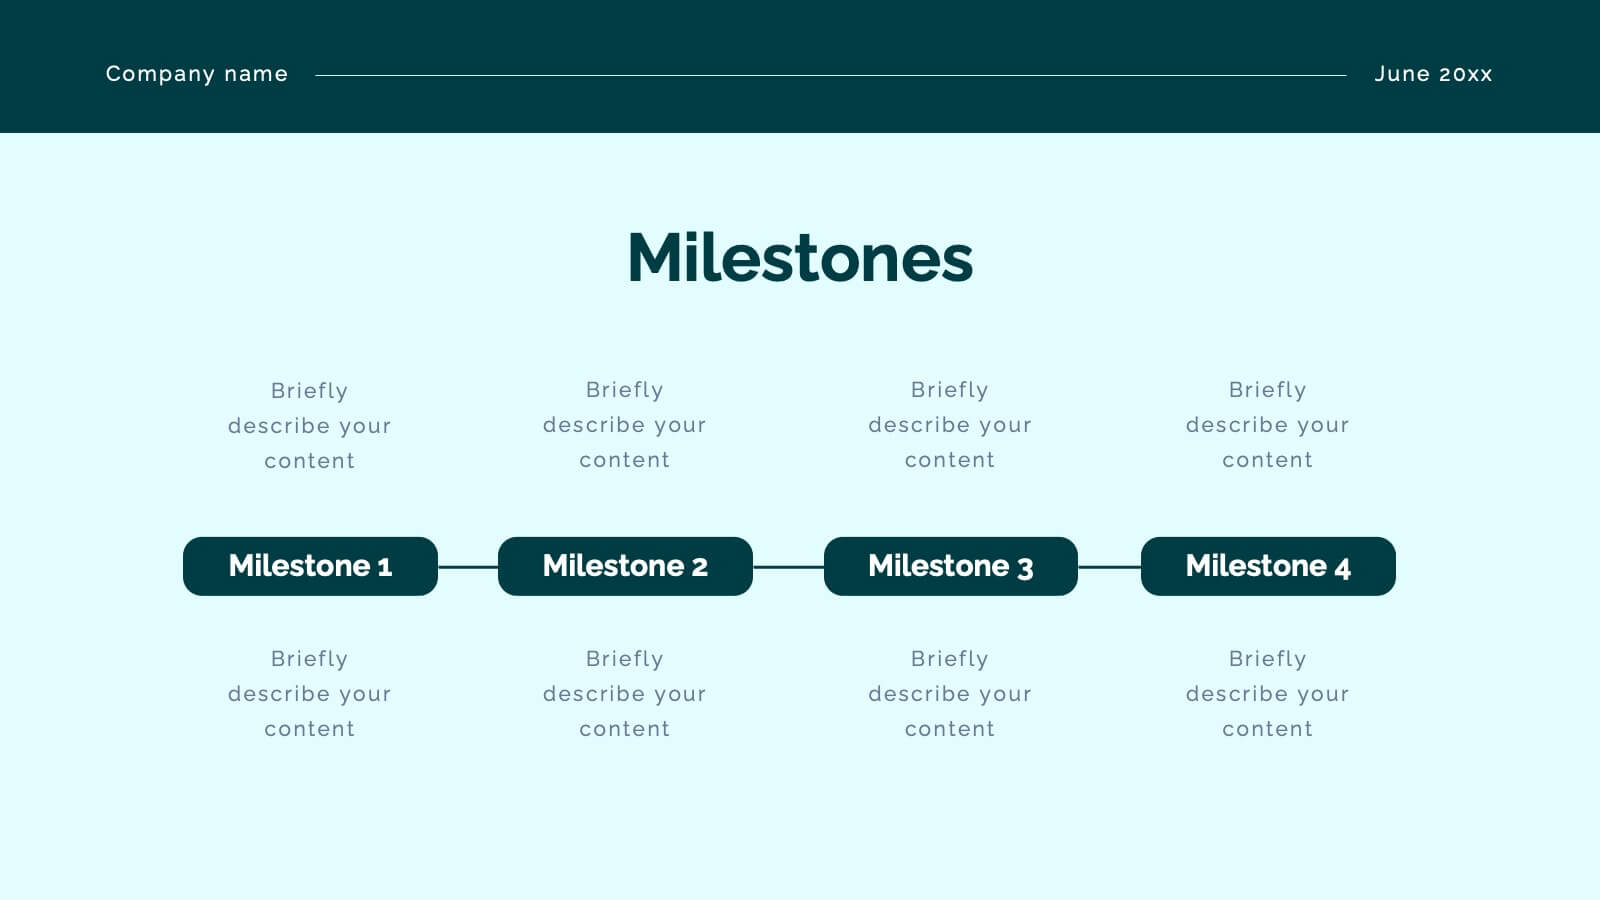
Solarae Investor Pitch Presentation
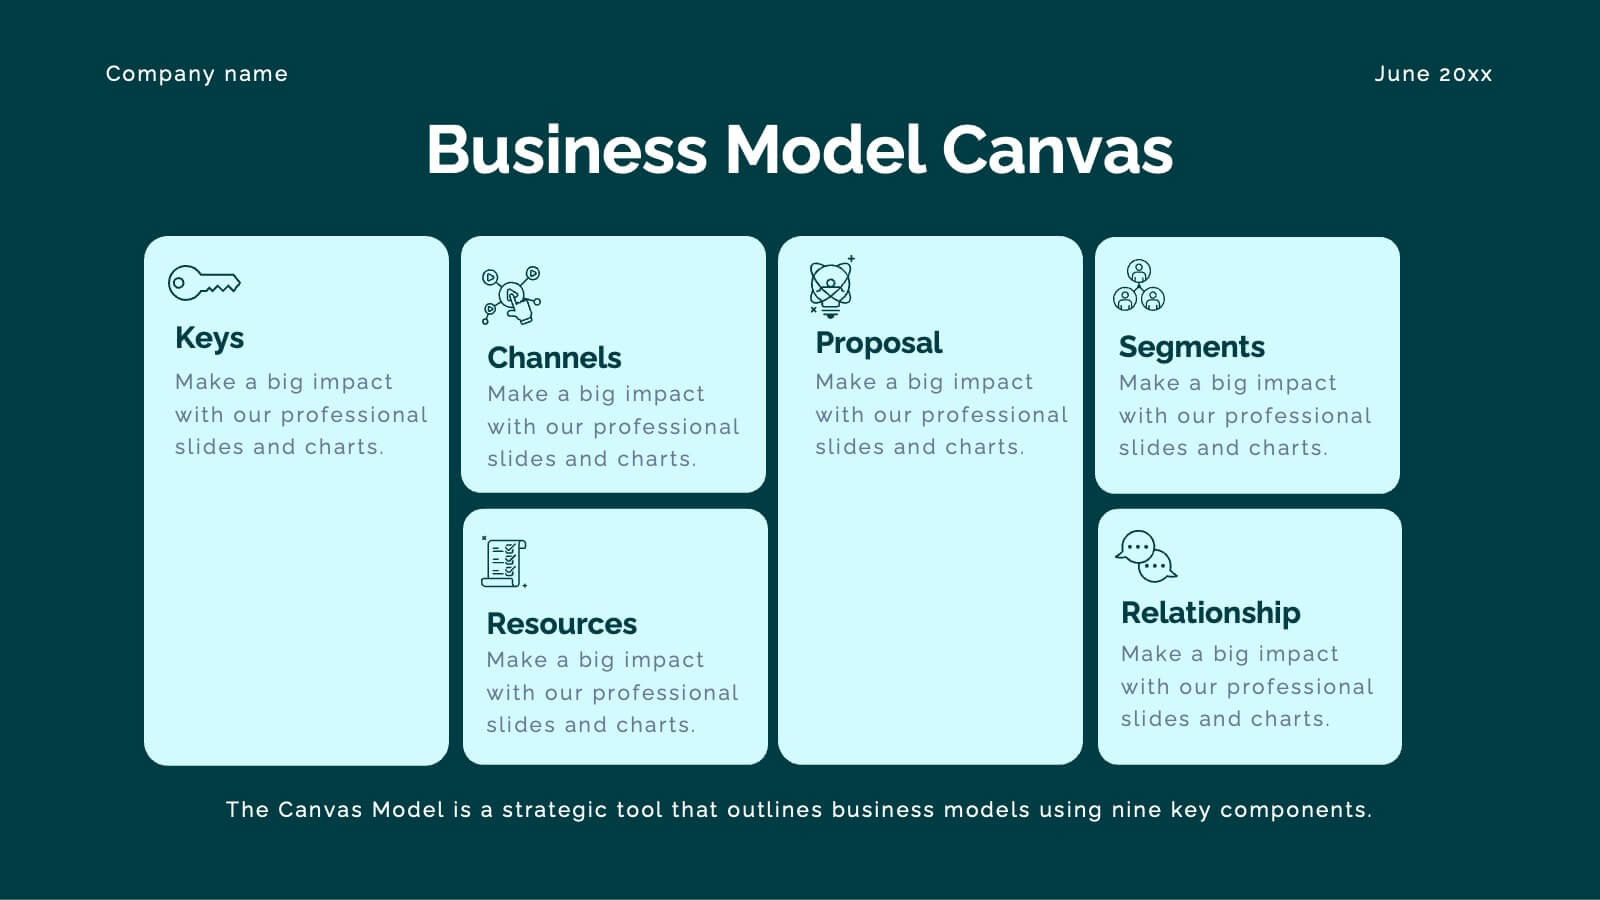
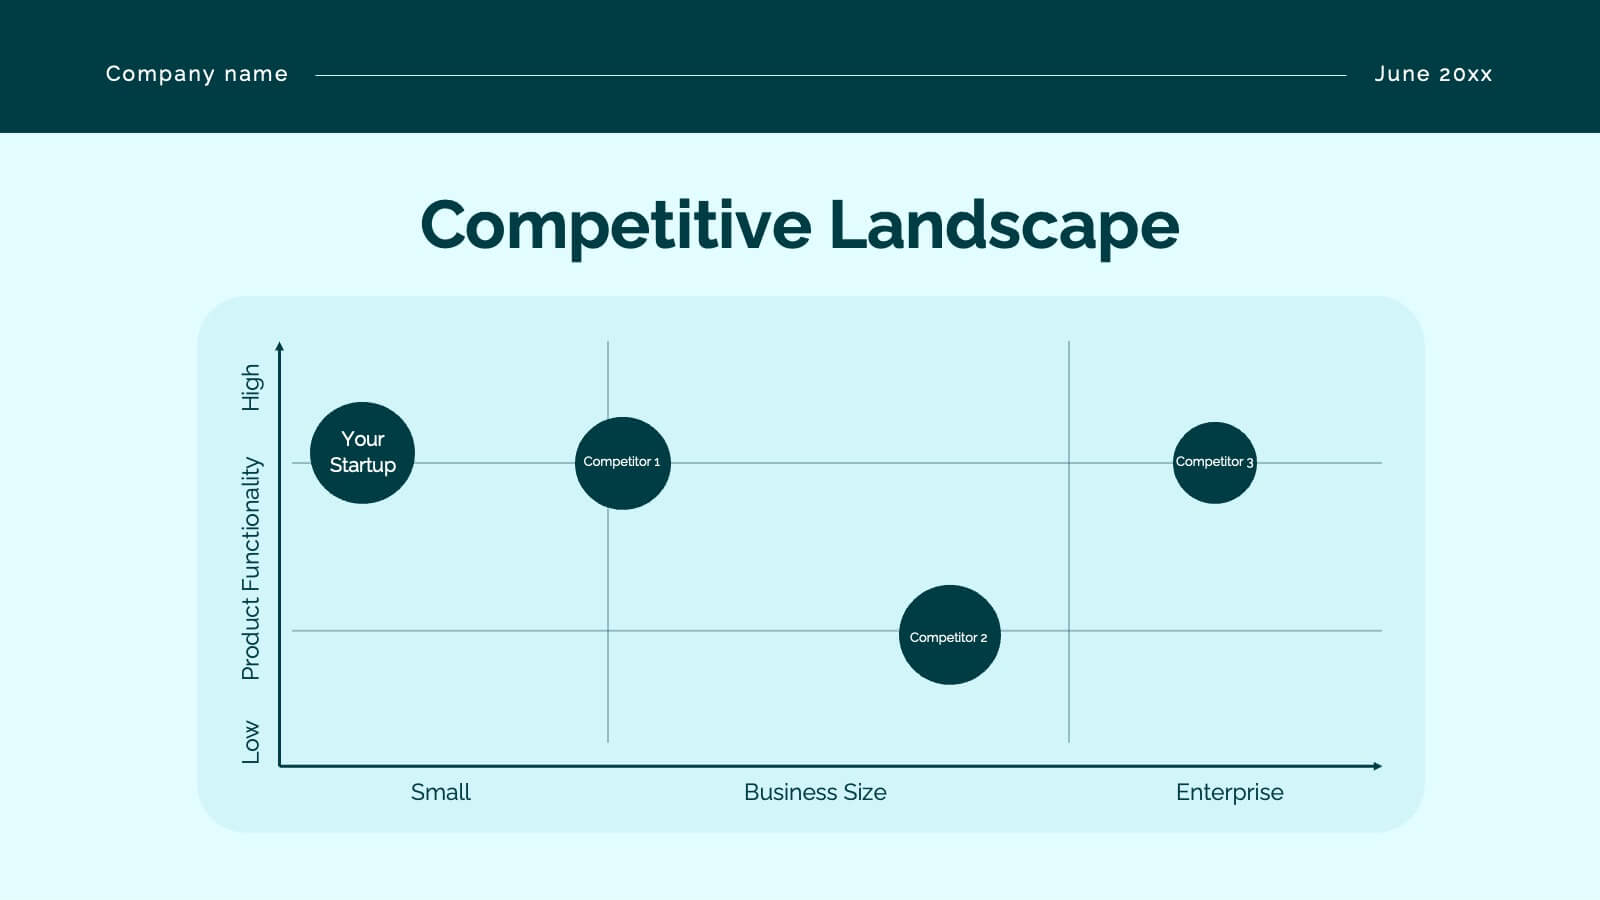
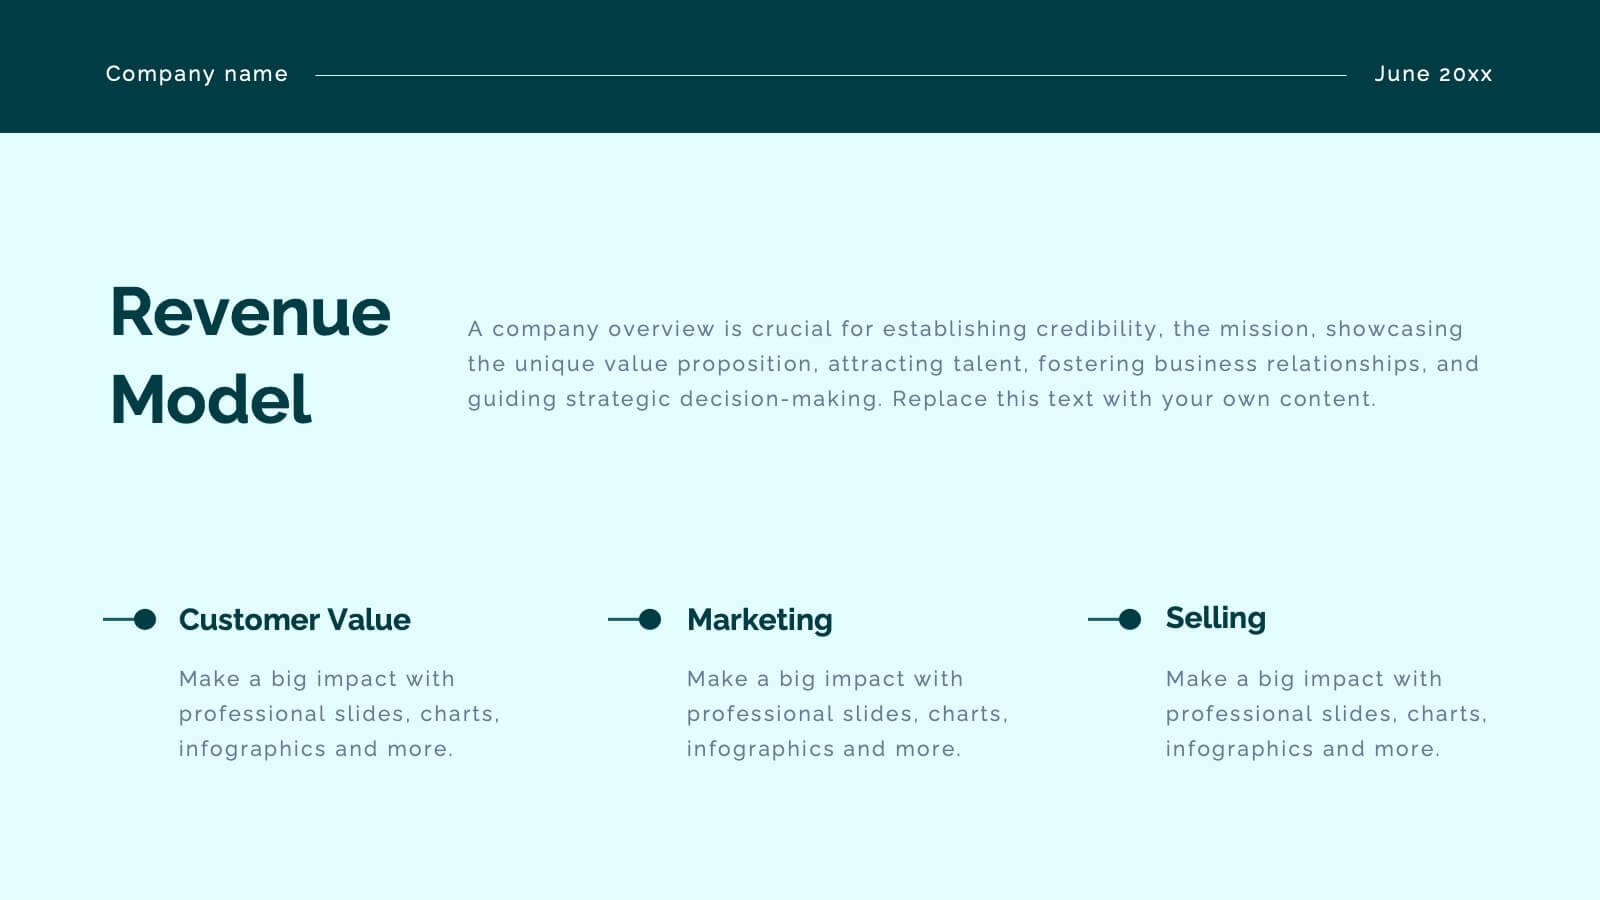
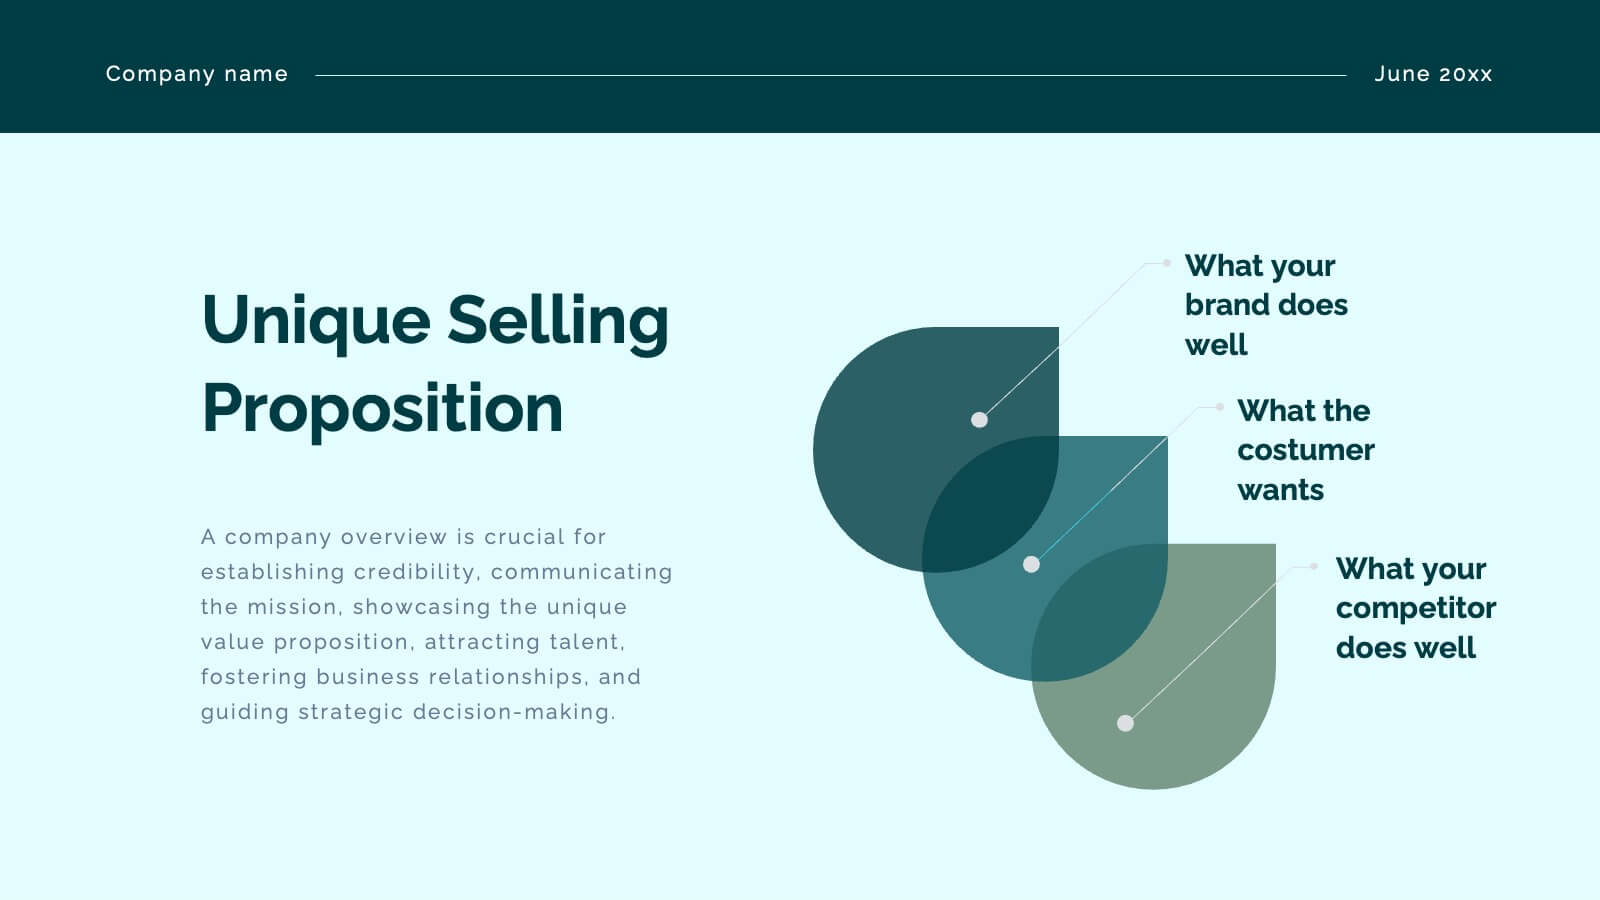
This Investor Pitch Deck Presentation is designed to impress potential investors with a modern, professional layout. Covering key topics like company overview, financials, competitive landscape, and milestones, it's fully customizable and easy to edit in PowerPoint, Keynote, and Google Slides. Perfect for startups seeking funding opportunities.


7 slides
PESTEL Chart Infographic Presentation
A PESTEL Chart is a strategic planning tool used to analyze and identify the key external factors that could affect an organization's performance and its ability to achieve its objectives. Create epic pestel charts in no time using this template. All you need to do is enter your data and the template will do the rest. Use this template as an introduction to your most important points. It is completely editable change the fonts, sizes and shapes and it can be used for any type of business or academic project. This template is available in PowerPoint, Keynote and Google Slides formats.


7 slides
Creative Tree Diagram Infographic
Unveil hierarchical structures or processes with our evocative tree diagram infographic. Set against a pristine white canvas and enriched with shades of trusty blue and organic green, this creative template epitomizes growth, interconnections, and systematic understanding. Embellished with crisp infographics, intuitive icons, and illustrative image placeholders, it effortlessly visualizes layered information. Perfectly tailored for Powerpoint, Keynote, or Google Slides. An indispensable resource for project managers, educators, business analysts, or any organization aiming to display branching information or decisions. Grow with clarity; let each slide branch out into a wealth of understanding.


8 slides
User-Centered Design with Empathy Map
Step into your user's shoes—literally. This engaging empathy map slide helps you visualize user behavior, thoughts, emotions, and needs in one clean layout. Ideal for UX strategies, product development, or customer journey sessions. Fully editable and works seamlessly with PowerPoint, Keynote, and Google Slides.


7 slides
Budget Forecasting Spreadsheet Infographic
Step into the strategic realm of budget forecasting with our detailed infographic. Cast in the reliability of blue, the vibrancy of orange, and the optimism of yellow, our template is a beacon of financial foresight. Equipped with precise infographics, intuitive icons, and adaptable image placeholders, it transforms financial data into a predictive narrative. Flawlessly tailored for Powerpoint, Keynote, or Google Slides. An essential tool for financial analysts, business strategists, accountants, or any professional navigating the future financial terrains of their organization. Forecast with confidence; let every slide be a roadmap to financial prudence.


6 slides
Stock Market Trends and Charts Presentation
Turn financial data into a story that’s easy to follow with this clean, professional layout designed to highlight market growth, patterns, and investment insights. Ideal for analysts and educators, it combines charts with sleek visuals. Fully compatible with PowerPoint, Keynote, and Google Slides for effortless customization.


7 slides
KPI Software Dashboard Infographic
Maximize the effectiveness of your performance analysis with our KPI Software Dashboard infographic, optimized for use in Powerpoint, Keynote, and Google Slides. This dynamic infographic is an indispensable tool for business analysts, project managers, and data-driven professionals seeking to present key performance indicators (KPIs) in an insightful and engaging manner. Our KPI Software Dashboard infographic offers a clear, visual representation of critical data points that influence business decisions. With its diverse array of charts, graphs, and meters, it provides an at-a-glance overview of company performance across various metrics. The design is tailored to enhance readability and comprehension, allowing your audience to quickly grasp complex data trends and patterns. Whether you're reviewing sales figures, monitoring customer satisfaction, or tracking project progress, this infographic is designed to streamline the presentation of your data. The compatibility with popular presentation platforms ensures a smooth integration into your slide deck, making it a breeze to communicate the insights that matter. Utilize this infographic to turn your KPI data into compelling narratives that drive strategic business actions.

23 slides
Crest Investor Pitch Presentation Presentation
Unleash your potential with this powerful pitch deck template! Tailored for presenting innovative business ideas, it features slides for company overview, market opportunity, competitive landscape, and financial projections. Clearly communicate your value proposition and impress investors with professional design and concise content. Compatible with PowerPoint, Keynote, and Google Slides for seamless presentations on any platform.


8 slides
Pet Care and Veterinary Clinic Business Presentation
Highlight your clinic’s services with this engaging, paw-themed slide featuring a veterinarian illustration and four colorful pawprints. Perfect for pet care presentations, animal health pitches, or client brochures. Fully editable in PowerPoint, Keynote, or Google Slides for easy customization.


7 slides
Union Venn Diagram Infographic
Venn Diagrams are a great way to display your data in an organized, aesthetically pleasing way. This infographic template is perfect for any presentation that requires a Venn Diagram. This template is designed to visually demonstrate the impact of your company's efforts. Use this to show how different teams work to achieve goals, or how different departments work together to create something new. Compatible with Powerpoint, Keynote, and Google Slides. This infographic uses a cool, bold color scheme and fun imagery to show the relationship between two or more sets of data in a way that will help you easily explain it to your target audience.


6 slides
Eco-Conscious Business Practice Overview Presentation
Communicate your sustainability initiatives with the Eco-Conscious Business Practice Overview Presentation. This modern infographic template features a 5-part petal leaf layout to display eco-friendly actions, green goals, or corporate values. Ideal for environmental reports, ESG updates, or internal awareness decks. Fully editable in Canva, PowerPoint, Keynote, and Google Slides.


8 slides
Target Audience Segmentation Strategy Presentation
Refine your marketing approach with the Target Audience Segmentation Strategy presentation. This professionally designed slide helps you identify, analyze, and visualize key audience segments to enhance your outreach. Perfect for marketers, business strategists, and data analysts, this editable template ensures a clear, data-driven approach to customer targeting. Compatible with PowerPoint, Keynote, and Google Slides.


6 slides
Event Planning Agenda Presentation
Organize every detail with the Event Planning Agenda Presentation. Featuring a 6-step layout styled like a calendar, this template clearly outlines each agenda point with vibrant blocks and icons for visual impact. Ideal for conferences, workshops, or launches. Fully editable in PowerPoint, Keynote, and Google Slides.