

Features
- 23 Unique Slides
- Fully editable and easy to edit in Microsoft Powerpoint, Keynote and Google Slides
- 16:9 widescreen layout
- Clean and professional designs
- Export to JPG, PDF or send by email


Do you have any questions?
Recommend


6 slides
Strategic PESTEL Presentation
Kickstart smarter strategy sessions with a clean, colorful layout that makes external factor analysis feel effortless. This presentation helps teams map trends, identify risks, and understand the broader environment shaping business decisions. Clear visuals keep insights organized and actionable. Fully compatible with PowerPoint, Keynote, and Google Slides.


20 slides
Odyssey Marketing Proposal Presentation
Pitch your ideas confidently with this modern and visually striking marketing proposal presentation template. Featuring sections for project summary, goals, timeline, budget breakdown, and team expertise, it’s designed to engage and inform stakeholders. Fully compatible with PowerPoint, Keynote, and Google Slides for a seamless presentation experience.


4 slides
Products Comparison Table Presentation
Make your decision-making story instantly clear with a bold visual that balances options in a clean, modern way. This presentation helps you compare features, weigh benefits, and highlight key differences using simple graphics and intuitive labeling. Fully compatible with PowerPoint, Keynote, and Google Slides.


23 slides
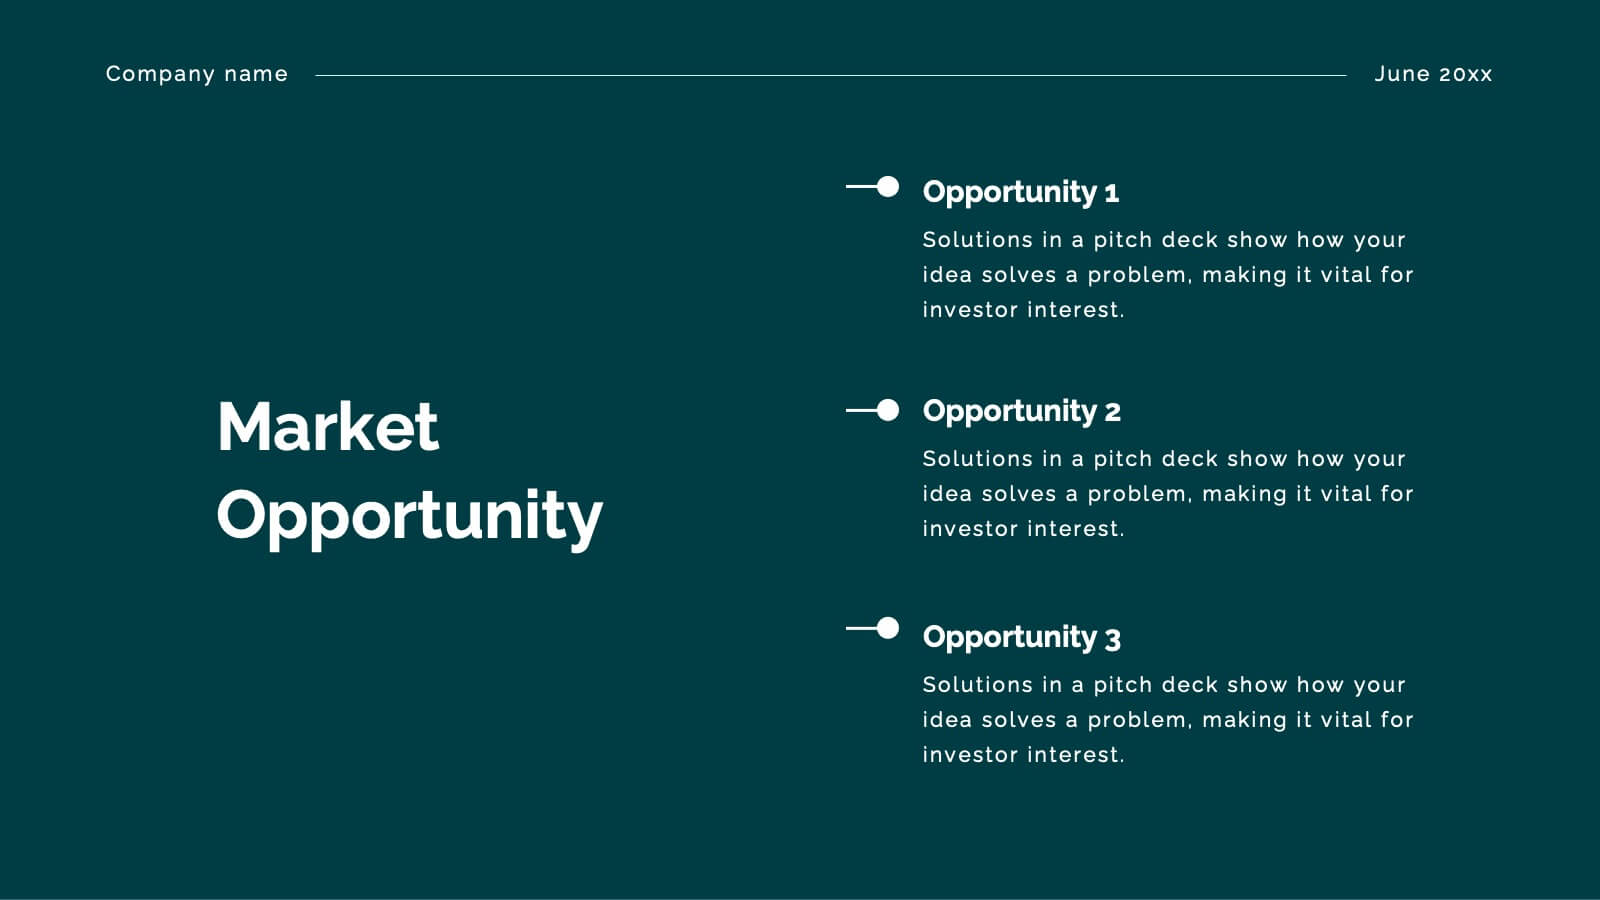
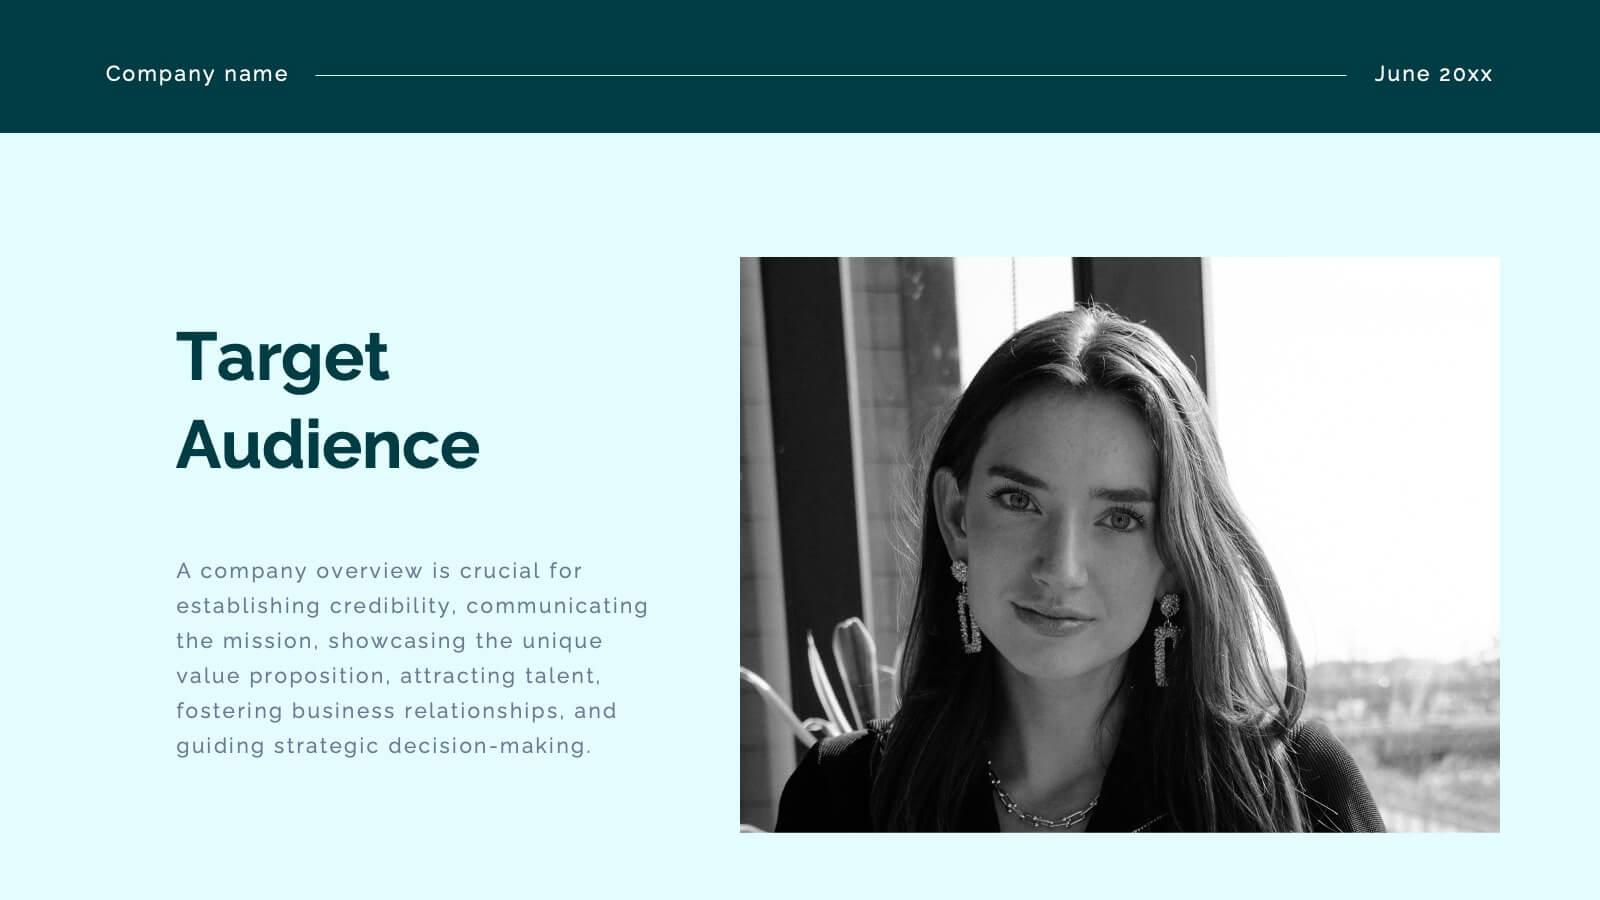
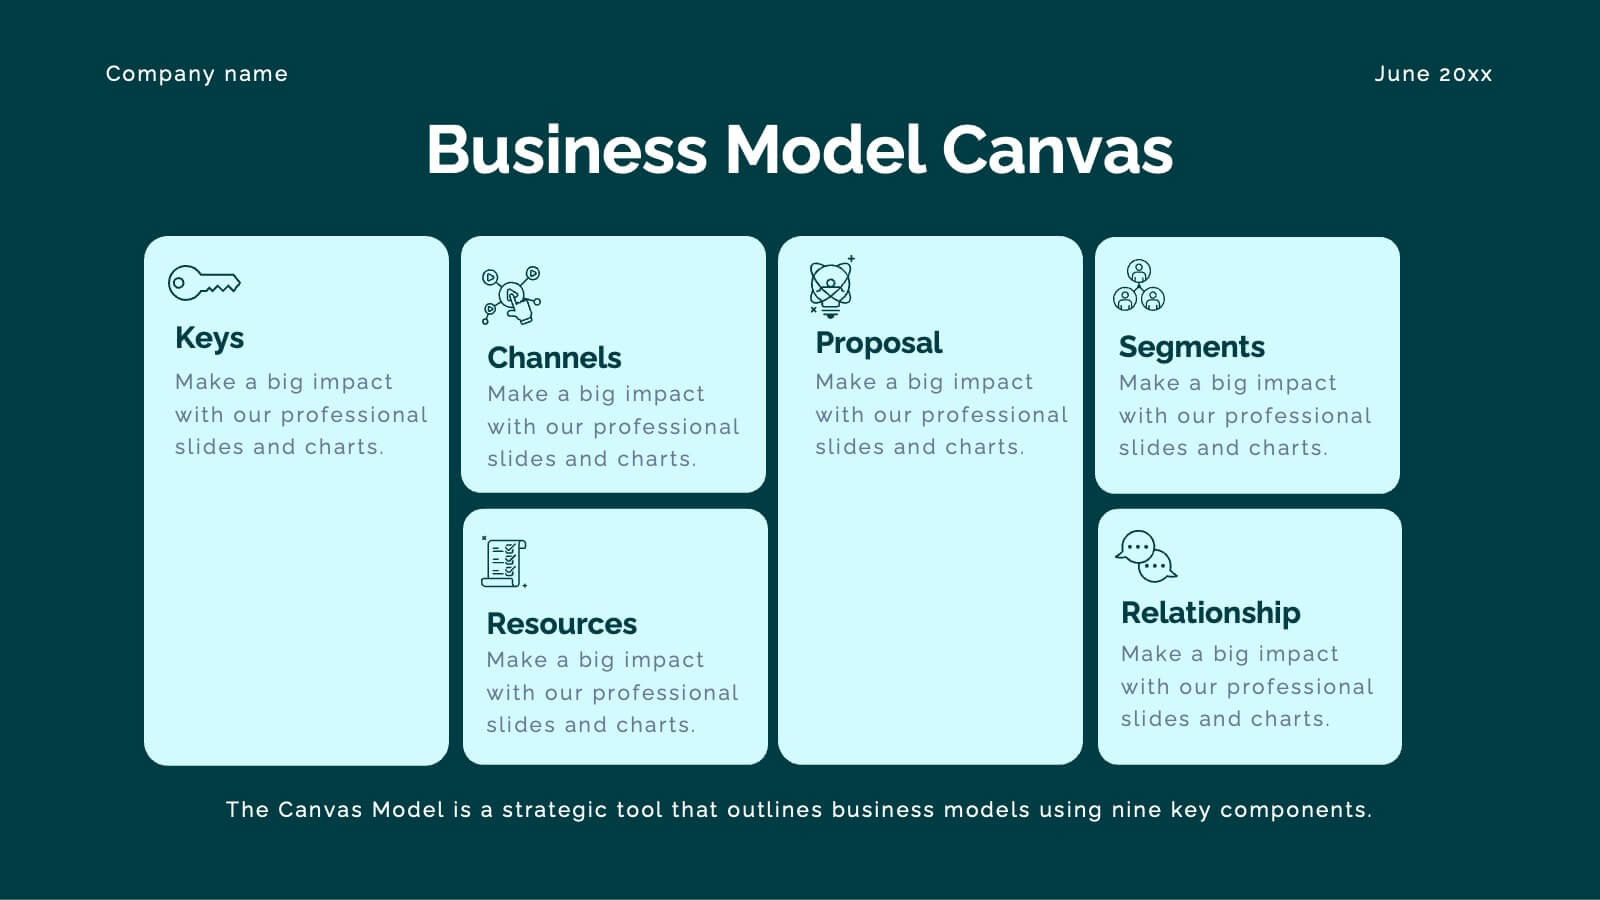
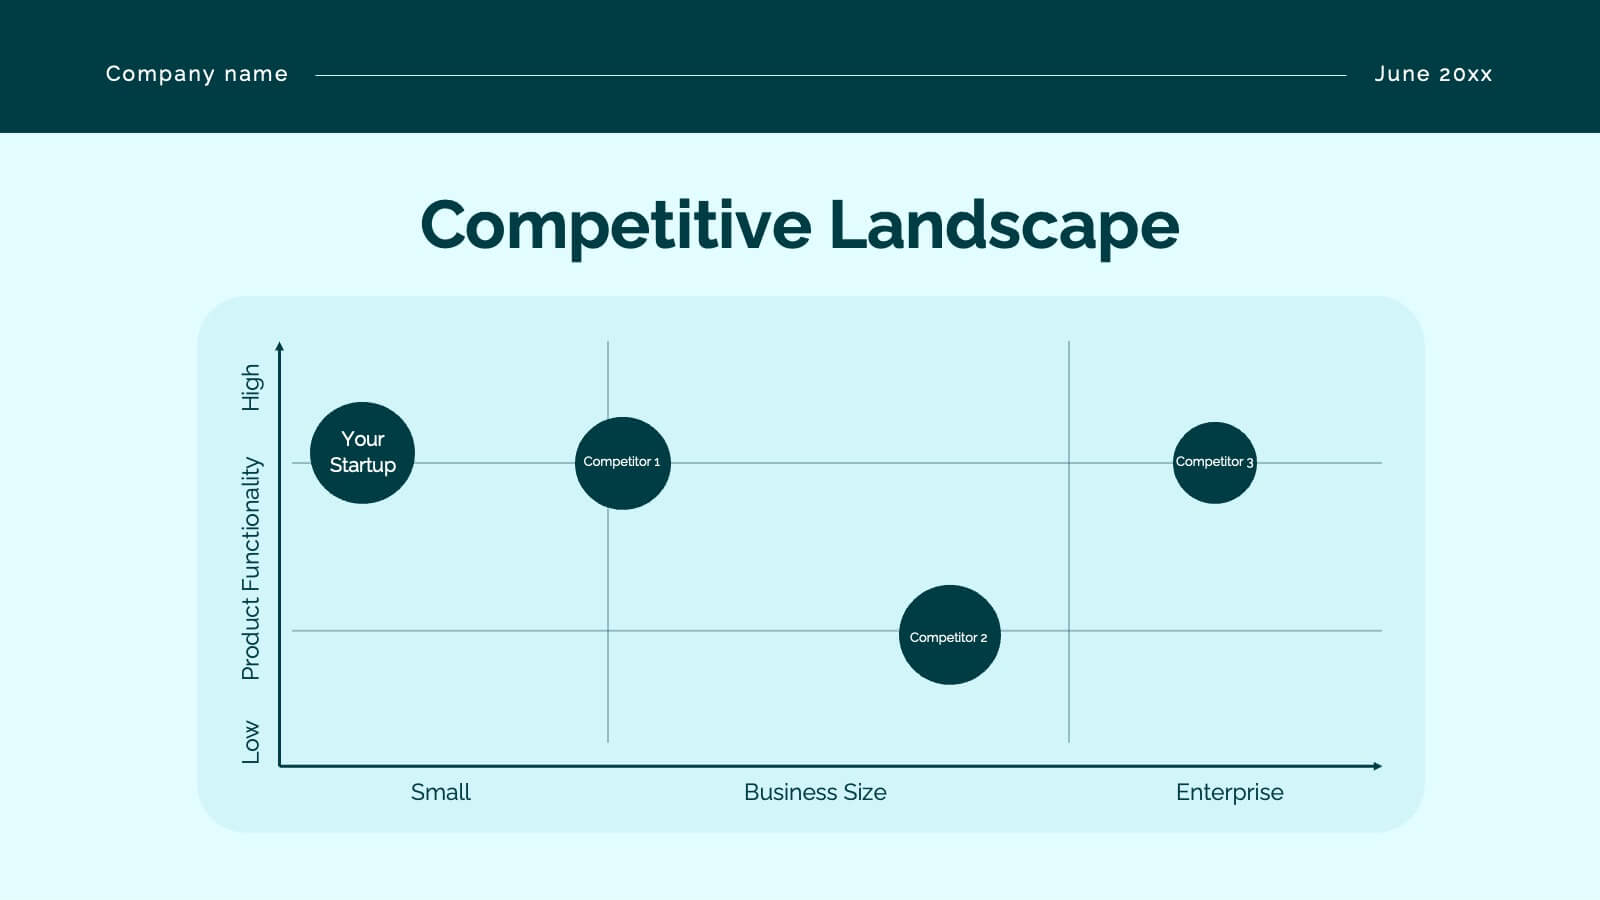
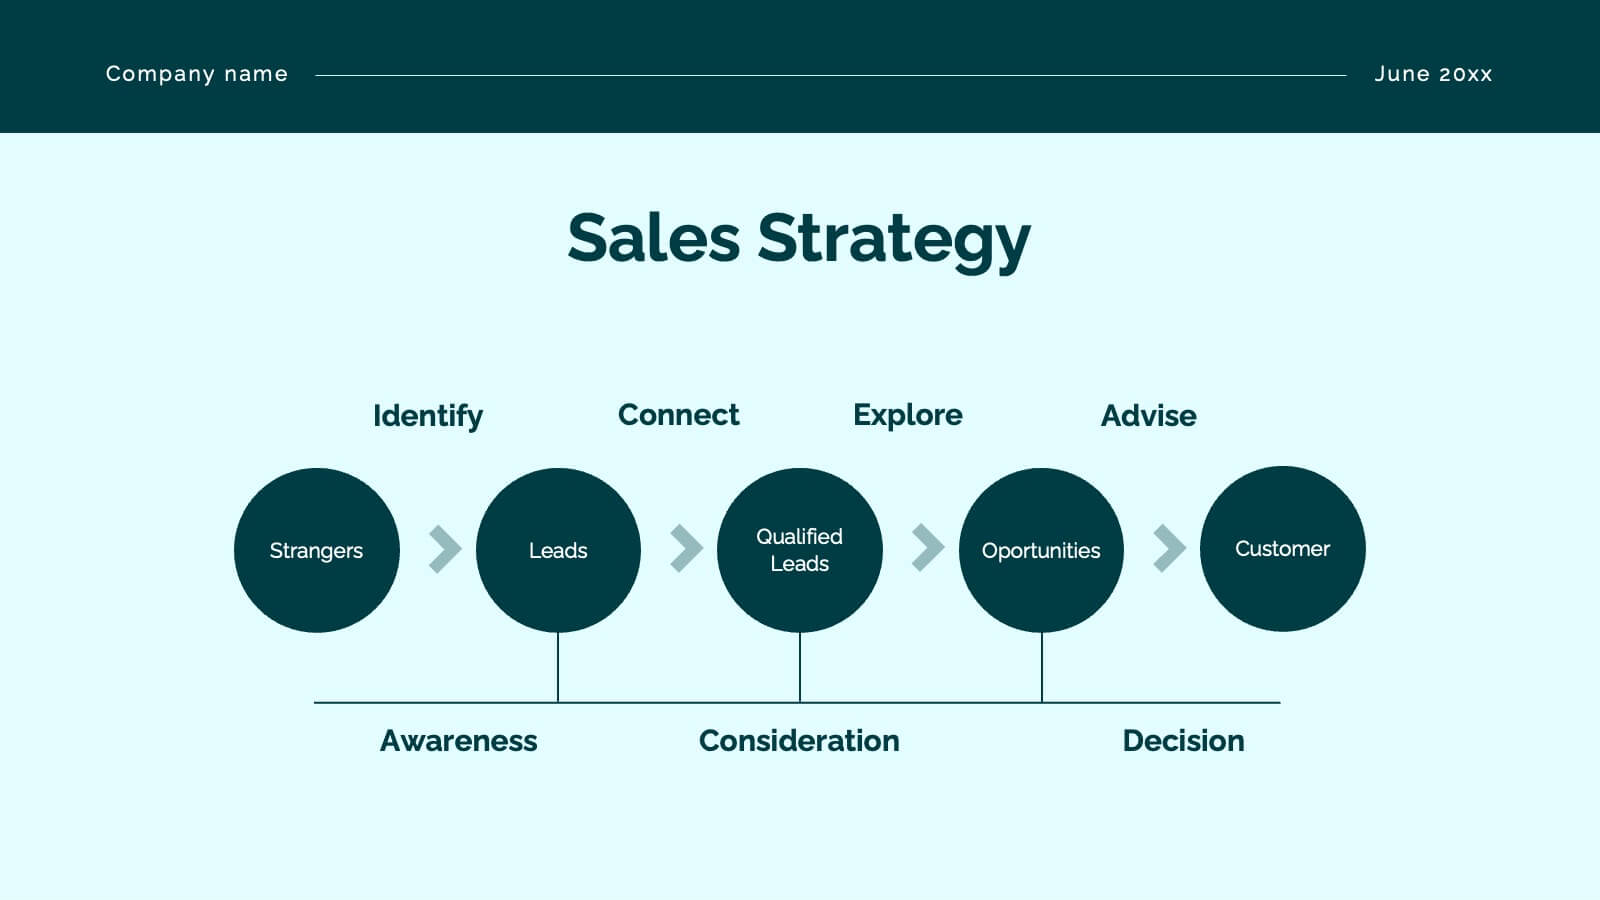
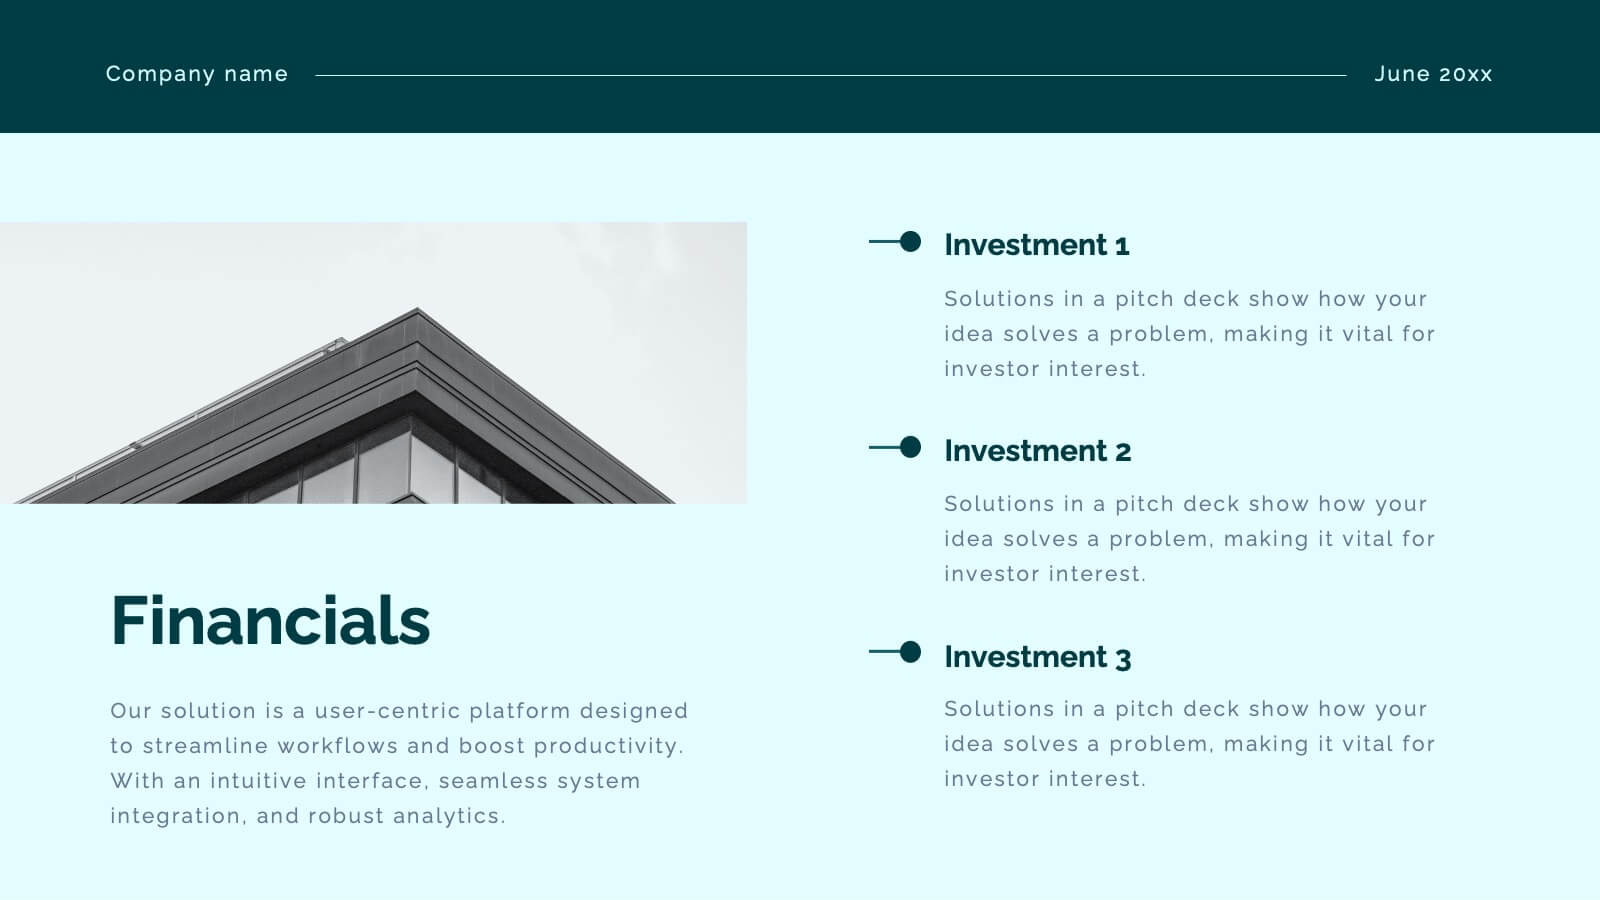
Dragonveil Product Launch Pitch Deck Presentation
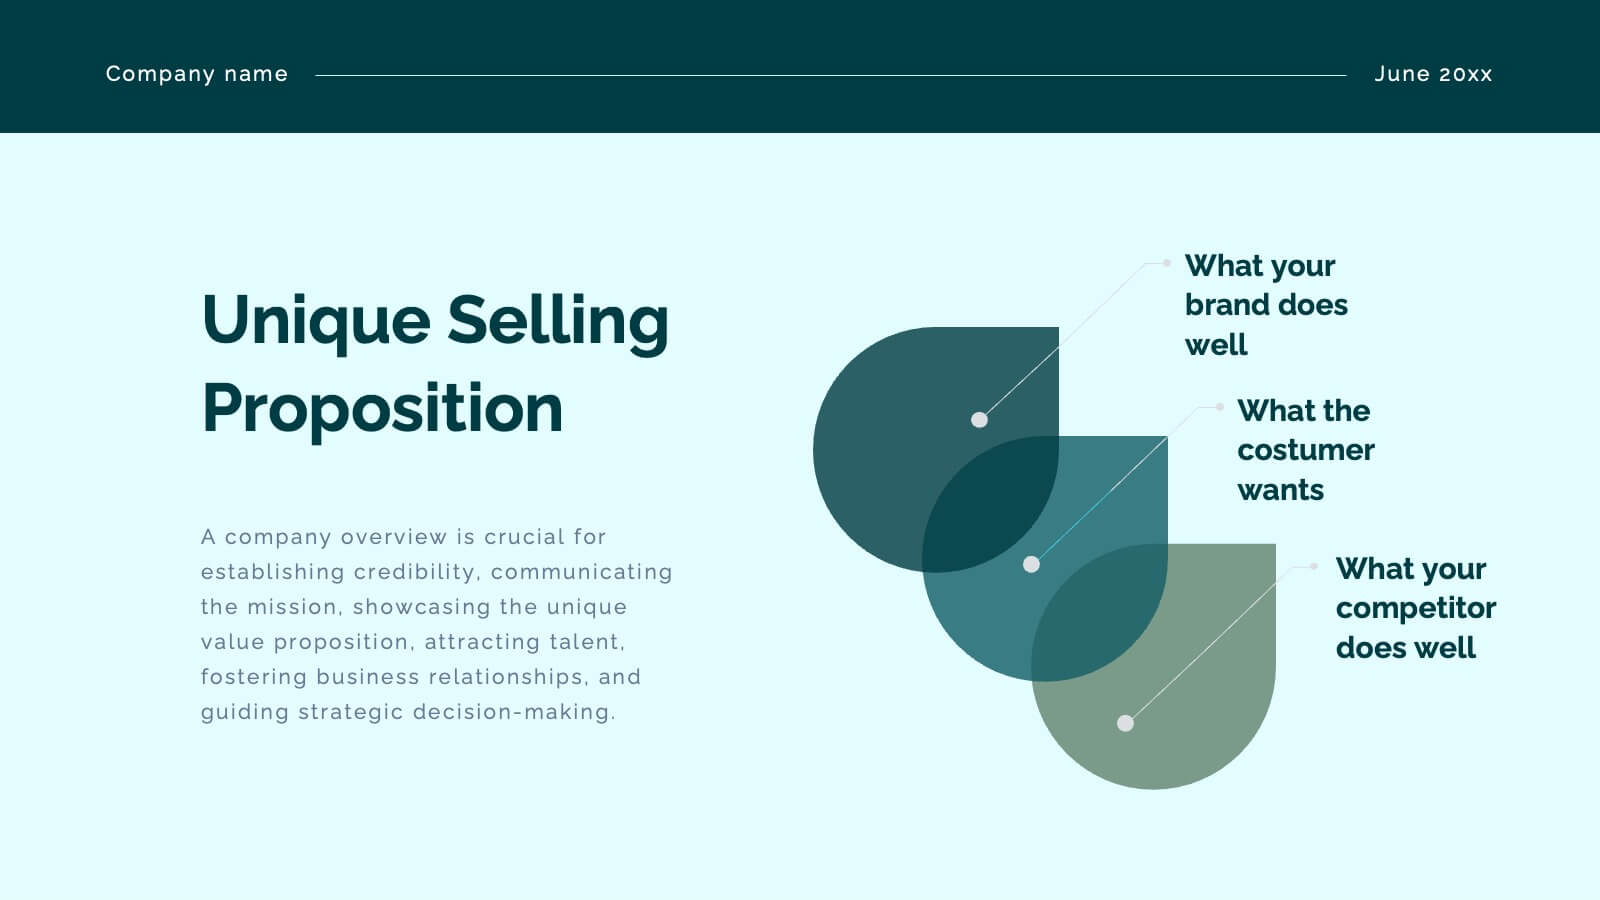
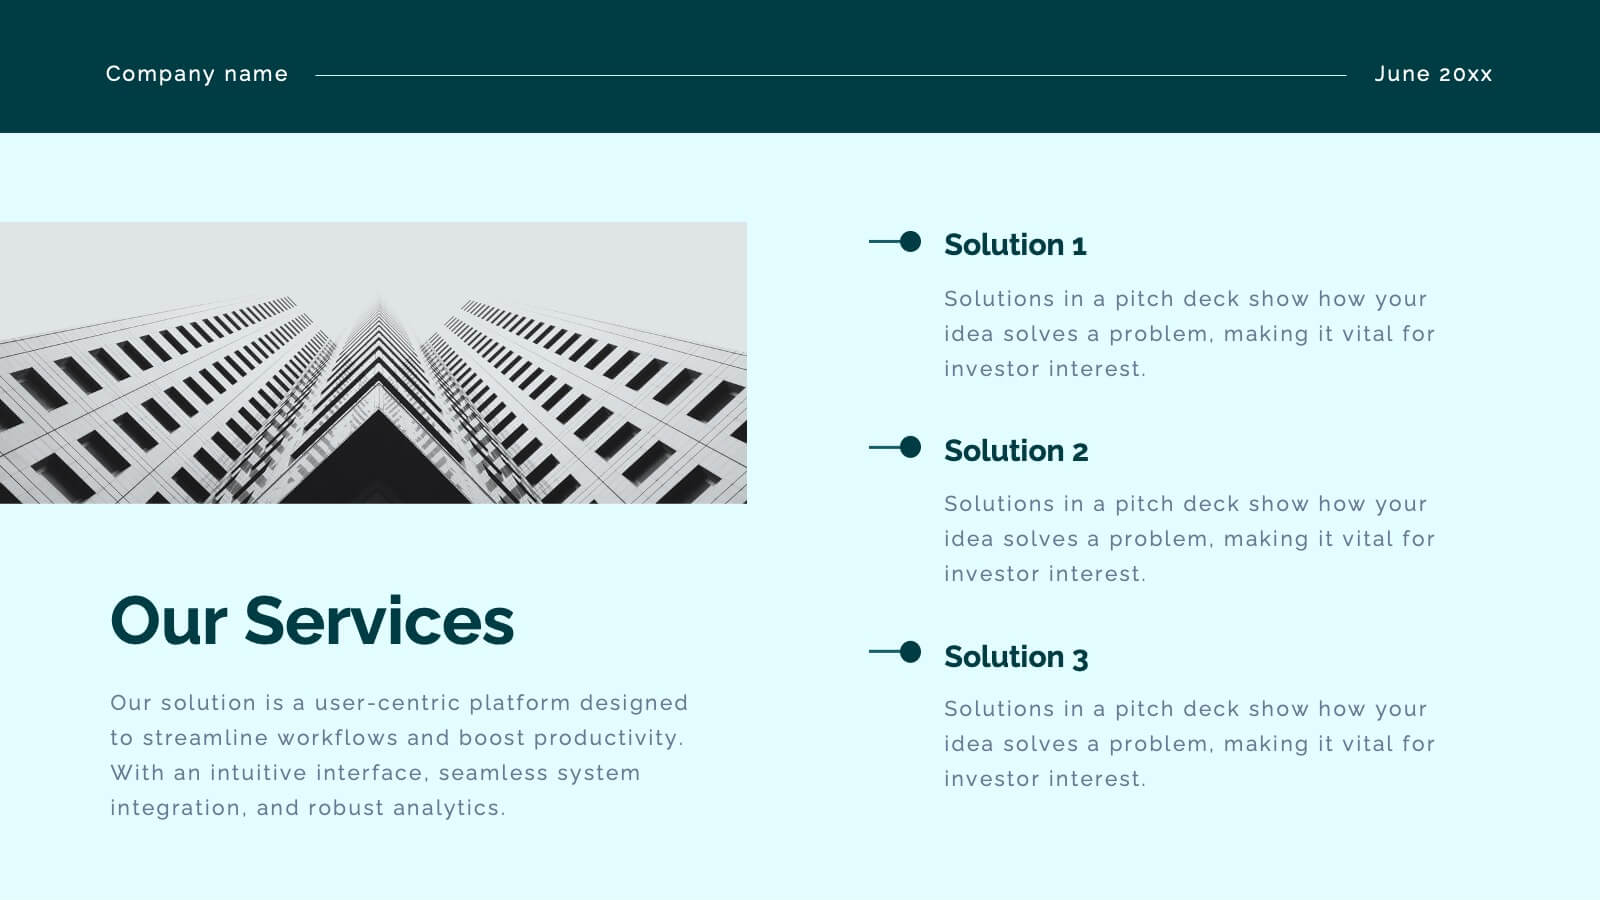
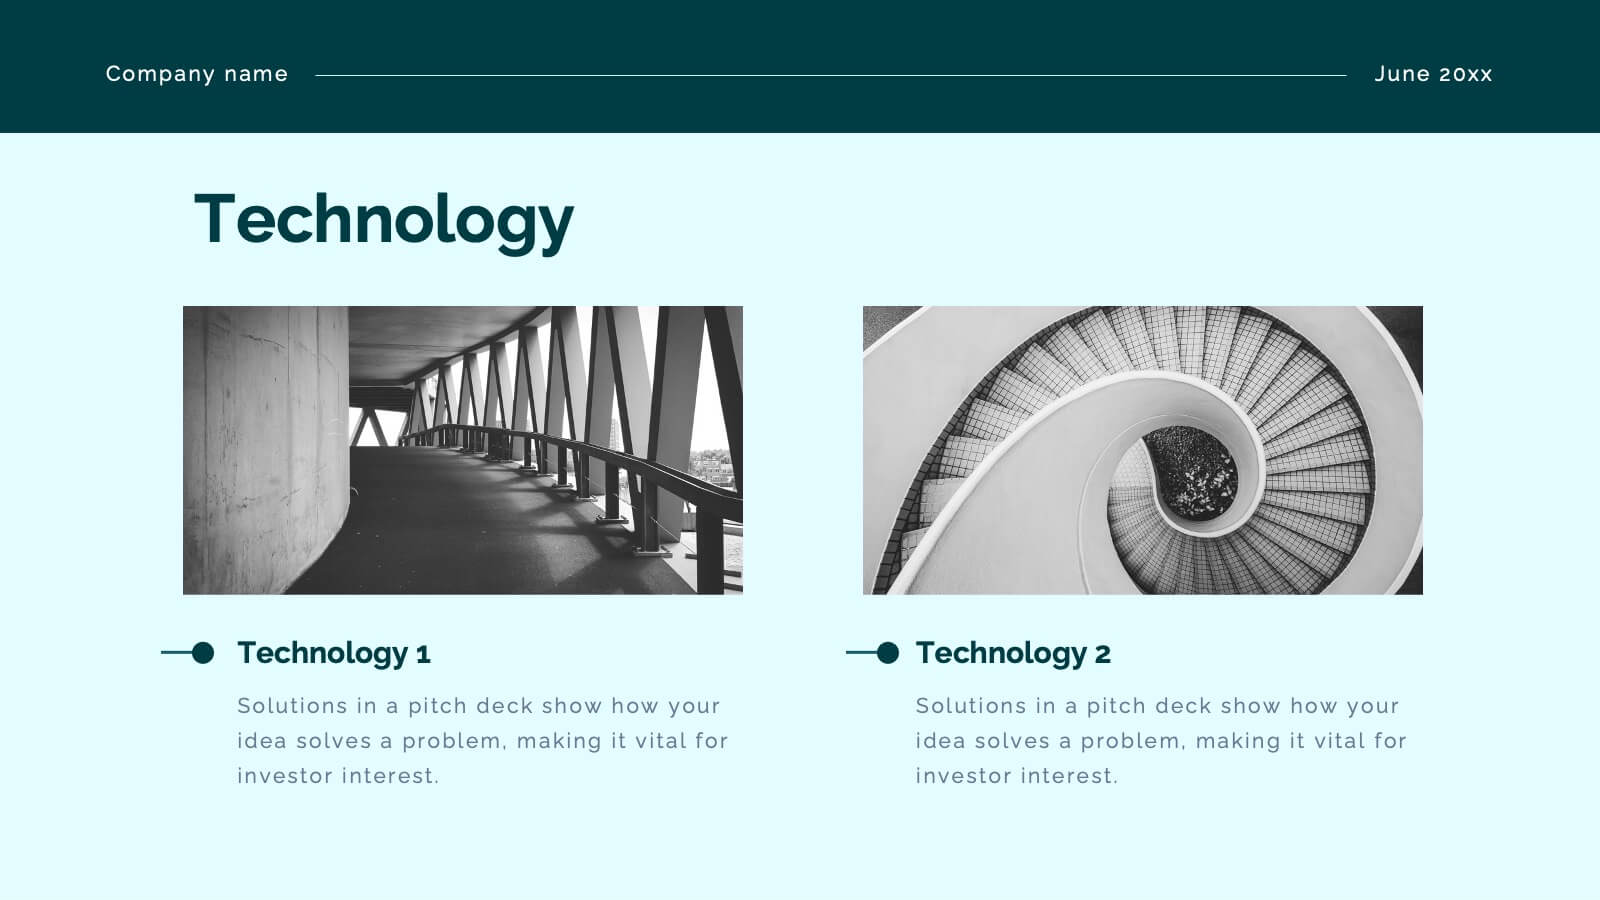
The Product Launch Pitch Deck Presentation Template features 23 fully customizable slides designed to outline key aspects such as market opportunity, revenue model, and sales strategy. Ideal for startups and businesses launching new products, it ensures a compelling pitch. Compatible with PowerPoint, Keynote, and Google Slides.


6 slides
Demographic Trends and Audience Breakdown Presentation
Visualize key audience segments and population trends with this modern demographic breakdown slide. Featuring a clean circular chart layout, it's perfect for showcasing age, gender, location, or behavioral data. Ideal for marketing, branding, or user research reports, it turns complex demographics into clear, impactful insights for strategic planning and targeting.


21 slides
Karma Design Portfolio Presentation
Step into the spotlight with this bold and contemporary design portfolio! It presents your creative work in a sleek, visually striking format. From featured projects to your creative process and collaborations, this portfolio will leave a lasting impression. Perfect for showcasing your design style on PowerPoint, Keynote, or Google Slides!


21 slides
Solara Business Strategy Presentation
Craft a winning plan with this comprehensive business strategy presentation! It covers essential sections like market analysis, SWOT, strategic initiatives, and performance metrics, helping you align goals and opportunities. Perfect for executive meetings or stakeholder reviews, this template ensures seamless collaboration. Fully compatible with PowerPoint, Keynote, and Google Slides.


10 slides
Risk Management Plan Presentation
The "Risk Management Plan Presentation" template is designed to outline strategic steps for identifying, assessing, managing, and monitoring business risks. Each segment of the plan is clearly labeled and represented on a segmented wheel, with A identifying risks, B assessing them, C managing responses, and D monitoring and reporting outcomes. The clean and straightforward design ensures key risk management strategies are communicated effectively to stakeholders. This visual tool is perfect for business meetings or training sessions, helping teams understand their roles in mitigating risks and ensuring that the business maintains a proactive approach to challenges.


20 slides
Unity New Product Proposal Presentation
Unveil your product strategy with this modern, comprehensive template! Highlight your company overview, product features, and unique selling proposition. Perfect for presenting market analysis, pricing strategy, and technical specifications. Ideal for product managers and developers. Compatible with PowerPoint, Keynote, and Google Slides.


4 slides
4-Quadrant Empathy Map Presentation
Dive into your audience’s mindset with a clean, structured layout that brings clarity to what they see, feel, hear, and do. This presentation helps teams understand user behavior and motivations with simple quadrant-based insights. Fully compatible with PowerPoint, Keynote, and Google Slides.


5 slides
5 Types of Credit Cards Explained Presentation
Unlock the world of smarter spending with this clear, engaging layout designed to break down different credit card types in a simple, visual way. It helps you present features, benefits, and key distinctions with ease, making financial concepts easy to understand. Fully editable and compatible with PowerPoint, Keynote, and Google Slides.


4 slides
Butterfly Comparison Chart Presentation
Bring clarity to your comparisons with a sleek, balanced design that highlights both sides of your data. This presentation is perfect for showing pros and cons, alternatives, or performance metrics in a visually engaging way. Fully customizable and compatible with PowerPoint, Keynote, and Google Slides.


21 slides
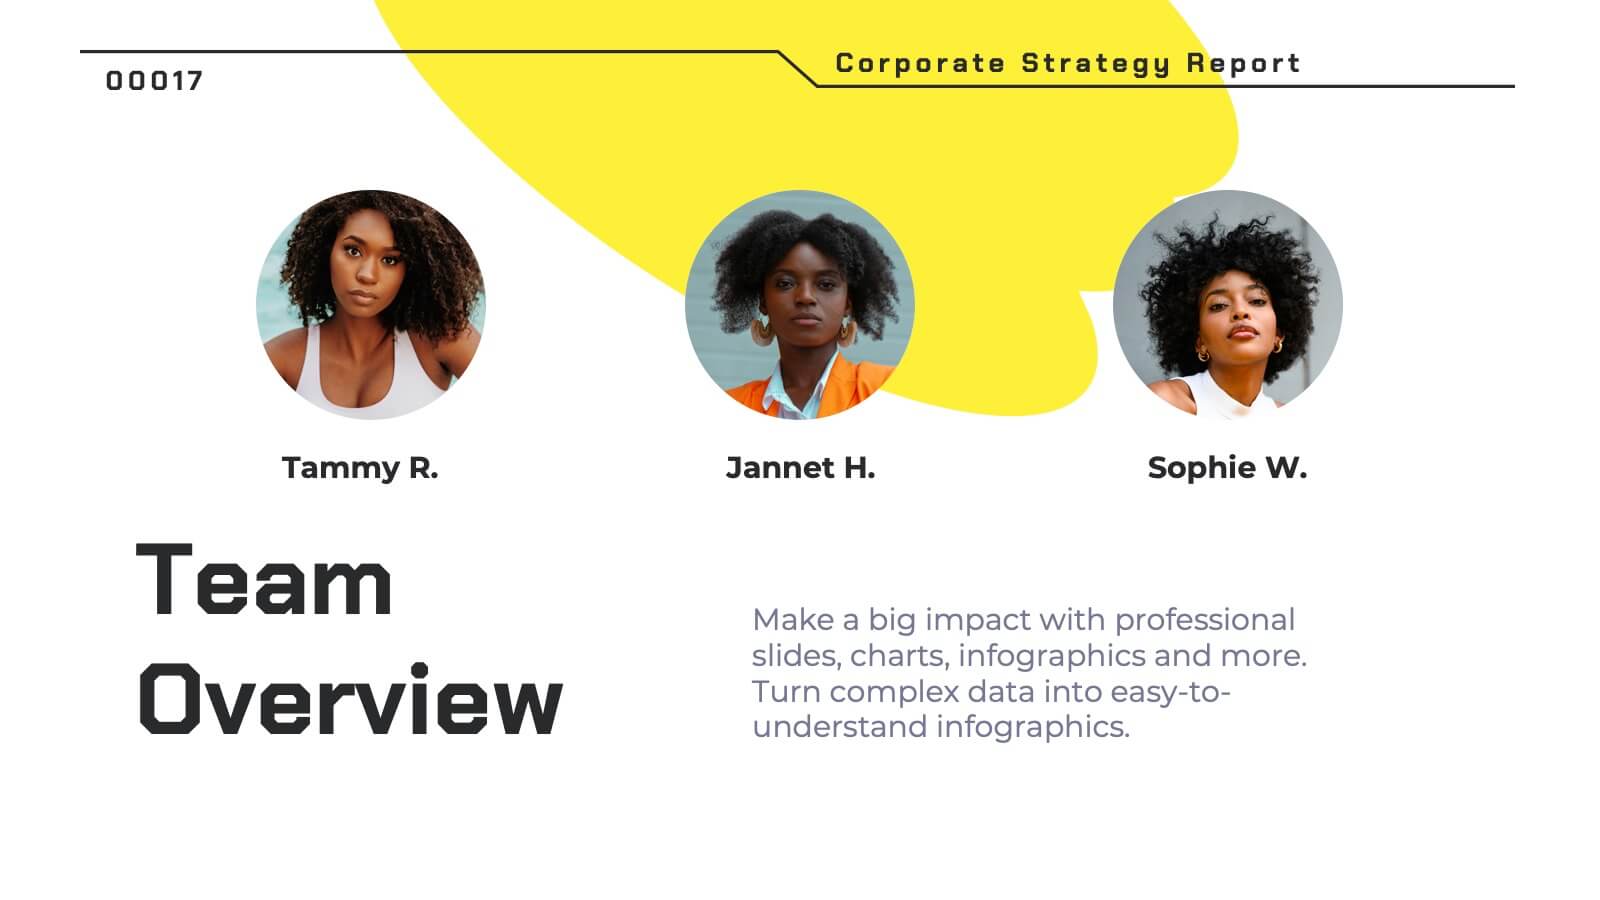
Pyronova Corporate Strategy Report Presentation
This professional corporate strategy template includes slides for market opportunity, SWOT analysis, objectives, marketing plan, revenue model, and competitive analysis. Designed for impactful presentations, it highlights financial performance, investment opportunities, and operational plans. Fully customizable in PowerPoint, Keynote, and Google Slides to suit diverse business needs.


6 slides
RAPID Roles and Responsibilities Slide Presentation
Make teamwork crystal clear with a structured chart that defines who does what and when. This organized layout helps map decision-making roles, streamline collaboration, and prevent confusion in complex projects. Easy to edit and ready to use, it’s fully compatible with PowerPoint, Keynote, and Google Slides for smooth customization.


7 slides
Idea Clustering Mind Map Presentation
Great ideas become clearer when you can see how everything connects, and this presentation makes that process effortless. It helps you organize thoughts, group related concepts, and visually map creative themes for planning or strategy discussions. Clean, modern, and easy to customize. Fully compatible with PowerPoint, Keynote, and Google Slides.


20 slides
Elementra Marketing Proposal Presentation
Elevate your marketing initiatives with this professional and well-structured proposal template. Covering essential sections such as objectives, goals, budget breakdown, timeline, and pricing structure, this presentation helps you effectively communicate your strategy to stakeholders and clients. Its clean, modern design ensures clarity and engagement, making it ideal for pitching ideas and securing approvals. Fully customizable and compatible with PowerPoint, Keynote, and Google Slides.


6 slides
Six Sigma DMAIC Method Presentation
Bring clarity and momentum to your improvement plan with this dynamic presentation, designed to visually guide teams through each stage of a structured problem-solving process. It helps you present goals, insights, and actions with confidence while keeping the workflow clear and engaging. Fully compatible with PowerPoint, Keynote, and Google Slides.