


Features
- 5 Unique slides
- Fully editable and easy to edit in Microsoft Powerpoint, Keynote and Google Slides
- 16:9 widescreen layout
- Clean and professional designs
- Export to JPG, PDF or send by email


Do you have any questions?
Recommend


7 slides
Modern Food Menu Presentation
Bring your ideas to the table with a clean and modern layout that turns any food-related content into an easy, visually appealing story. This presentation helps you showcase dishes, categories, or menu insights with clarity and style, making information simple to follow. Fully compatible with PowerPoint, Keynote, and Google Slides.


4 slides
Lab Research Data Analysis Layout Presentation
Present your scientific findings with clarity using this Lab Research Data Analysis Layout Template. Featuring molecular, lab flask, and data icons in a connected node design, it's ideal for researchers and analysts. Fully editable in PowerPoint, Keynote, and Google Slides, this clean layout ensures your data is both visual and professional.


21 slides
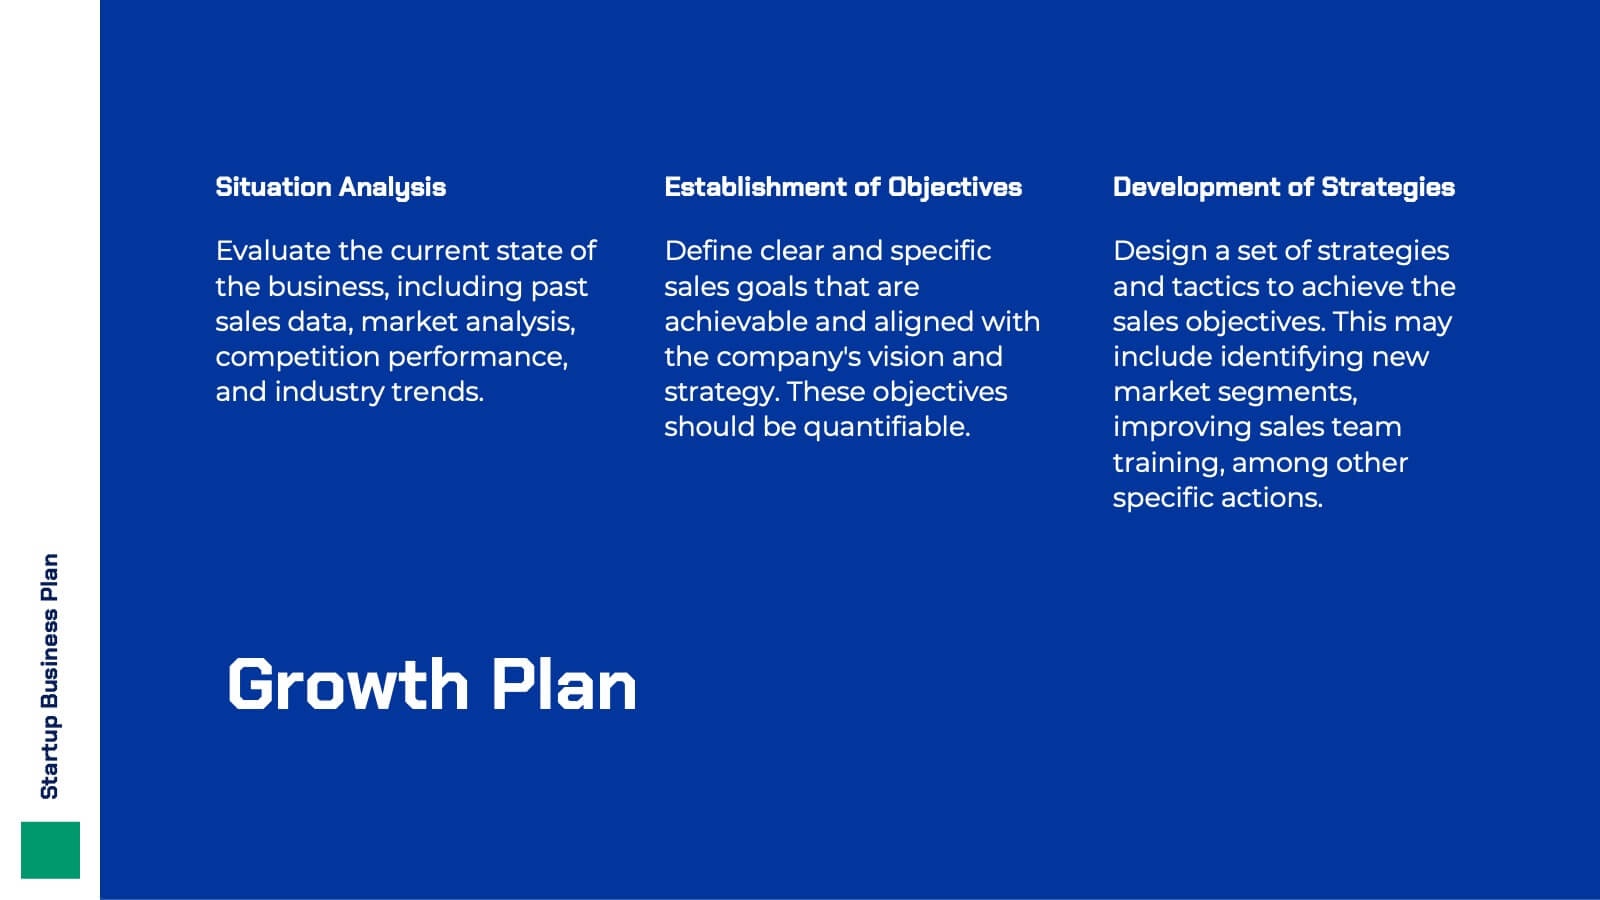
Hyperluma Startup Business Plan Presentation
Launch your vision with this startup business plan template, crafted to communicate your mission, market potential, and growth strategy with clarity and impact. Covering customer needs, unique value propositions, and financial projections, it’s ideal for entrepreneurs and founders. This template is compatible with PowerPoint, Keynote, and Google Slides, ready to fuel your startup’s journey.


7 slides
Vision Infographic
Elevate your presentations with our range of Slide Templates, tailored to showcase long-term objectives and strategies. These designs vary from simple and clean to bold and engaging, ensuring that every slide effectively communicates your forward-looking plans. Each template is crafted for easy customization to suit your brand's style, including areas for essential details, data representation, and motivational elements. They are perfect for aligning your team, engaging stakeholders, and promoting strategic discussions. Ideal for business presentations, team meetings, and motivational sessions, these templates offer a professional way to present your future goals and engage your audience effectively.


4 slides
Task Delegation via RACI Model
Simplify task delegation and boost accountability with this clean RACI-based layout—perfect for clarifying roles and responsibilities across teams. Whether you're planning a project or tracking execution, this slide makes it easy to map who’s in charge, consulted, or informed. Fully compatible with PowerPoint, Keynote, and Google Slides.


4 slides
Side-by-Side Comparison Butterfly Chart Presentation
Compare data clearly and effectively with the Side-by-Side Comparison Butterfly Chart Presentation. This layout is perfect for showcasing performance metrics, survey results, or A/B comparisons in a symmetrical, easy-to-read format. Editable in Canva, PowerPoint, Google Slides, and Keynote to match your brand and presentation style effortlessly.


4 slides
Infrastructure and Construction Industry Presentation
Showcase key developments in the Infrastructure and Construction Industry with this visually structured template. Ideal for project managers, urban planners, and engineers, it highlights construction phases, investment data, and industry insights. Fully customizable and compatible with PowerPoint, Keynote, and Google Slides for seamless integration into your professional presentations.


26 slides
Spa and Wellness Company Profile Presentation
Embark on a journey to wellness and relaxation with our serene well spa & wellness company profile presentation. This template will Immerse your audience in a world of calmness, rejuvenation, and health. Present your company's mission and vision for promoting wellness. Compatible with Powerpoint, Keynote, and Google Slides. The soothing shades of pastels and soft hues create a peaceful atmosphere. This template integrates elements of nature like leaves, flowers, or waves to evoke serenity. This presentation is designed to captivate your audience and immerse them in the world of relaxation.


4 slides
Mirror Data Distribution Butterfly Format Presentation
Present side-by-side comparisons with clarity using the Mirror Data Distribution Butterfly Format Presentation. This layout helps visualize balanced data sets, performance comparisons, or goal vs. outcome metrics with mirrored bars and intuitive icons. Fully customizable in Canva, PowerPoint, Google Slides, and Keynote to match your brand's aesthetic and message.


7 slides
Africa Regions Map Infographic
This Africa Regions Map infographic template is a comprehensive visual tool designed to highlight key data points across the continent's diverse regions. It is versatile and easily adaptable for use in PowerPoint, Google Slides, and Keynote. The template includes various geographic layouts and data visualization elements like human figures for population representation, color-coded regions for quick reference, and icon-based markers for specific data points such as economic indicators or social statistics. Each slide is crafted to allow for clear presentation of information ranging from demographic distributions to project locations, making it an invaluable resource for educators, and organizations working with African continental data.


7 slides
Geometric Sequence Infographic Presentation
Geometric infographics typically involve the use of various shapes to convey different pieces of information. This Geometric Template is a professional way to show your great designworks and ideas. This template can be used in a variety of contexts, from business and marketing to education and journalism. This clean design includes many categories, dividers and icons which will help you show your data in the best way. Start creating your own customized presentation by adding your text, images and other content from your slides, just download in PowerPoint, Keynote or Google Slides.


6 slides
Biology Tree Diagram Infographic
Tree diagrams in biology are graphical representations that show the hierarchical relationships and evolutionary history of different organisms, species, or biological traits. This infographic template is designed to simplify complex biological information and show the interconnectedness between different biological topics or classifications. This infographic is a visual representation of various biological concepts and relationships in a hierarchical tree structure. This template color codes the different branches to distinguishing between the different categories and make the infographic easier to navigate.


6 slides
Innovation Ideas Infographics
Energize your presentations with our Innovation Ideas infographic, designed for full compatibility with Powerpoint, Keynote, and Google Slides. This vibrant and insightful infographic is the perfect addition for innovators, entrepreneurs, and educators looking to foster a culture of creativity and ideation. The infographic provides a visual exploration of the innovation process, from ideation to execution. It highlights key concepts and strategies that stimulate creative thinking and drive innovation within teams and organizations. With a focus on collaborative brainstorming and the incubation of ideas, it serves as a guide to developing groundbreaking concepts. Incorporating this infographic into your slides will help you effectively communicate the dynamics of successful innovation strategies. It’s ideal for workshops, team meetings, and academic courses that cover topics such as design thinking, innovation management, and product development. Use it to inspire your audience and to illustrate a roadmap for transforming ideas into tangible innovations.


6 slides
Editable Weekly Calendar Slide Presentation
Bring your week into focus with a vibrant layout that turns daily planning into something you actually look forward to. This presentation helps you outline tasks, deadlines, and priorities in a clear, color-coded structure perfect for productivity. Fully editable and compatible with PowerPoint, Keynote, and Google Slides.


7 slides
Risk Prevention and Safety Management Presentation
Elevate your organization's approach to hazard awareness with our 'Risk Prevention and Safety Management' presentation template. Designed to aid in illustrating essential safety measures and risk management tactics, this template is a must-have for training sessions and workshops. Fully compatible with PowerPoint, Keynote, and Google Slides, it's ideal for ensuring workplace safety and compliance.


4 slides
Layered Strategy Circles Presentation
Bring your strategy to life with a sleek circular layout that visually connects goals, actions, and outcomes in a unified flow. Perfect for showcasing layered processes or business frameworks, this design keeps complex ideas simple. Fully editable and compatible with PowerPoint, Keynote, and Google Slides for smooth customization.


5 slides
Problem Framing and Opportunity Identification Presentation
Spot challenges and uncover growth potential with this Problem Framing and Opportunity Identification presentation. Ideal for strategy sessions, this layered pyramid layout helps you organize problems from surface-level to root causes while aligning them with strategic opportunities. Fully editable in Canva, PowerPoint, or Google Slides for seamless customization.