


Features
- 5 Unique slides
- Fully editable and easy to edit in Microsoft Powerpoint, Keynote and Google Slides
- 16:9 widescreen layout
- Clean and professional designs
- Export to JPG, PDF or send by email


Do you have any questions?
Recommend


2 slides
Professional Cover and Title Layout
Make a bold first impression with this stylish and modern cover slide template. Featuring a balanced design of imagery and typography, it's perfect for business reports, marketing decks, or strategic plans. Fully editable in PowerPoint, Keynote, and Google Slides for effortless customization.


4 slides
Strategic Triangle Model Slide
Visualize your core pillars with this Strategic Triangle Model Slide Presentation. Featuring a clean triangular layout with three editable segments, this template is perfect for showcasing frameworks such as mission-vision-values, policy-strategy-impact, or key business objectives. Each point of the triangle is paired with an icon and customizable text, making complex concepts easy to digest. Ideal for strategy planning, leadership discussions, or consulting proposals. Fully editable in PowerPoint, Google Slides, and Keynote.


23 slides
Delphi Investor Pitch Presentation
The Delphi Pitch Deck offers a warm and inviting design, ideal for conveying complex business concepts in a clear and engaging manner. The deck features a cohesive layout that covers all the essential components of a successful pitch, including company overview, problem statement, solution, market opportunity, and target audience. With a focus on optimizing supply chain efficiency, the template is perfect for startups and businesses looking to showcase their unique selling proposition and innovative strategies. The deck also includes detailed sections on business model canvas, revenue model, competitive landscape, and financial projections, ensuring your audience receives a comprehensive understanding of your business. The soft color palette enhances readability while maintaining a professional tone, making it suitable for various industries. Fully compatible with PowerPoint, Keynote, and Google Slides, the Delphi Pitch Deck is the perfect tool for delivering a memorable and persuasive presentation.


21 slides
Moonshade Strategic Planning Report Presentation
This strategic planning template provides a comprehensive framework to align your business objectives with actionable plans. With sections for SWOT analysis, resource allocation, key metrics, and growth opportunities, it ensures that every element is covered for successful execution. Customizable in PowerPoint, Keynote, and Google Slides, it's perfect for building focused, strategic initiatives.


5 slides
Business Growths Strategy Presentation
Grow your ideas with a dynamic visual layout that makes every milestone feel achievable and clear. This presentation helps you explain key stages, strategic actions, and long-term growth goals with confidence and simplicity. Fully customizable and compatible with PowerPoint, Keynote, and Google Slides.


26 slides
Business Ethics and Compliance Presentation
Navigate the crucial topics of business ethics and compliance with this professionally designed presentation template. The clean, corporate aesthetic, dominated by a palette of cool blues and grays, underscores the importance of transparency and integrity in the business world. Ideal for corporate trainers, compliance officers, or business consultants, the template offers a structured approach to discussing ethical practices and regulatory standards. With a mix of charts, diagrams, and bullet points, it allows for detailed explanations of policies, case studies of ethical dilemmas, and the benefits of compliance. Each slide is a step towards building a culture of trust and accountability within an organization, making it a key resource for any business-focused presentation. Adapted for use across PowerPoint, Keynote, and Google Slides, it's crafted to facilitate a clear and impactful delivery of essential business principles.


7 slides
SWOT Analysis Marketing Infographic Presentation
SWOT Analysis is a simple, but powerful strategic planning method. It helps identify your company’s strengths, weaknesses, opportunities and threats as you plan a course for the future. This template includes everything you need for your next project, including data and insight about your business. This template comes with 7 slides. It includes a title for each infographic and allows you to build your swot charts, add icons and convert the text into bullet points. You have complete control over all elements within each slide and can easily add, delete or modify content at any time!


2 slides
Professional Proposal for Project Approval Presentation
Impress stakeholders and decision-makers with the Professional Proposal for Project Approval Presentation. Designed to guide your audience through key objectives and visual justifications, this clean, image-rich layout is ideal for startups, teams, and consultants. Fully customizable in PowerPoint, Keynote, and Google Slides.


5 slides
Modern Medical Case Study Presentation
Step into a clean, modern layout designed to make complex medical insights easy to follow and visually engaging. This presentation helps you explain case details, patient data, and clinical outcomes with clarity and structure. Ideal for healthcare professionals, it’s fully compatible with PowerPoint, Keynote, and Google Slides.


5 slides
Annual Overview Report Template Presentation
Bring your yearly achievements to life with this sleek and structured layout designed for clarity and impact. Ideal for summarizing company performance, milestones, and future goals, it organizes data into easy-to-follow visuals. Fully editable and compatible with PowerPoint, Keynote, and Google Slides for a smooth presentation experience.


6 slides
Creative Geometric Infographic
Showcase interconnected ideas with this sleek, six-part 3D geometric ring. Designed for clarity and impact, this layout is perfect for processes, cycles, or strategic segments. Compatible with PowerPoint, Keynote, and Google Slides.


6 slides
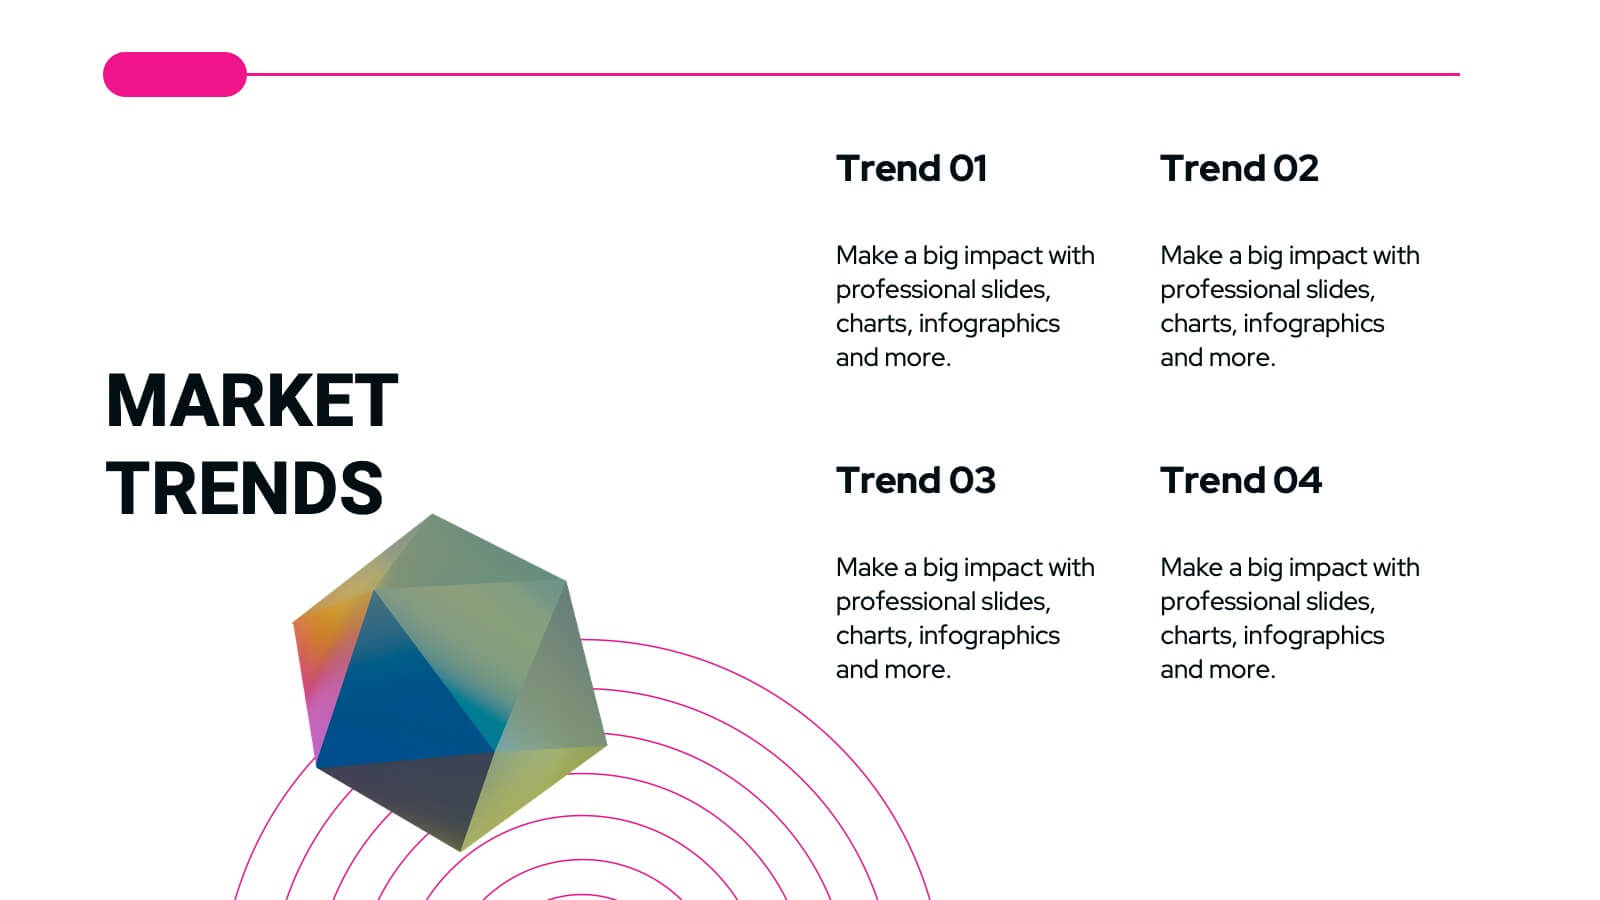
Digital Marketing Strategy and Trends Presentation
The "Digital Marketing Strategy and Trends" template is designed to help marketers visualize and present their strategies and market trends effectively. It facilitates clear mapping of key steps in digital marketing campaigns, making it easier to convey complex strategies in a digestible format. This template is compatible with PowerPoint, Keynote, and Google Slides, ensuring it can be utilized across various platforms for diverse audiences.


6 slides
Organizational Strategy via Mind Mapping
Clarify your corporate vision with the Organizational Strategy via Mind Mapping Presentation. This infographic-style slide uses a head silhouette and segmented arc to represent five strategic focus areas (A–E), making it perfect for showcasing alignment across departments, initiatives, or leadership goals. Fully customizable in PowerPoint, Keynote, and Google Slides for versatile strategic presentations.


26 slides
E-commerce Business Strategies Presentation
Dive into the dynamic world of e-commerce with a presentation that’s a portal into the marketplace of tomorrow. This is not just a slideshow; it’s a strategic map charting the course through the ever-evolving digital bazaar. Picture the first slide, a welcoming gateway that beckons you into the realm of online trade, setting the scene for a narrative of innovation and growth. As you navigate through, you encounter the visionaries, the driving force behind the brands, presented as pioneers on a quest for digital dominance. Each slide serves as a stepping stone, unveiling options for conquering virtual marketplaces, with comparative analyses that dissect successful tactics. Financial projections, illustrated not simply as statistics, but as trophies to be won in the grand game of e-commerce. The closing slide is not a mere farewell, but a pledge to continue the voyage into the boundless potential of online business, leaving viewers not just informed, but inspired to join the revolution.


5 slides
Customer Loyalty Program Strategy
Design a winning rewards system with this engaging loyalty program infographic. Featuring a vertical layout with five customizable stages alongside a gift icon, this slide is perfect for outlining incentives, customer tiers, or retention plans. Fully editable in PowerPoint, Keynote, and Google Slides.


6 slides
Customer Journey Management Infographic
Map out the customer's path to purchase with our intuitive Customer Journey Management Infographic, perfect for Powerpoint, Google Slides, and Keynote. This visual tool helps businesses understand and enhance the customer experience at every touchpoint. Highlight critical stages from awareness to advocacy with distinct, easy-to-follow layouts. Customize it to fit your brand’s journey, showcasing the interactions and emotions customers encounter. Ideal for marketing strategy sessions and client presentations, it simplifies complex consumer behavior into a clear, actionable pathway.


21 slides
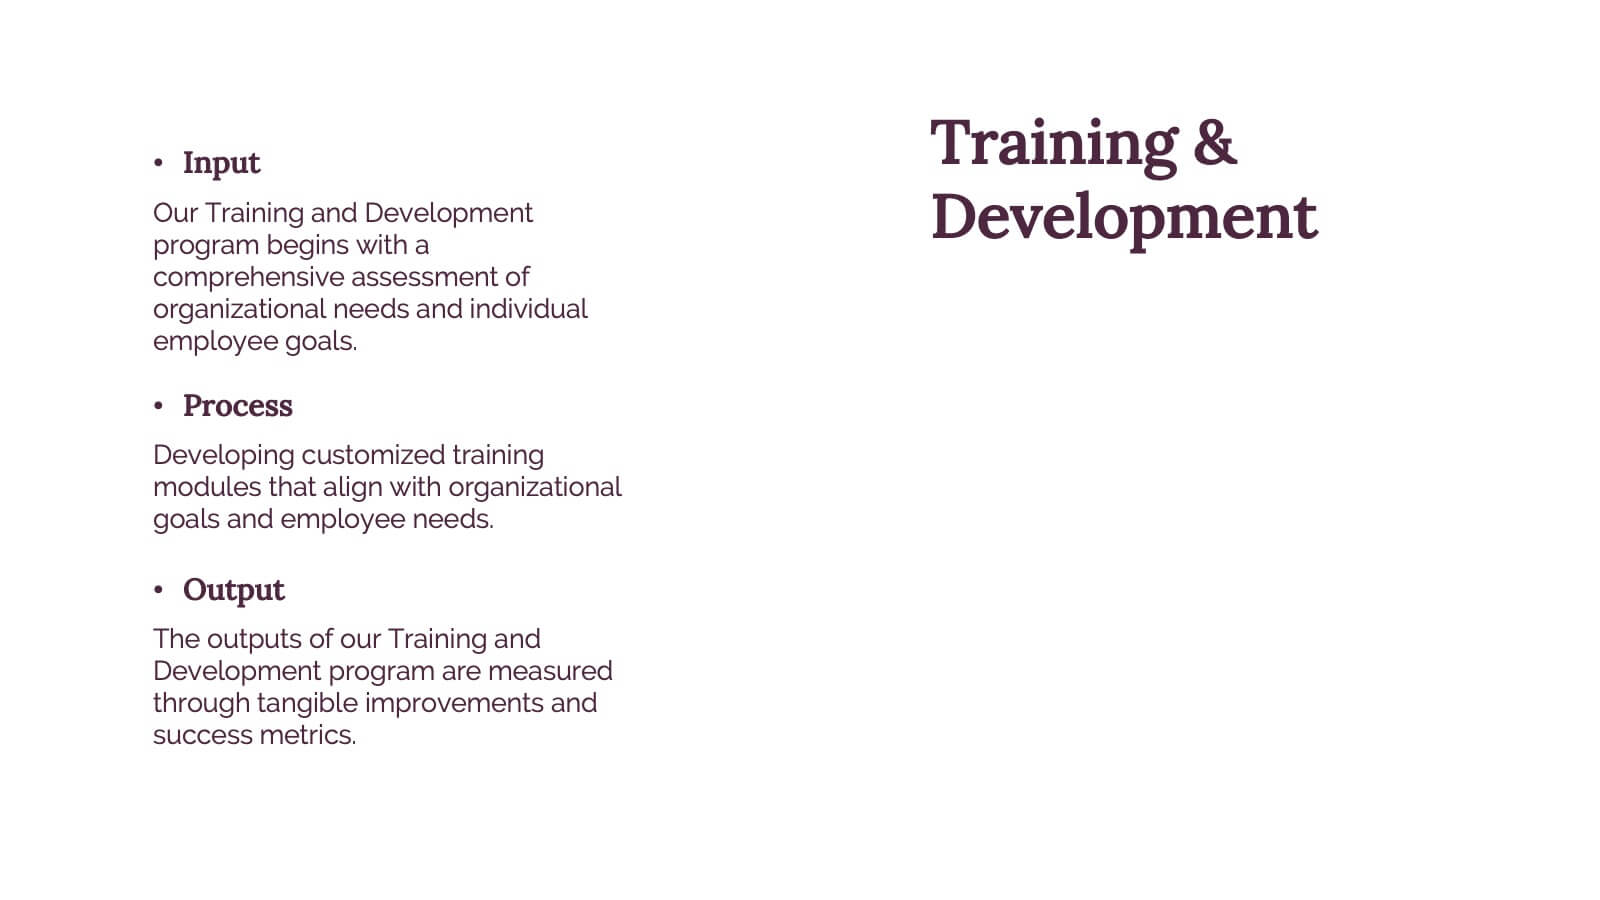
Kinetic Business Operations Plan Presentation
Take your business operations to the next level with this sleek and organized Business Operational Plan template! Dive into every detail, from performance metrics to employee recognition, all presented with professional design and clear layouts. Make collaboration, process improvements, and upcoming events engaging and actionable. Perfect for PowerPoint, Keynote, and Google Slides!