


Features
- 10 Unique slides
- Fully editable and easy to edit in Microsoft Powerpoint, Keynote and Google Slides
- 16:9 widescreen layout
- Clean and professional designs
- Export to JPG, PDF or send by email


Do you have any questions?
Recommend


5 slides
Multi-Level Concentric Circles Framework Presentation
Visualize relationships and layered strategies with the Multi-Level Concentric Circles Framework Presentation. This template uses interlinked circular nodes to represent multi-tier systems, process flows, or strategic components in an intuitive layout. Easily editable in PowerPoint, Keynote, and Google Slides for seamless integration into your presentations.


6 slides
Target Market Stock Infographic
The target market refers to the specific group of individuals or businesses that a company aims to reach and serve with its products or services. The goal of this infographic template is to provide a overview of your target market, allowing marketers and businesses to craft more personalized and effective marketing strategies. This template is designed to identify and understand that the market is a crucial aspect of marketing and business strategy. This template will help you tailor offerings and marketing efforts to meet the needs of your intended audience. Create marketing campaigns that resonate with your viewers.


4 slides
Regional Economic Evolution in Asia Map Presentation
Track economic progress across Asia with this regional growth map. Each country is paired with a progress bar for visual comparison of growth indicators. Ideal for data-driven insights, economic reviews, or development updates. Editable in PowerPoint, Keynote, and Google Slides for seamless customization and professional, geography-based presentations.


7 slides
Business Strategy Infographic Presentation Template
A business strategy is a detailed plan that lays your goals, accomplishments and direction for the whole organization. A strategic plan will bring stability to your business and make it more profitable. This template can be used to inform your business on how essential a business strategy is. With this template, your business will learn that creating a strategy will help gain a better understanding of their organization's current strengths and weaknesses. This template is easy to use, includes helpful illustrations and allows you to add tips for managing your business more effectively.


7 slides
Geometric Sequence Infographic Presentation
Geometric infographics typically involve the use of various shapes to convey different pieces of information. This Geometric Template is a professional way to show your great designworks and ideas. This template can be used in a variety of contexts, from business and marketing to education and journalism. This clean design includes many categories, dividers and icons which will help you show your data in the best way. Start creating your own customized presentation by adding your text, images and other content from your slides, just download in PowerPoint, Keynote or Google Slides.


5 slides
Decision Matrix Presentation
Make tough choices feel simple with this clear, color-coded layout designed to compare options side-by-side. This presentation helps you evaluate criteria, score alternatives, and present well-structured reasoning with confidence. Clean, intuitive, and fully editable. Compatible with PowerPoint, Keynote, and Google Slides.


5 slides
Online Learning Platforms and Strategies Presentation
Simplify complex educational strategies with this layered house-shaped diagram designed for digital learning topics. Each tier represents a strategic element of your e-learning platform, from planning to implementation. Featuring five clearly labeled sections with editable icons and text, this slide is ideal for showcasing course structures, platform features, or training rollouts. Fully customizable in PowerPoint, Keynote, and Google Slides.


5 slides
Management Framework Structure Presentation
Bring your ideas to life with a dynamic slide that maps out clear stages of leadership, planning, and execution. This layout helps you break down complex management structures into simple, visual steps that any audience can follow. Fully editable and easy to customize in PowerPoint, Keynote, and Google Slides.


7 slides
Cause and Consequence Bowtie Model Presentation
Turn complex risks into clear, visual logic with a balanced, intuitive diagram that connects causes to consequences. This presentation is perfect for showcasing preventive and corrective actions in business or project management. Fully customizable and compatible with PowerPoint, Keynote, and Google Slides for a professional, data-driven approach.


5 slides
Corporate Skills Training Program Presentation
Elevate corporate capability with the 'Corporate Skills Training Program' template, ideal for detailing strategic workforce development. It's crafted for organizations aiming to enhance employee competencies and performance metrics. This template is compatible with PowerPoint, Keynote, and Google Slides, ensuring adaptability across various presentation platforms.


20 slides
Oscillation Project Proposal Presentation
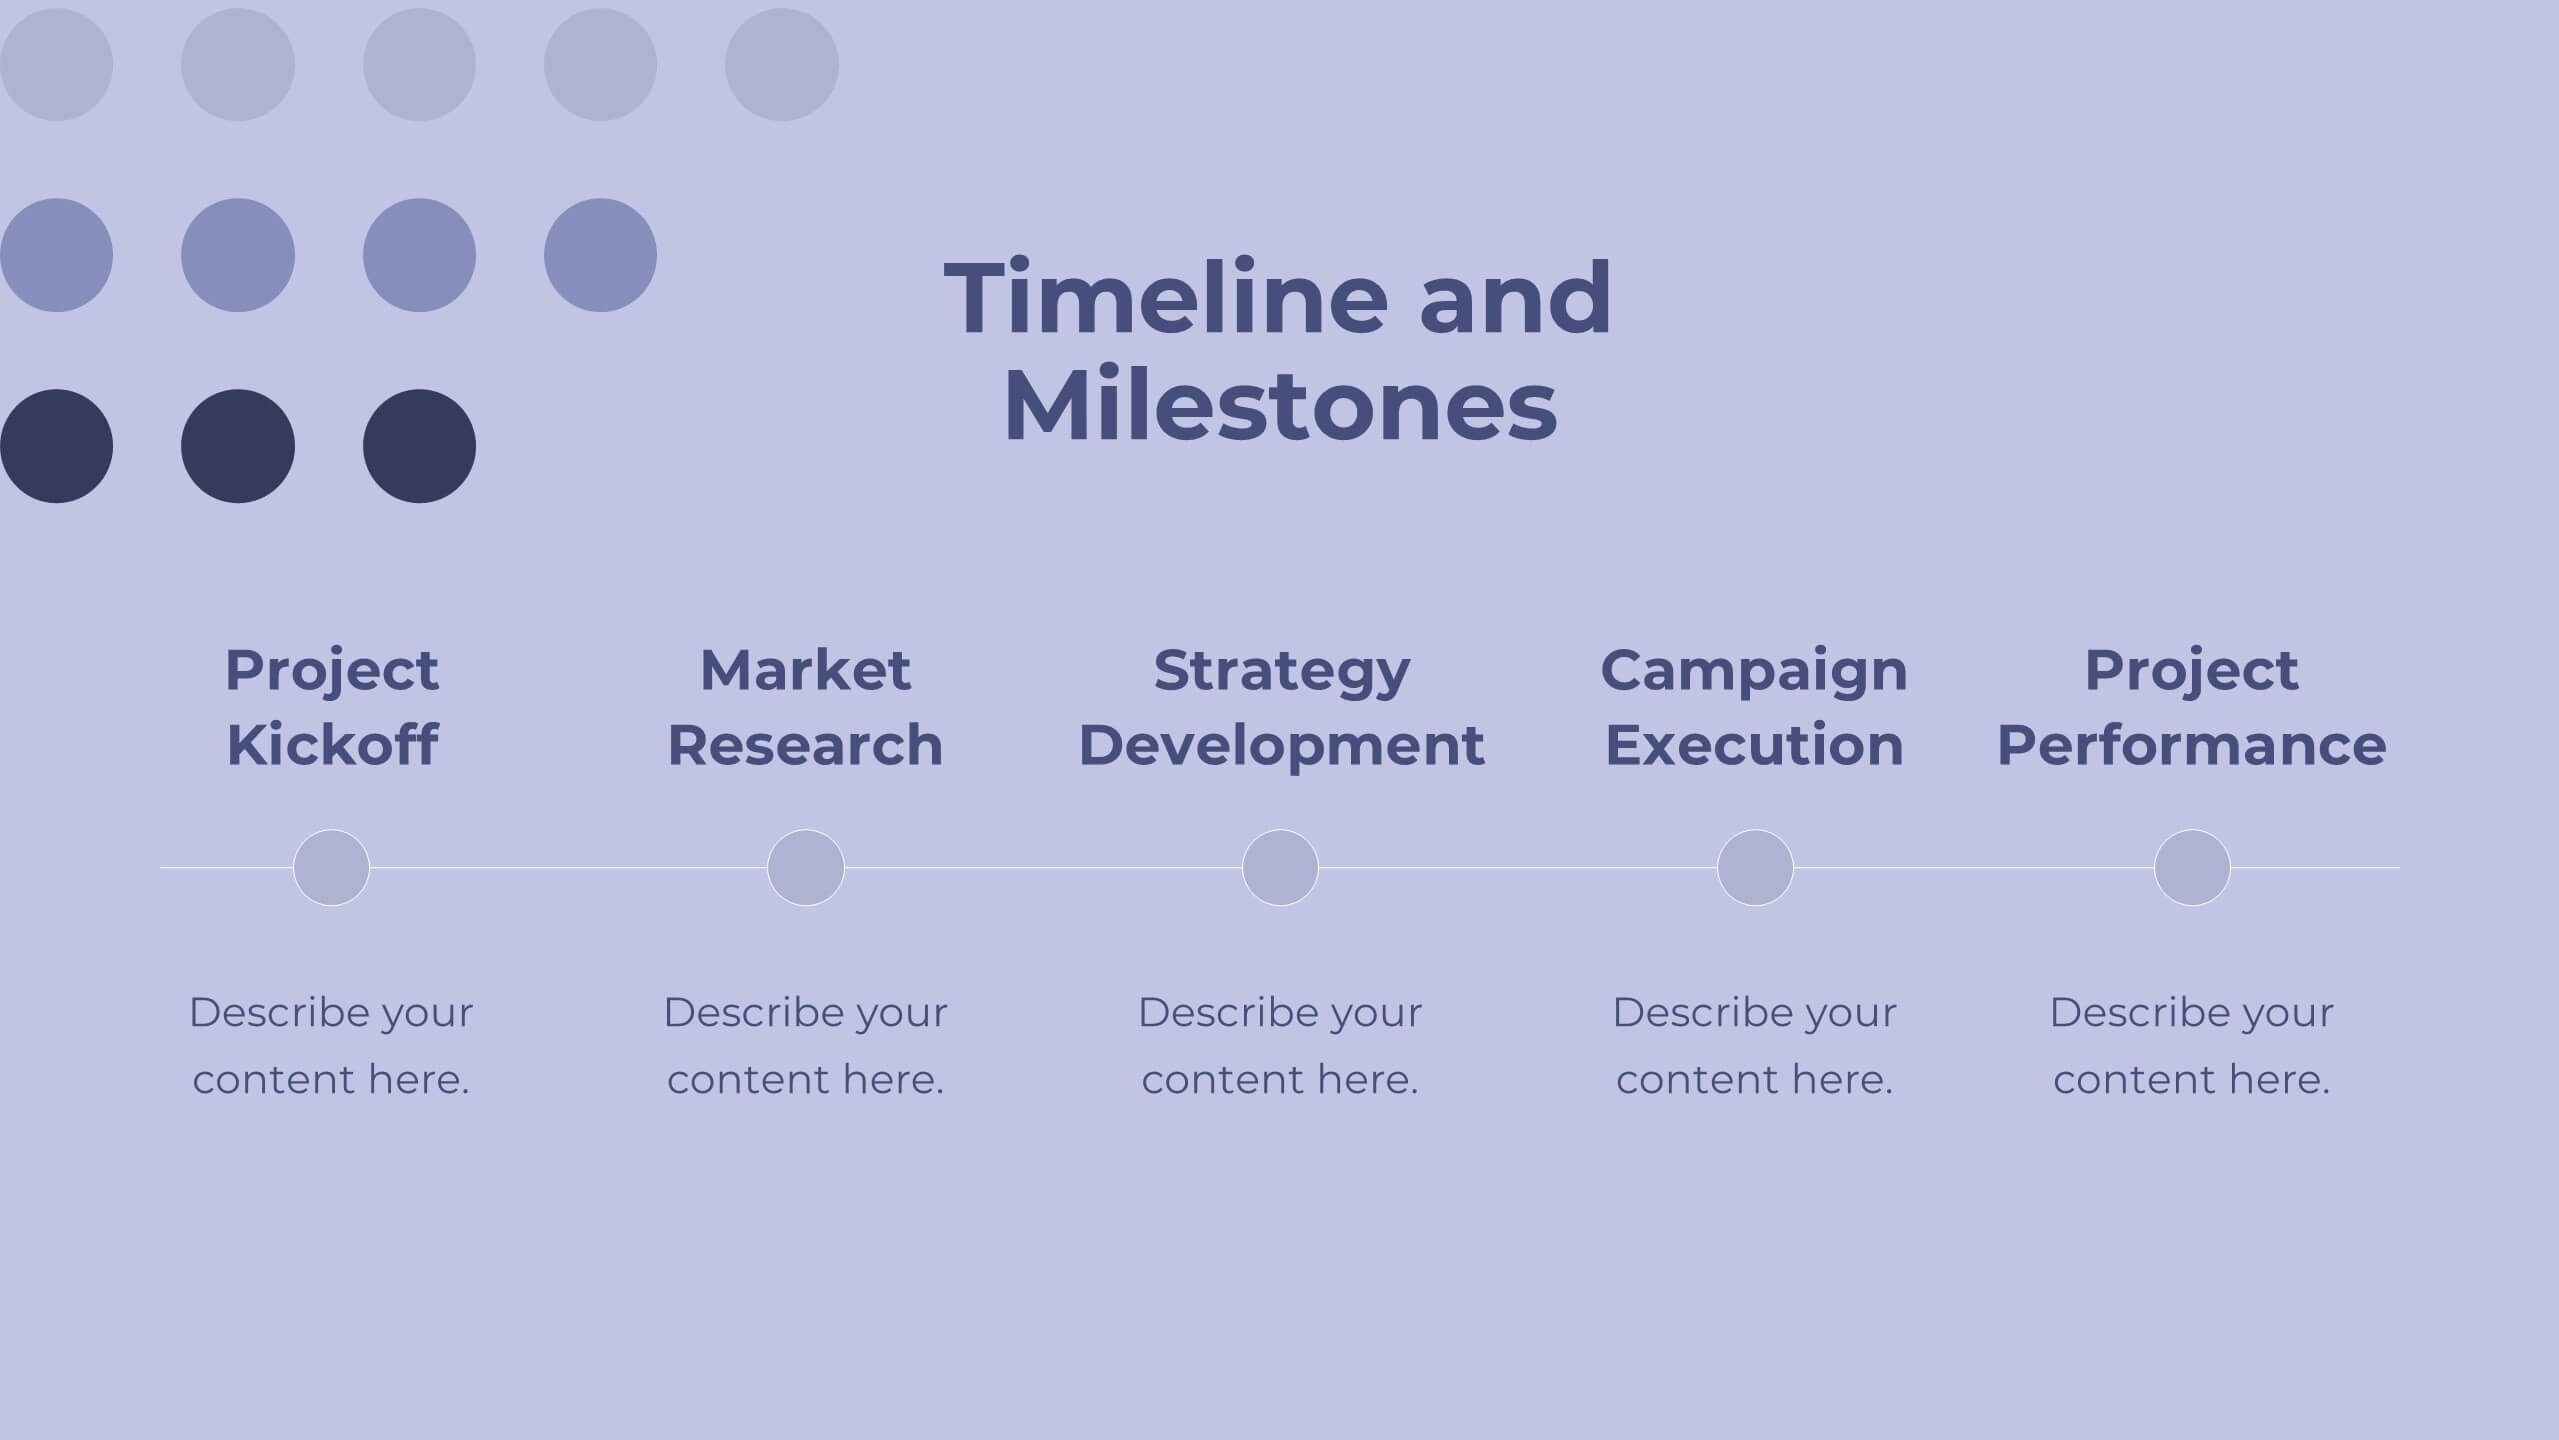
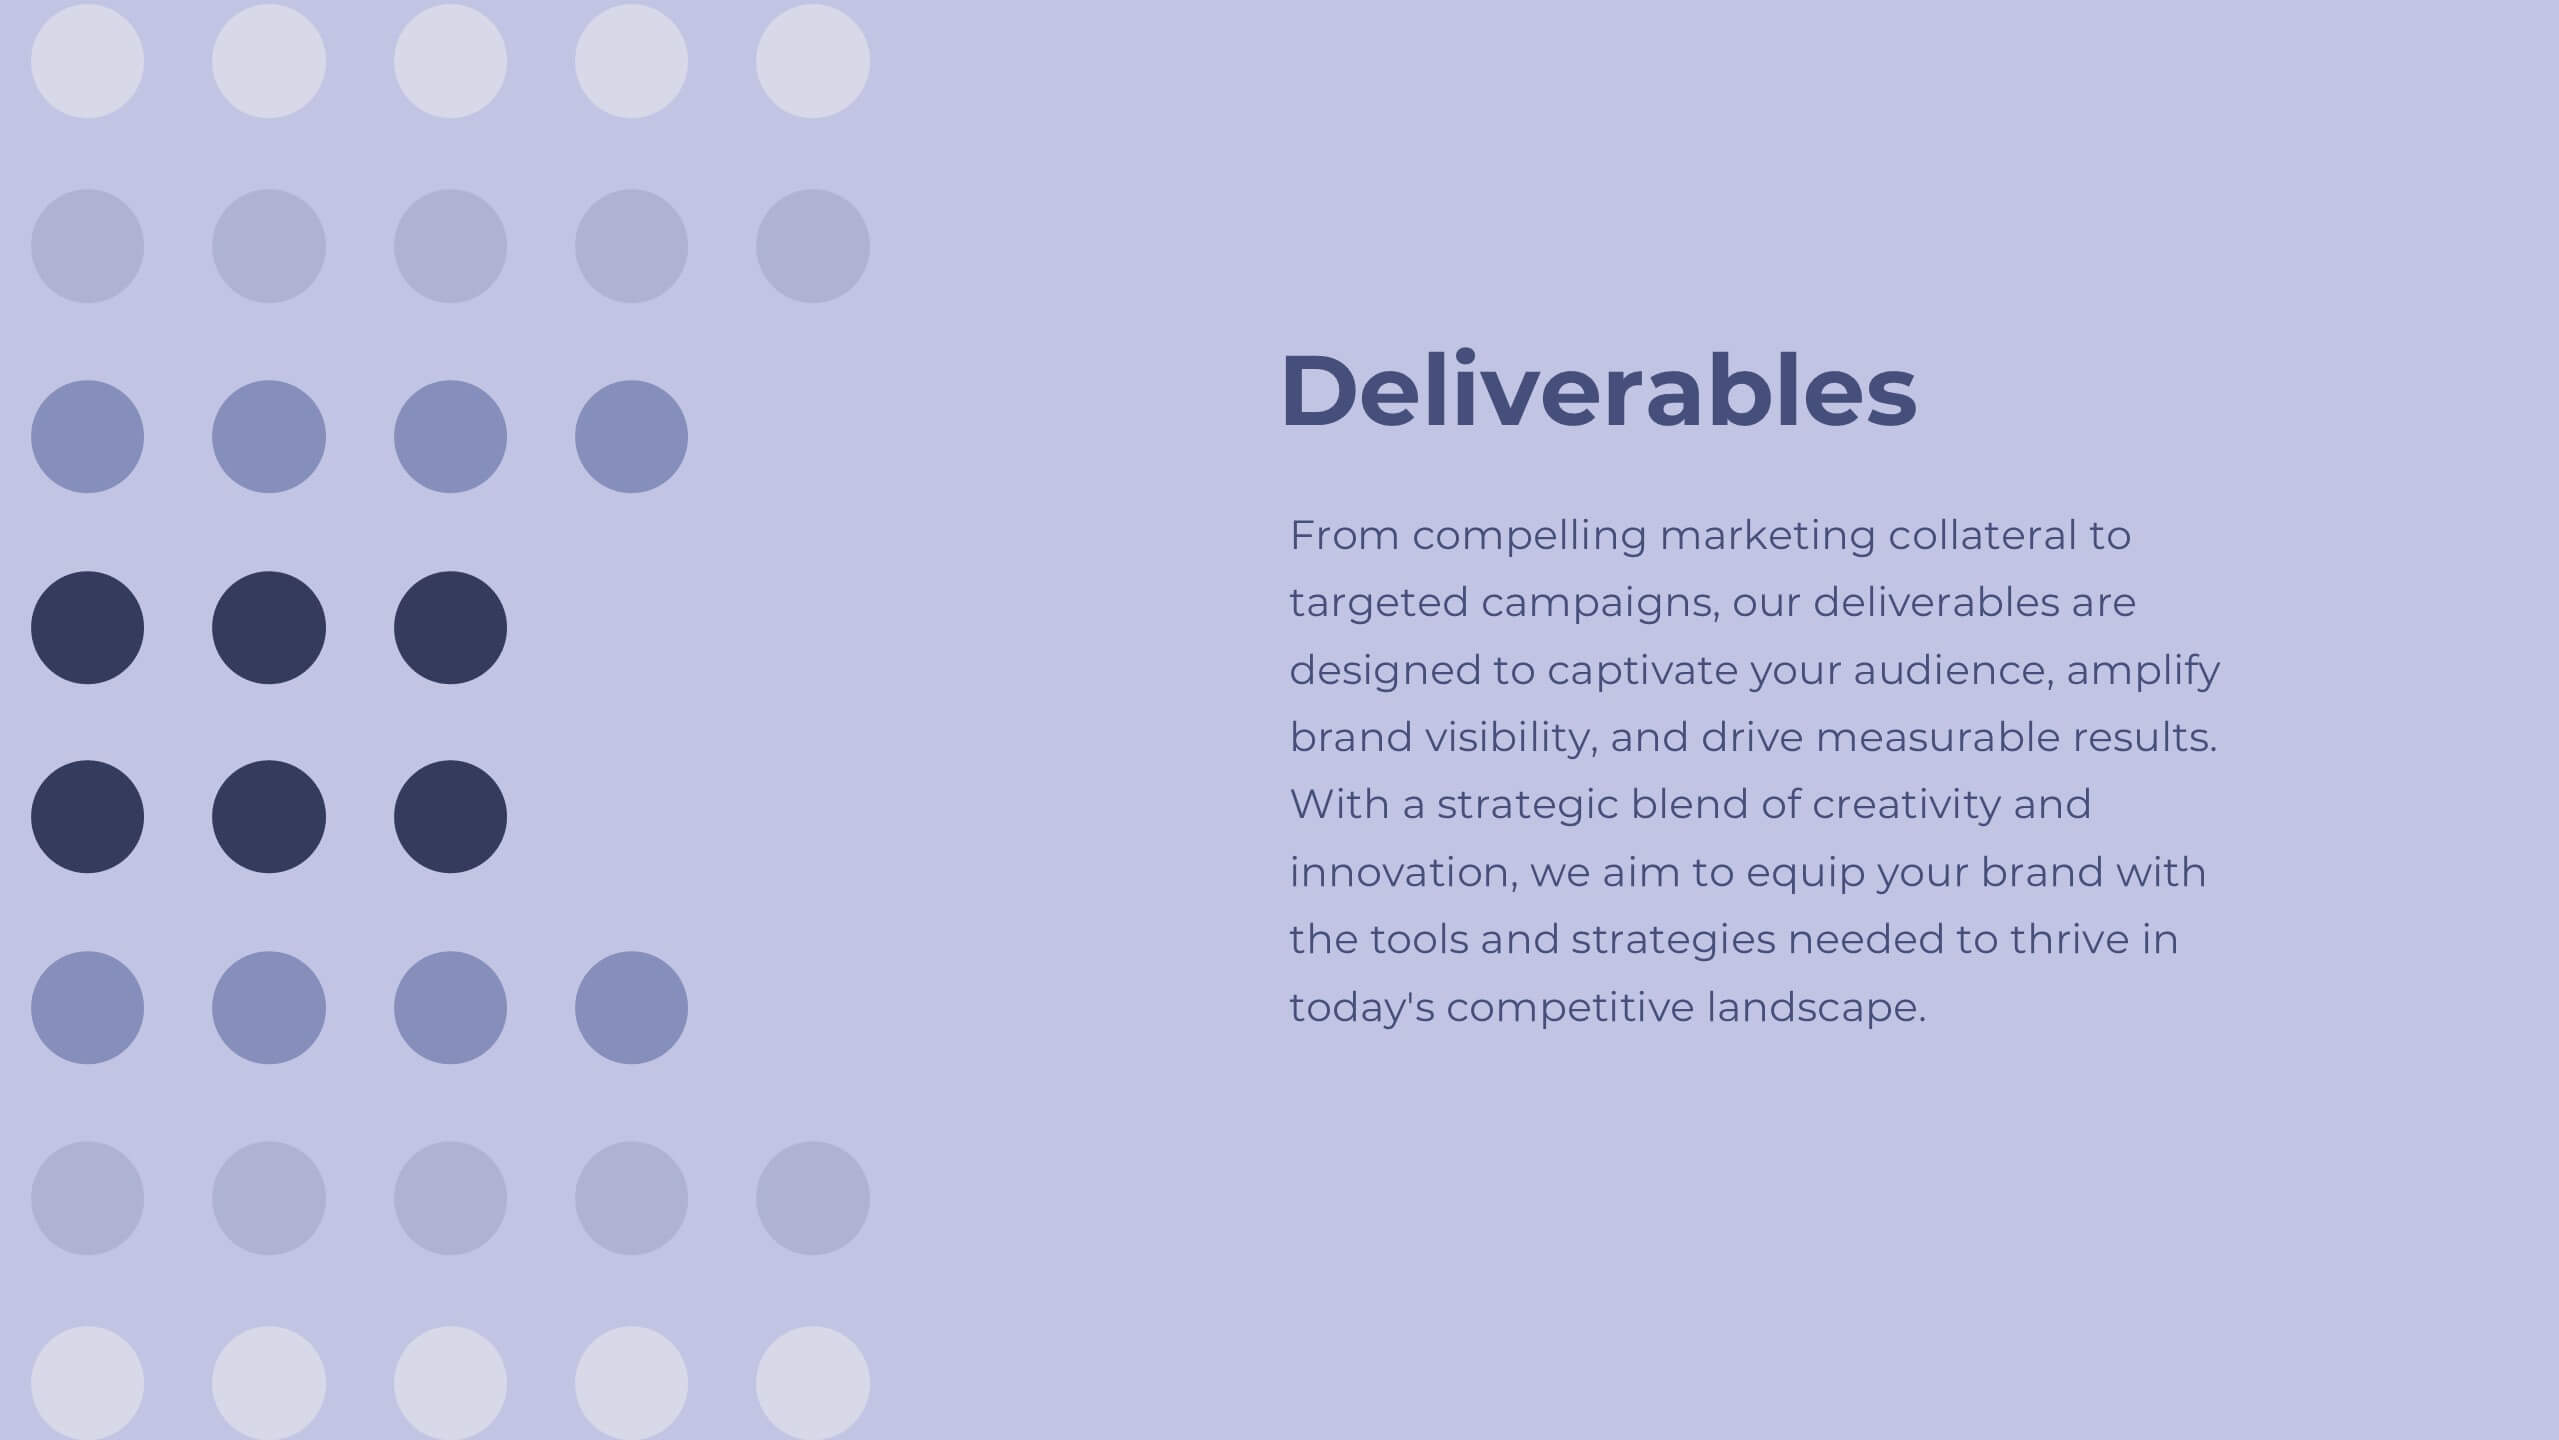
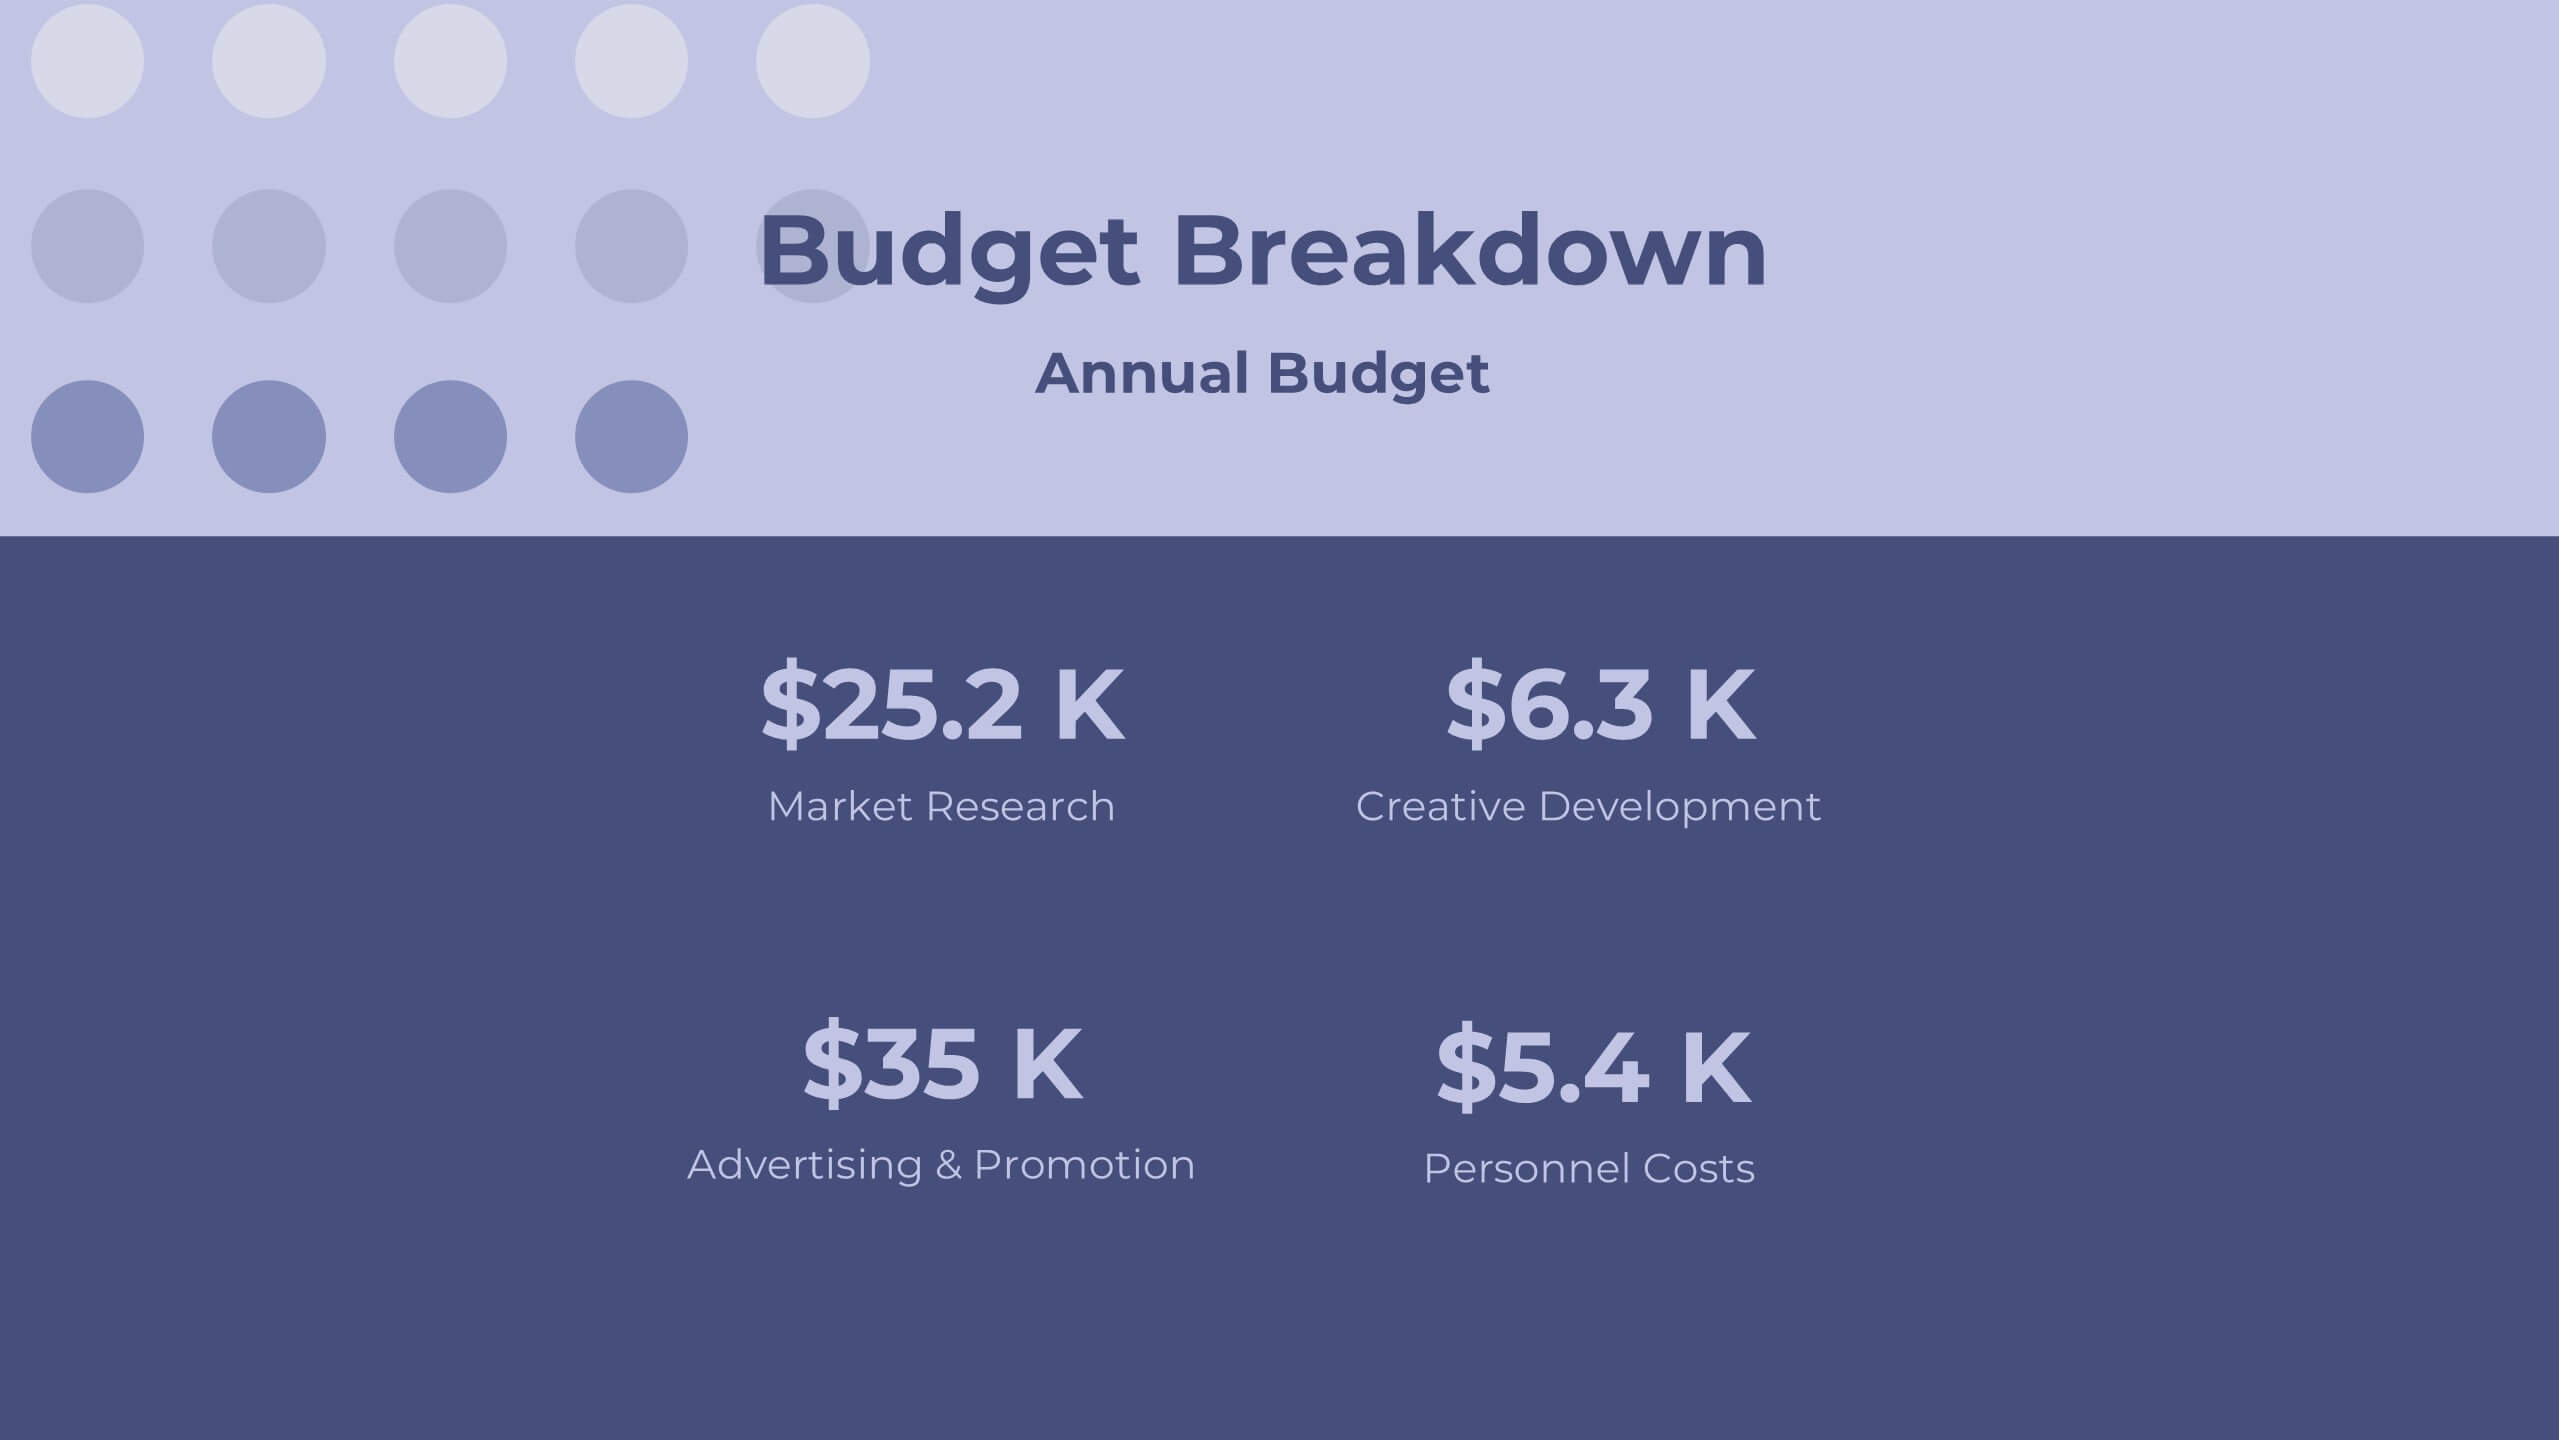
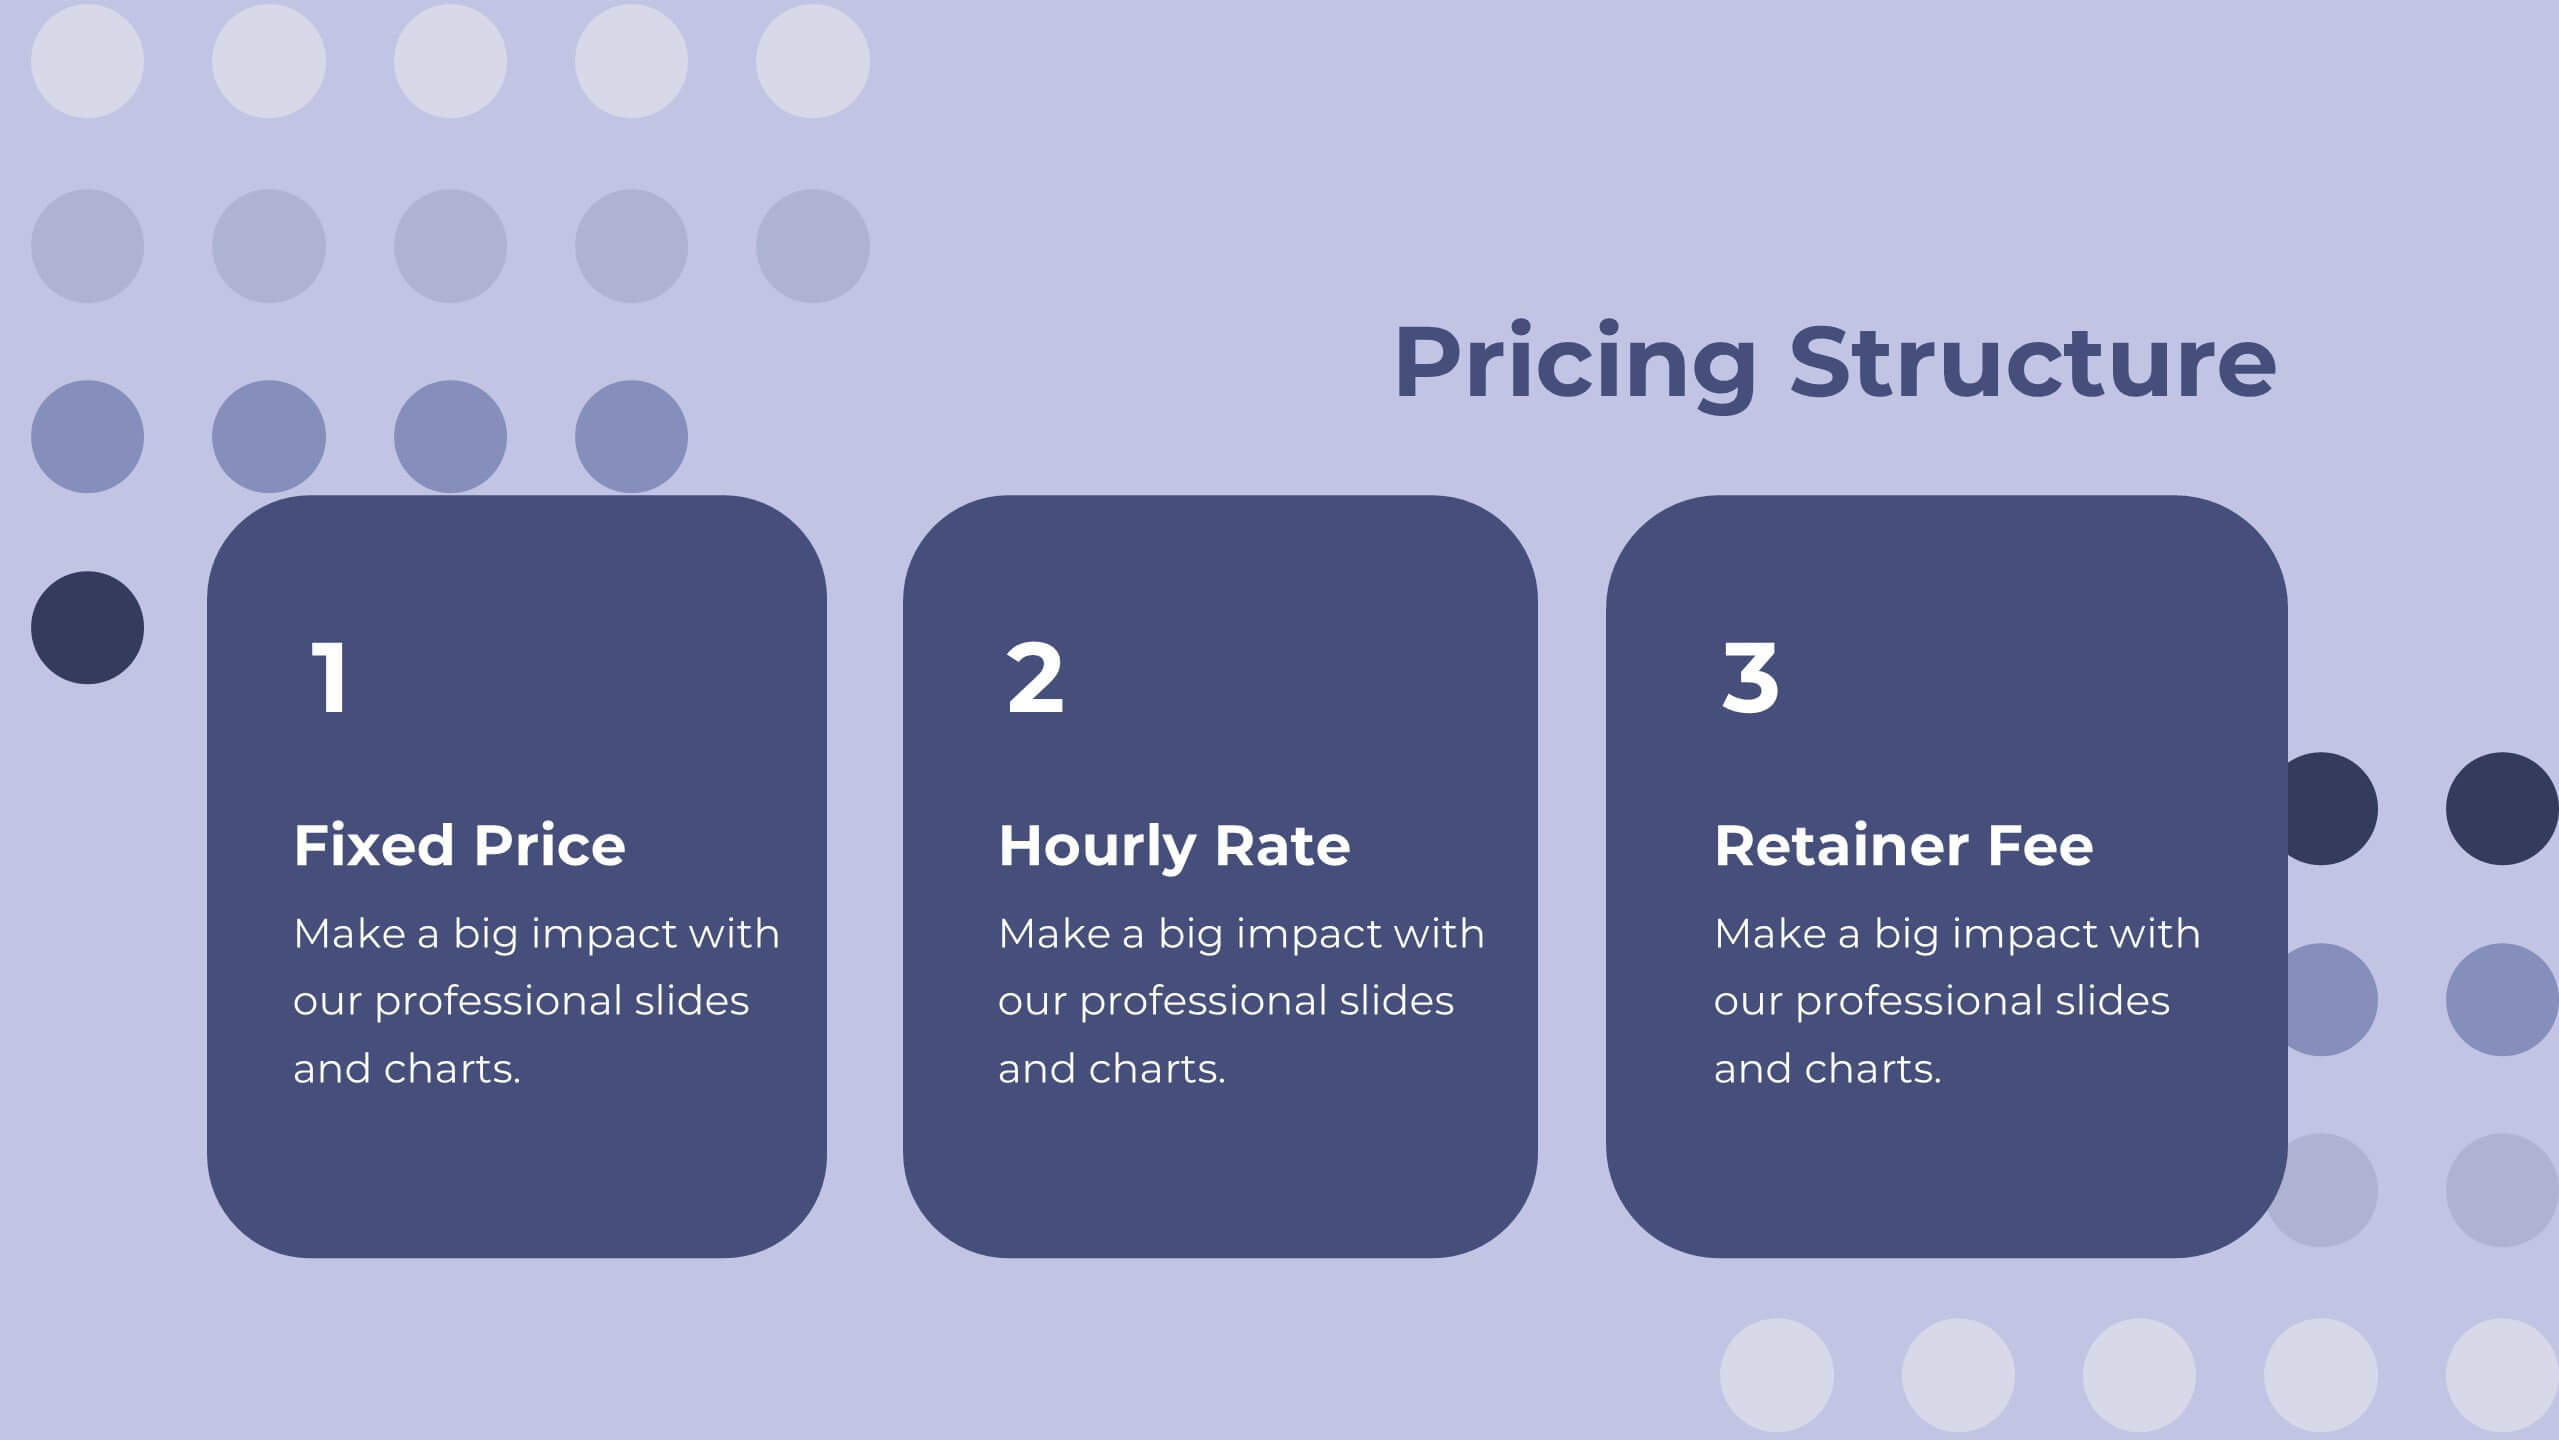
This project proposal template is designed to captivate your audience with a bold purple and yellow color scheme, adding a modern flair to your presentation. It includes comprehensive sections like company overview, objectives and goals, methodology, deliverables, and budget breakdown. Perfect for clearly communicating your project vision and strategy, this template streamlines your content while highlighting your professional approach. Compatible with PowerPoint, Keynote, and Google Slides, it provides versatility for seamless delivery across platforms.


22 slides
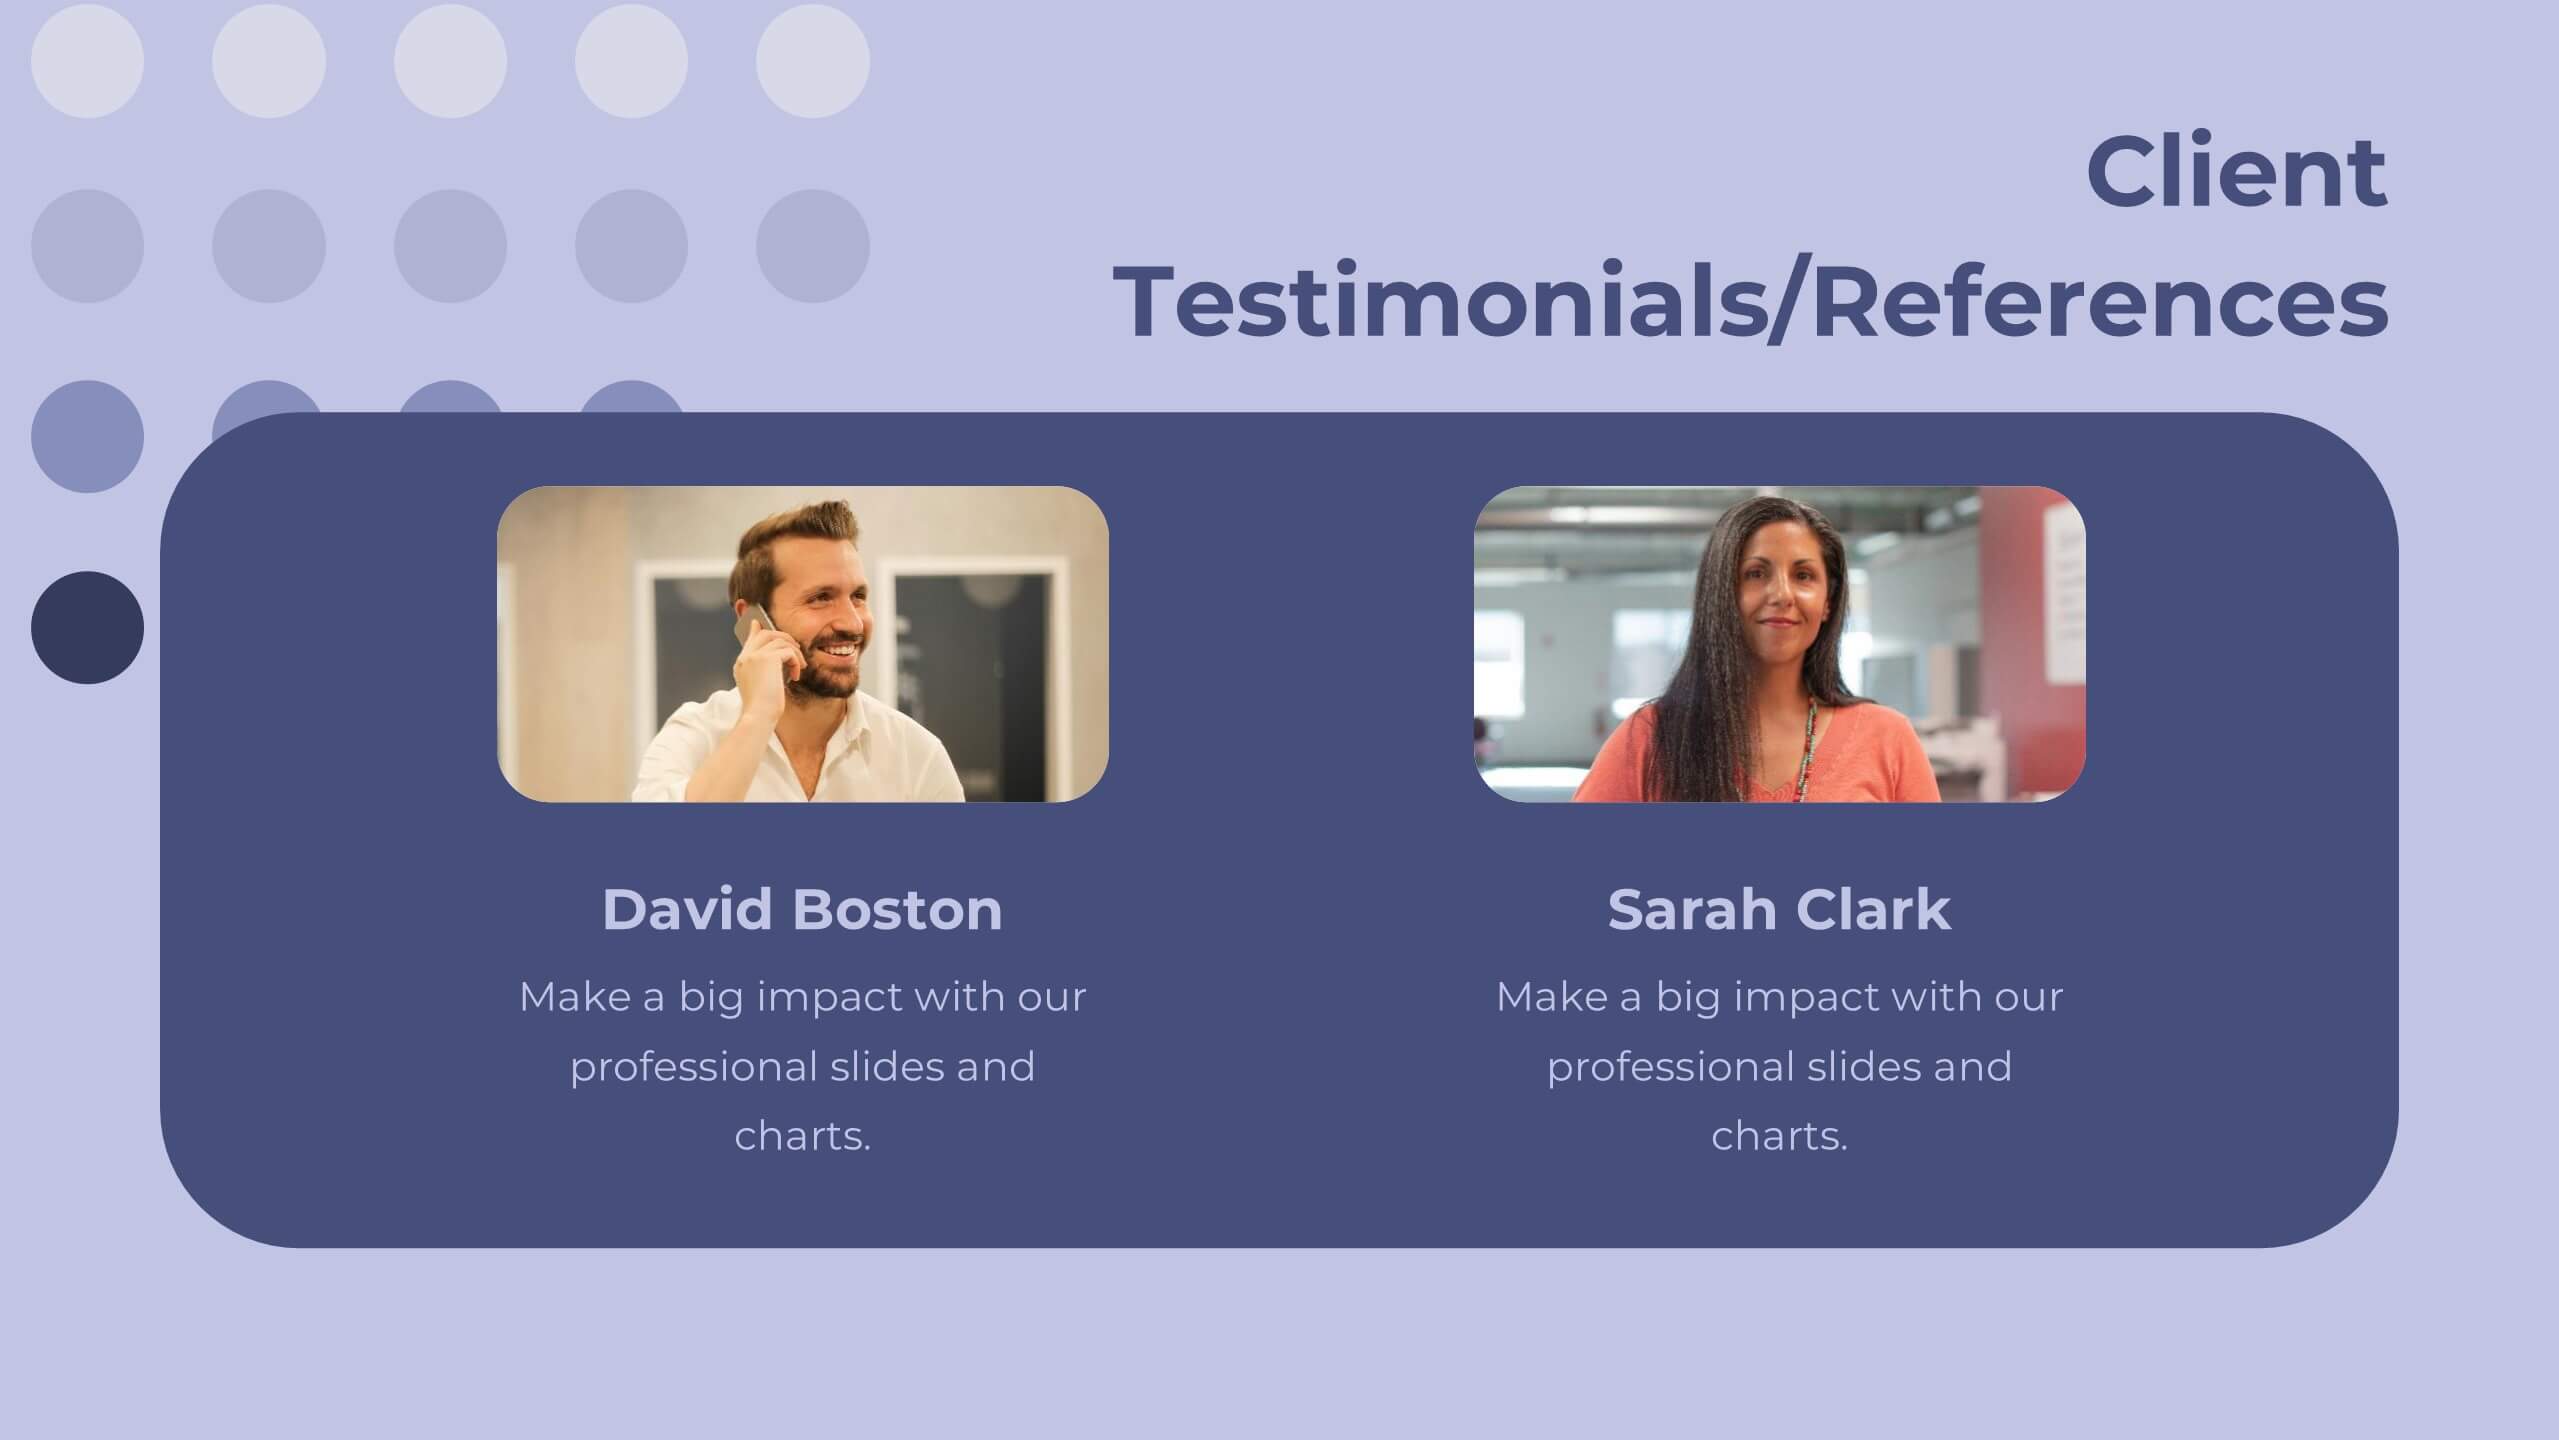
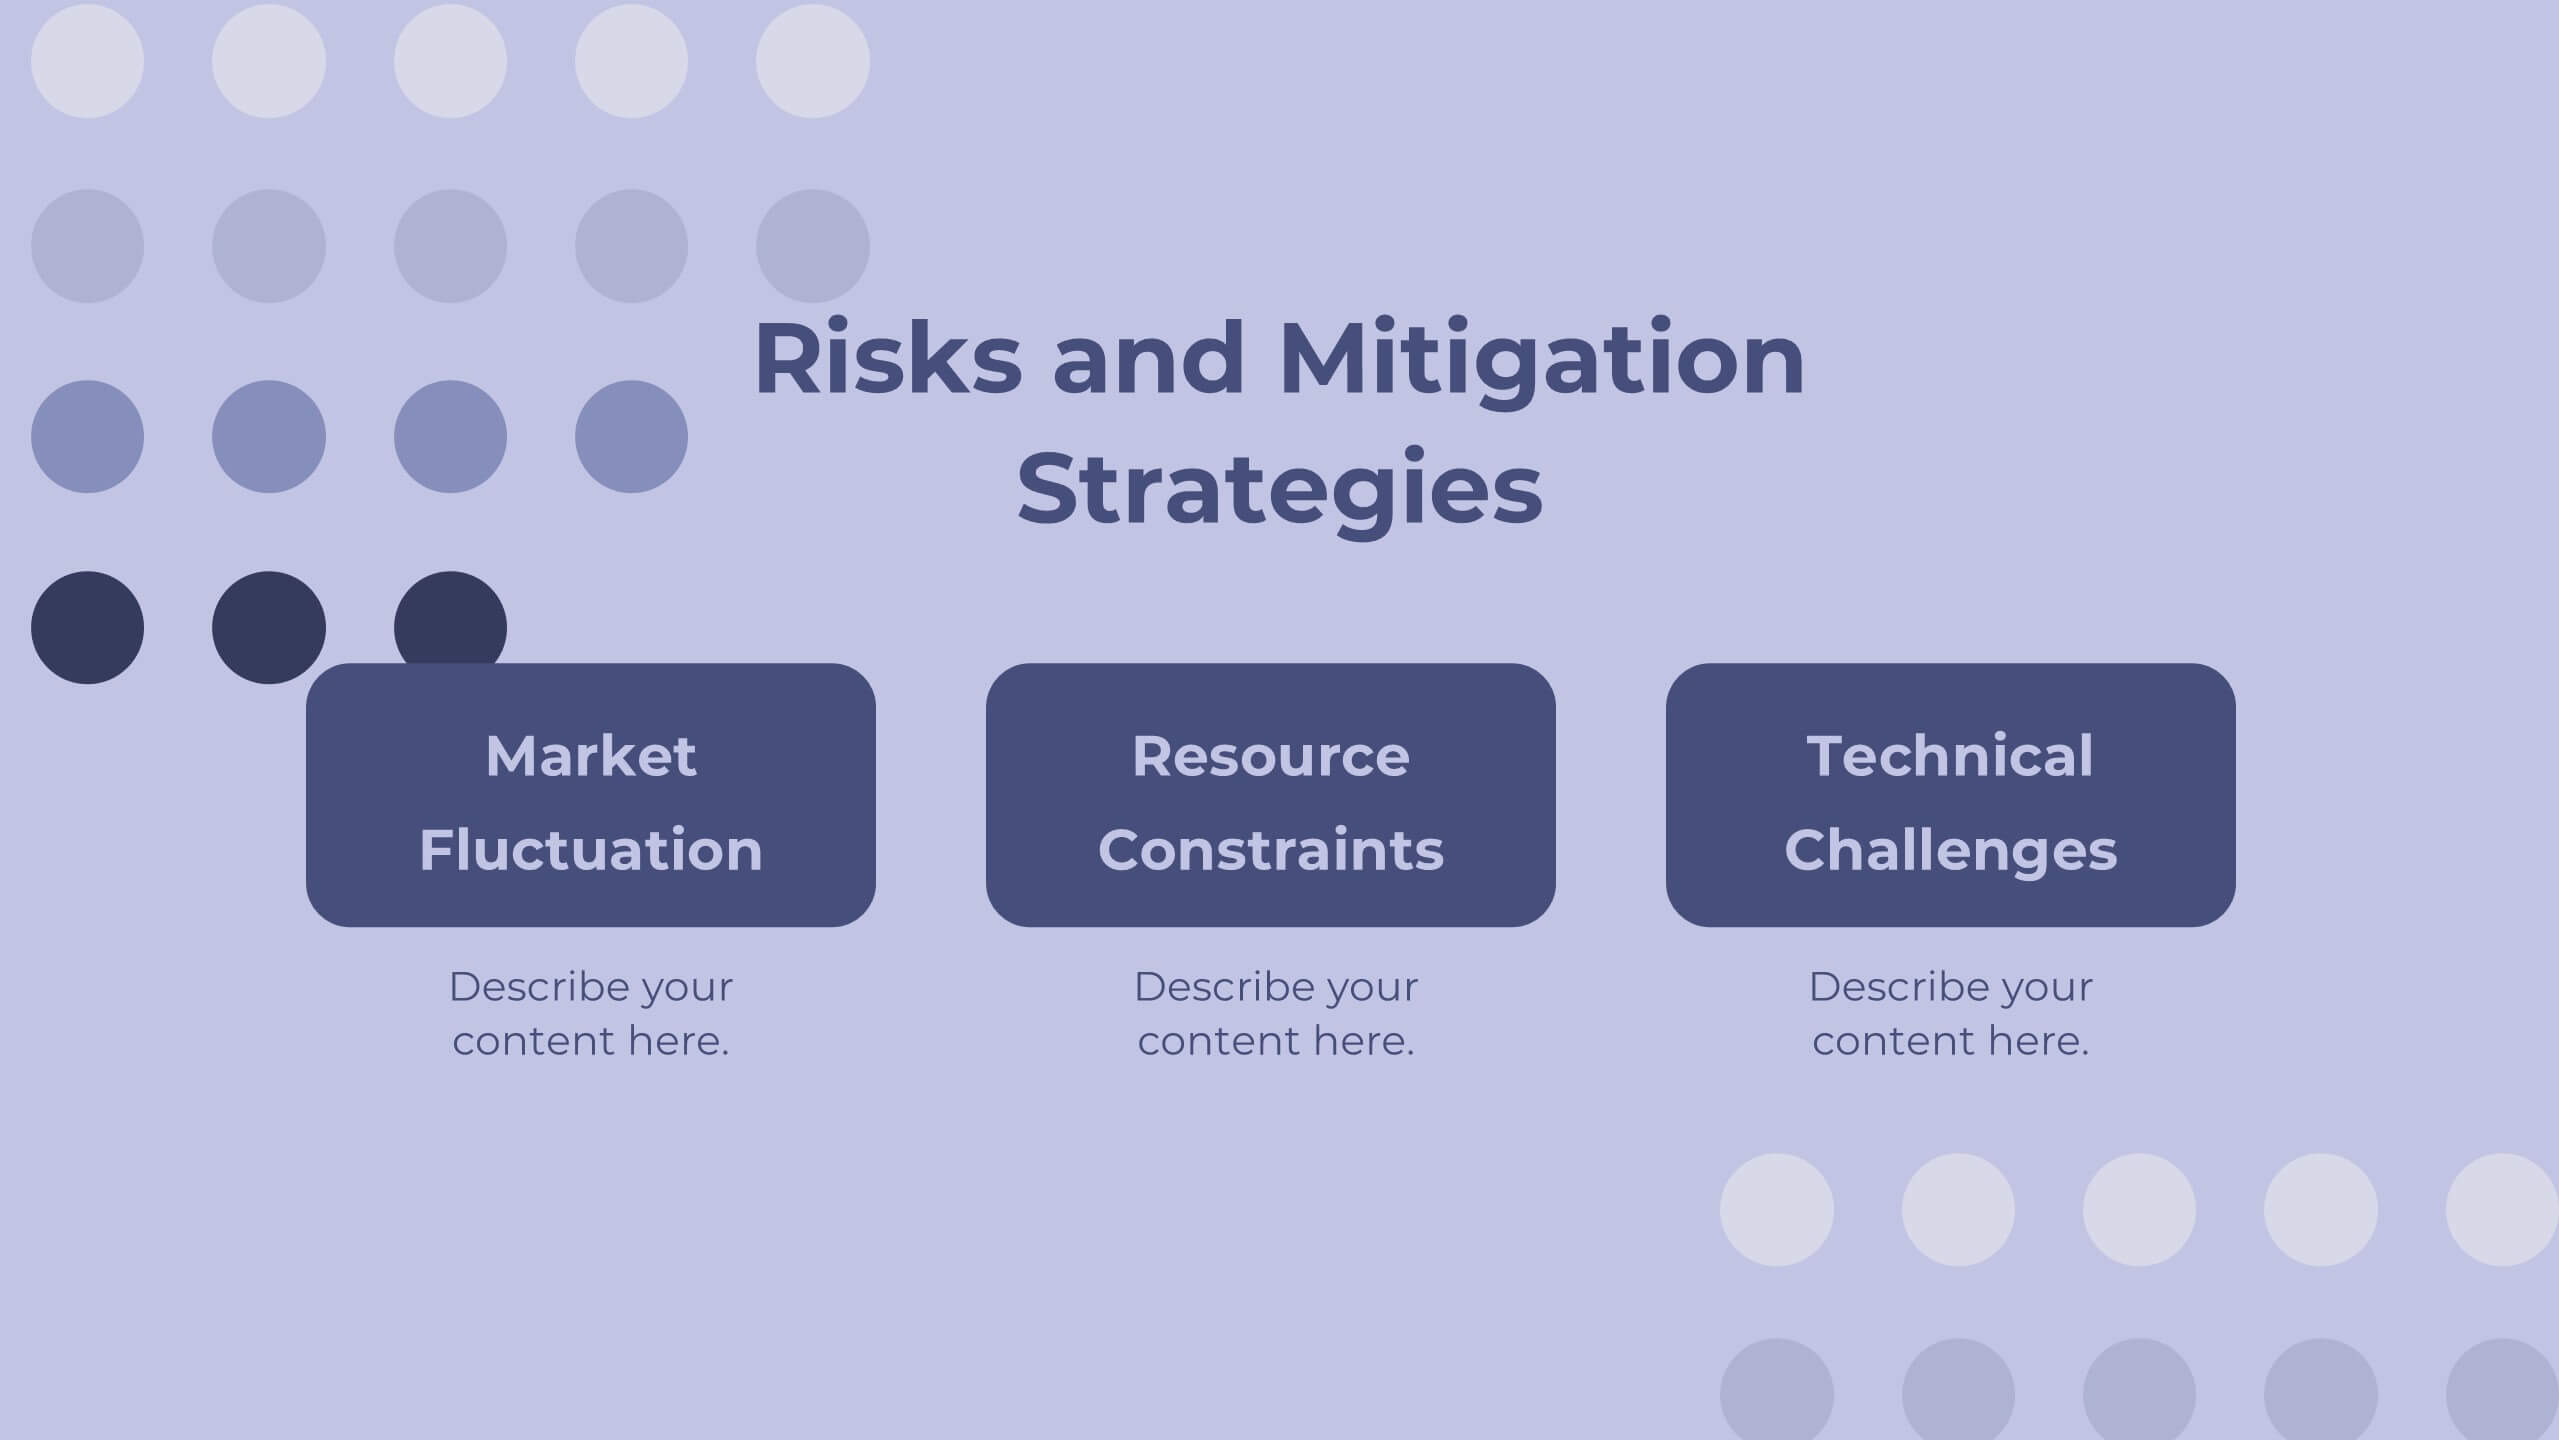
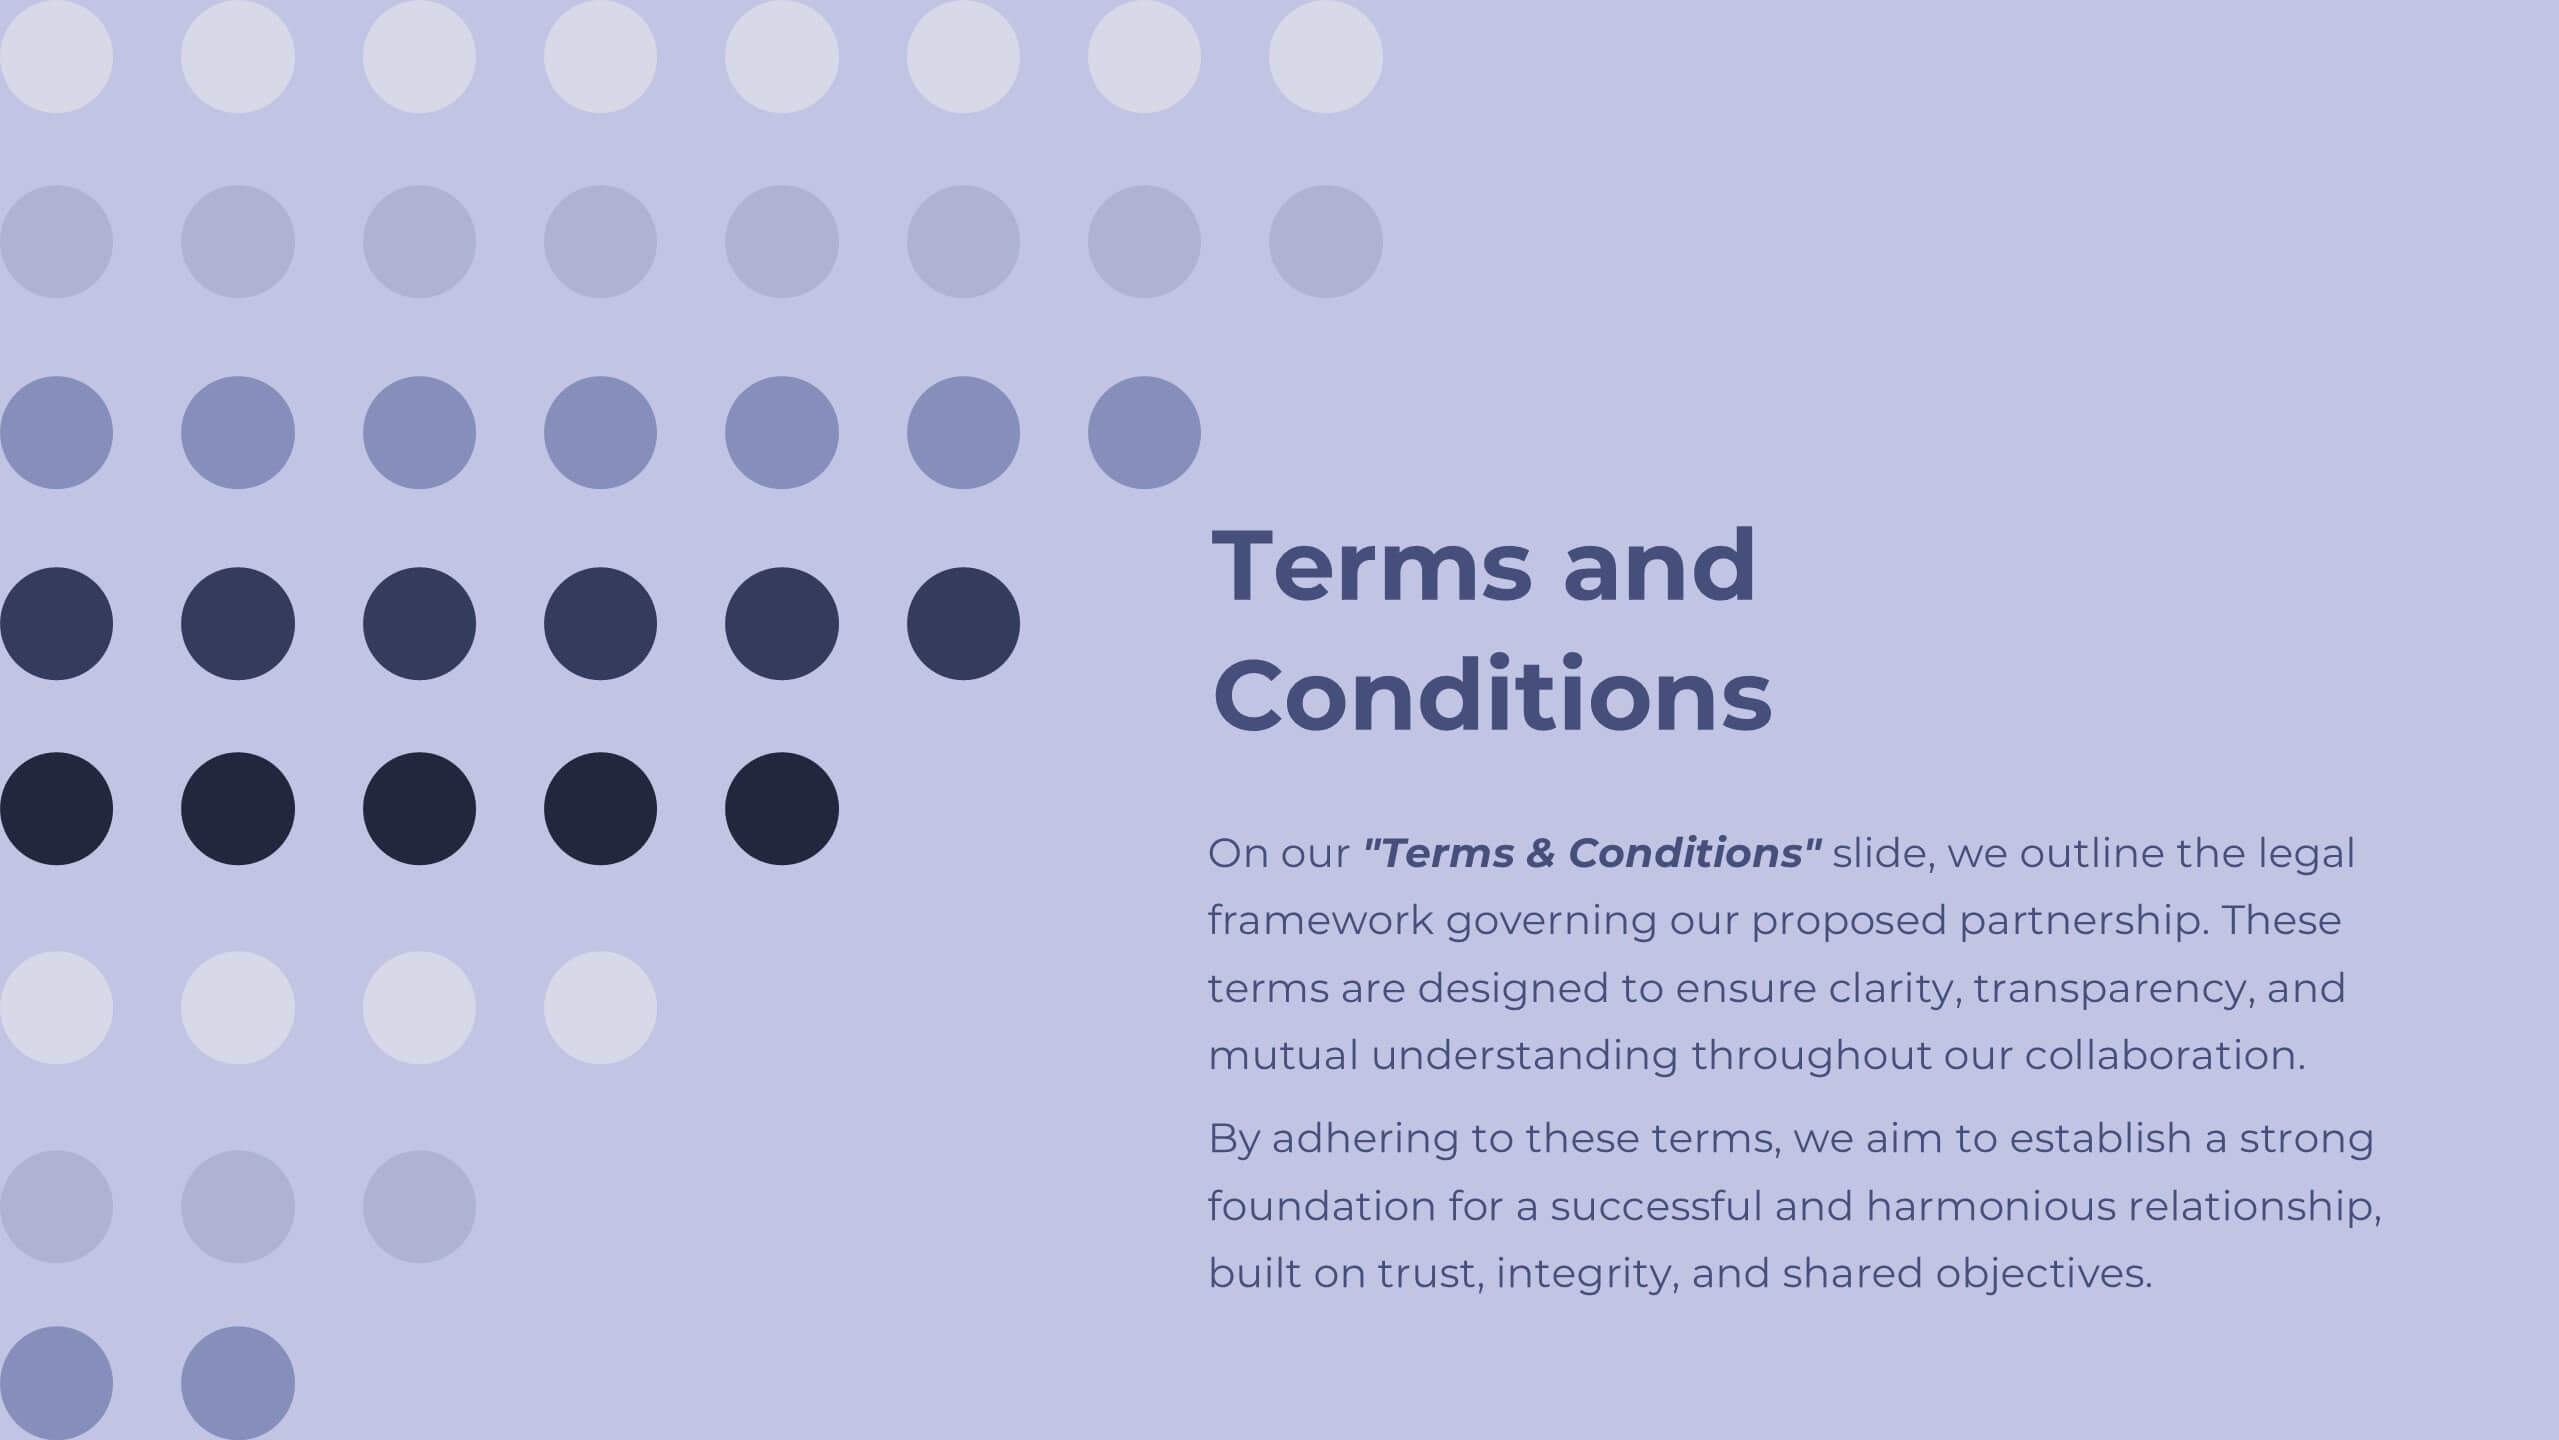
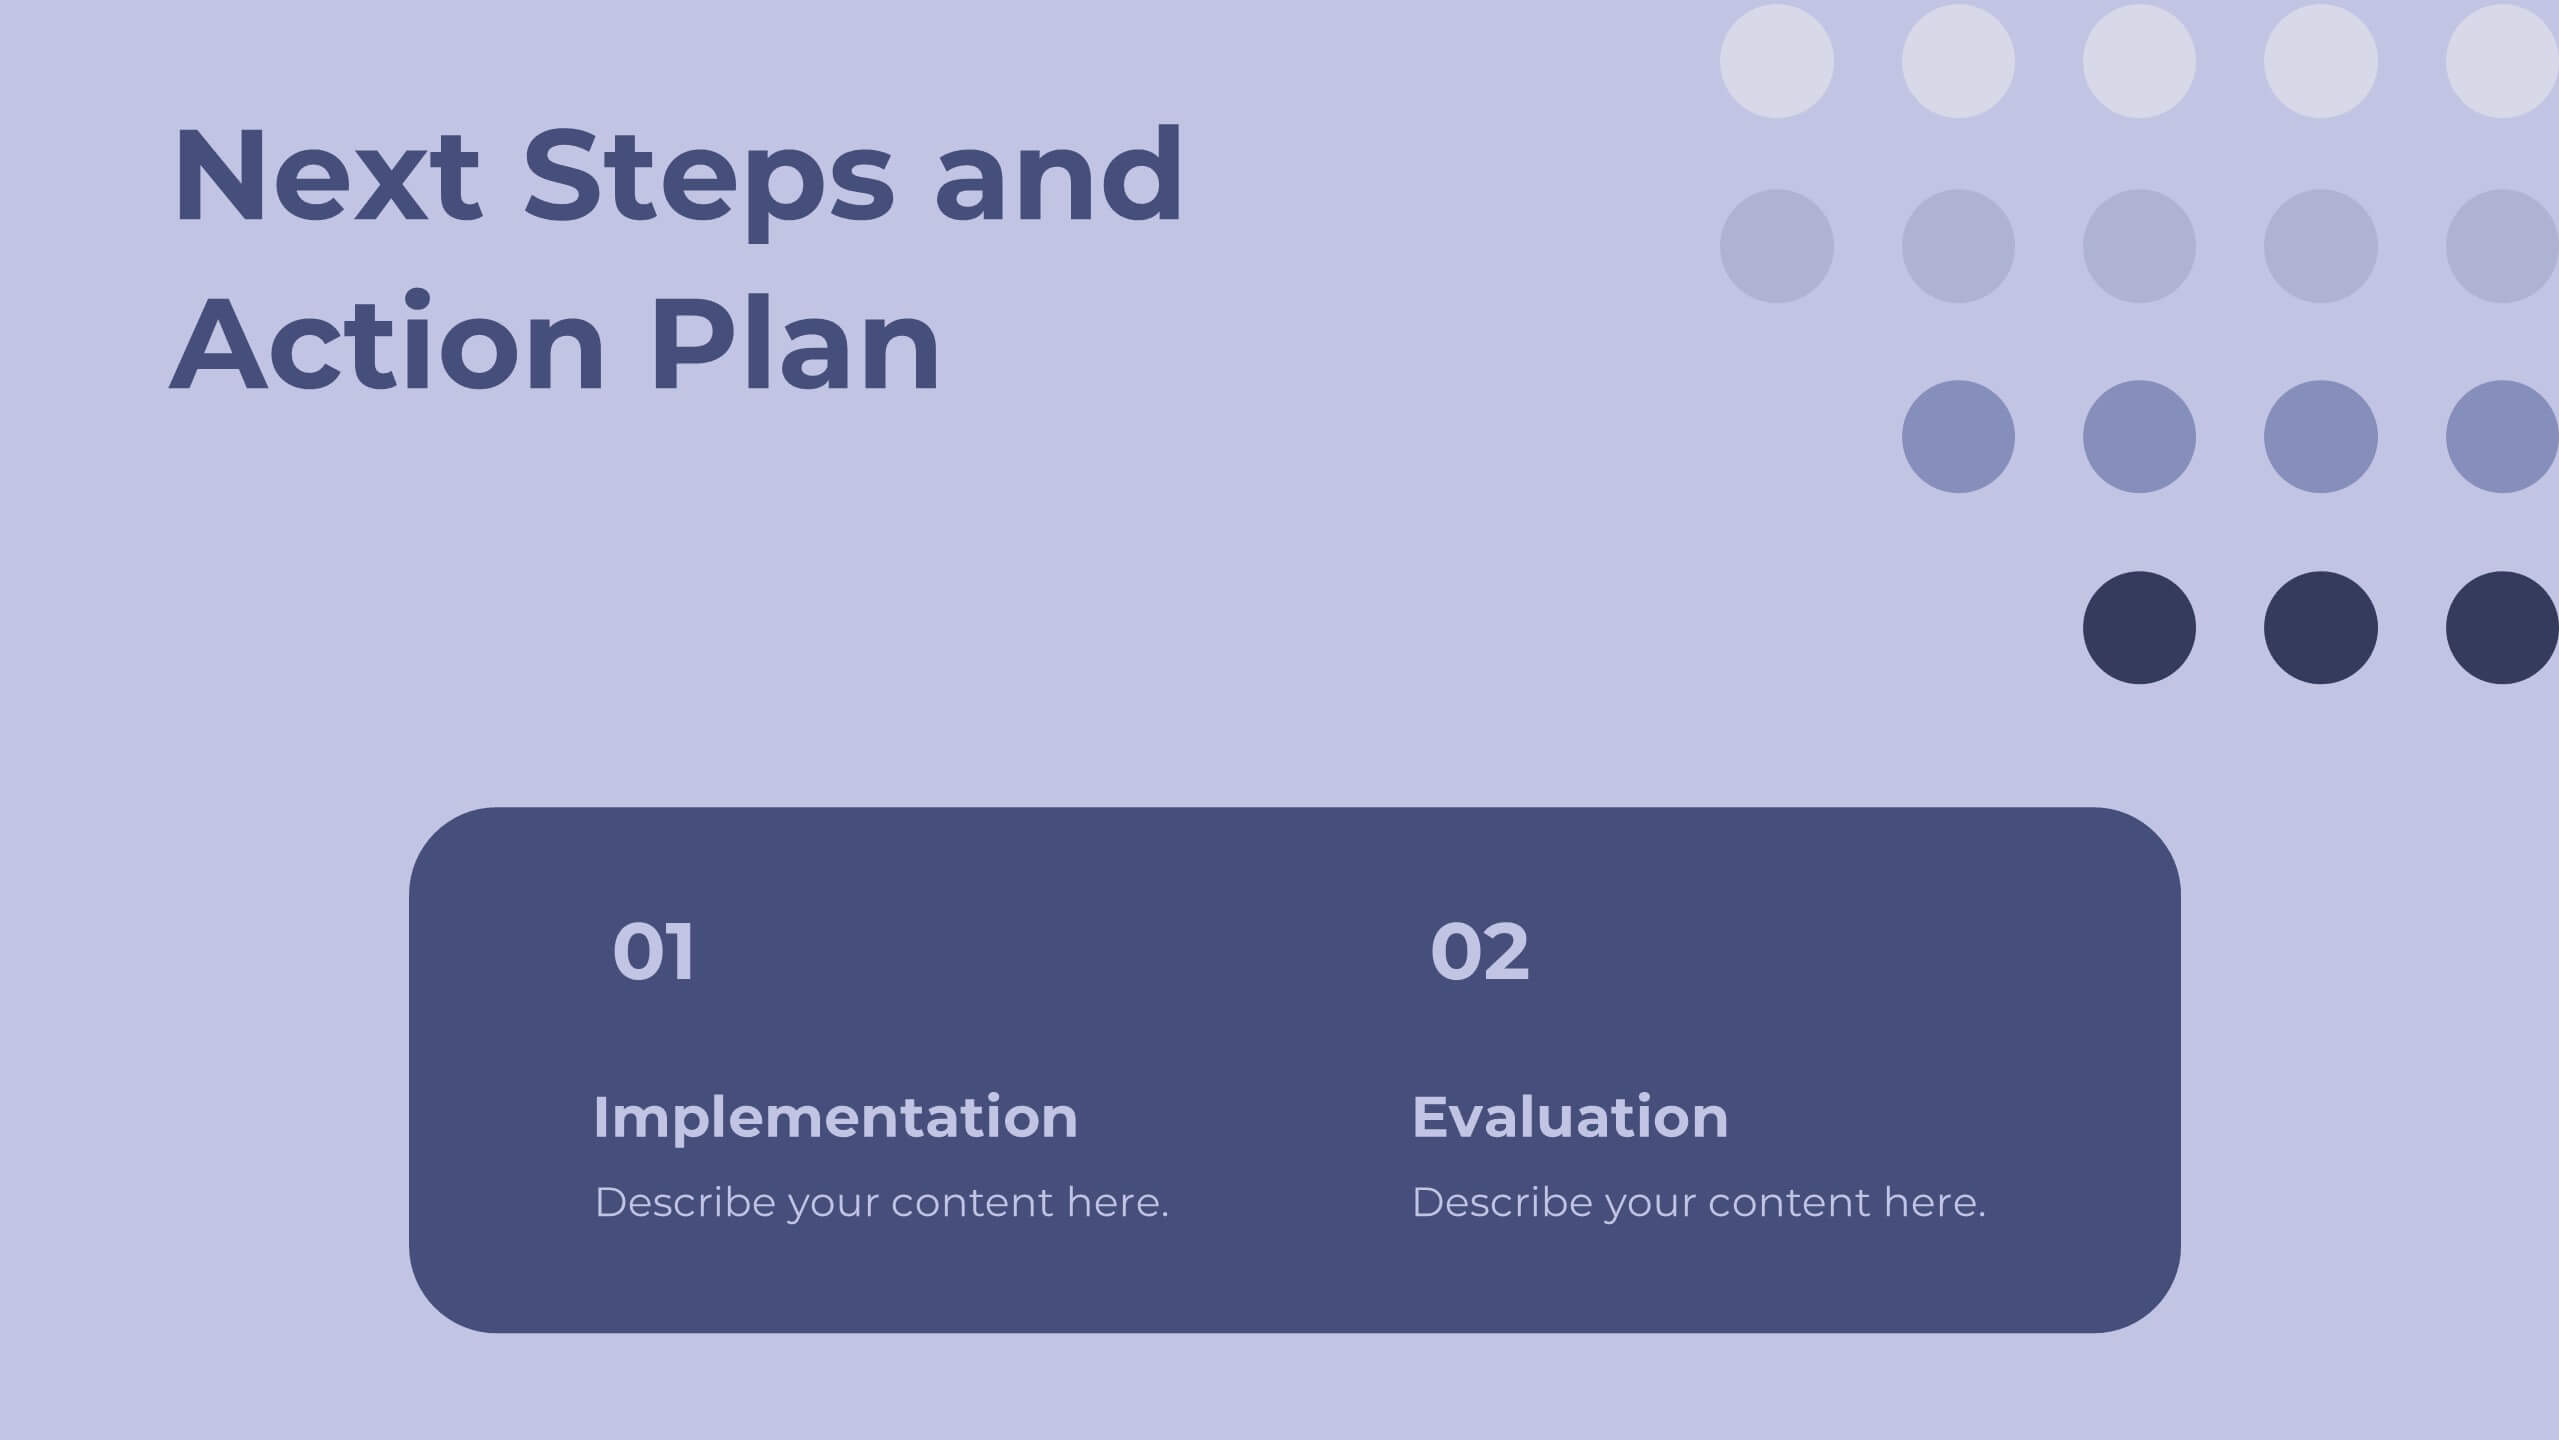
Arcflare Digital Agency Strategy Plan Presentation
Create a powerful strategy with this digital agency plan presentation! It features key sections like market analysis, industry trends, campaign execution, and client testimonials, helping you communicate your approach clearly. Perfect for strategy meetings or client pitches, this template is fully compatible with PowerPoint, Keynote, and Google Slides.


4 slides
Colorful Workflow Process Chart Presentation
Bring your workflow to life with a vibrant, easy-to-follow layout that makes every stage feel connected and purposeful. This presentation helps you map processes, explain team roles, and simplify complex steps using a clean, visual flow. Fully compatible with PowerPoint, Keynote, and Google Slides.


7 slides
Breast Cancer Signs Infographic
Step into the crucial arena of breast cancer awareness, where every statistic informs, every story inspires, and every shade carries significance. Swathed in the emblematic hue of pink, accented by the purity of white and the depth of blue, our infographic template conveys the urgency and importance of this cause. Featuring detailed infographics, intuitive icons, and poignant image placeholders, it serves as a comprehensive guide on the subject. Expertly designed for Powerpoint, Keynote, or Google Slides. An indispensable resource for medical professionals, awareness campaigners, or anyone invested in the fight against breast cancer. Engage, educate, empower.


6 slides
Investment Portfolio Breakdown Presentation
Give your financial insights a clean, confident voice with a layout designed to make complex data feel simple and strategic. This presentation helps you compare allocations, highlight key performance areas, and communicate investment decisions with clarity and ease. Fully editable and compatible with PowerPoint, Keynote, and Google Slides.


20 slides
Labyrinth Project Proposal Presentation
Present your project proposal with this clean and professional template! Covering sections such as objectives, scope of work, timeline, and budget breakdown, it helps you convey your plan clearly and effectively. Fully customizable and compatible with PowerPoint, Keynote, and Google Slides, it’s perfect for delivering impactful proposals to clients.


10 slides
Key Information Recap Summary
Conclude your presentation with clarity using this Key Information Recap Summary slide. Featuring a modern key-shaped design with four customizable sections, it’s perfect for summarizing essential insights. Fully compatible with PowerPoint, Keynote, and Google Slides.