


Features
- 5 Unique slides
- Fully editable and easy to edit in Microsoft Powerpoint, Keynote and Google Slides
- 16:9 widescreen layout
- Clean and professional designs
- Export to JPG, PDF or send by email


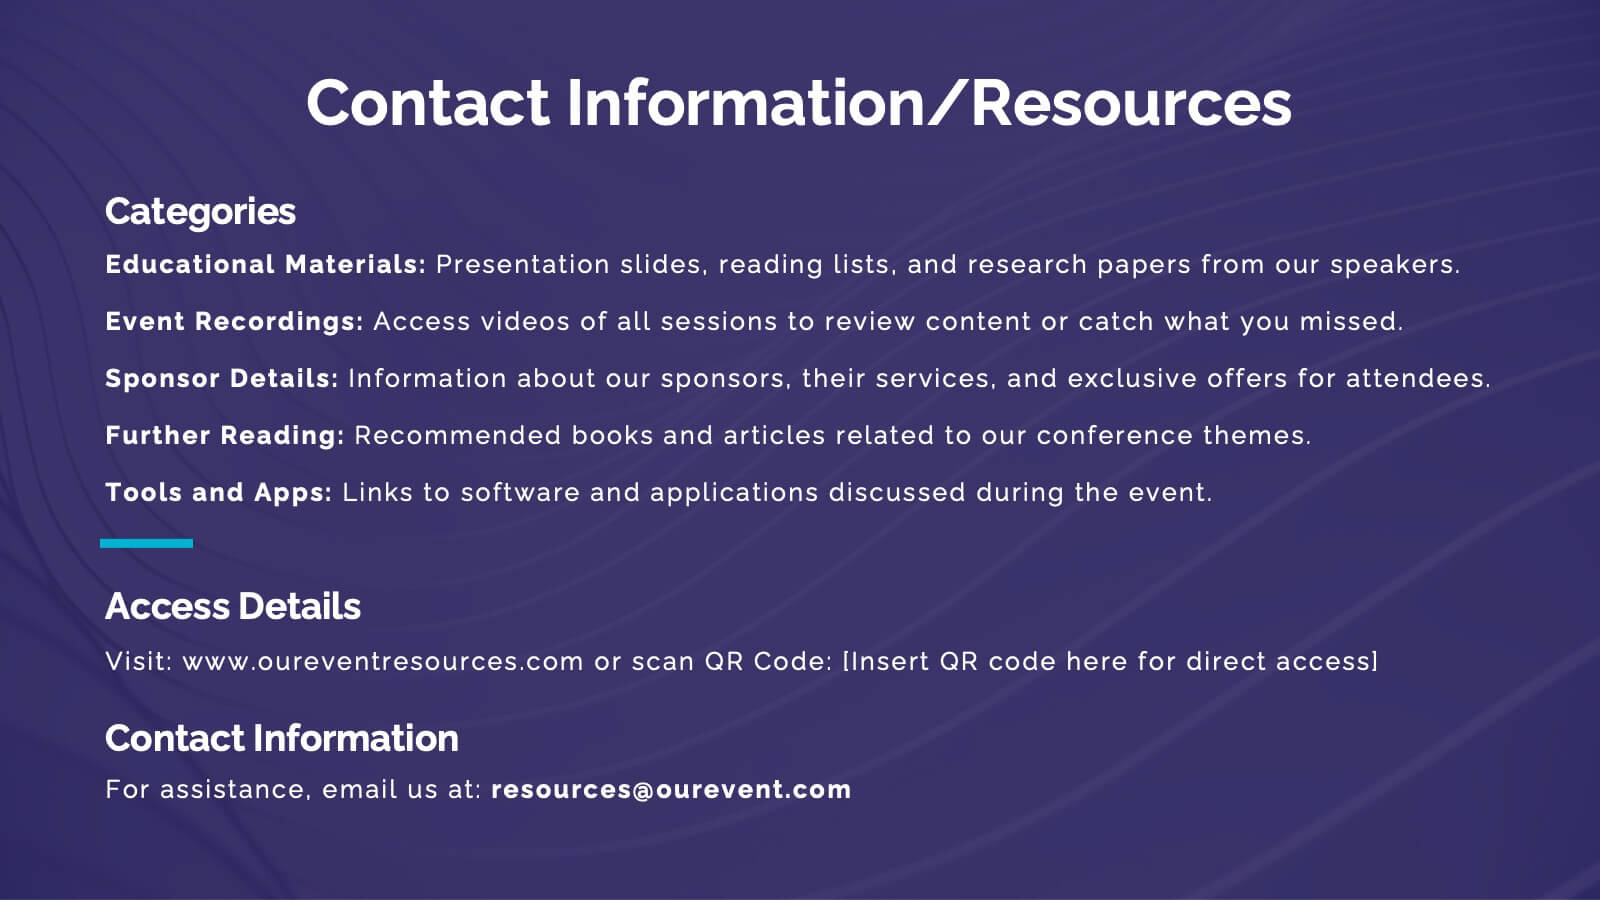
Do you have any questions?
Recommend


6 slides
User Experience Rating System Presentation
Evaluate user satisfaction with this user experience rating system template! Designed to visually represent feedback levels, this structured layout helps businesses analyze customer experiences, identify strengths, and address pain points. Perfect for UX research, surveys, and performance assessments. Fully customizable and compatible with PowerPoint, Keynote, and Google Slides


5 slides
Medical Supplies Infographics
Medical supplies refer to the various equipment, instruments, tools, and consumables that are used in healthcare settings to diagnose, treat, and manage medical conditions. These vertical infographics provide an overview of essential medical supplies used in healthcare settings. They aims to educate and raise awareness about the importance of medical supplies in delivering quality patient care and maintaining a safe healthcare environment. The infographics utilize visually appealing graphics, icons, and color schemes that are relevant to the medical field. These visuals help viewers easily recognize and understand the different types of supplies.


34 slides
Founder Startup
A Founder Startup, is a newly established business venture that is typically founded by one or more individuals or groups with an innovative idea, concept, or product. This template is designed to help you create a professional and compelling presentation that showcases your startup and its founders in a impactful way. Compatible with PowerPoint, Keynote, and Google Slides. Included in this template are a variety of pre-designed slides that will help cover different aspects of your startup, such as team introduction, overview, vision and mission, product or service description, market analysis, financials, and more.


10 slides
Business Model Hexagon Infographic
Break down your strategy into clear, modular components with the Business Model Hexagon Infographic Presentation. This visually engaging layout features five interlinked hexagons, each labeled and icon-marked for easy segmentation of your business pillars—such as value propositions, customer channels, key partners, and revenue streams. The vertical stack ensures a logical flow while keeping your message structured and professional. Fully editable in PowerPoint, Keynote, and Google Slides, allowing you to tailor icons, text, and colors to match your business theme.


8 slides
Checklist and Action Item List
Bring order to your tasks with this modern checklist design, ideal for highlighting project milestones, team assignments, or key deliverables. Featuring three editable points with accompanying icons, this layout ensures clarity and professionalism in every update. Fully customizable in PowerPoint, Keynote, and Google Slides.


5 slides
Search Engine Marketing Analysis Presentation
Showcase your SEM insights with a presentation slide that’s as sharp as your strategy. This layout helps you break down ad performance, keyword data, and campaign elements clearly and visually. Perfect for marketers presenting to clients or teams, and fully compatible with PowerPoint, Keynote, and Google Slides.


23 slides
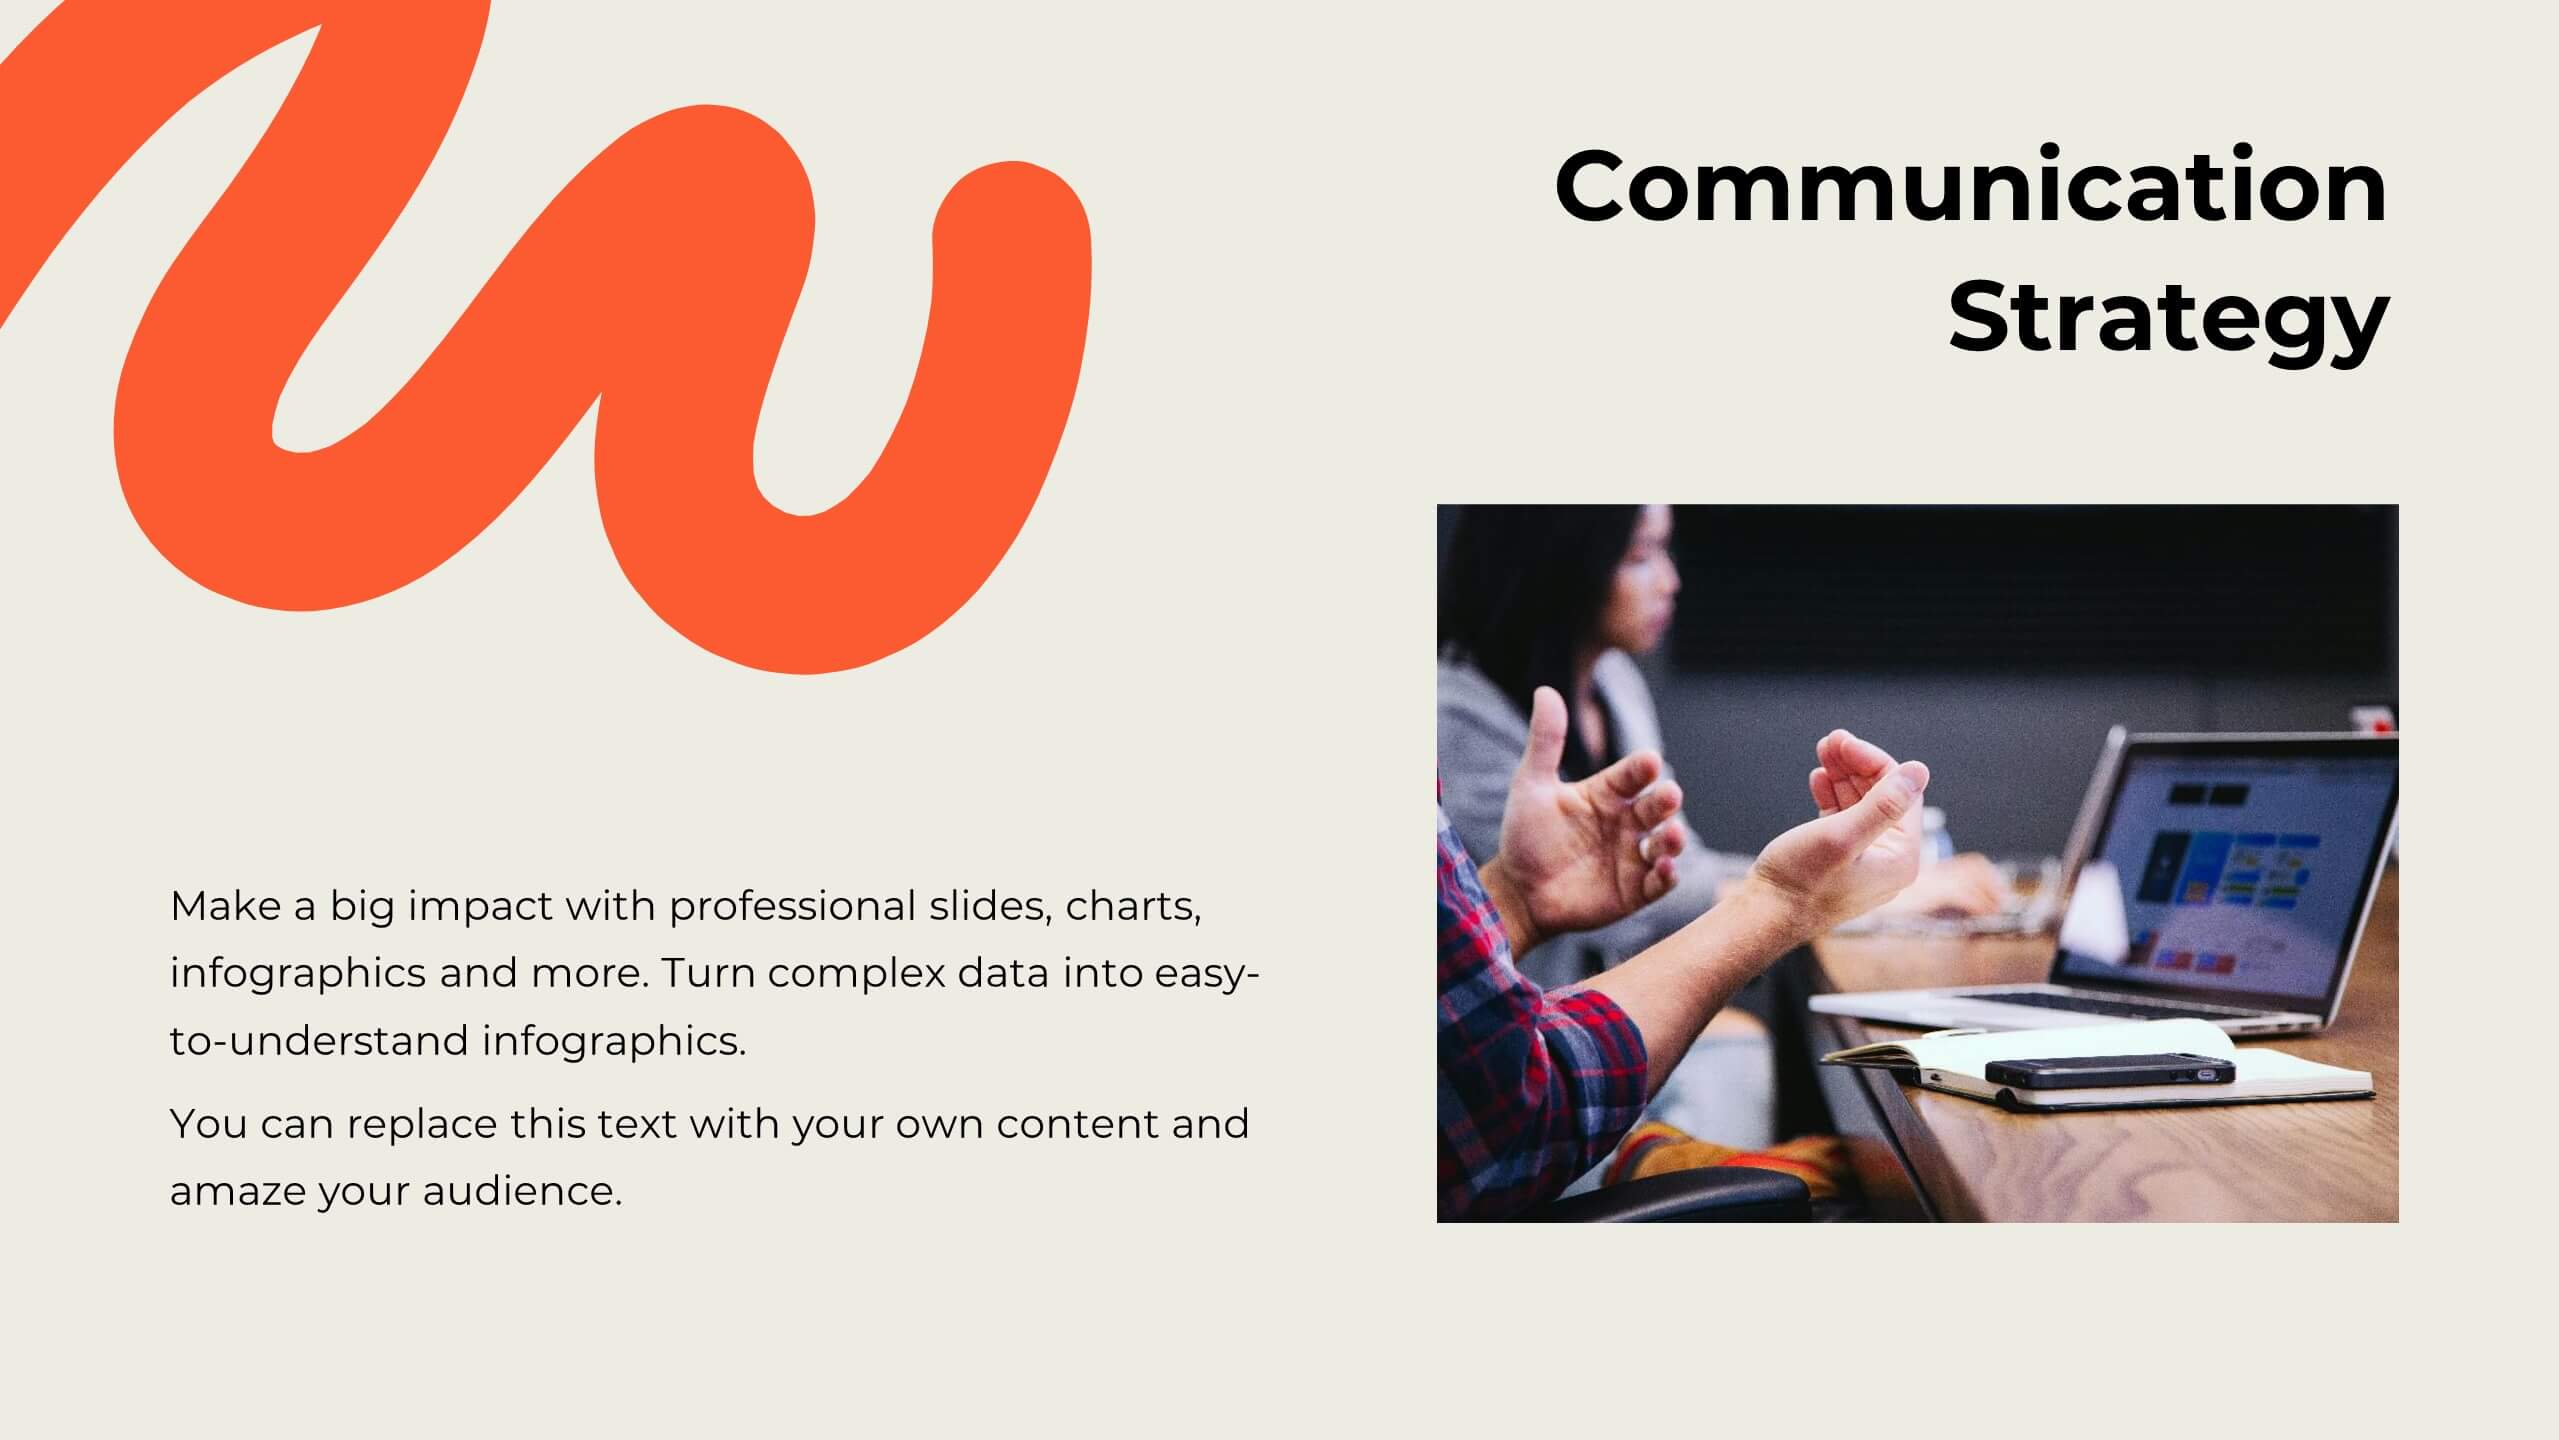
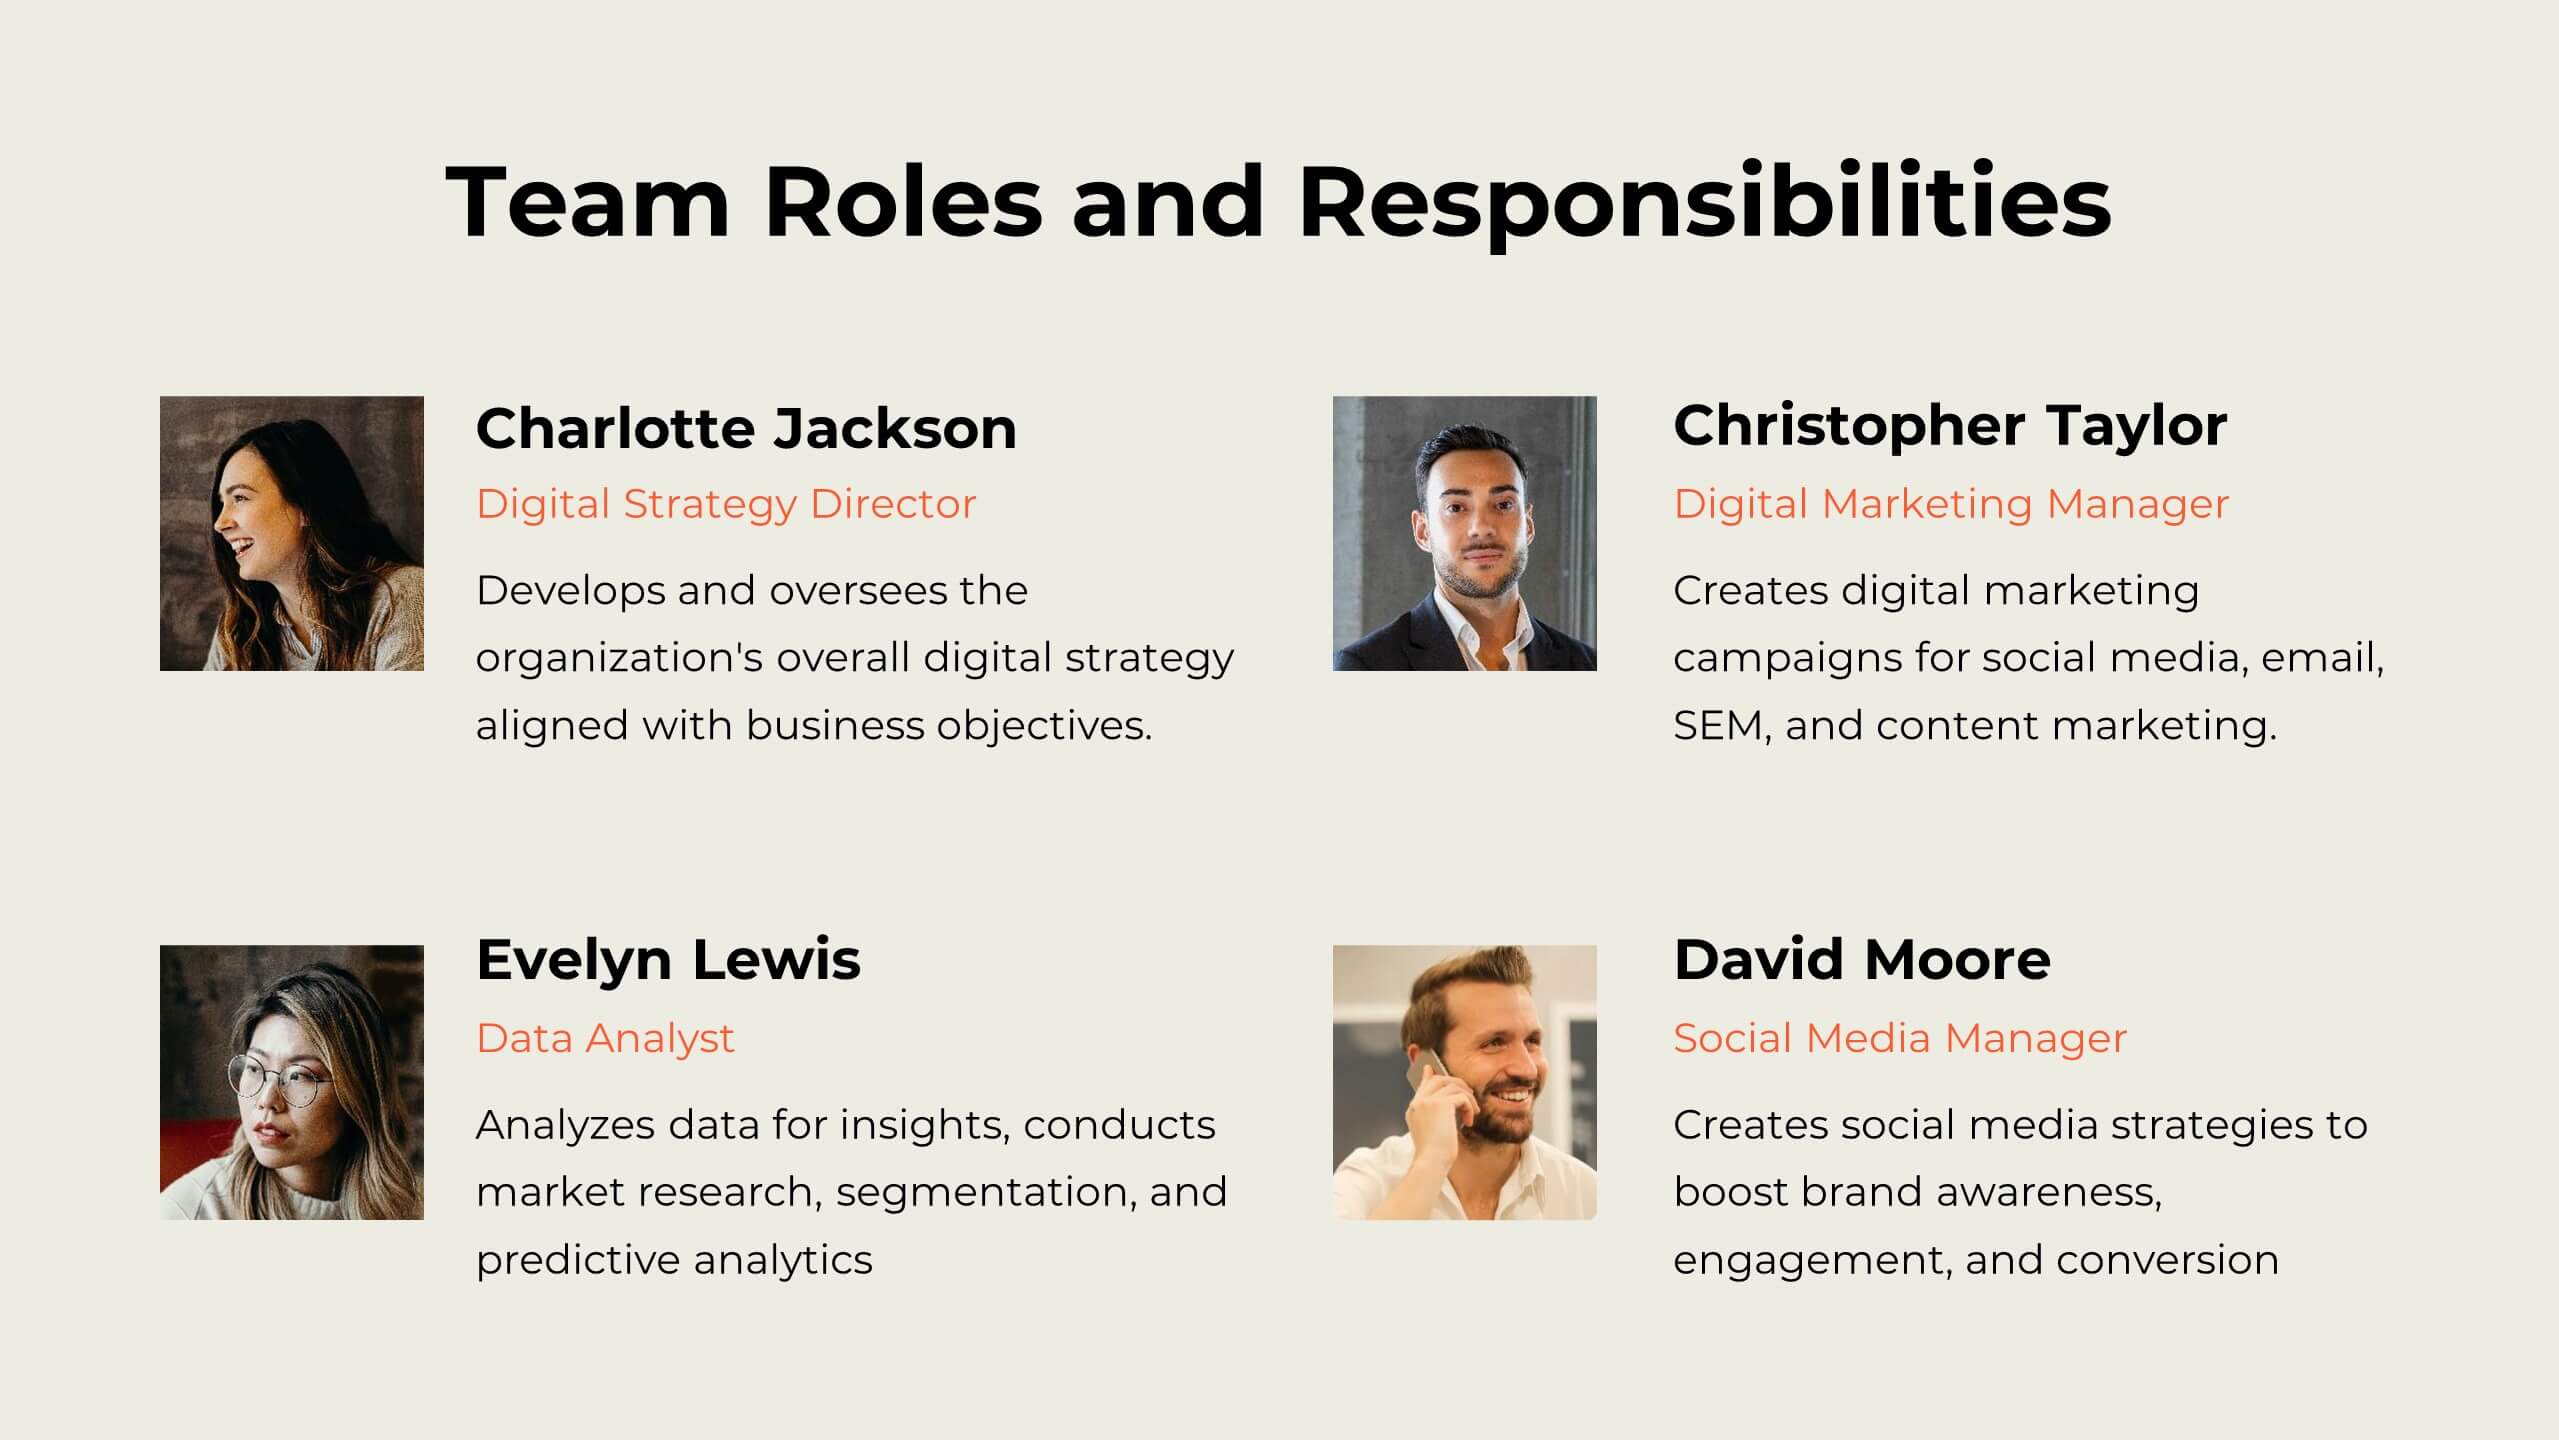
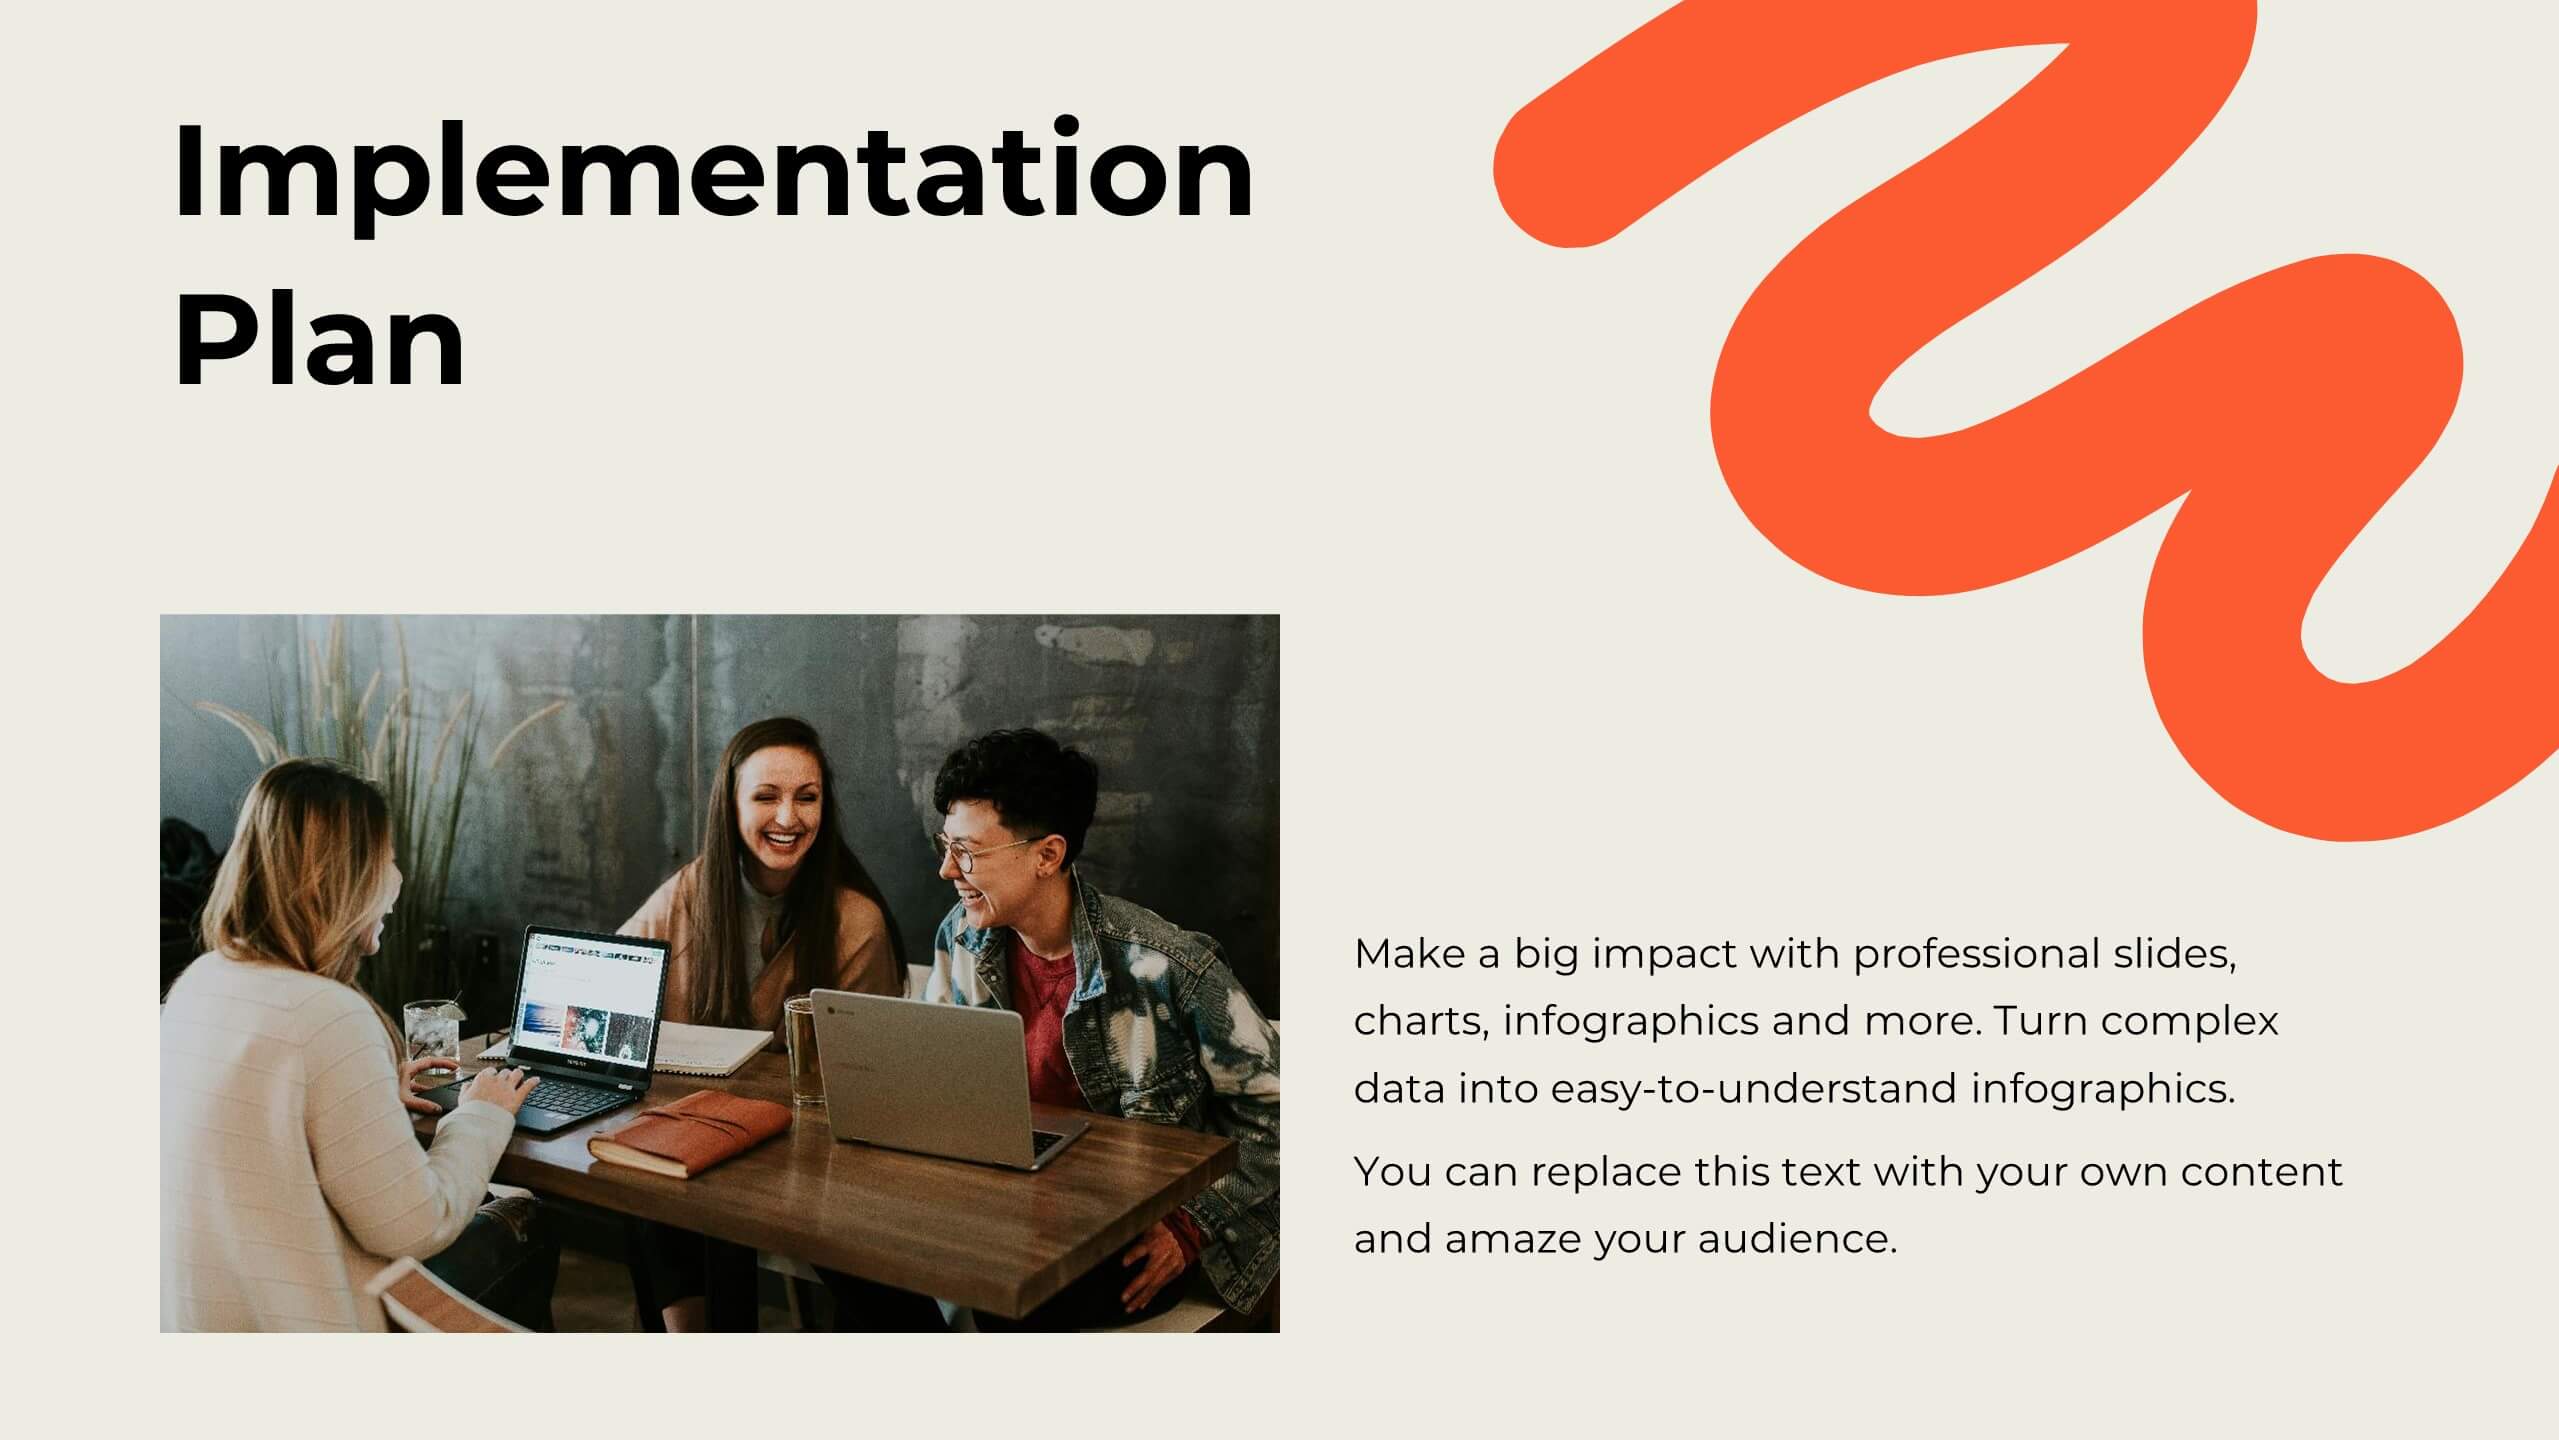
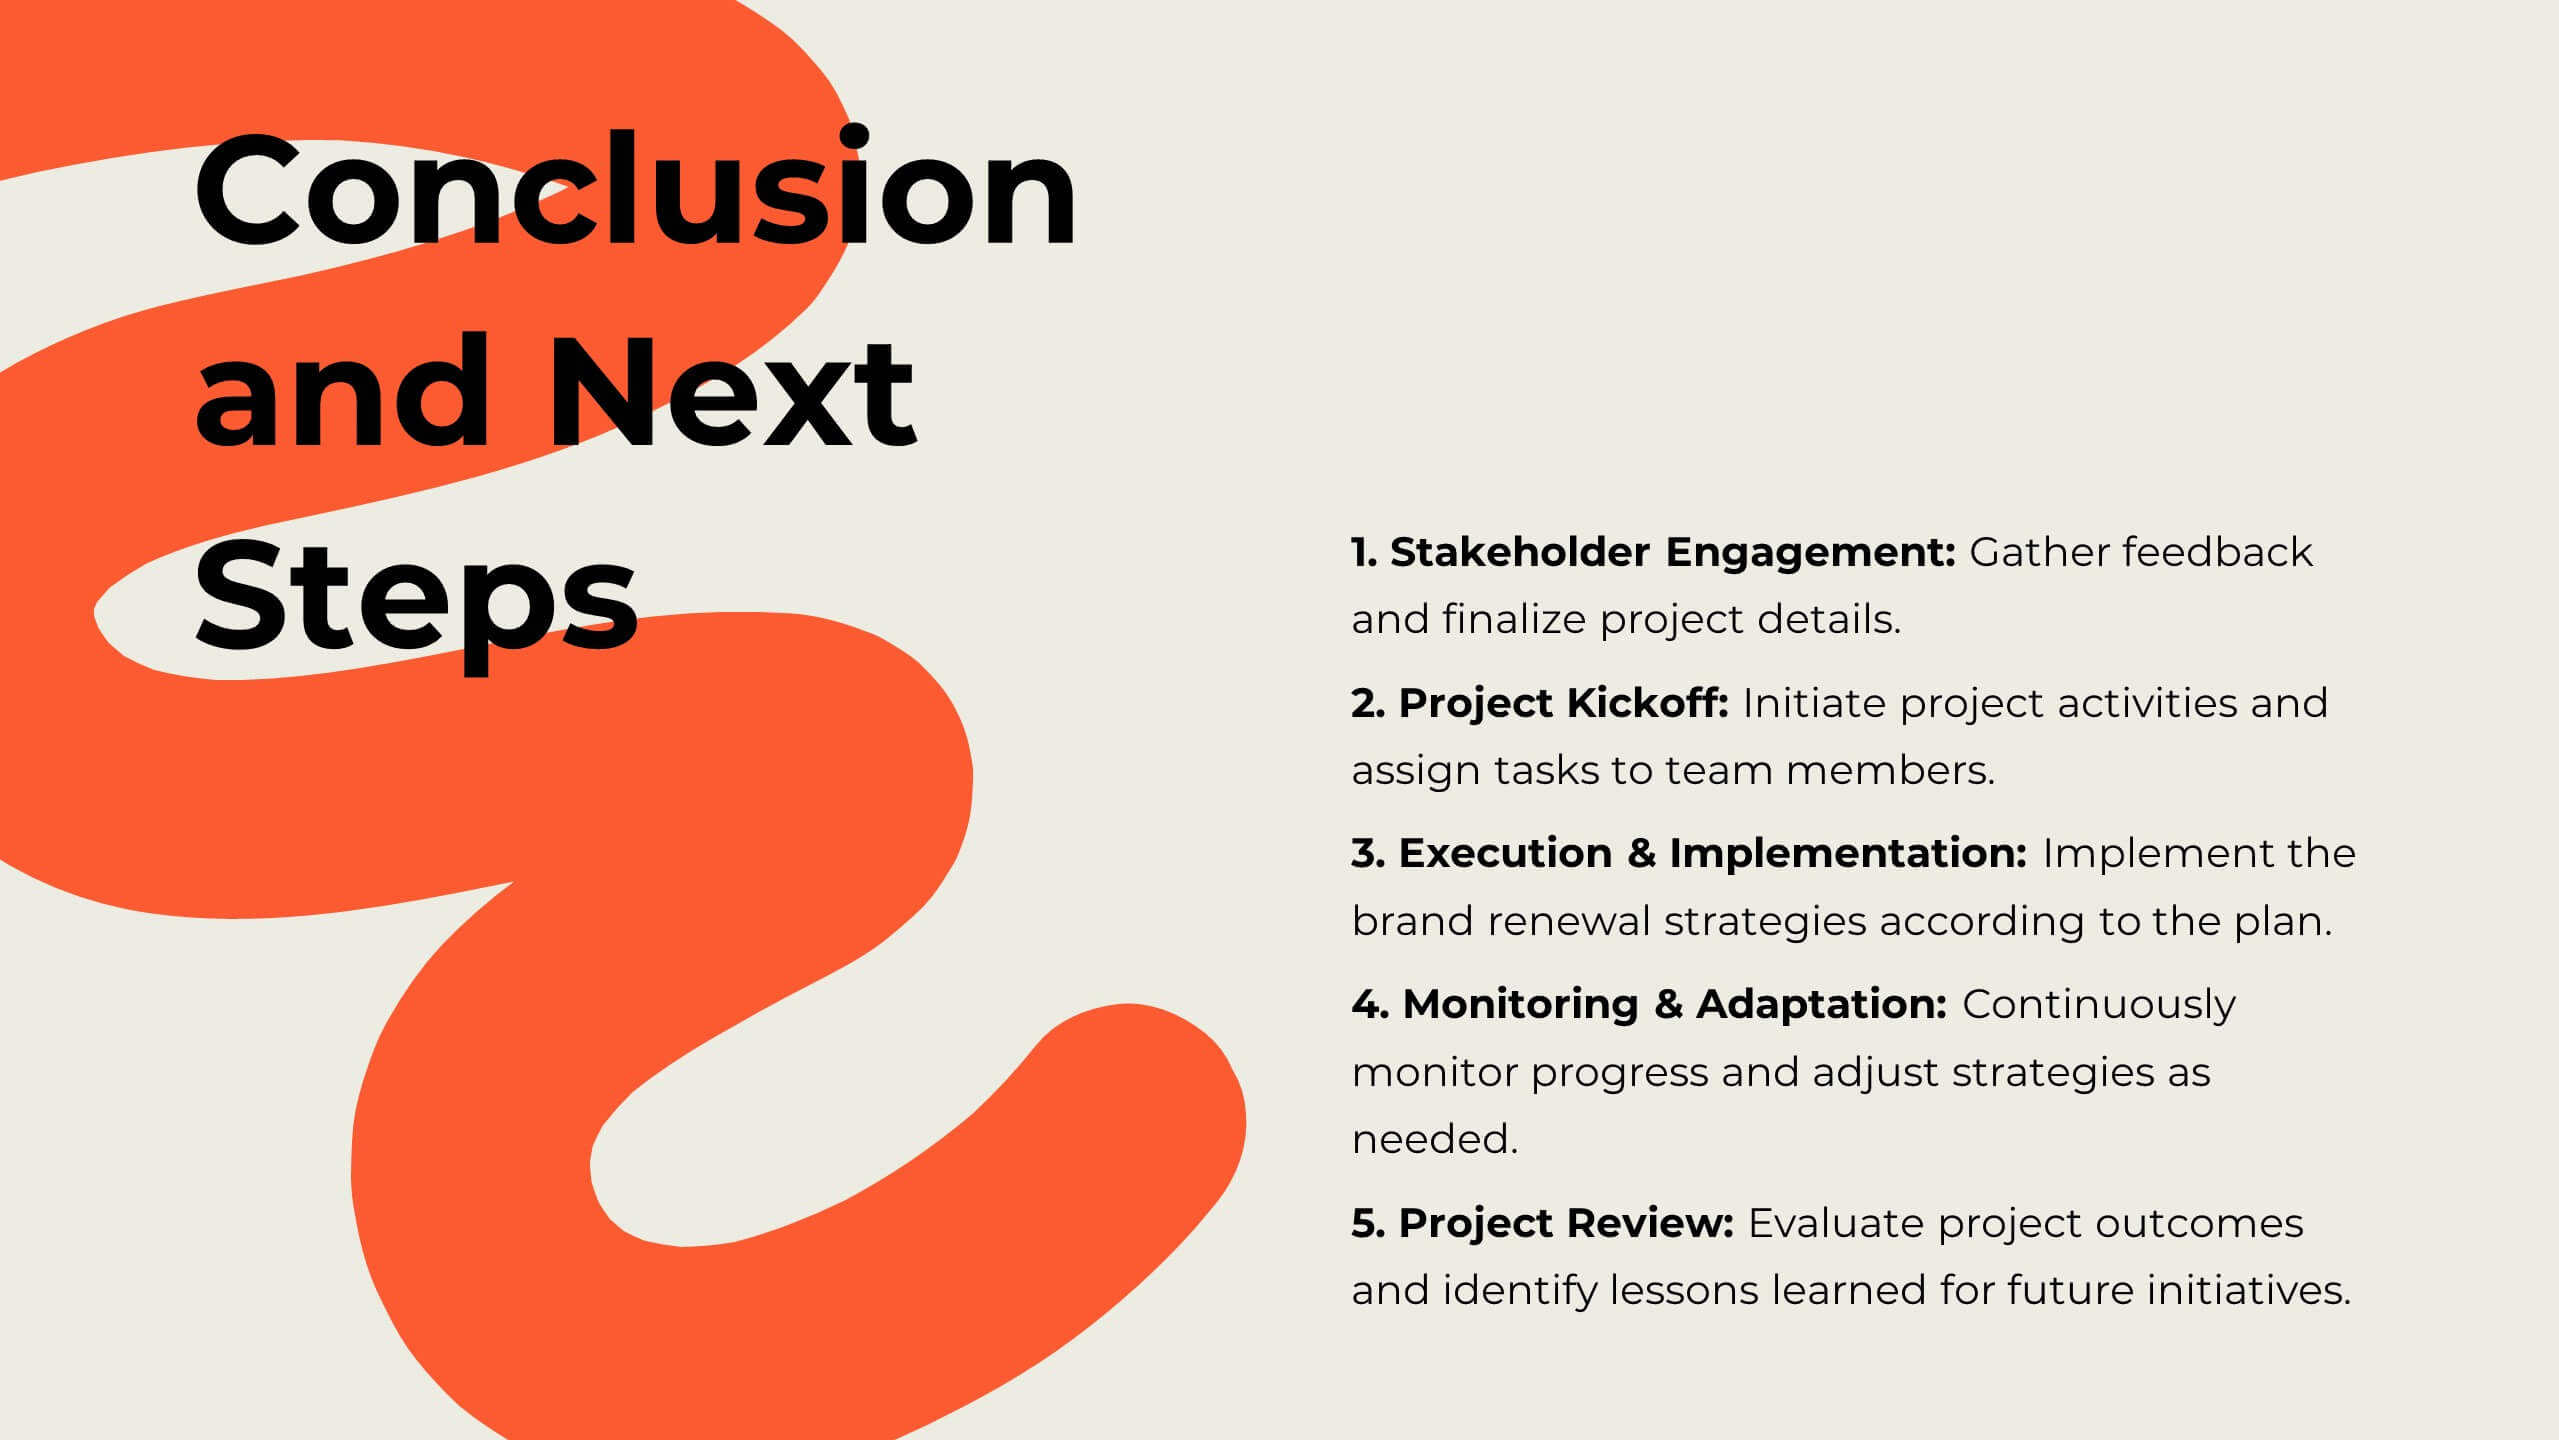
Mirage Digital Strategy Presentation
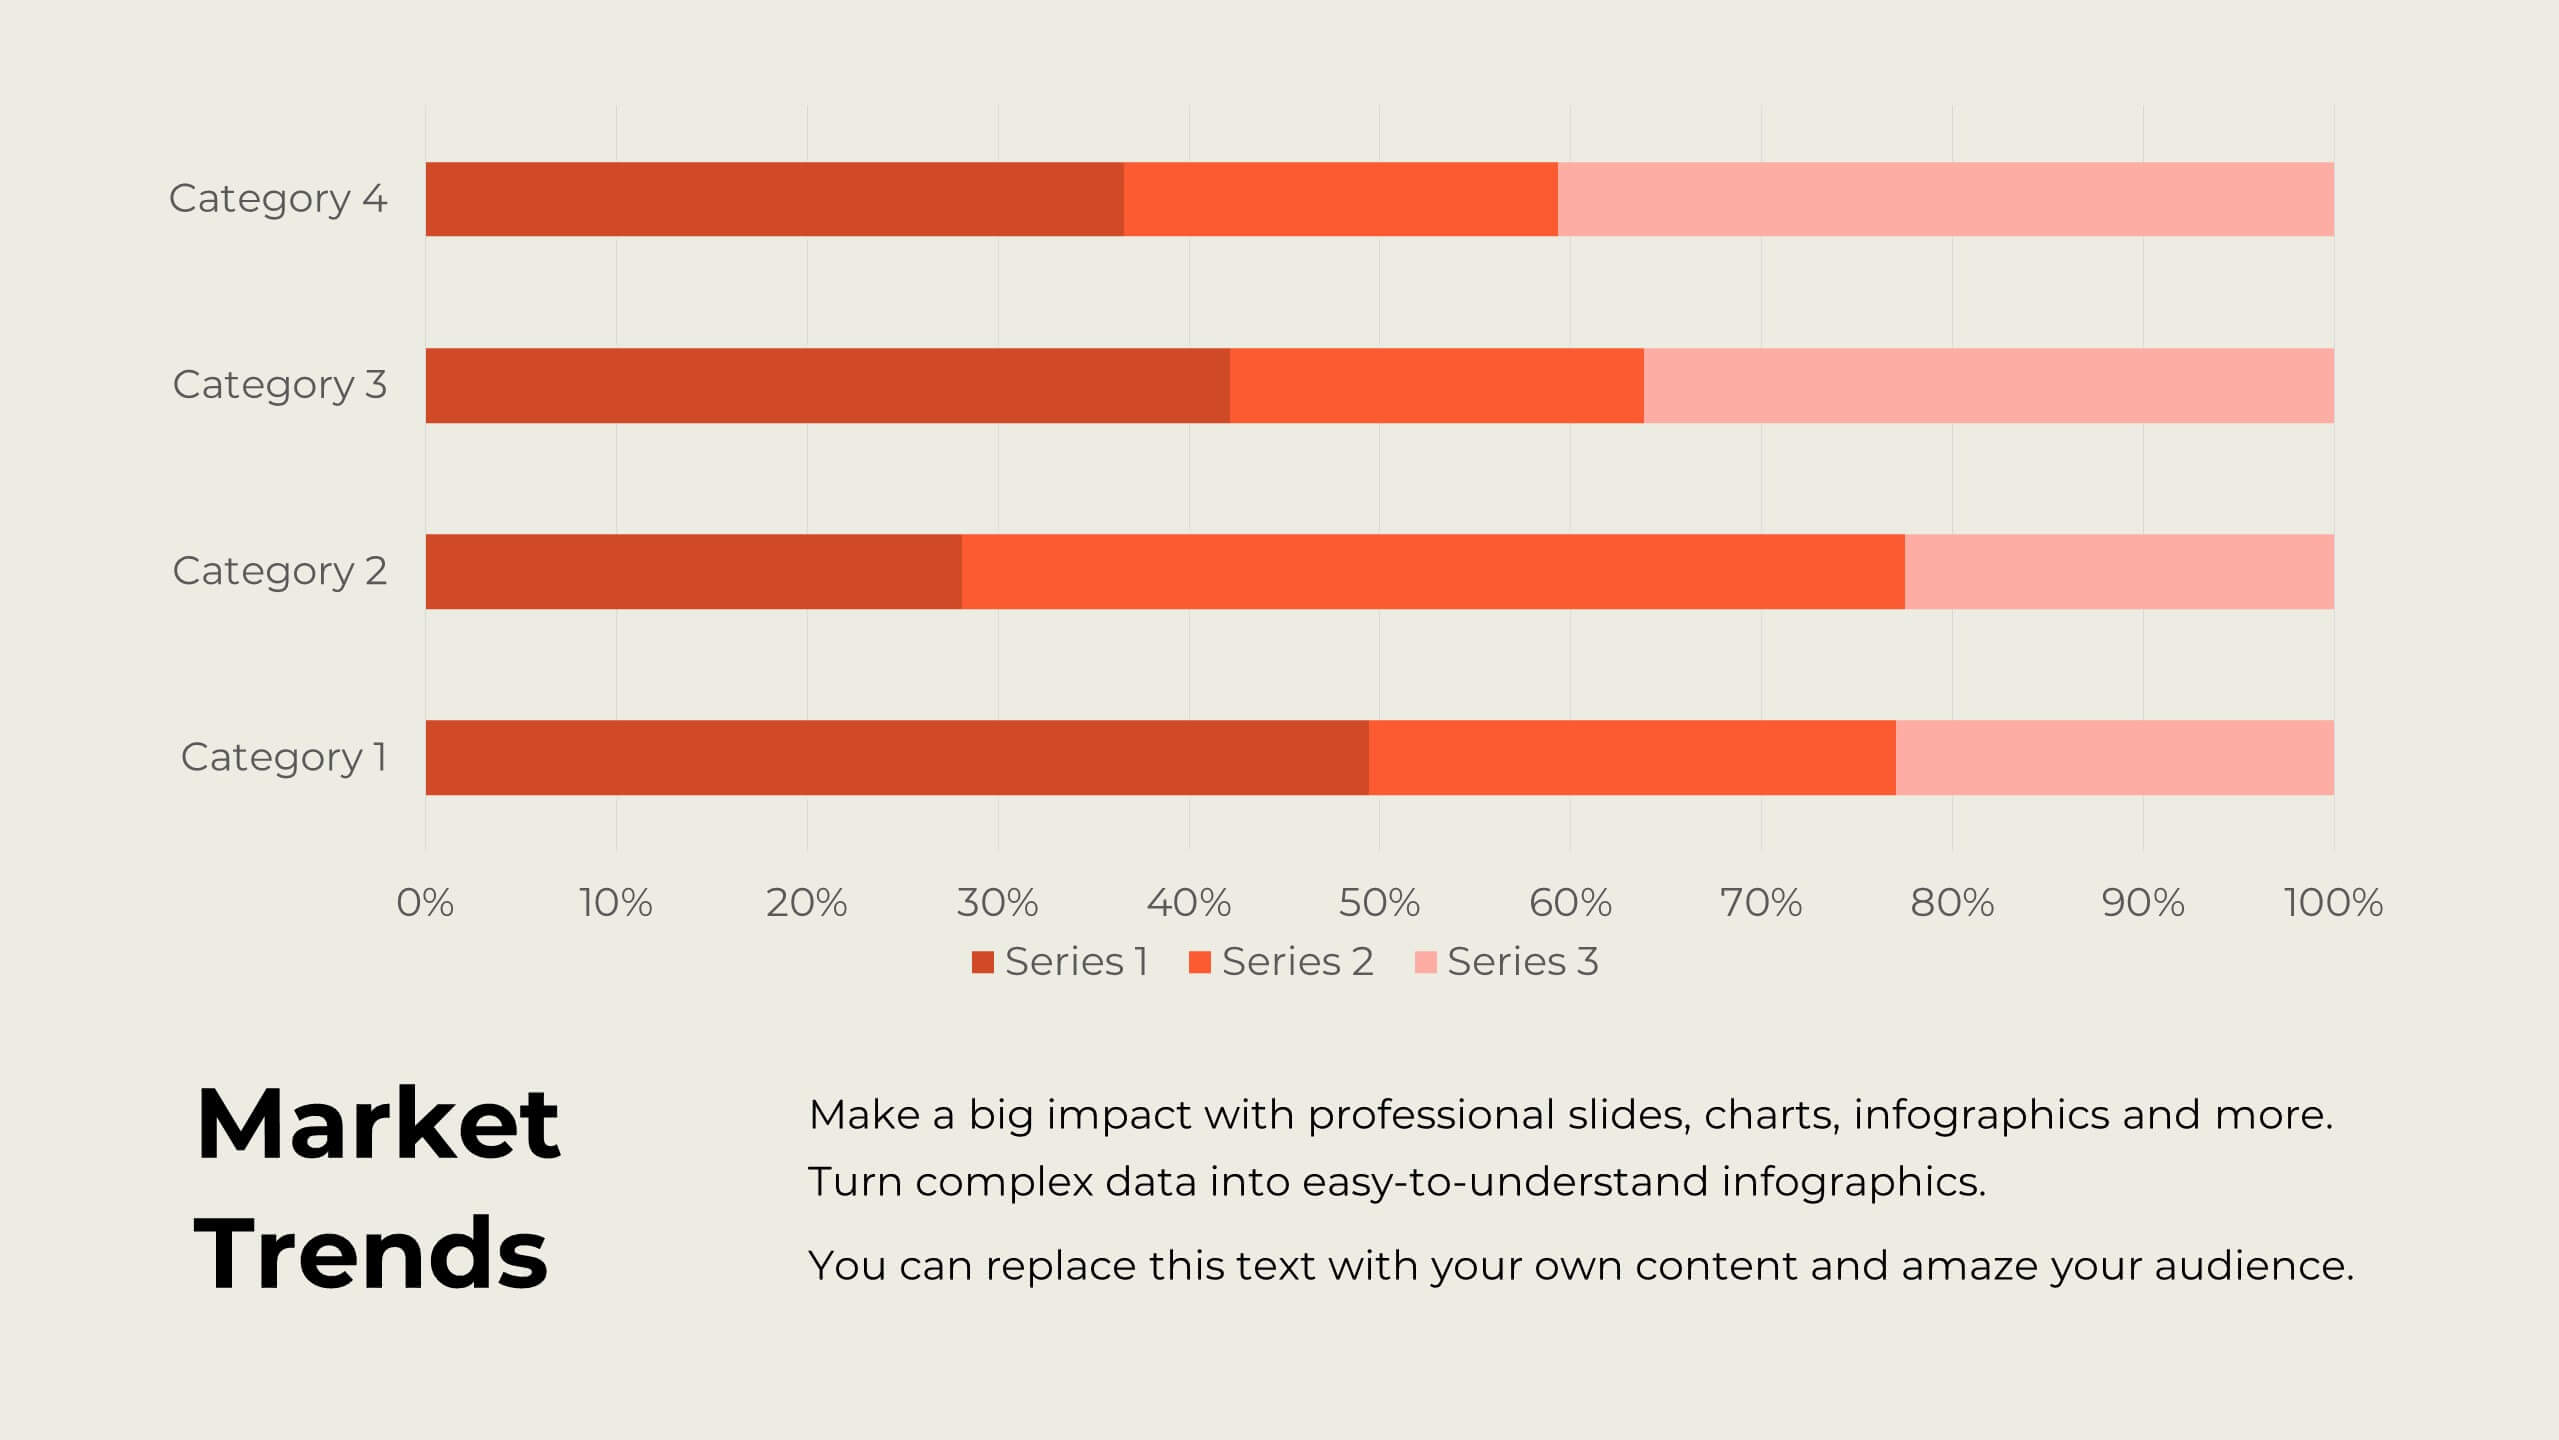
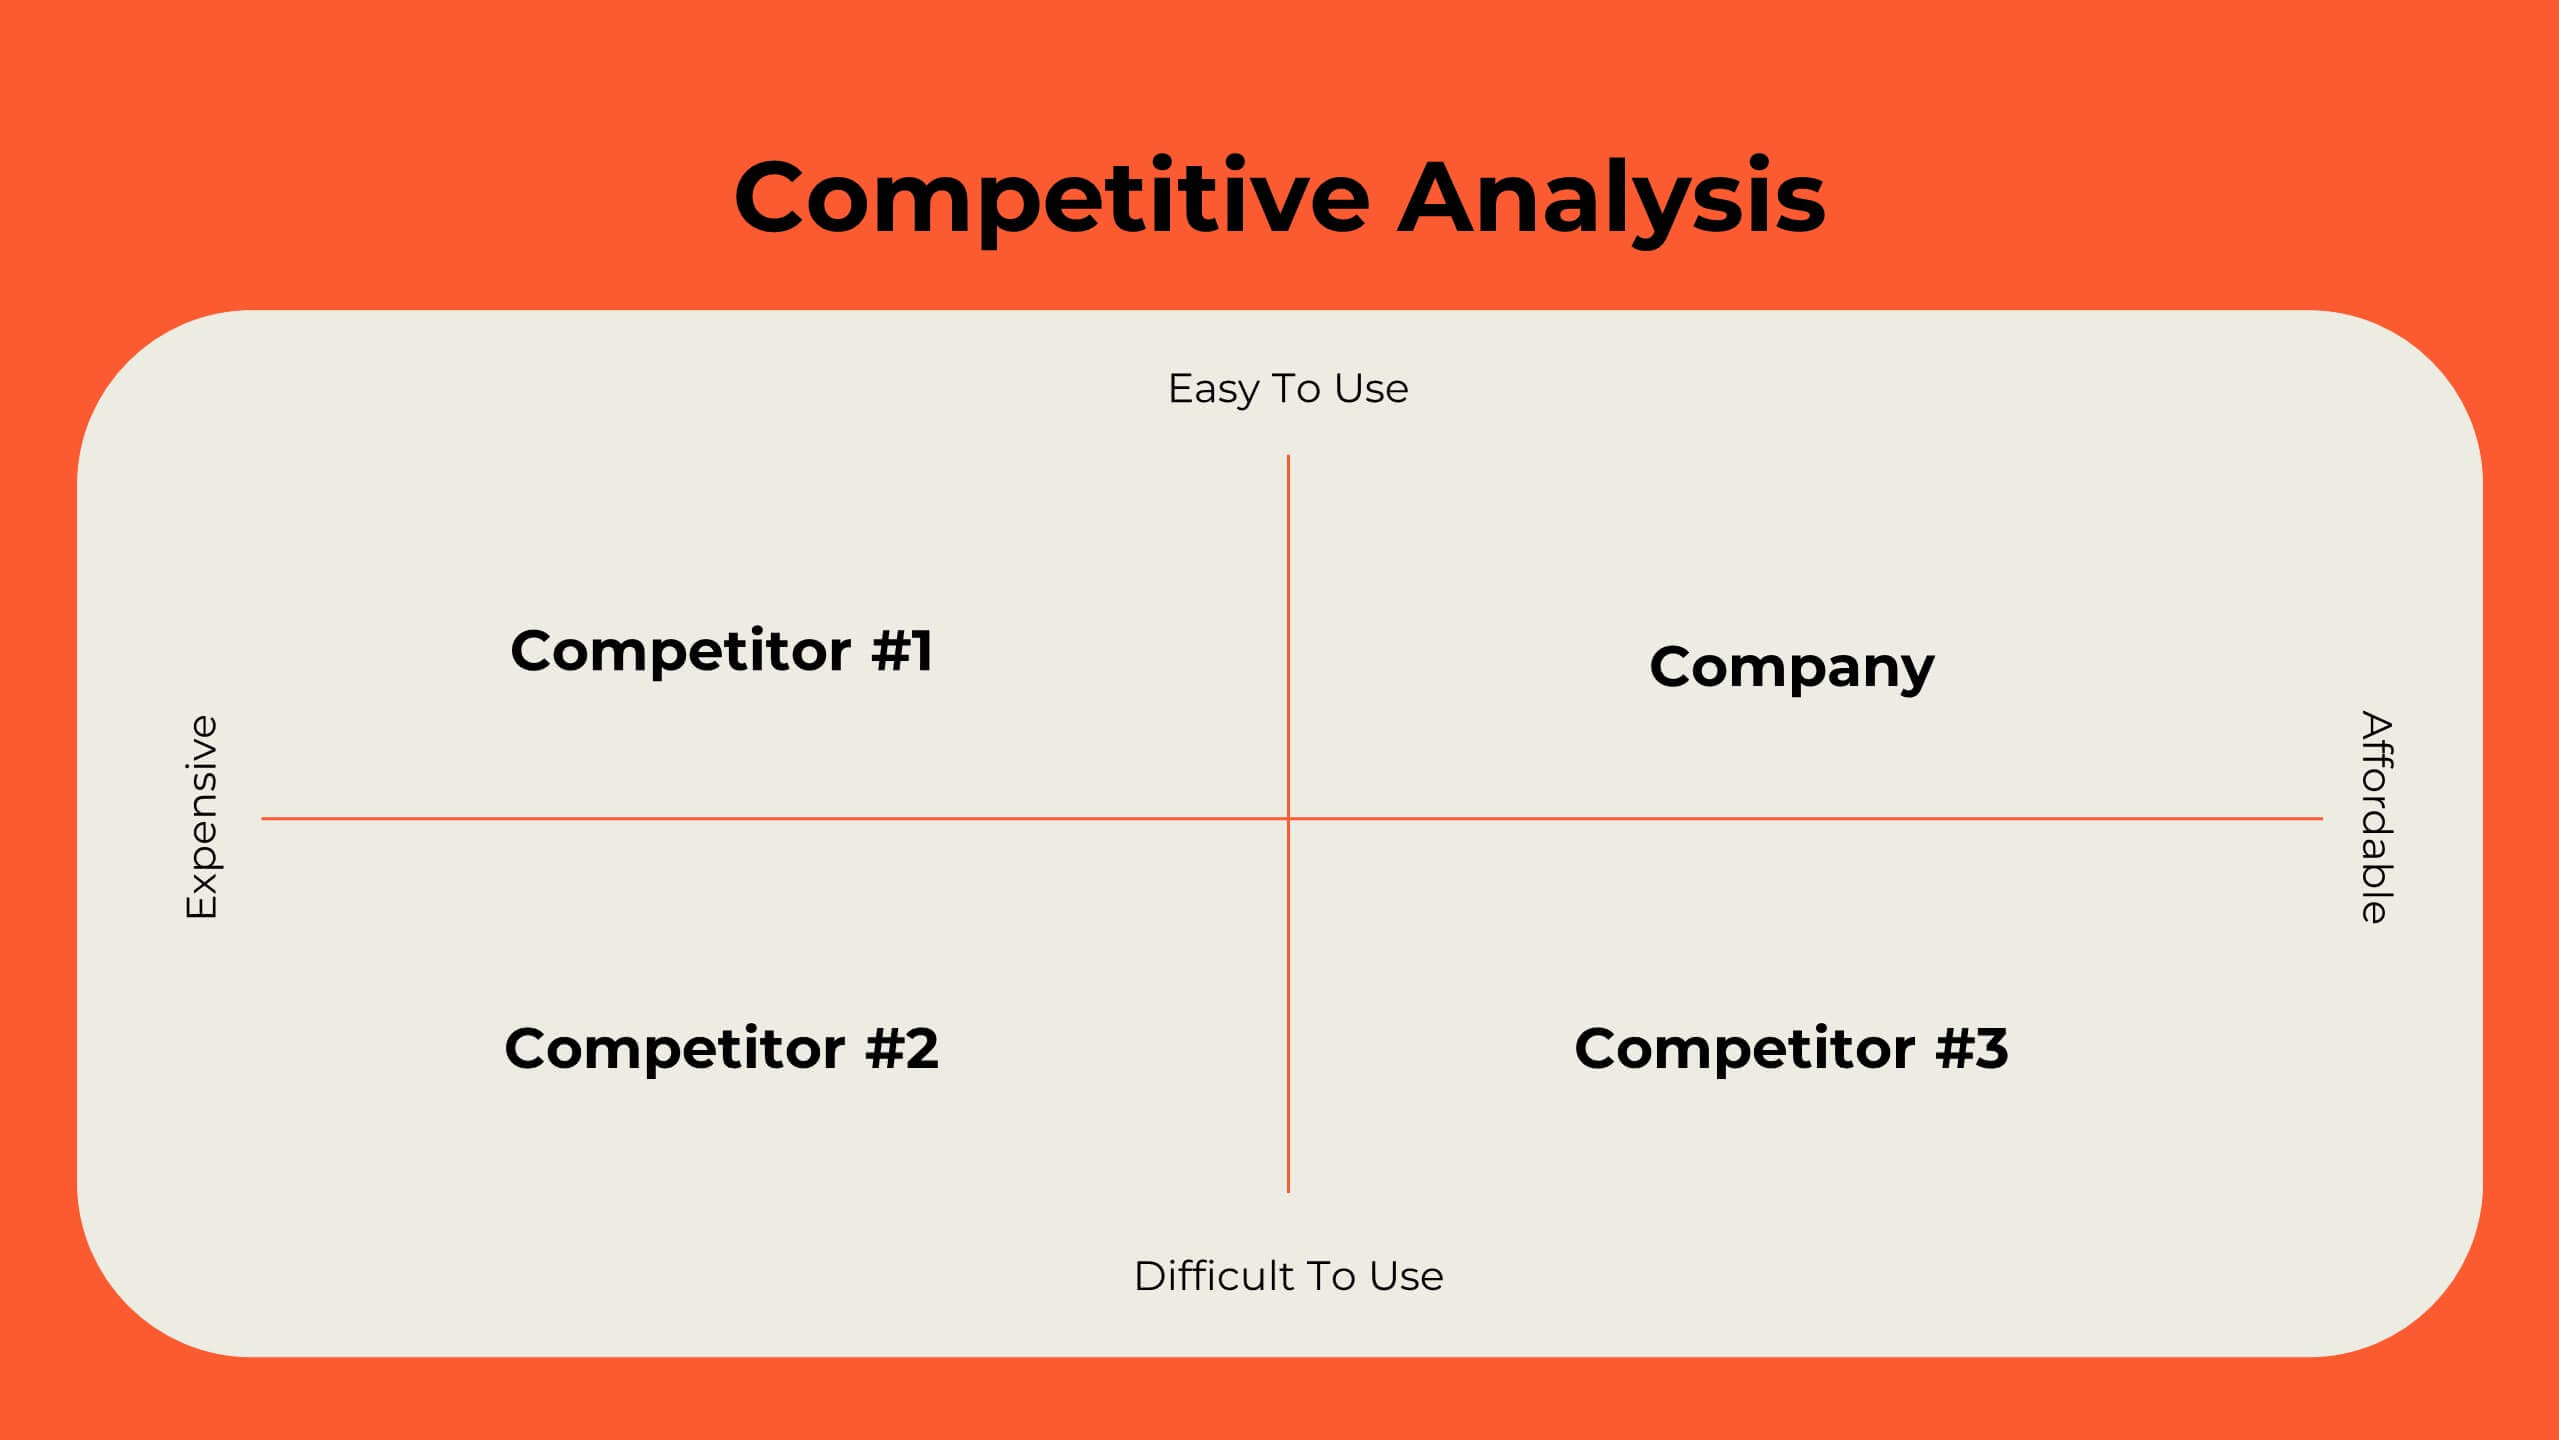
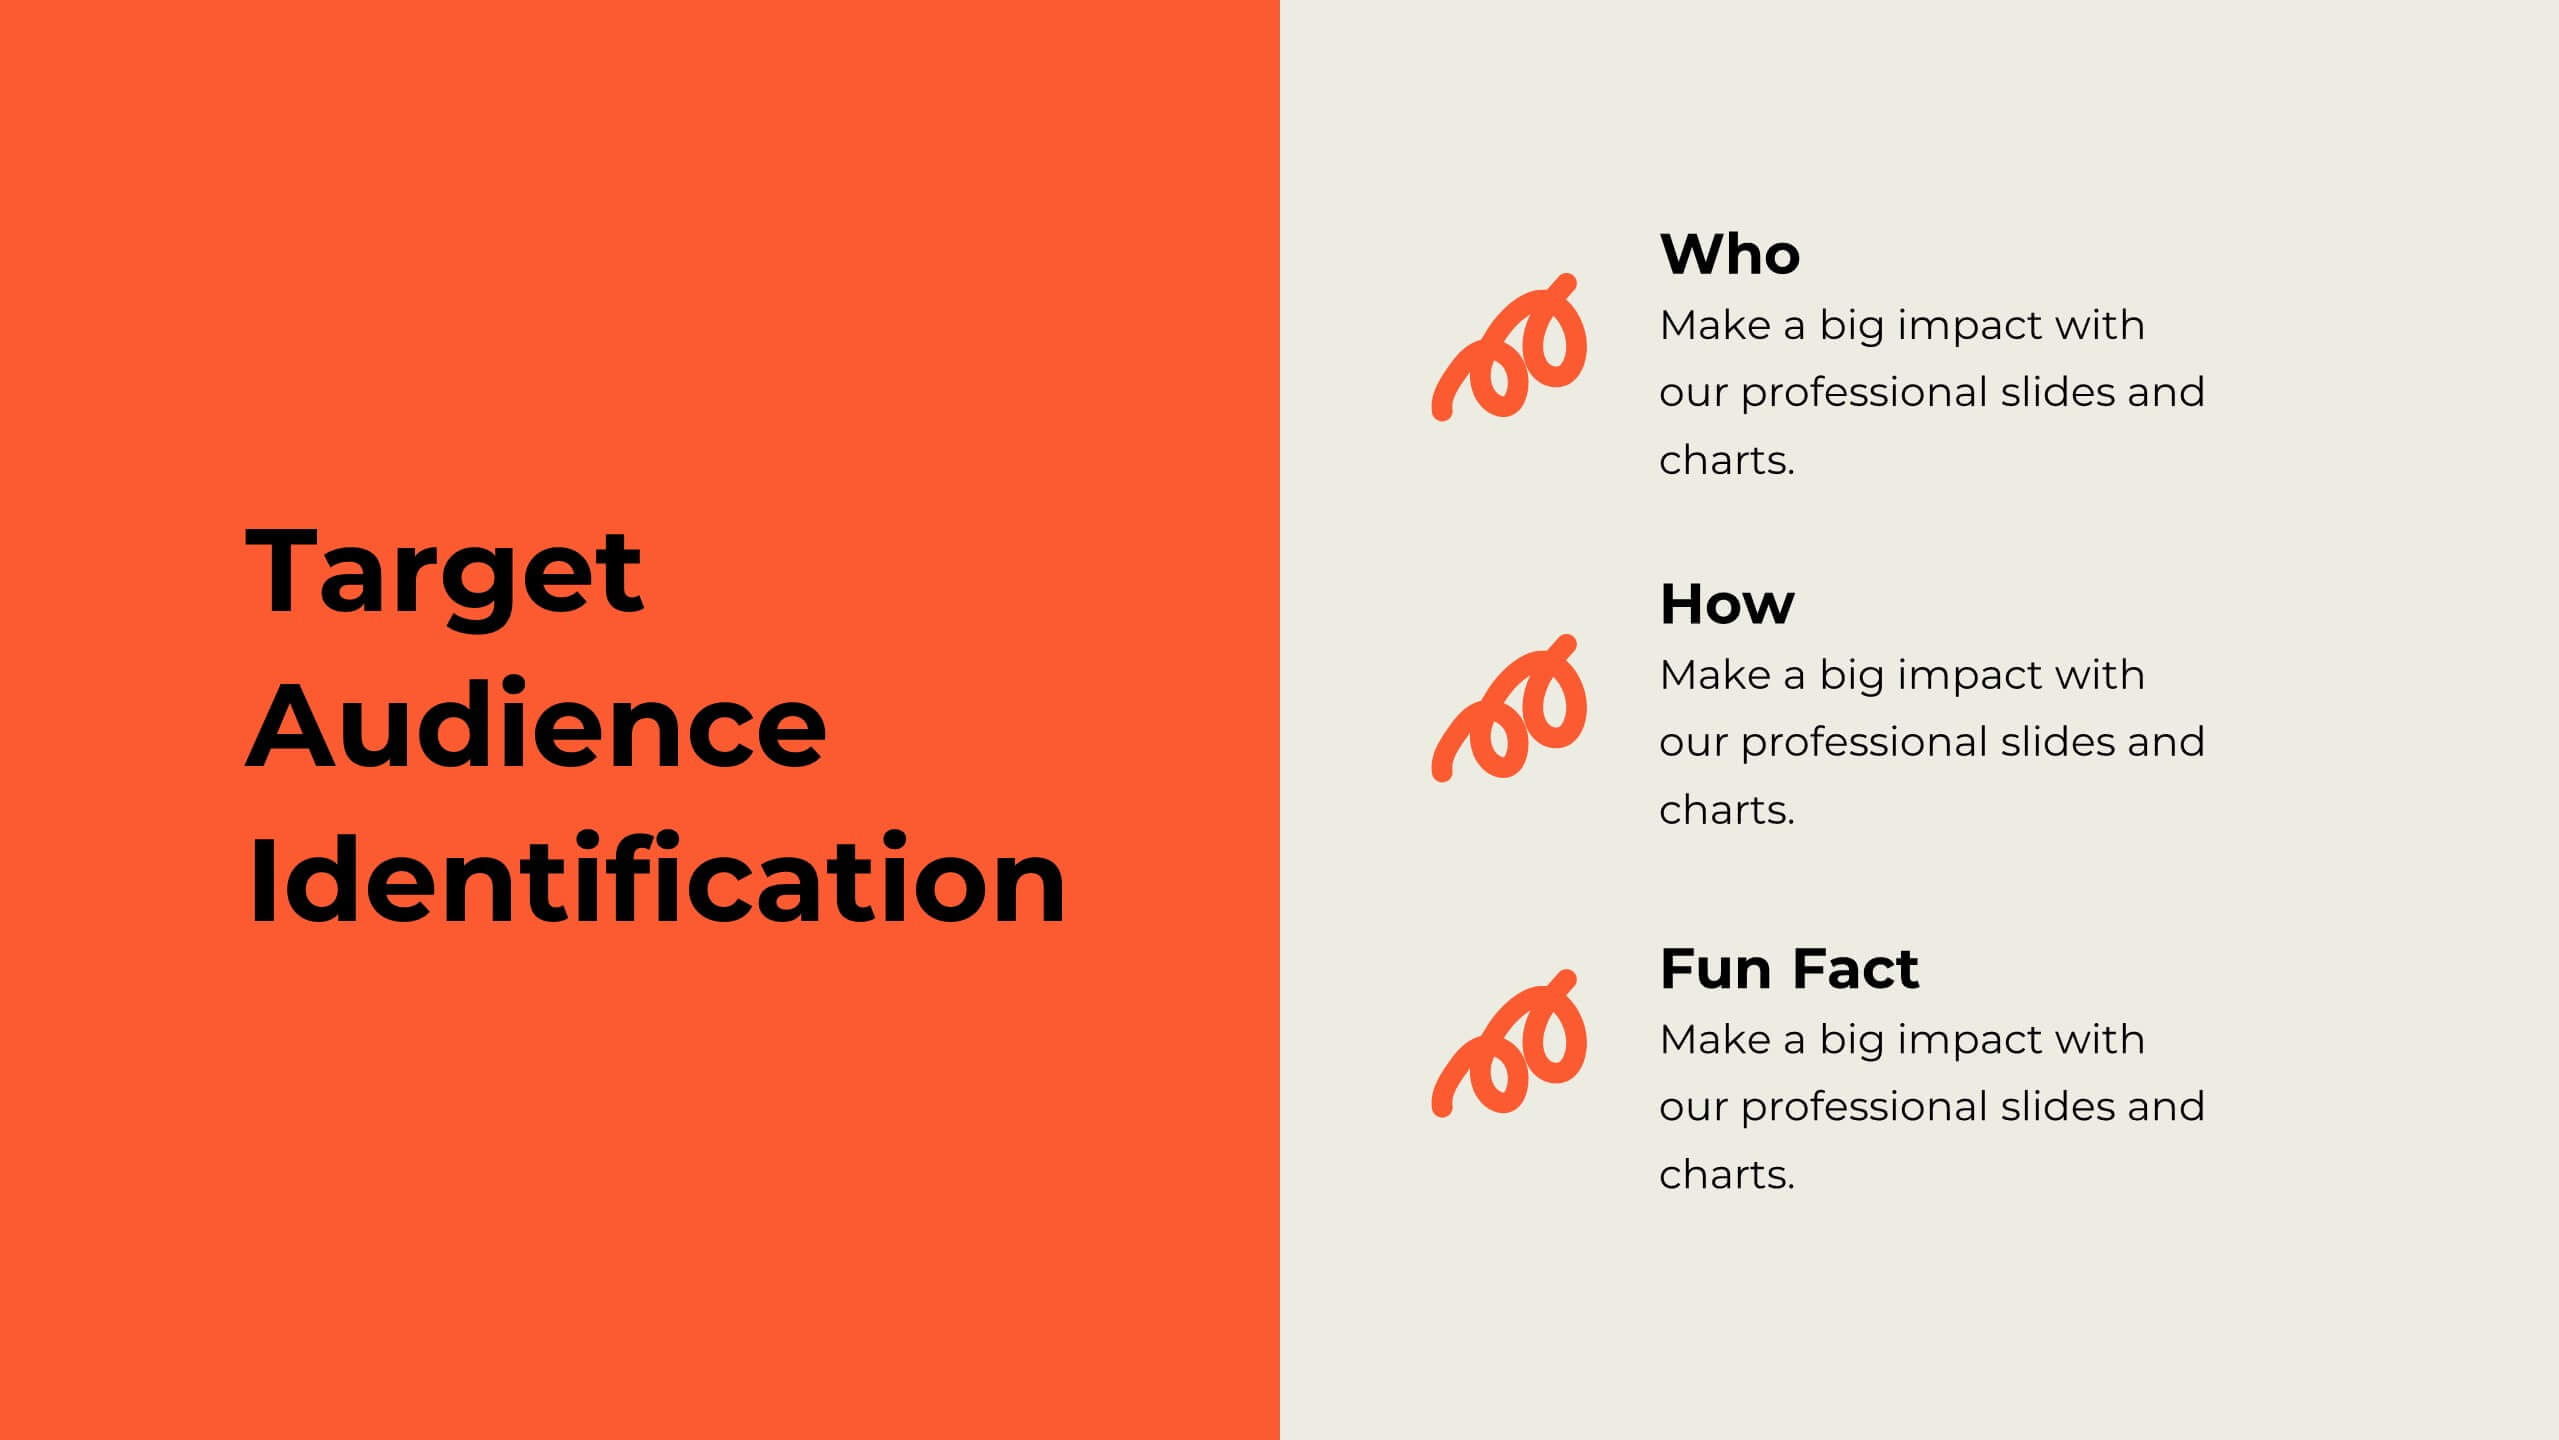
Revitalize your marketing efforts with this dynamic strategy plan template! Perfect for outlining objectives, competitive analysis, and target audience identification, it includes slides for SWOT analysis, resource allocation, and implementation plans. Engage stakeholders with vibrant visuals and comprehensive content. Compatible with PowerPoint, Keynote, and Google Slides for seamless presentations on any platform.


5 slides
Product Development and Innovation Presentation
Showcase your Product Development and Innovation process with this structured and visually appealing infographic. Designed with interconnected gears and a step-by-step approach, this template is ideal for illustrating stages of product design, research, and launch. Fully customizable and compatible with PowerPoint, Keynote, and Google Slides.

20 slides
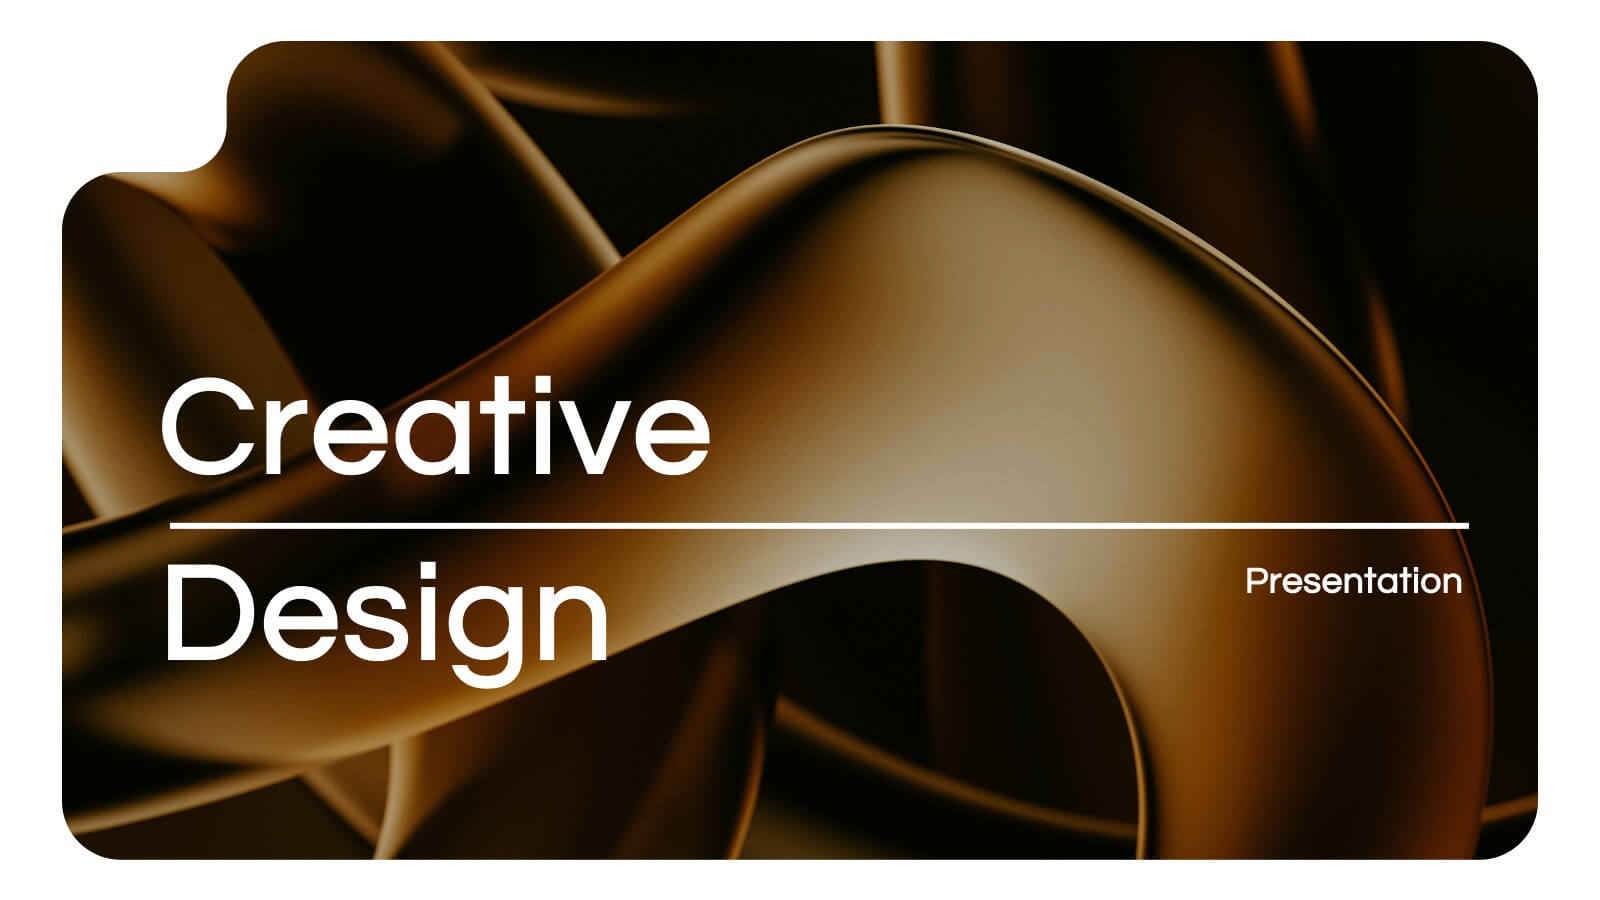
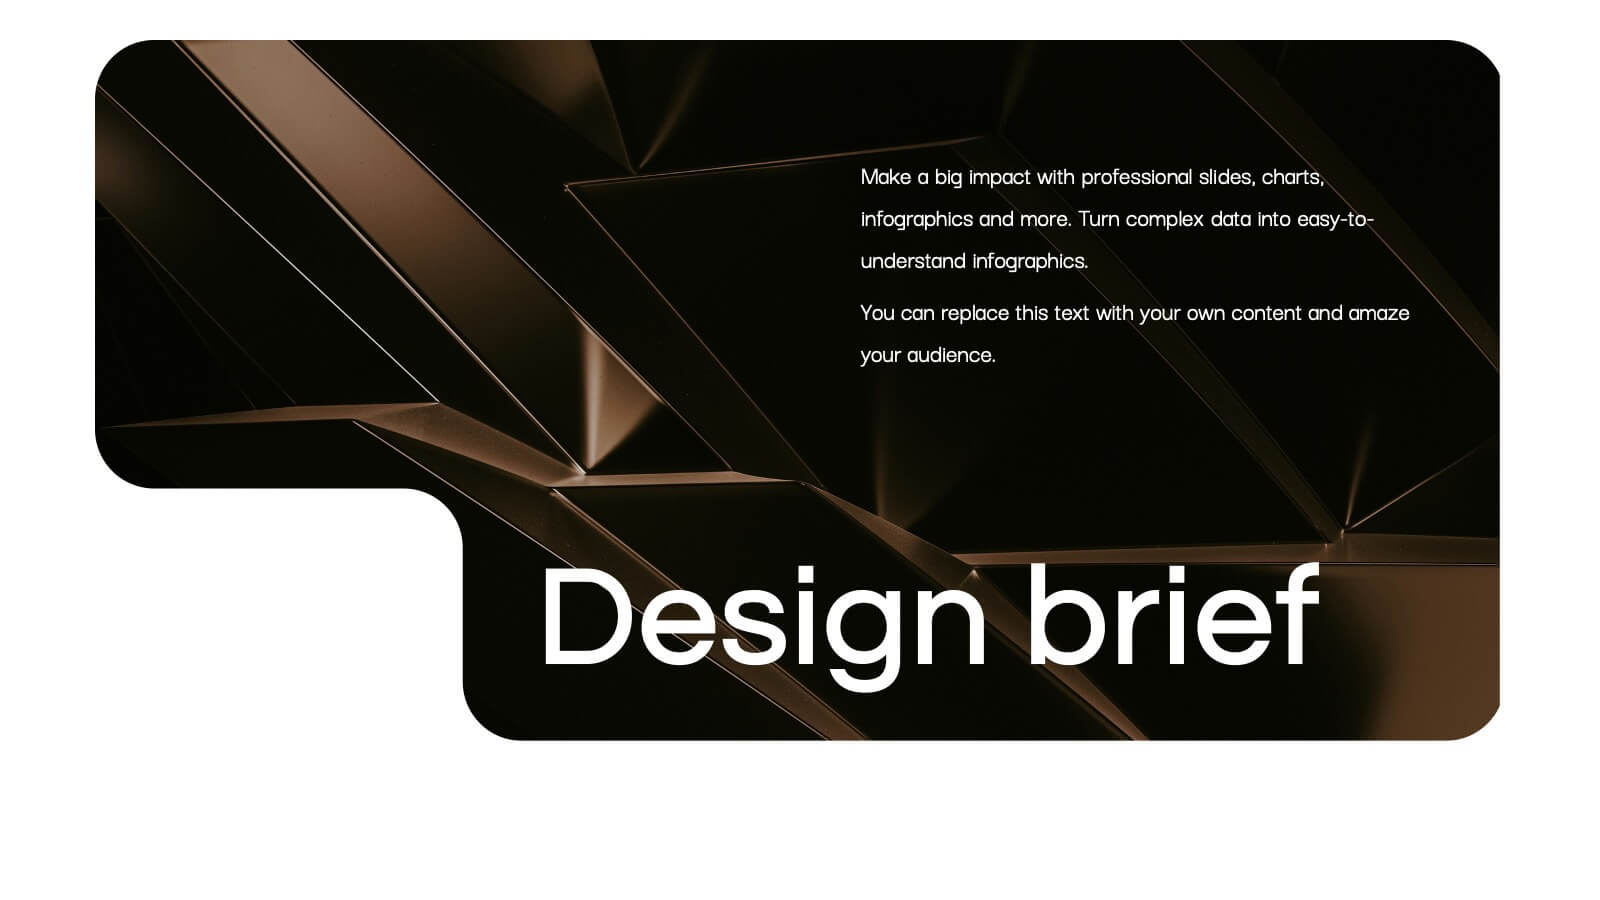
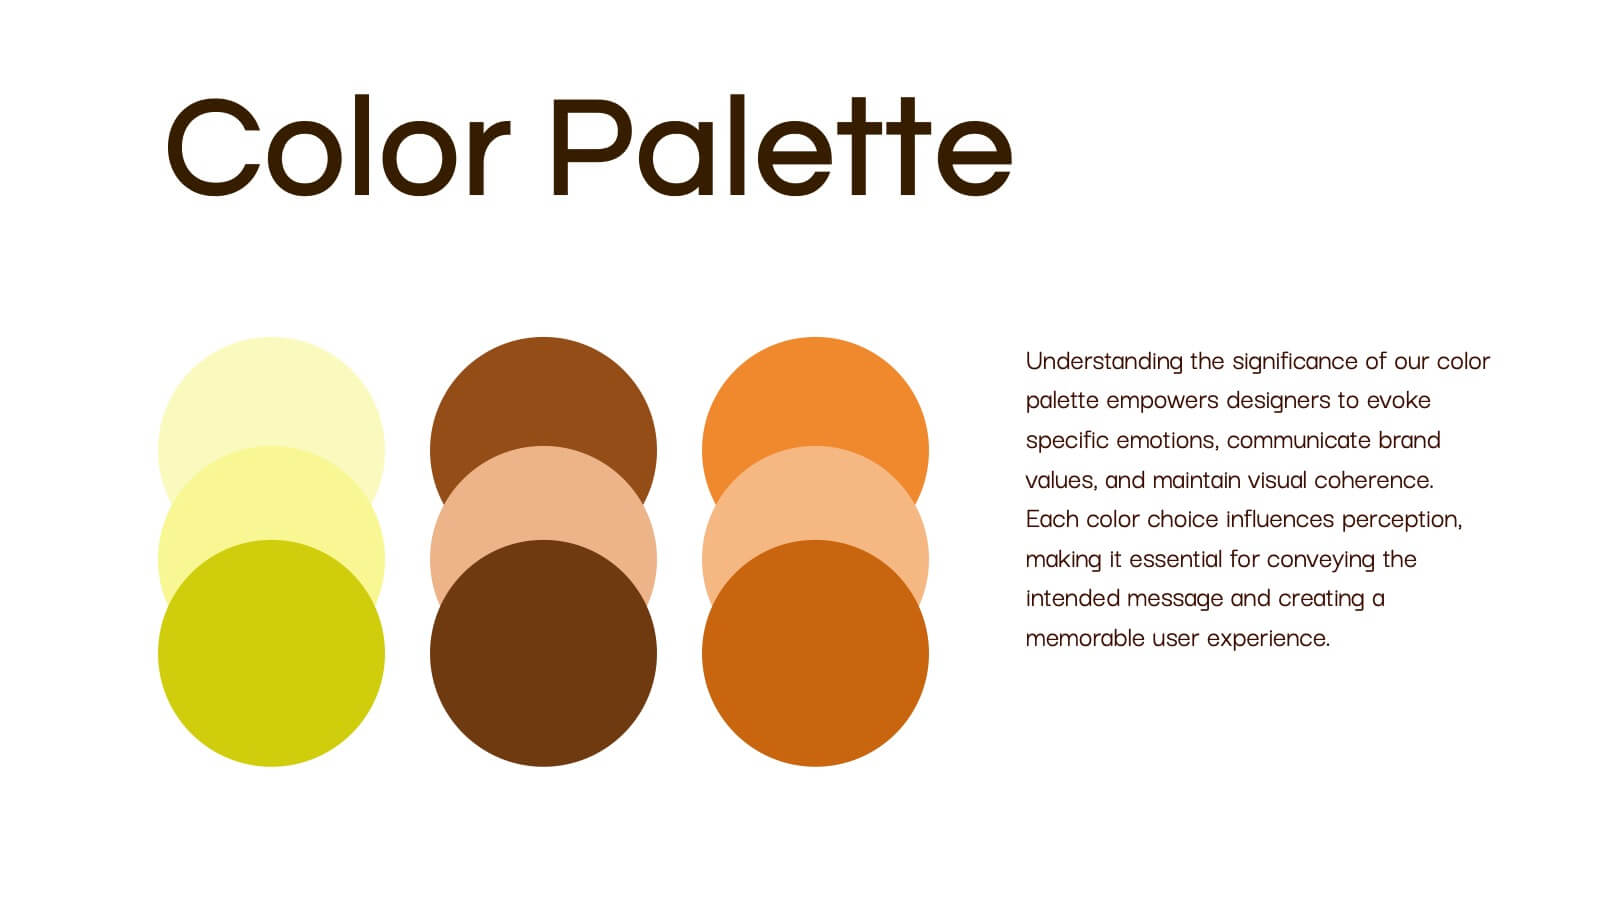
Obsidian Creative Design Report Presentation
Bring your creative vision to life with this stunning design presentation template! Perfect for showcasing your design process, from concept development and mood boards to typography and final assets. Ideal for creative professionals, this template offers clarity and style at every step. Compatible with PowerPoint, Keynote, and Google Slides, it’s your ultimate tool for design presentations.


22 slides
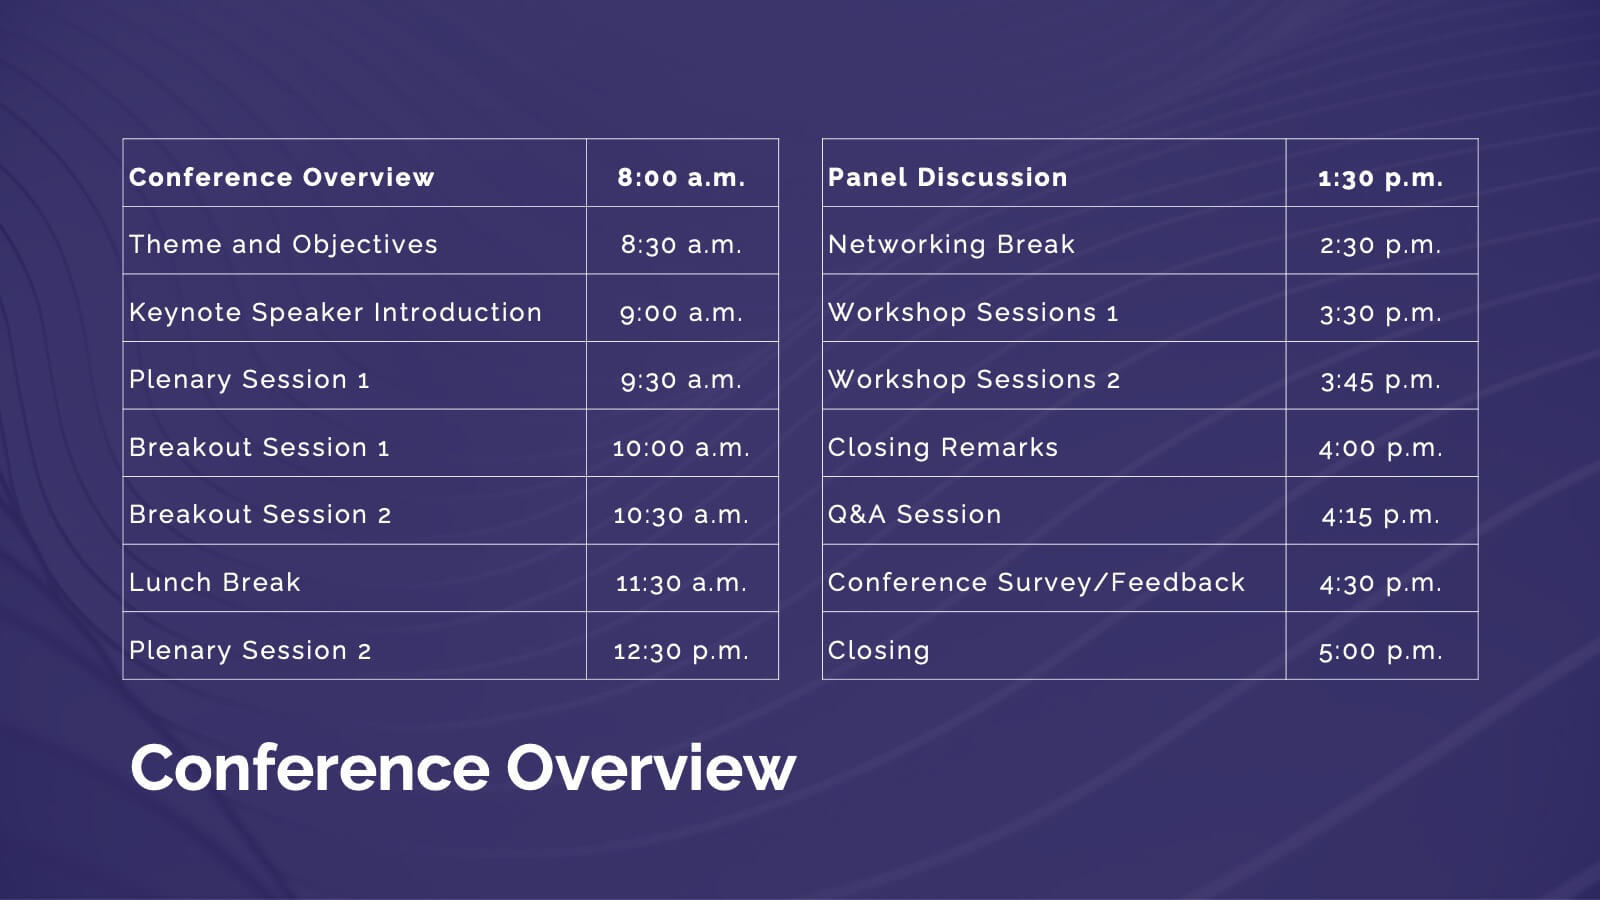
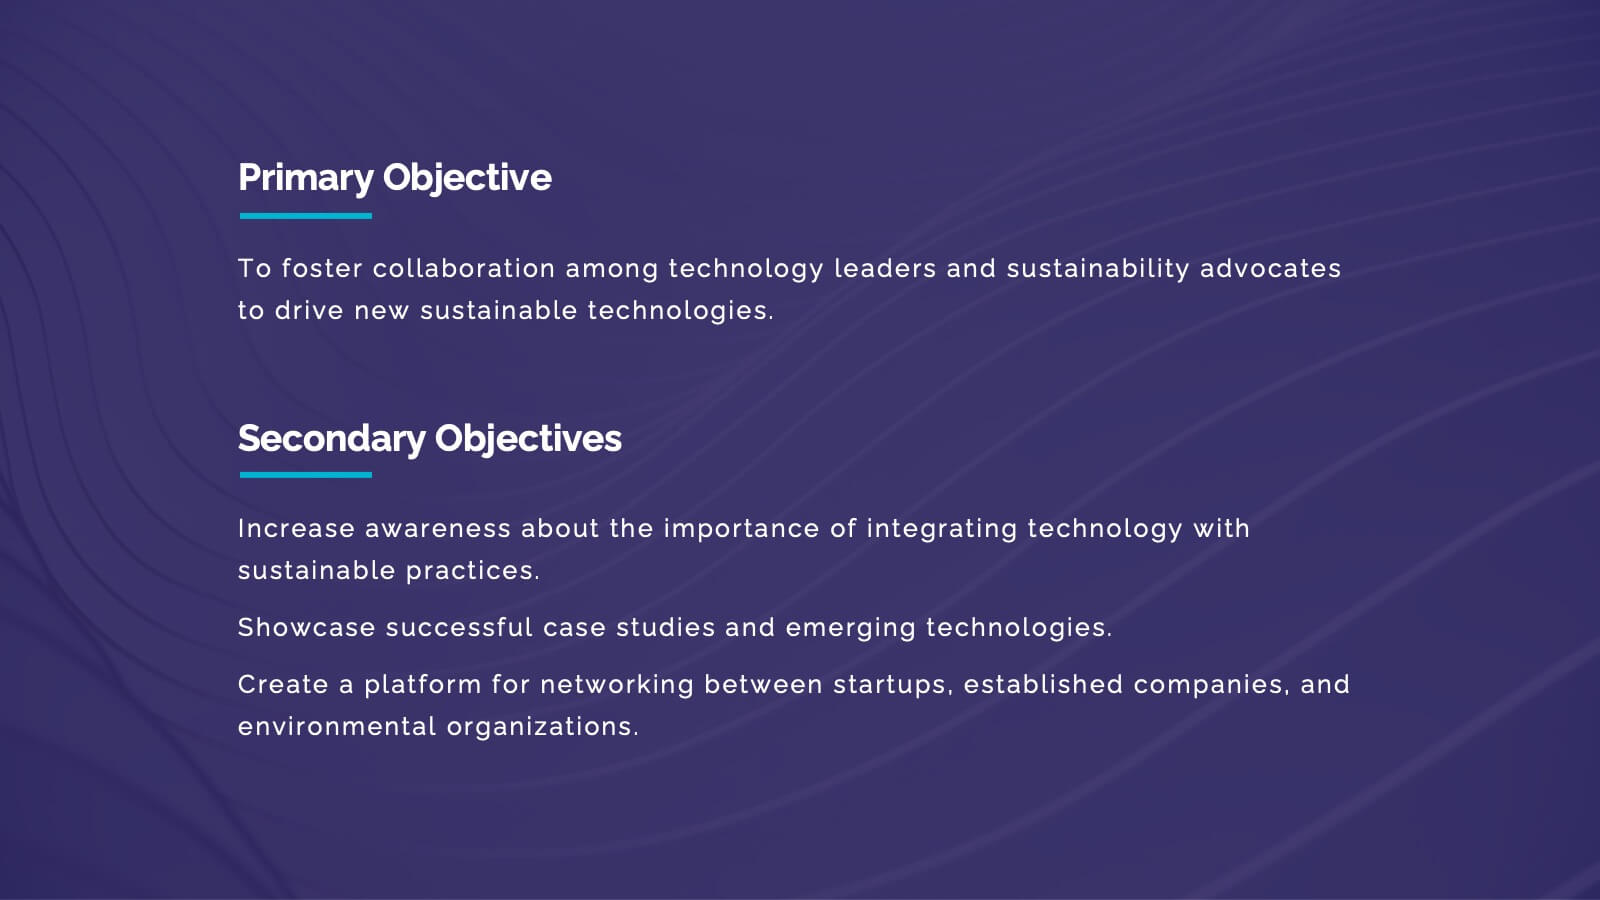
Nimbus Business Development Proposal Presentation
Boost your business presentations with this vibrant, professional template designed for business development proposals. Perfect for detailing conference overviews, themes, objectives, and keynotes, it features a clean and engaging layout. Highlight critical sessions and networking opportunities to captivate your audience. Compatible with PowerPoint, Keynote, and Google Slides, it ensures seamless presentations on any platform.


21 slides
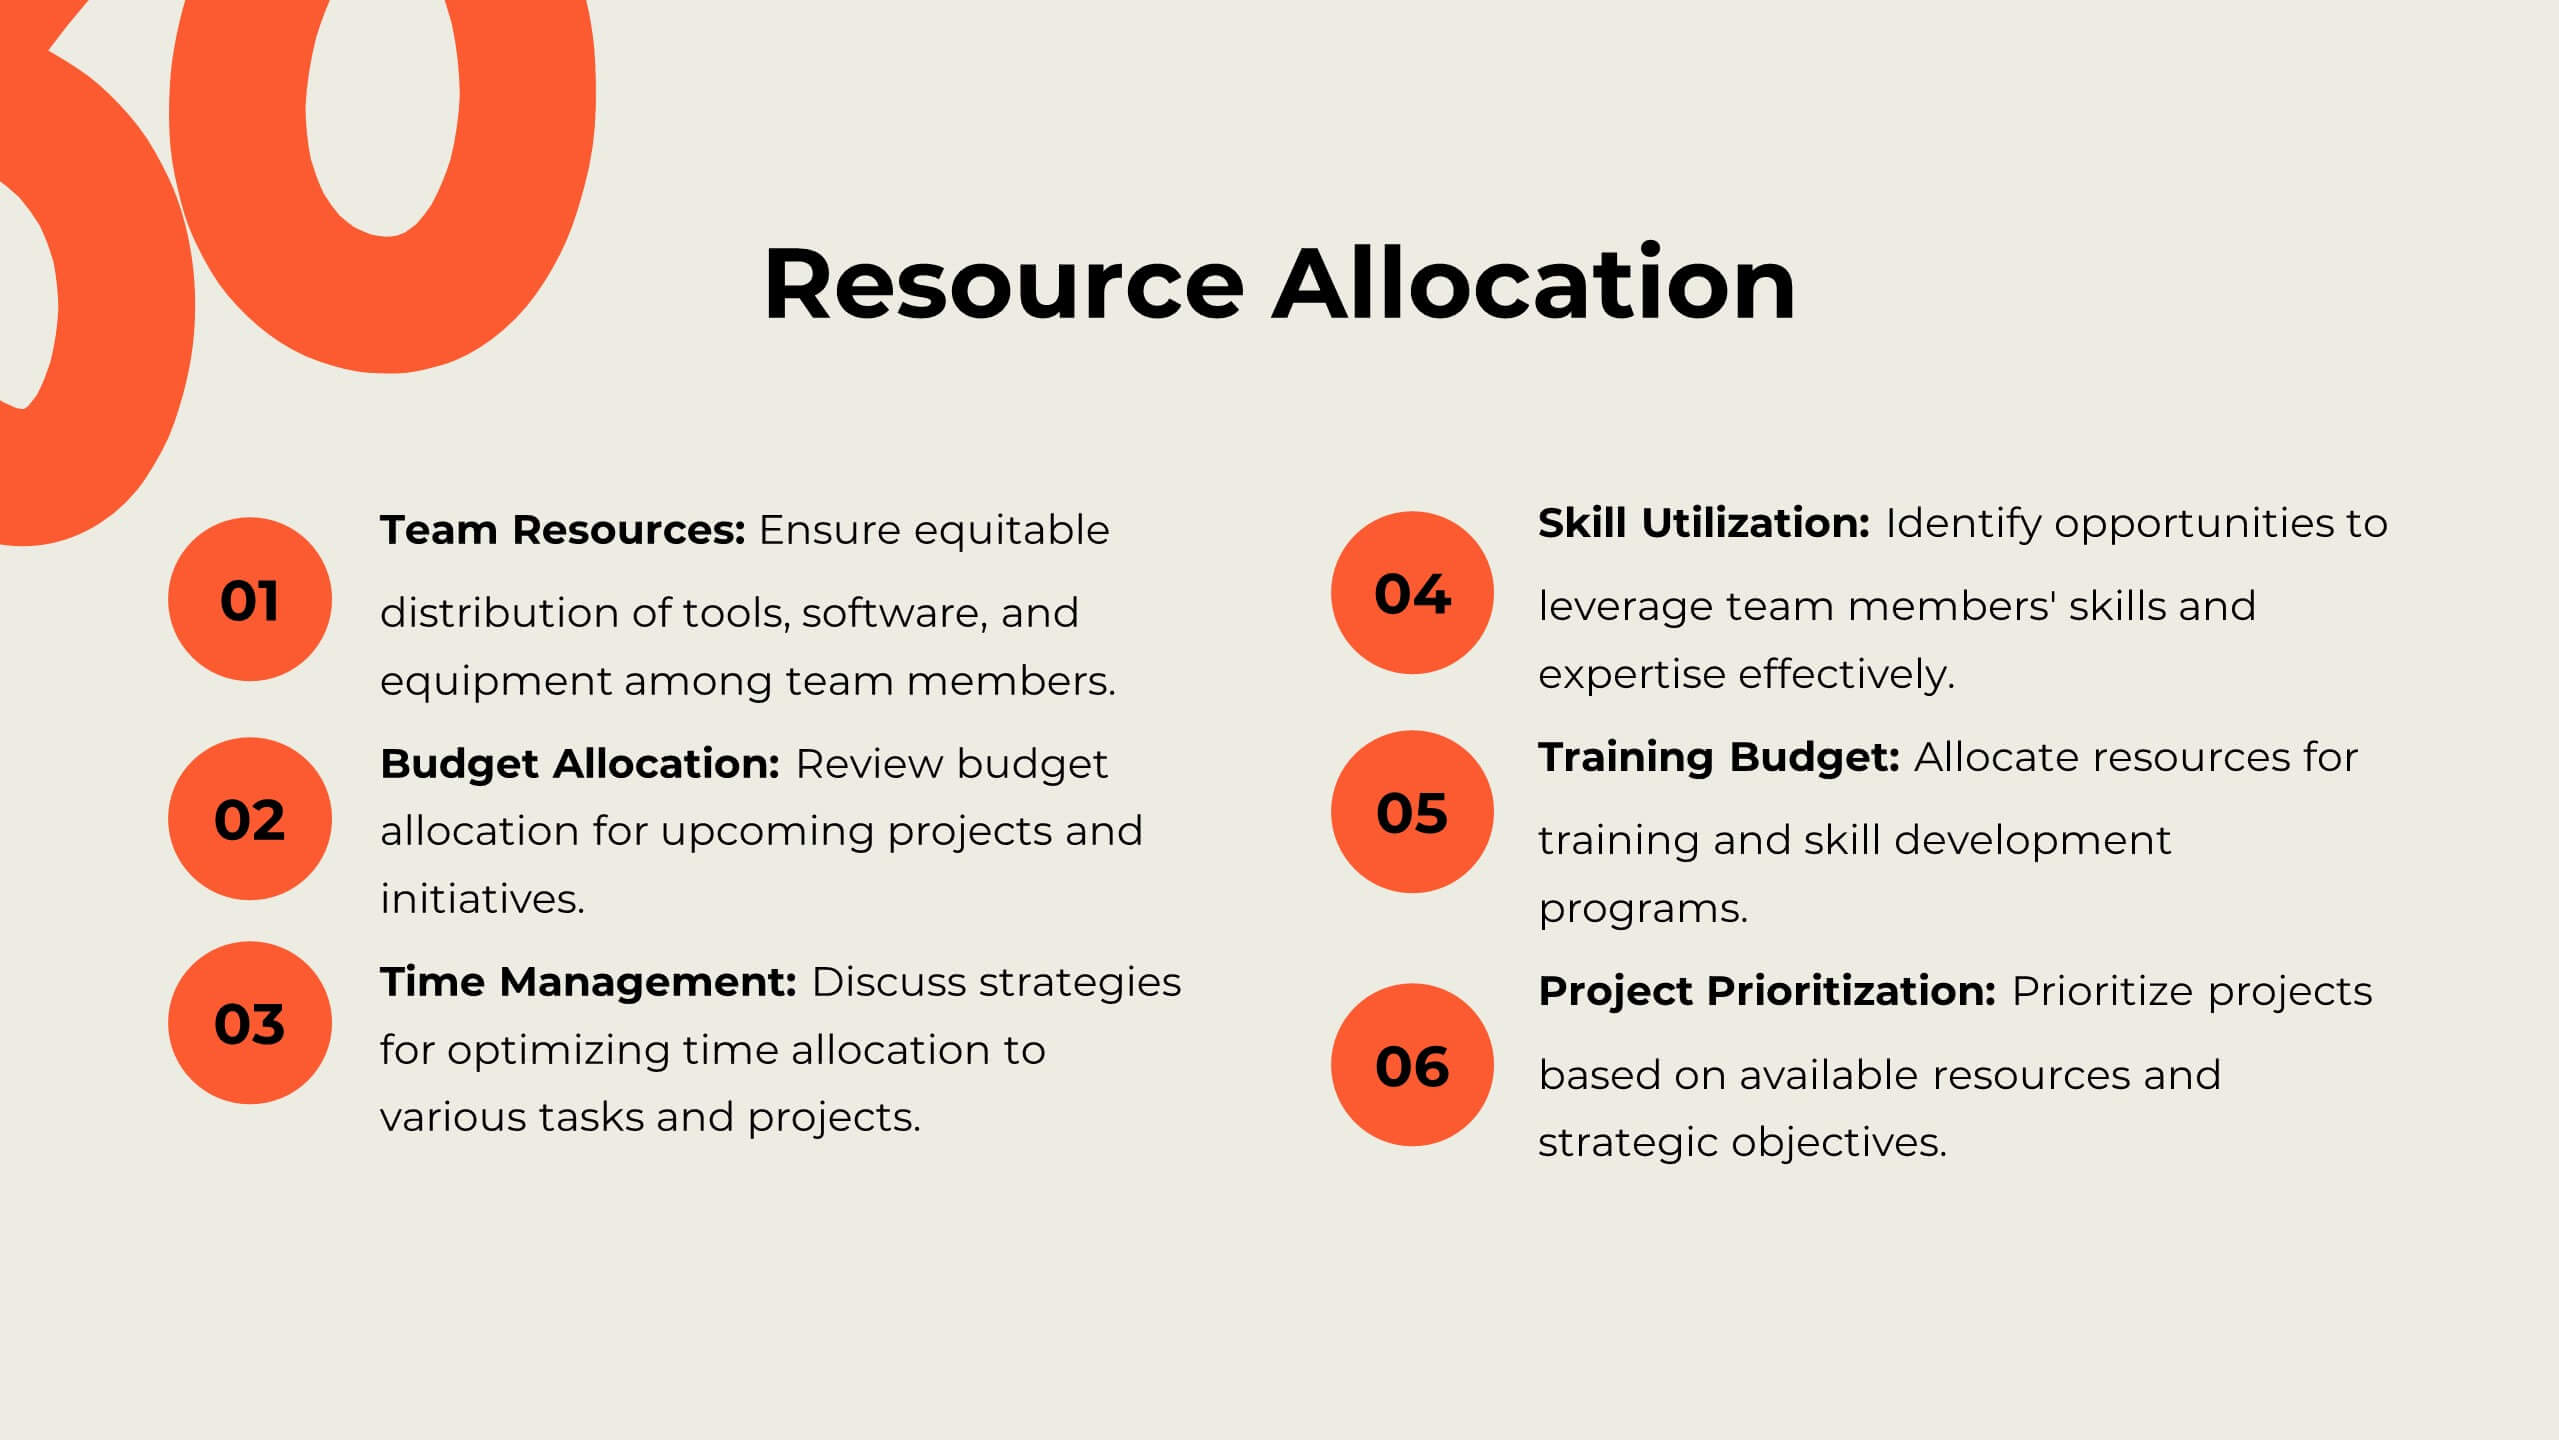
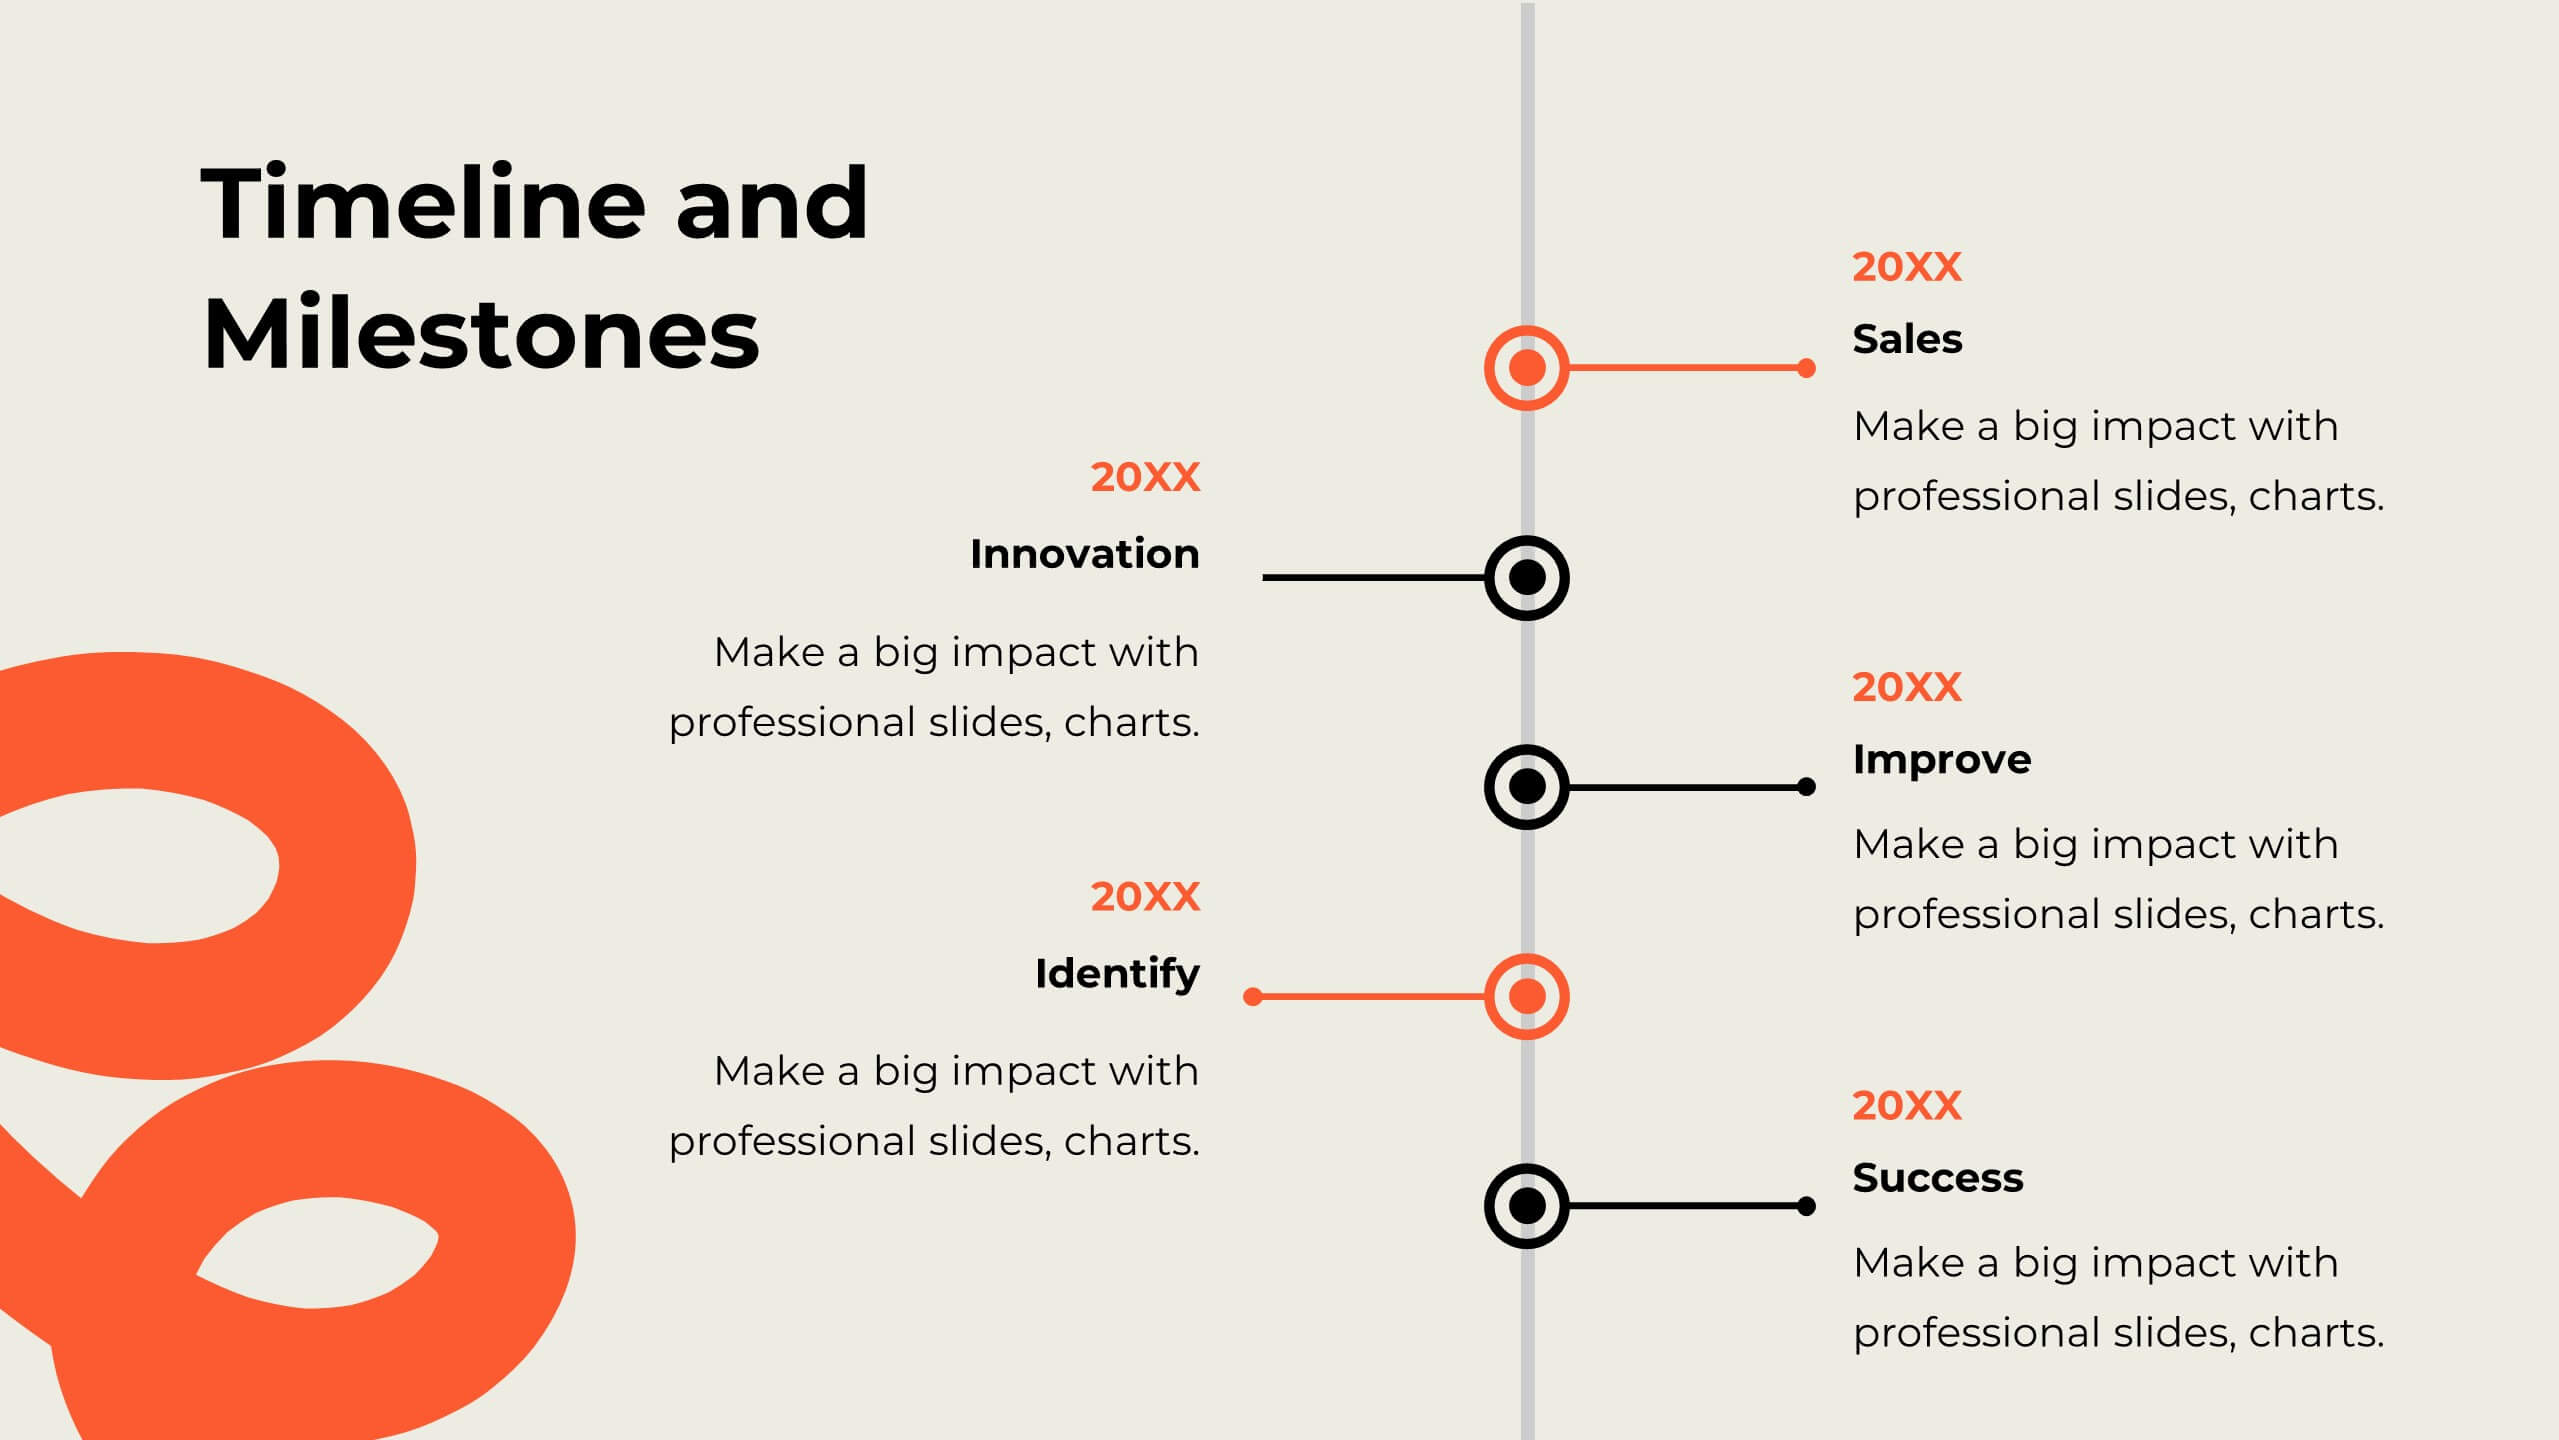
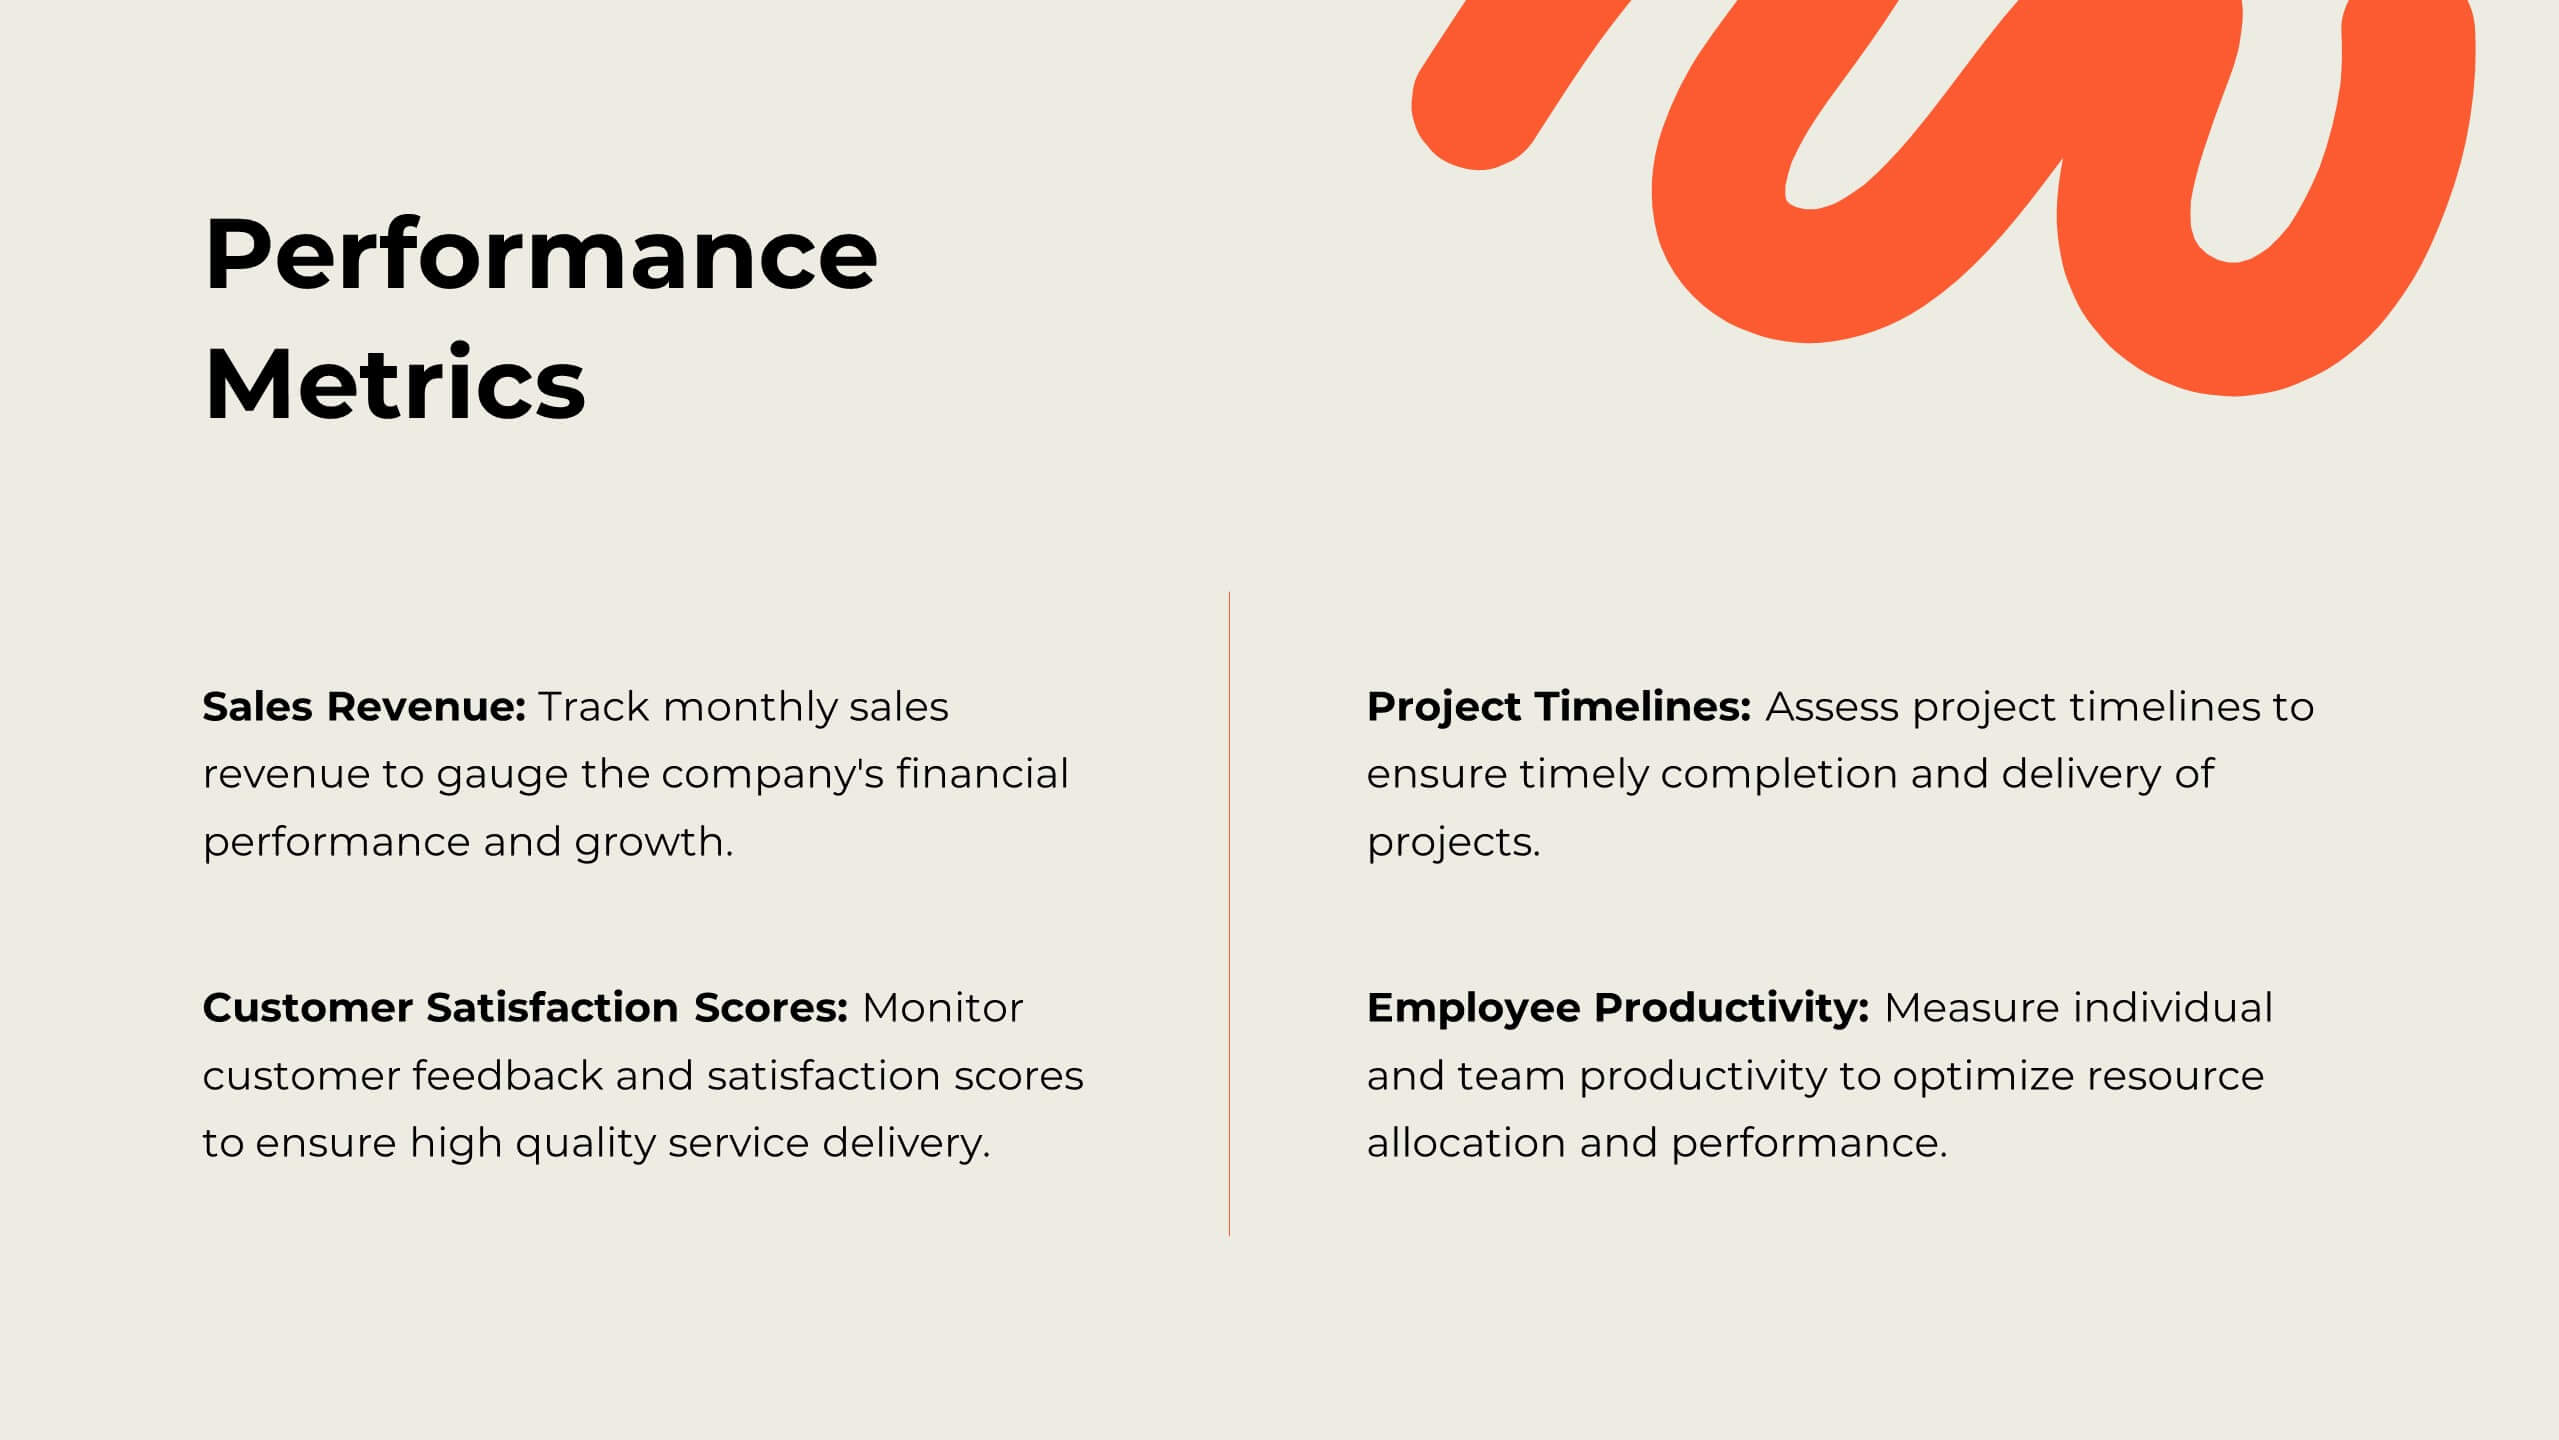
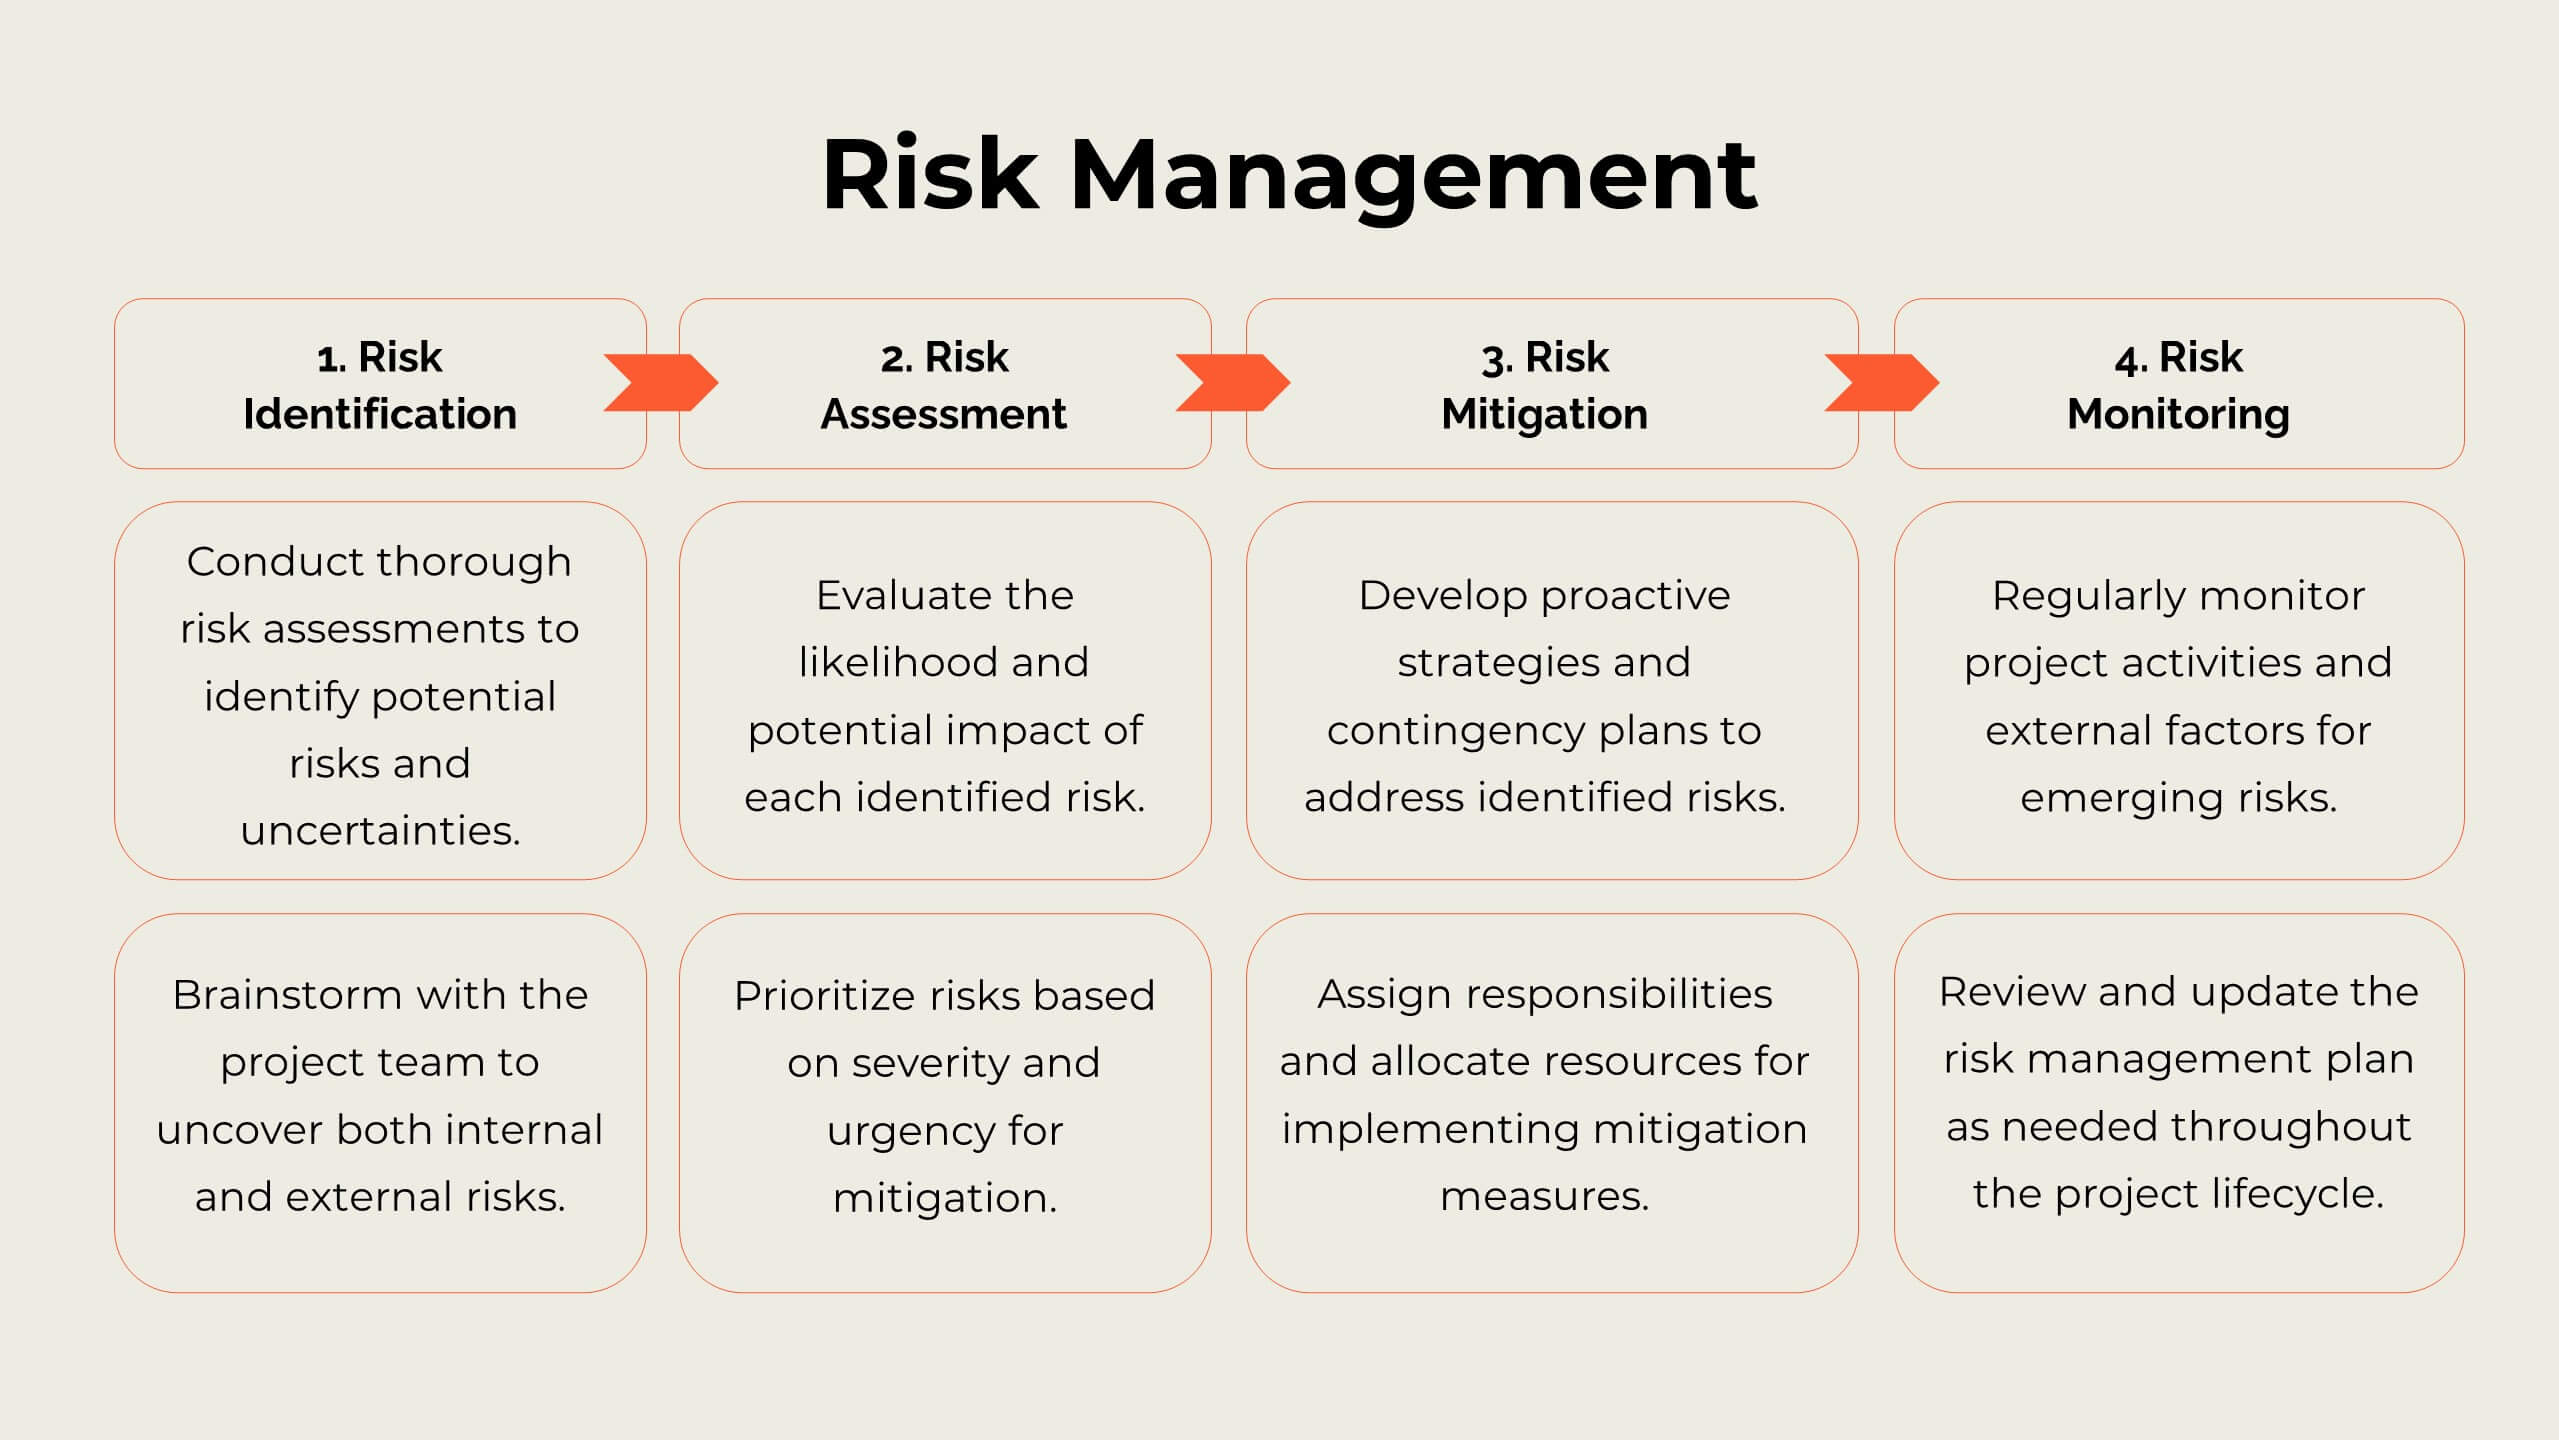
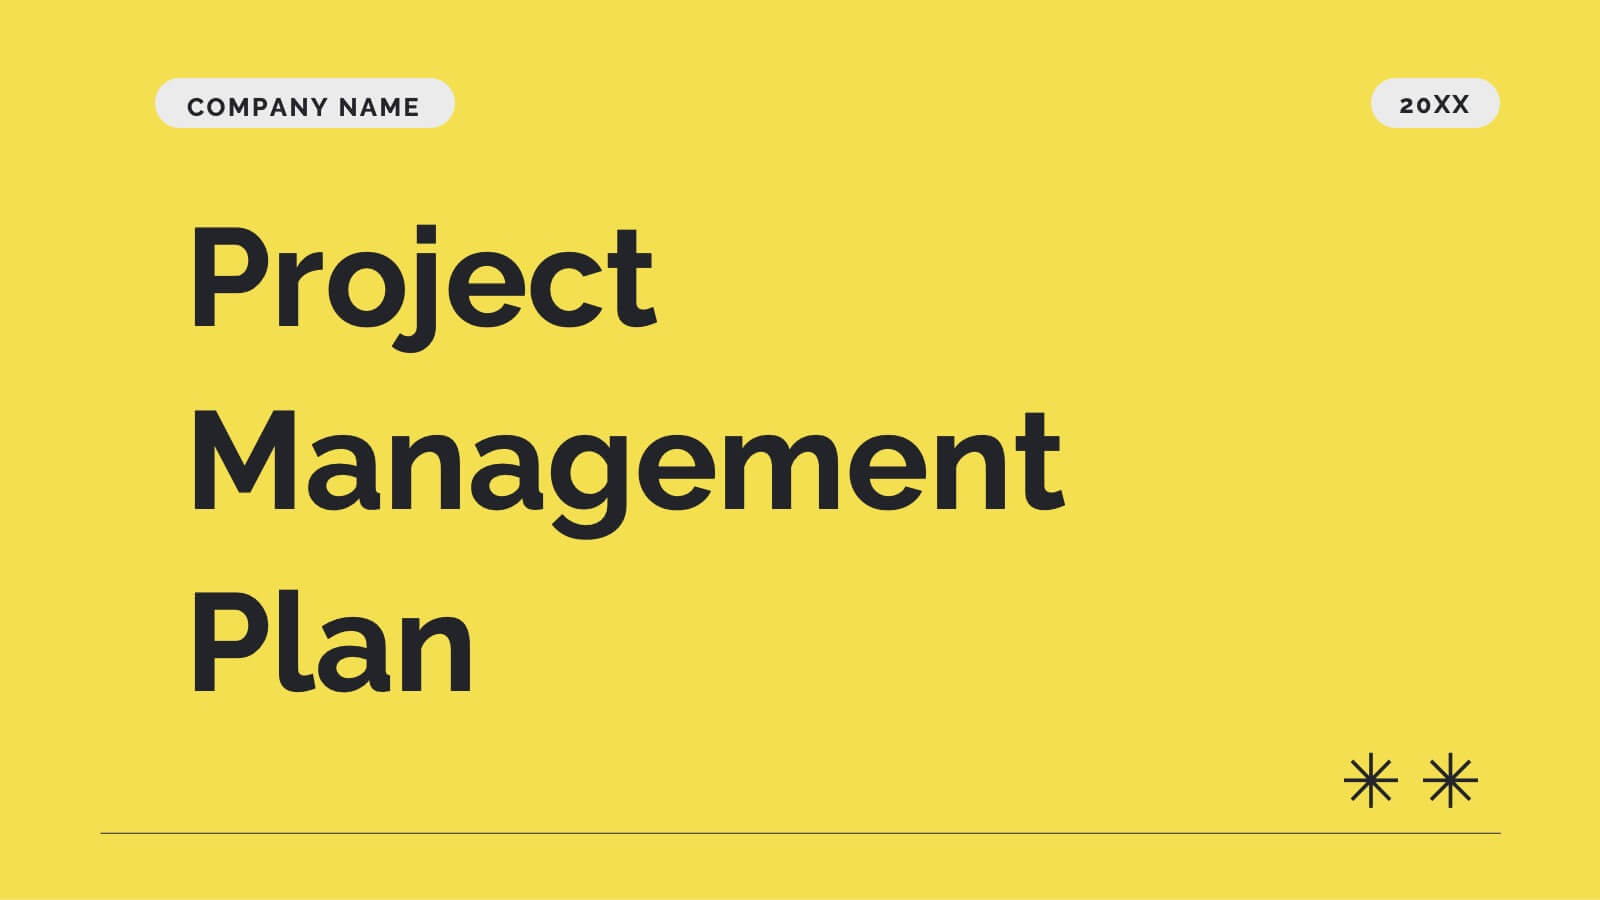
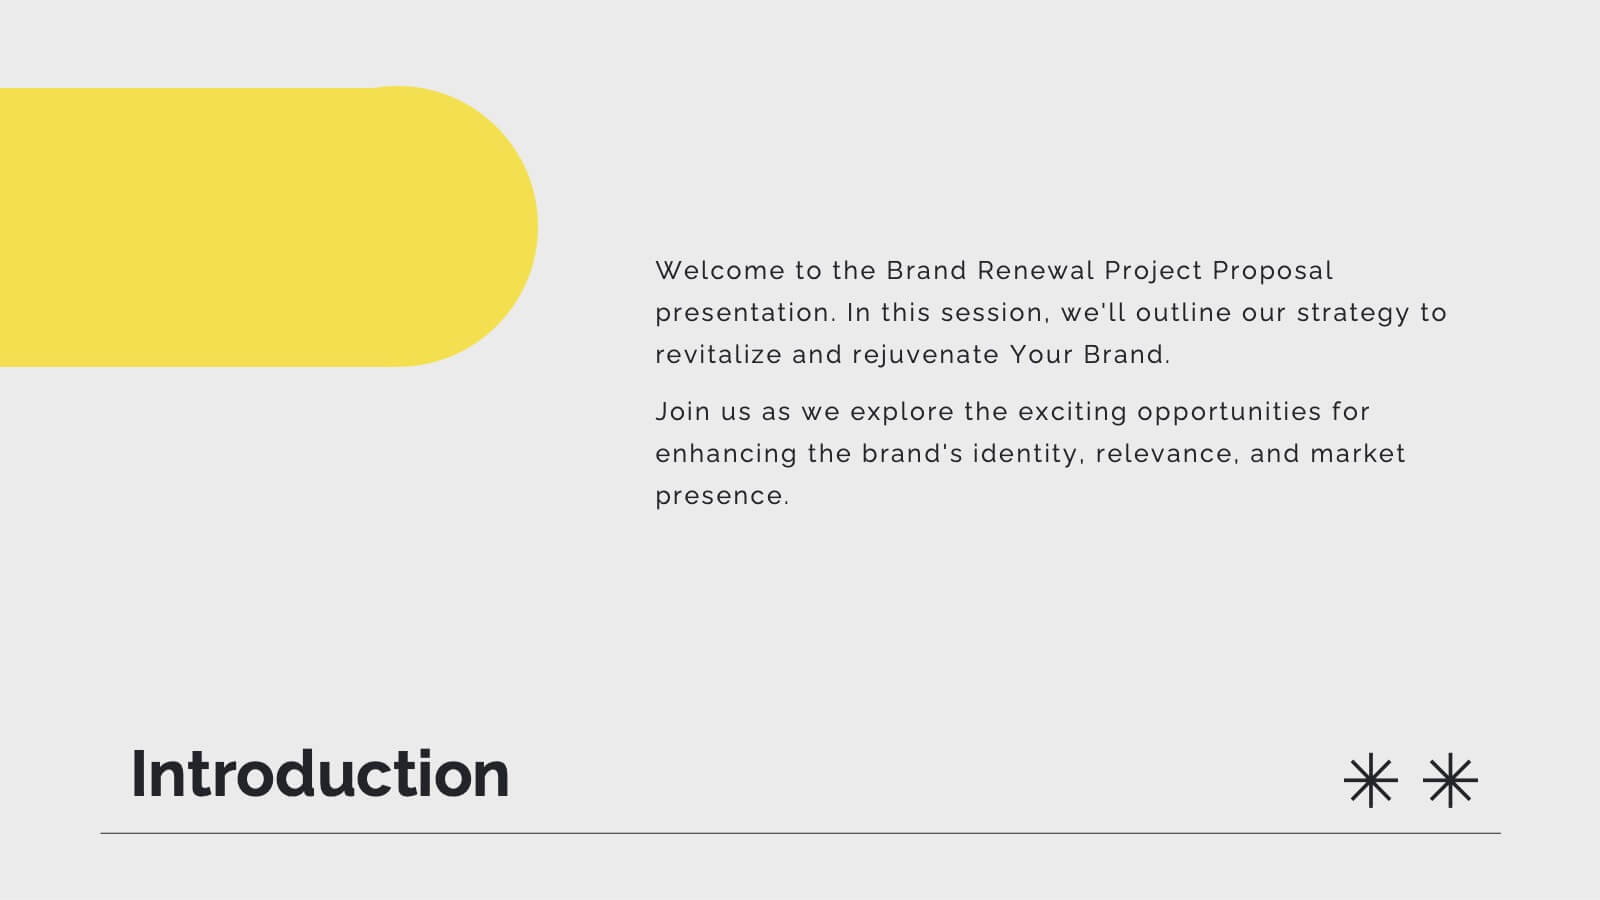
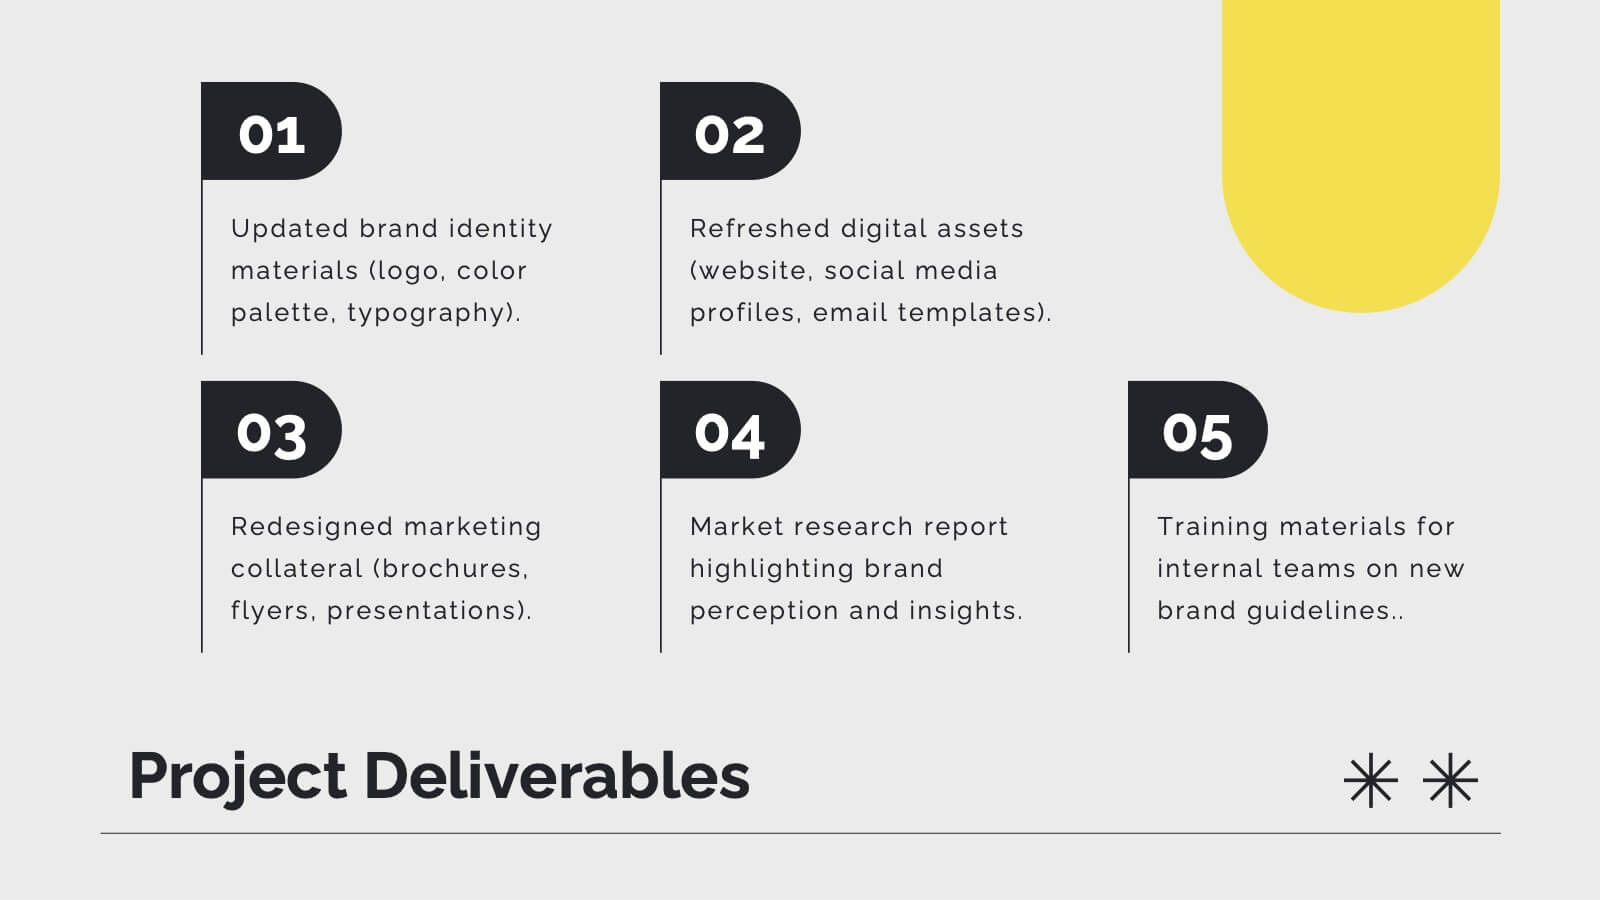
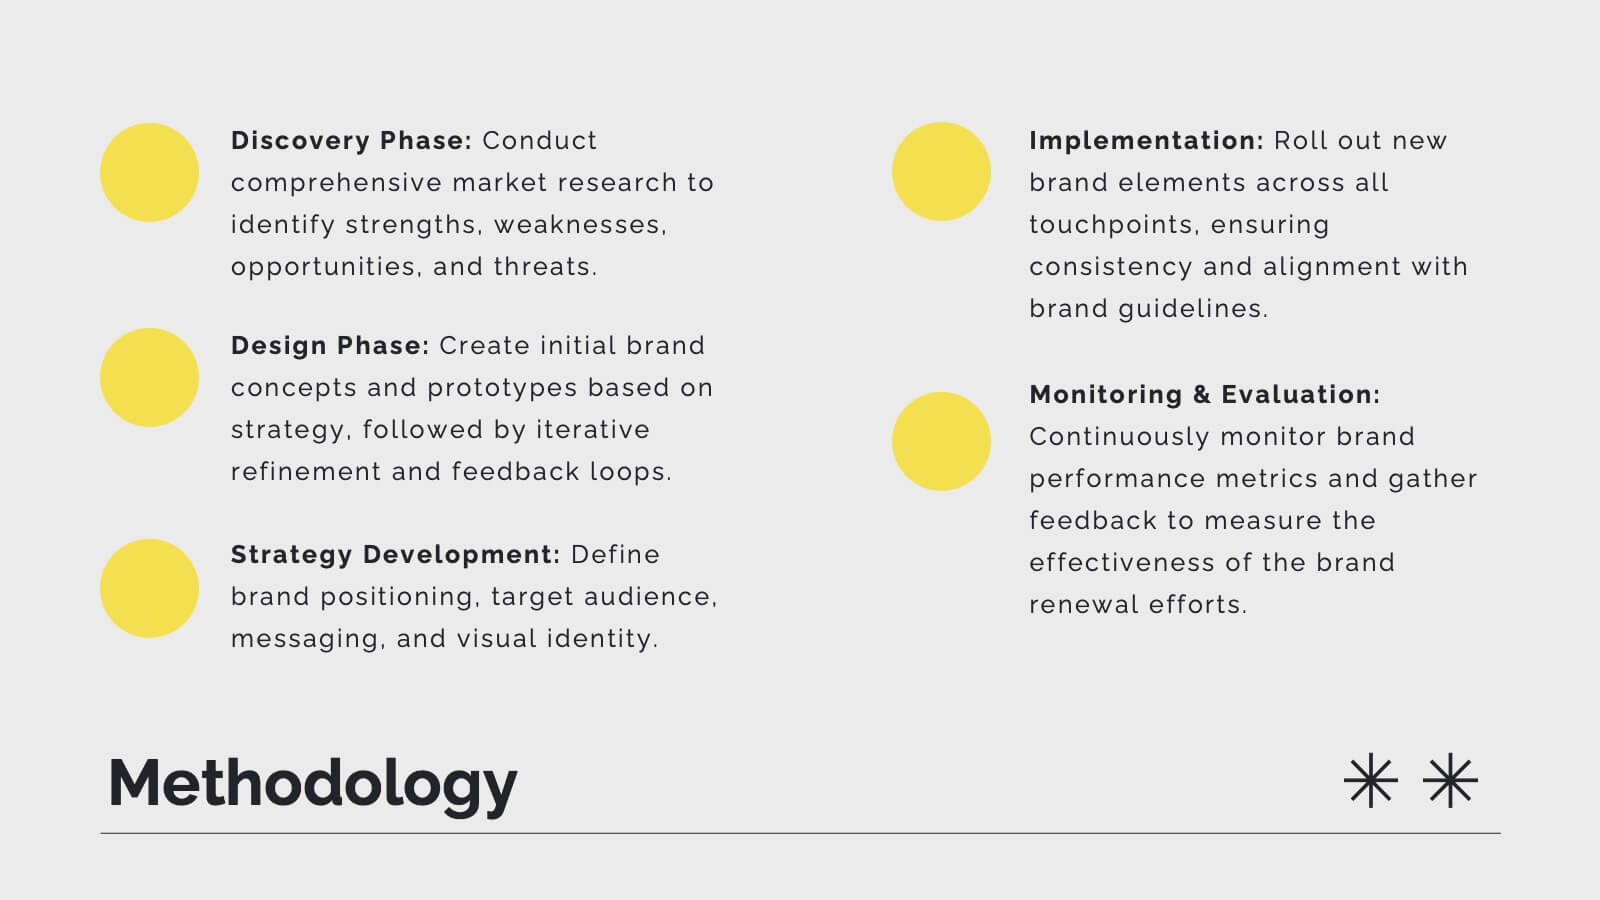
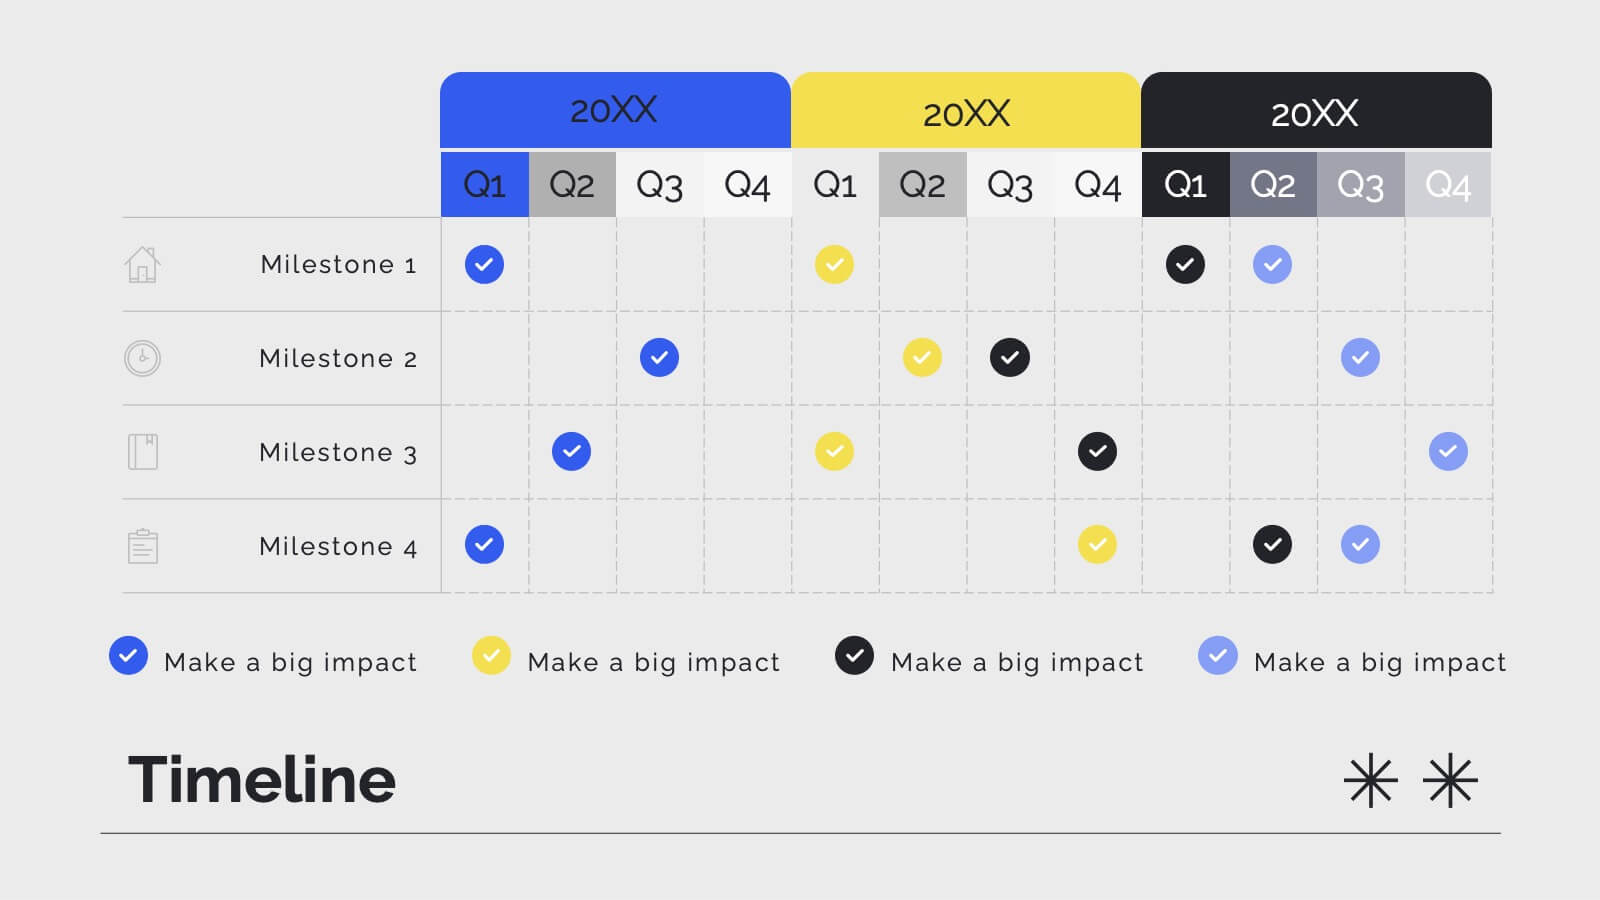
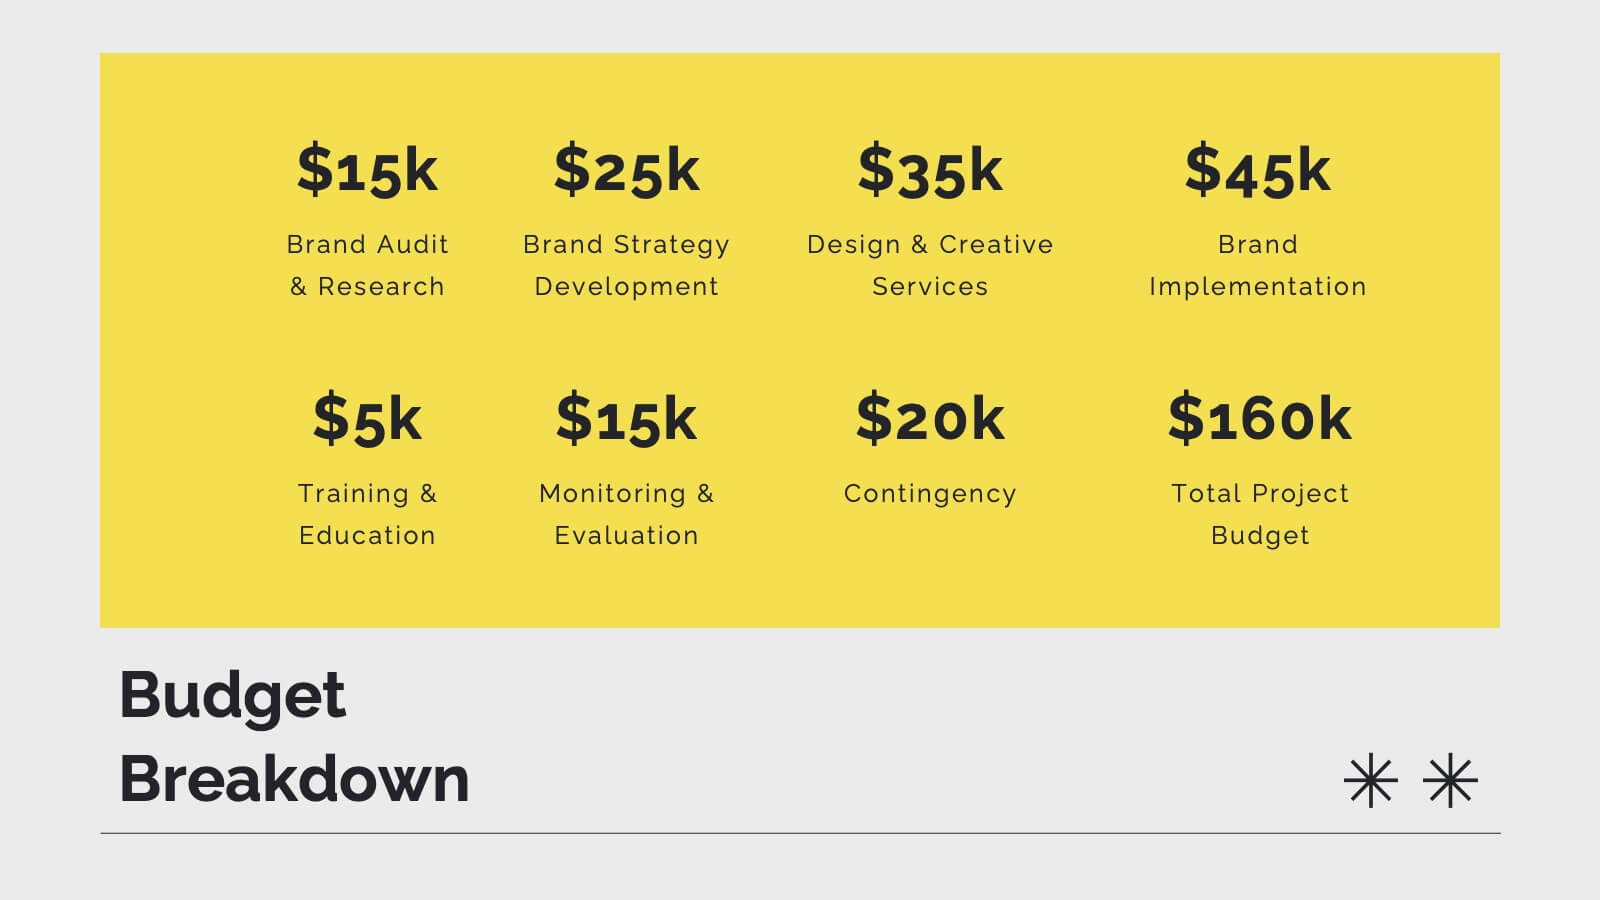
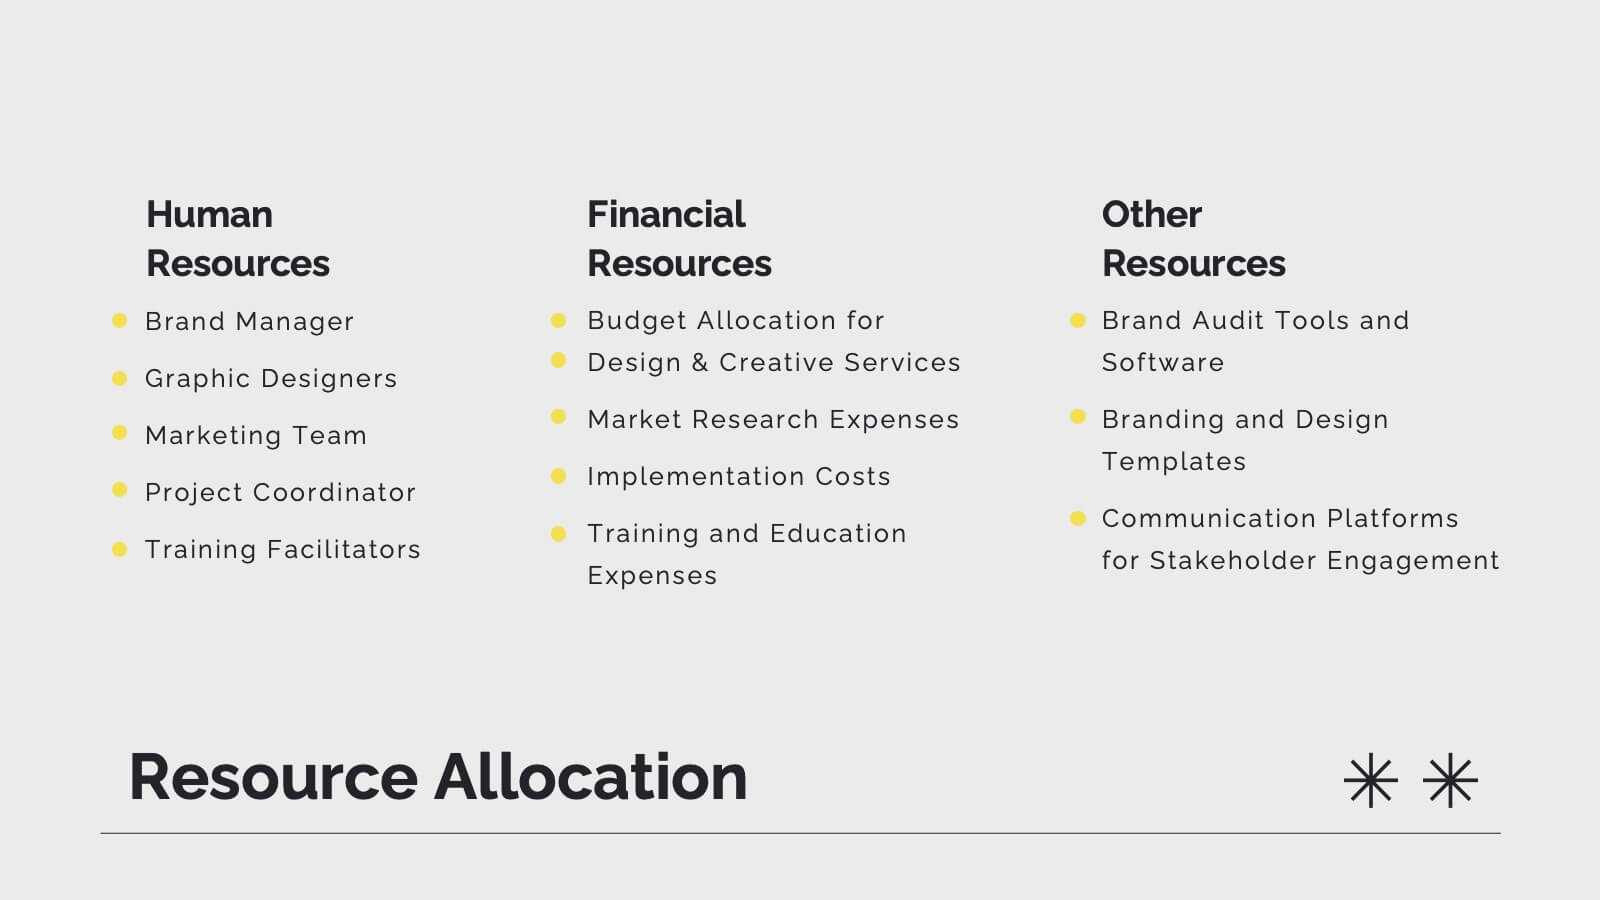
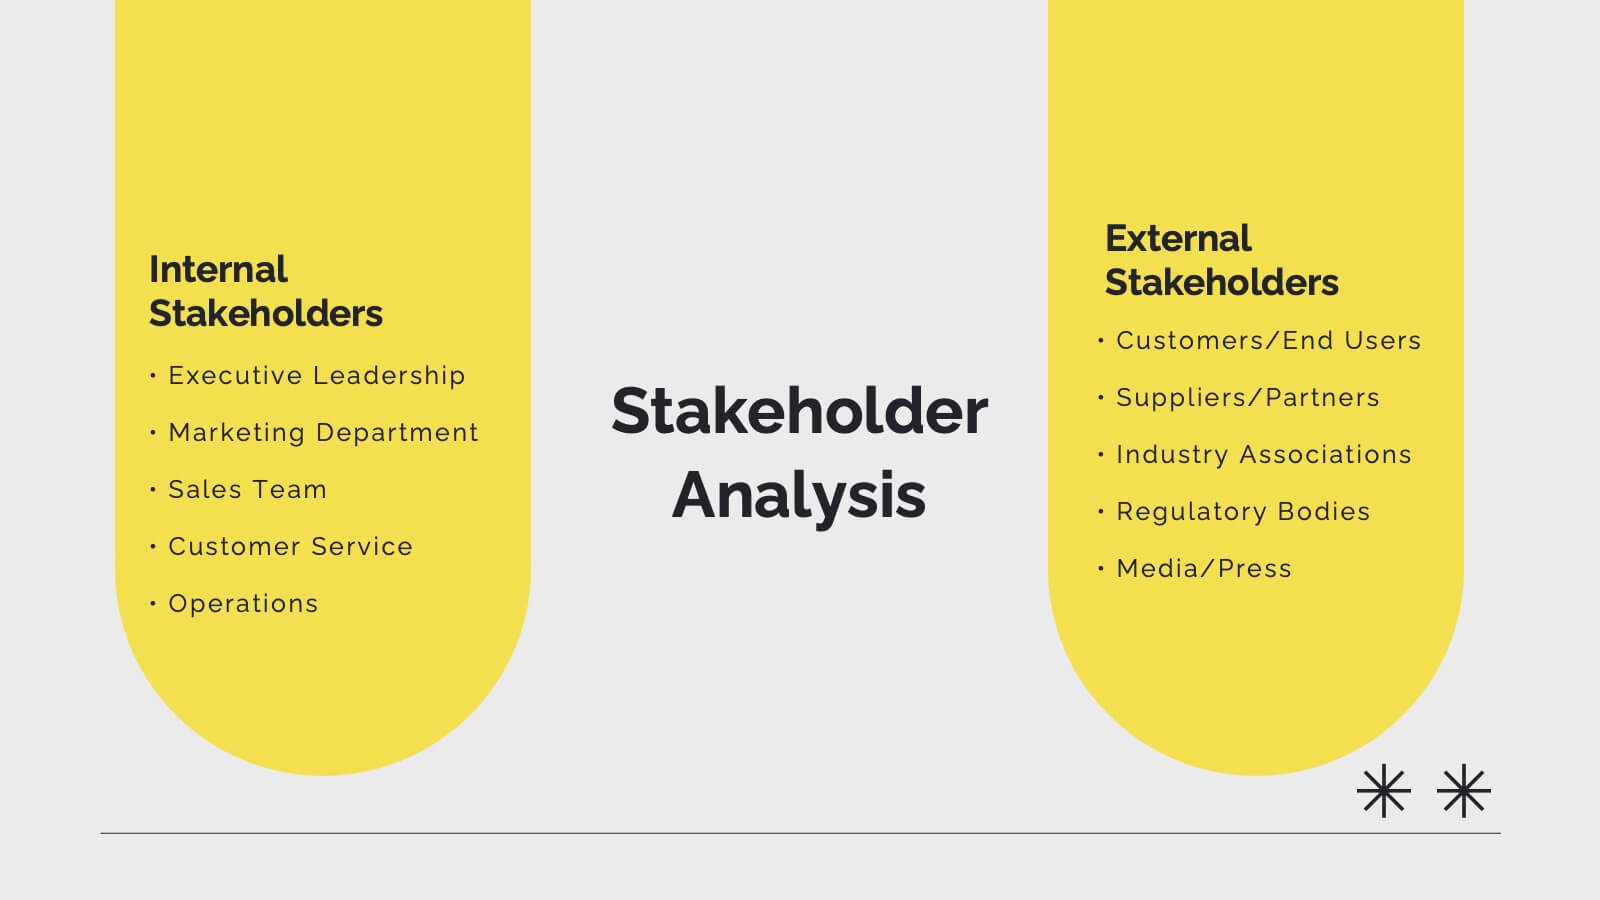
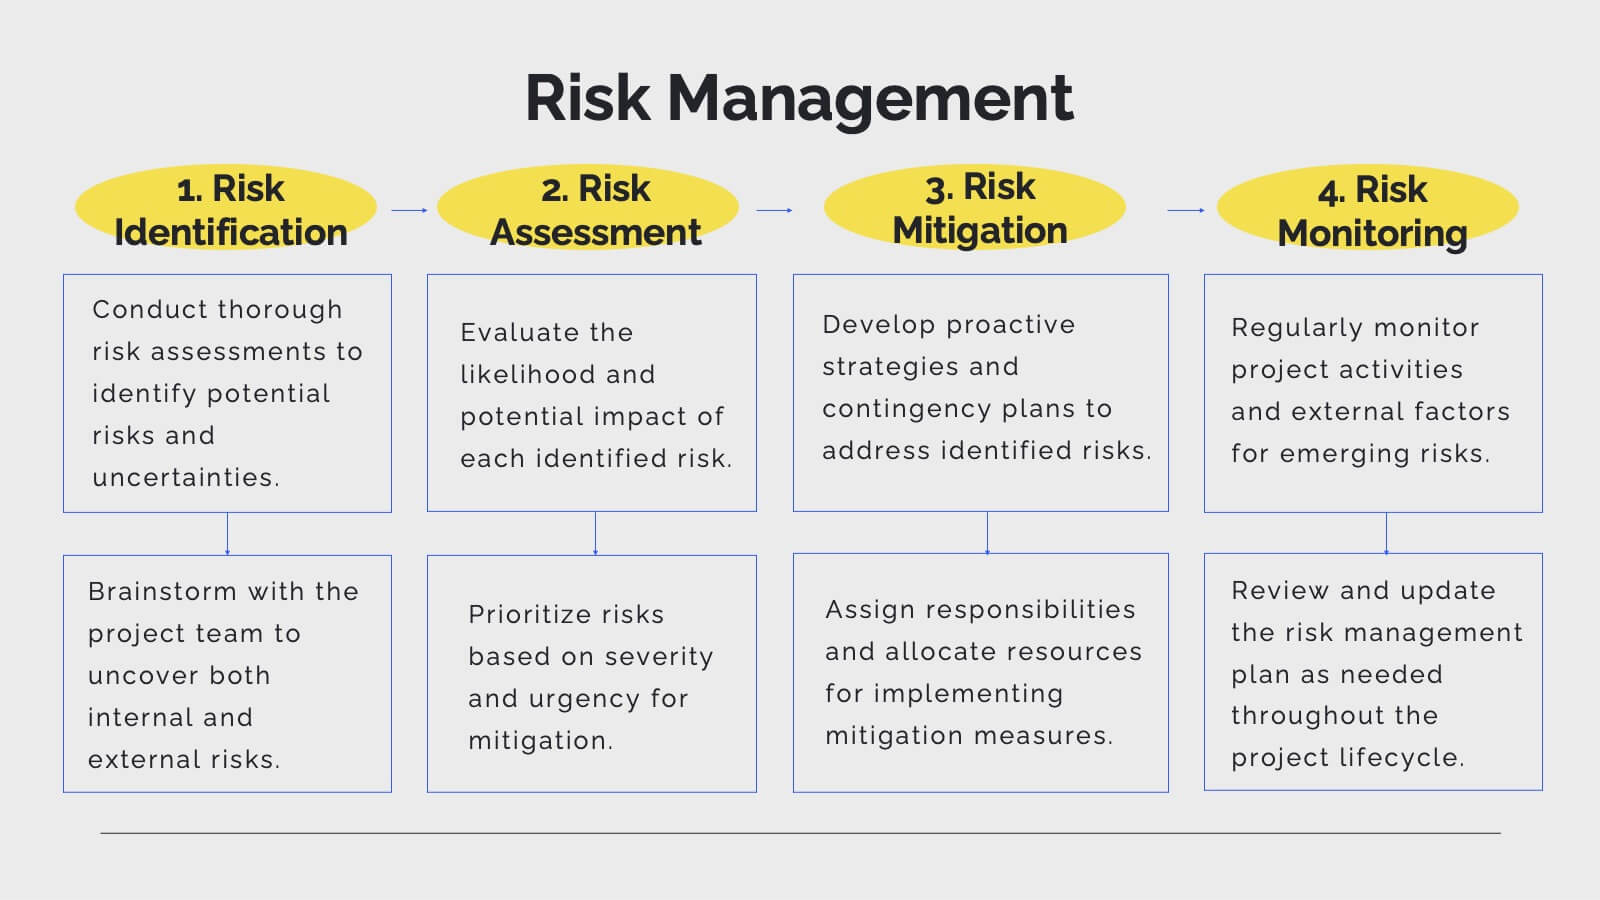
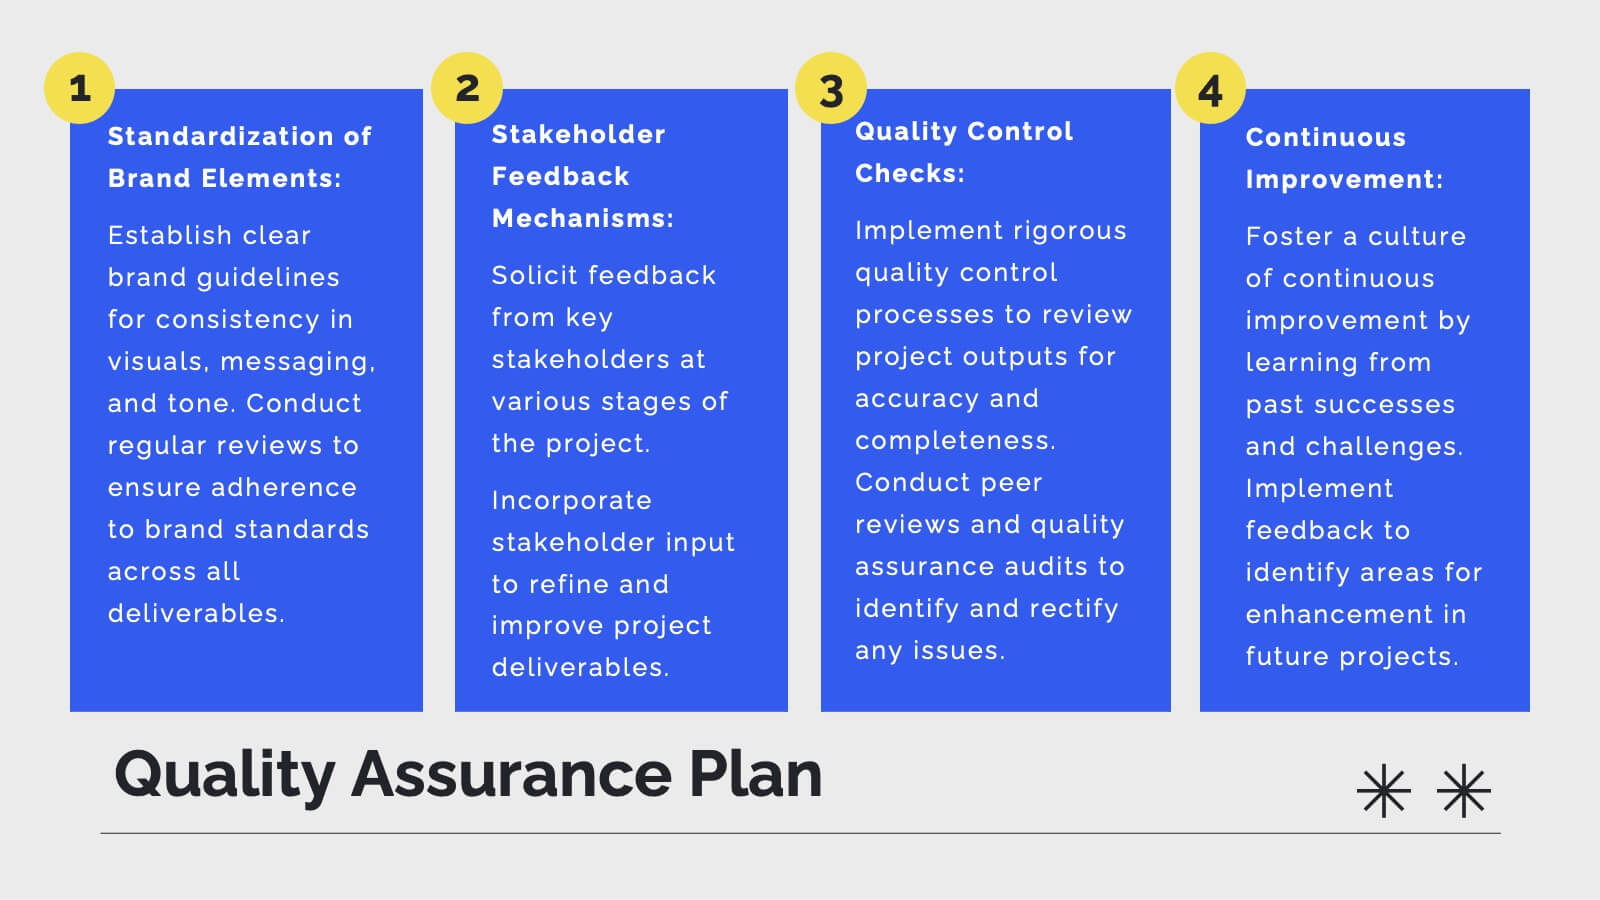
Pulse Project Management Plan Presentation
Streamline your project management with this vibrant template. It covers project overview, objectives, deliverables, methodology, timeline, budget, and risk management. Perfect for clear and engaging presentations. Compatible with PowerPoint, Keynote, and Google Slides for seamless customization.


6 slides
Business Ethics and Governance Presentation
Navigate the complexities of ethical decision-making with our Business Ethics and Governance Presentation template. This visually engaging tool highlights key aspects of corporate ethics and governance, ideal for workshops and training sessions. Compatible with PowerPoint, Keynote, and Google Slides, it's designed to facilitate clear and effective discussions.


4 slides
Blue Ocean Strategic Differentiation Presentation
Visually compare red and blue ocean strategies with this side-by-side layout. Perfect for showcasing competitive advantages, innovation, and market positioning. Each column highlights key differentiators in a clean, structured format. Ideal for marketing, strategy, or executive presentations. Fully customizable in PowerPoint, Keynote, and Google Slides to match your branding.


26 slides
Kasra Presentation Template
Fitness is an important part of good health. It improves your quality of life and may keep you from getting sick by helping to strengthen your immune system, prevent heart disease and reduce the risk of diabetes and much more. The Kasra template will help you deliver your message with an impact. Whether you're selling your product, promoting an event, or creating a landing page, this template features the necessary components to capture your audience's attention. This provides you with a powerful platform to engage others, illustrate key messages and demonstrate deep insight into an issue.


7 slides
Company Vision and Future Direction
Bring your company’s future into focus with this sleek, icon-led layout designed to showcase strategic goals, values, and long-term vision. Perfect for leadership presentations, investor updates, or team briefings, this slide turns abstract direction into a clear path forward. Fully compatible with PowerPoint, Keynote, and Google Slides.


7 slides
Performance Improvement Infographics
A Performance Improvement infographic is a visual representation of the key elements of a plan to enhance the performance of an individual, team, or organization. The purpose of this template is to communicate the plan's objectives, strategies, and metrics in an informative and engaging way. This infographic contains graphs, and diagrams to illustrate key performance indicators and other measures of success. This performance template can help motivate and engage stakeholders, highlight the benefits of performance improvement, and facilitate communication and collaboration among team members.


6 slides
Sales Funnel Performance Presentation
Visualize your customer journey with this Sales Funnel Performance Presentation. The clean funnel diagram allows you to clearly represent each stage—awareness, interest, decision, and action—using vibrant, stacked layers. Customize the six labeled steps and supporting icons to fit your brand strategy. Perfect for showcasing conversion metrics or campaign insights in PowerPoint, Keynote, or Google Slides.