


Features
- 5 Unique slides
- Fully editable and easy to edit in Microsoft Powerpoint, Keynote and Google Slides
- 16:9 widescreen layout
- Clean and professional designs
- Export to JPG, PDF or send by email


Do you have any questions?
Recommend


21 slides
Twilight Project Milestones Report Presentation
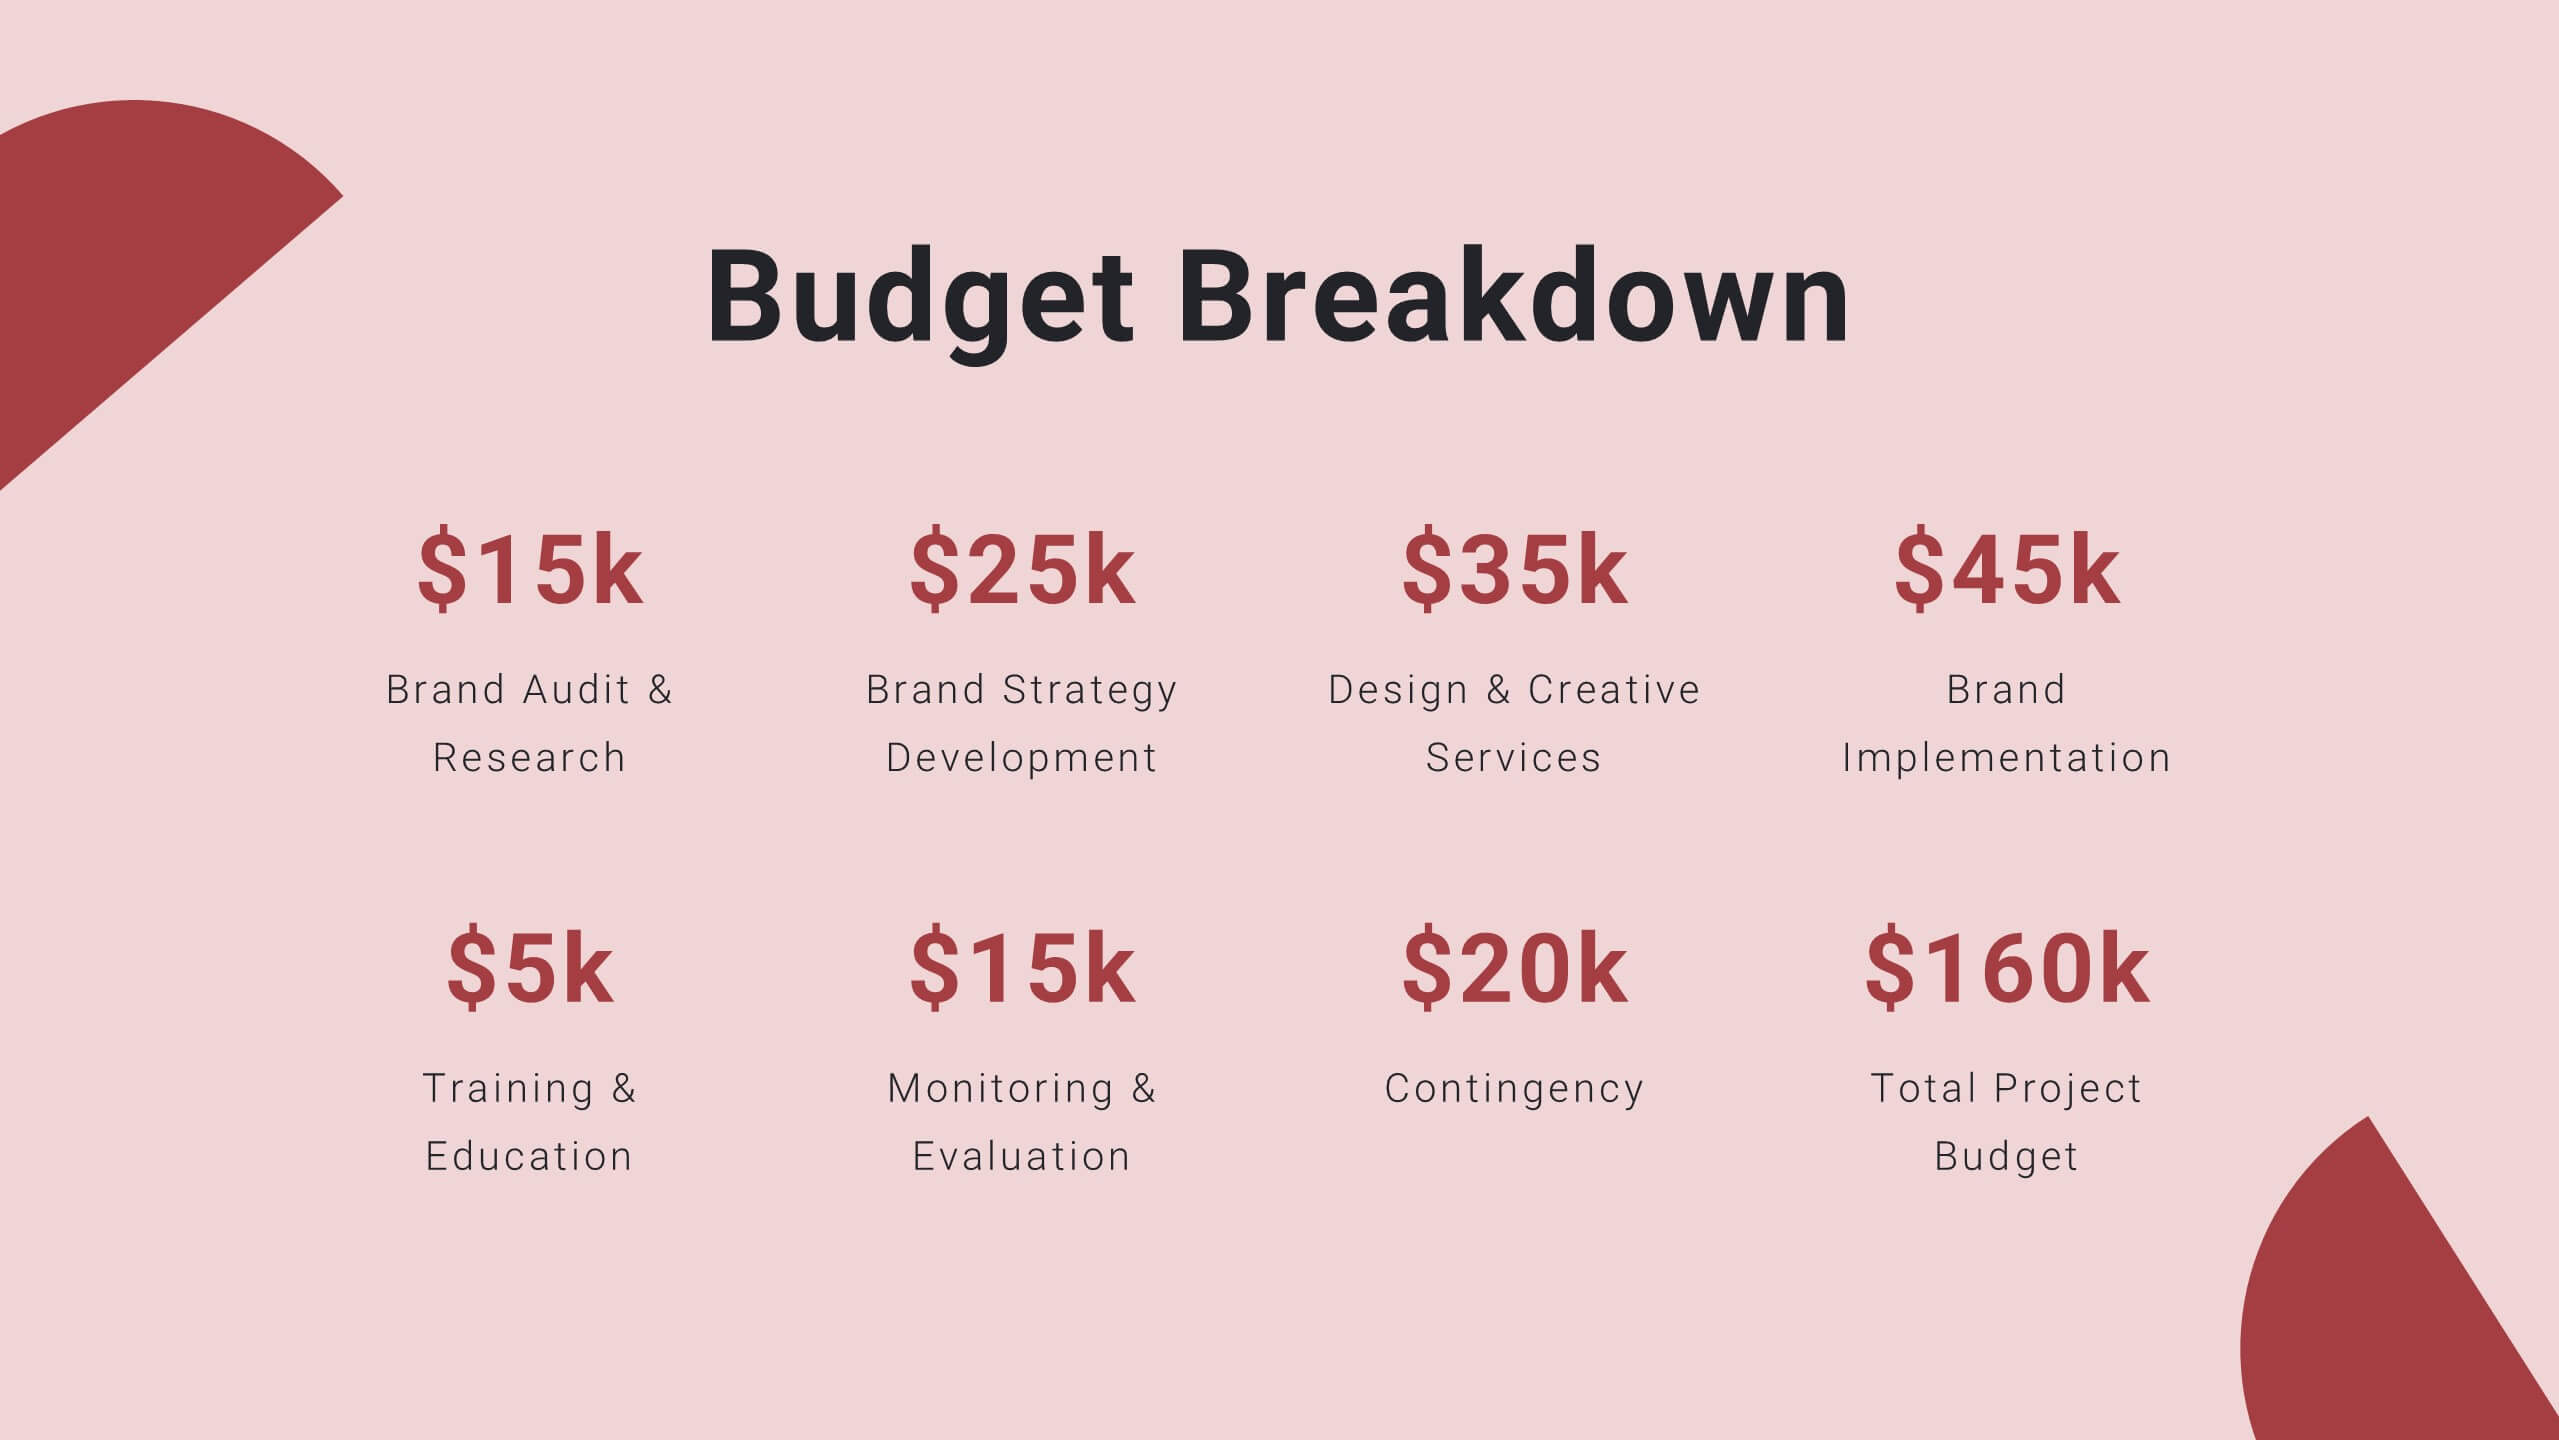
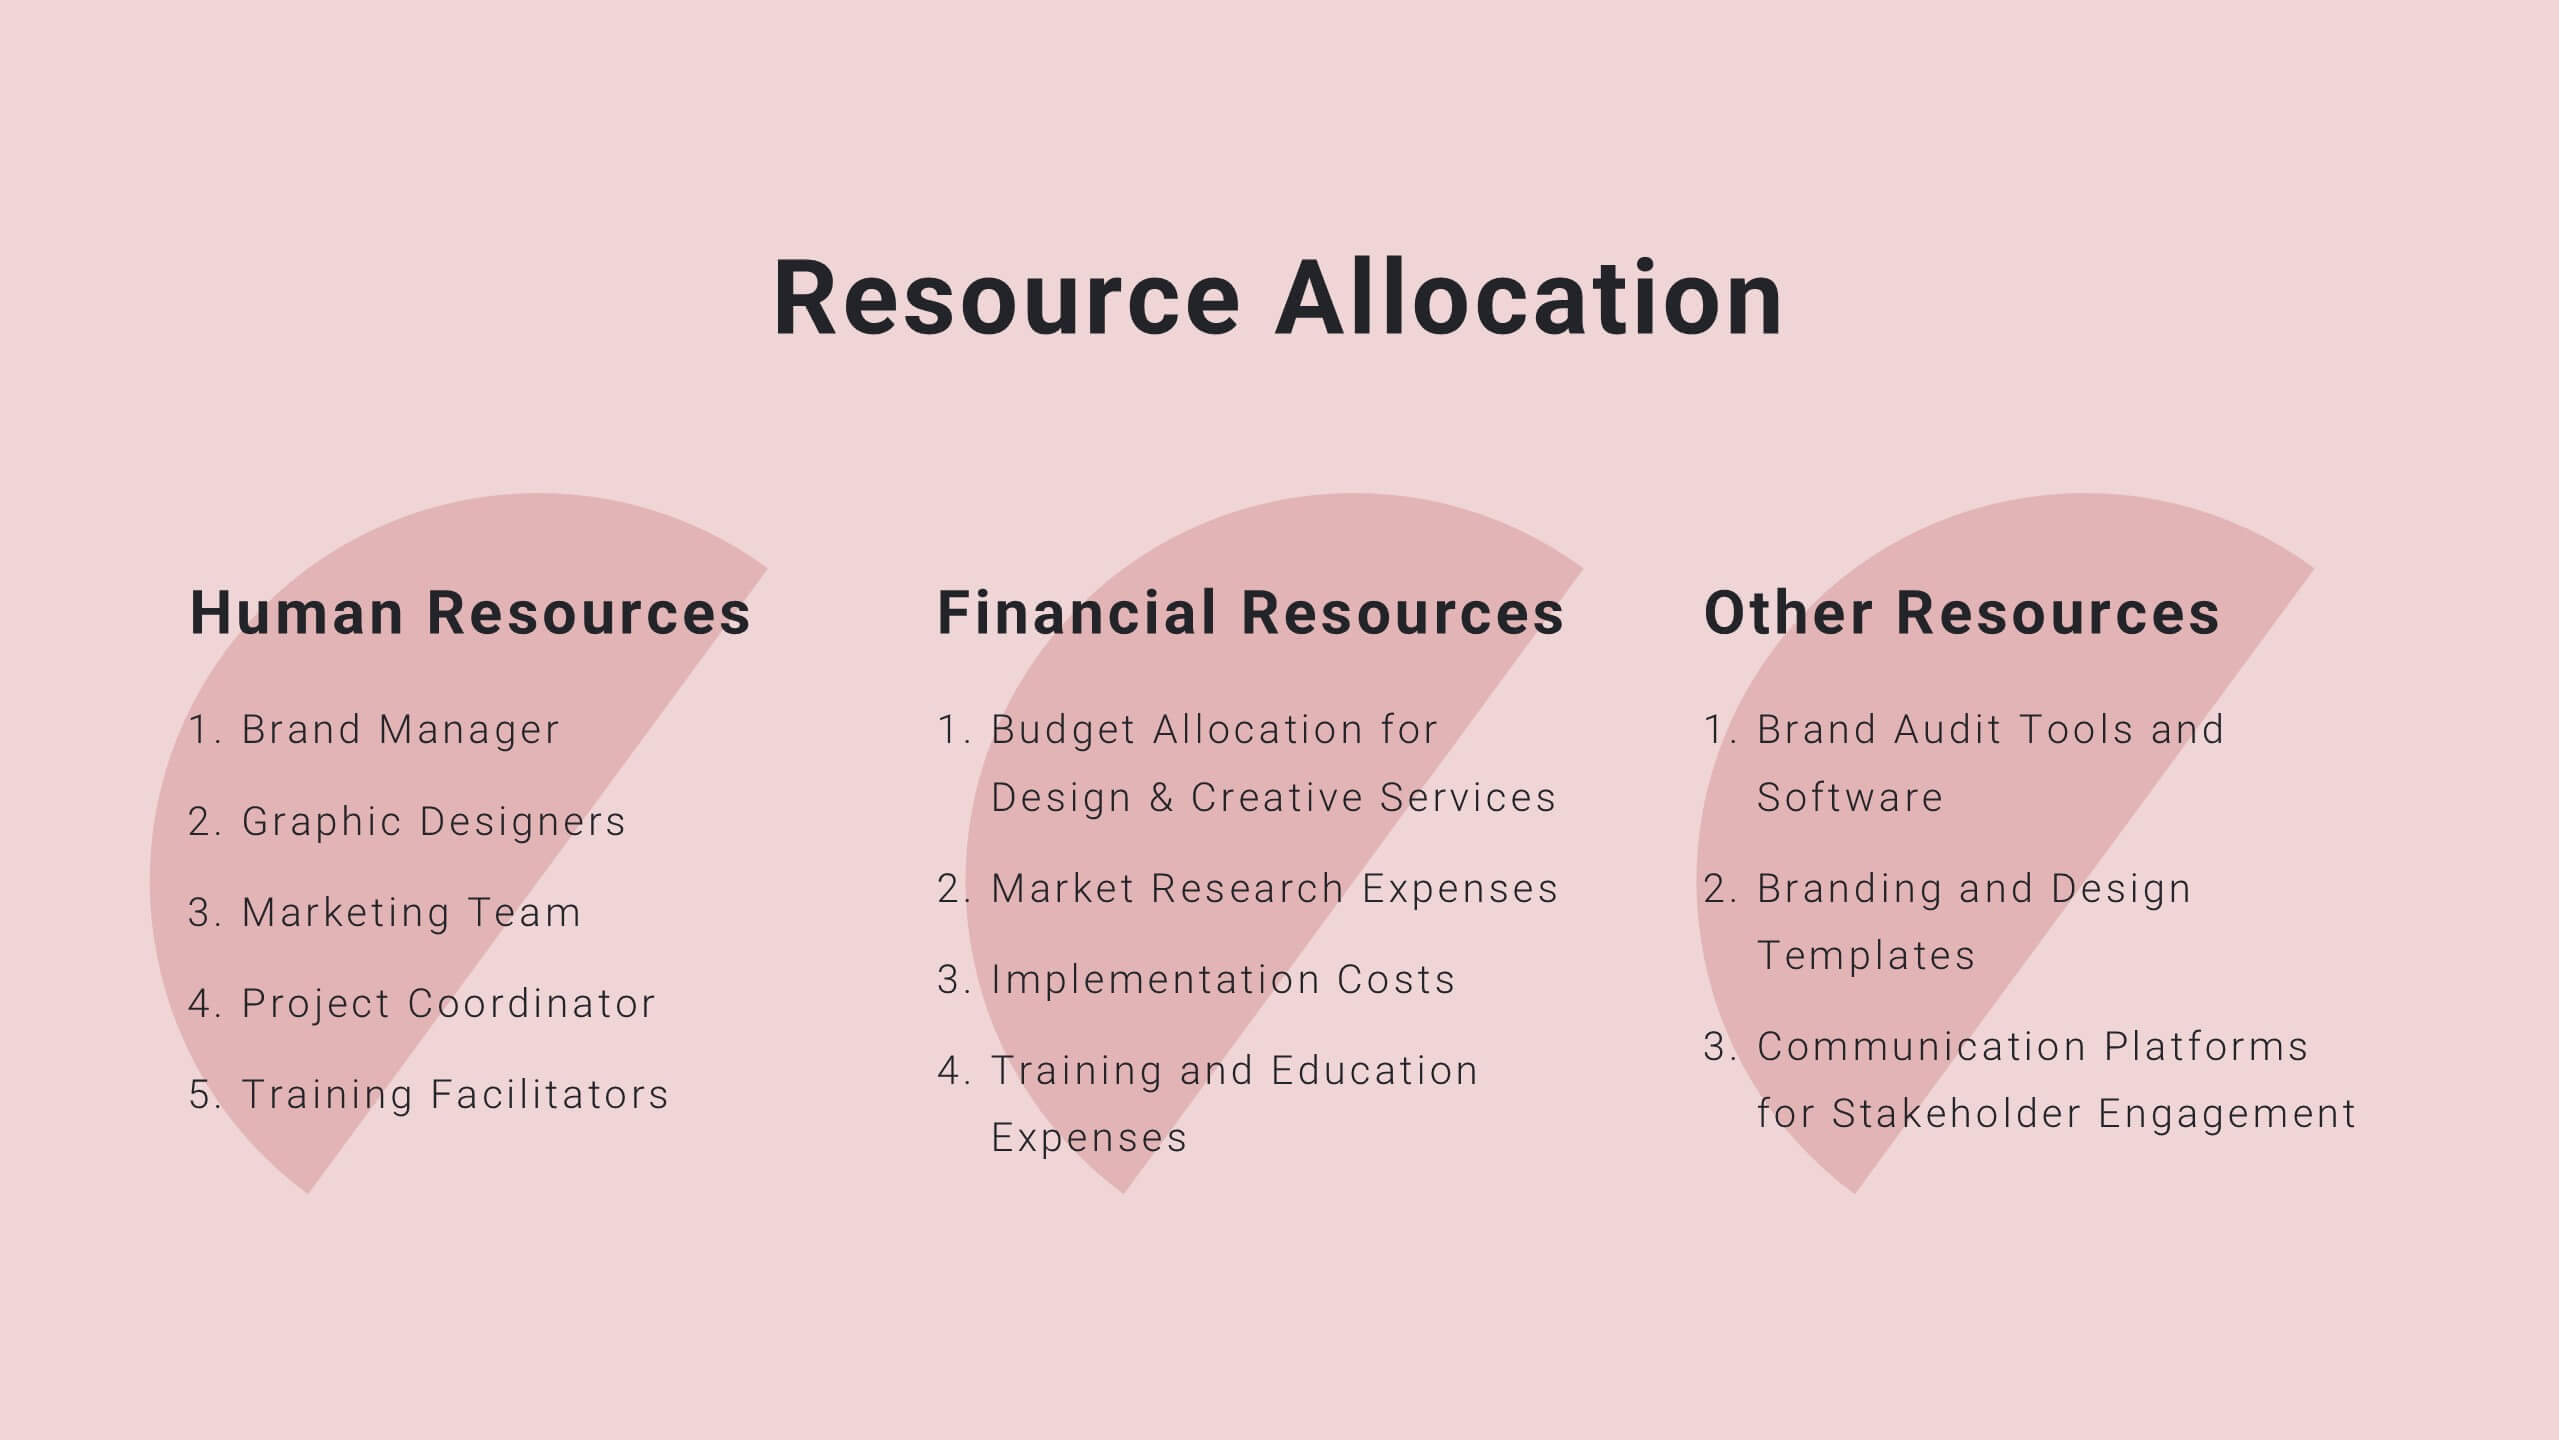
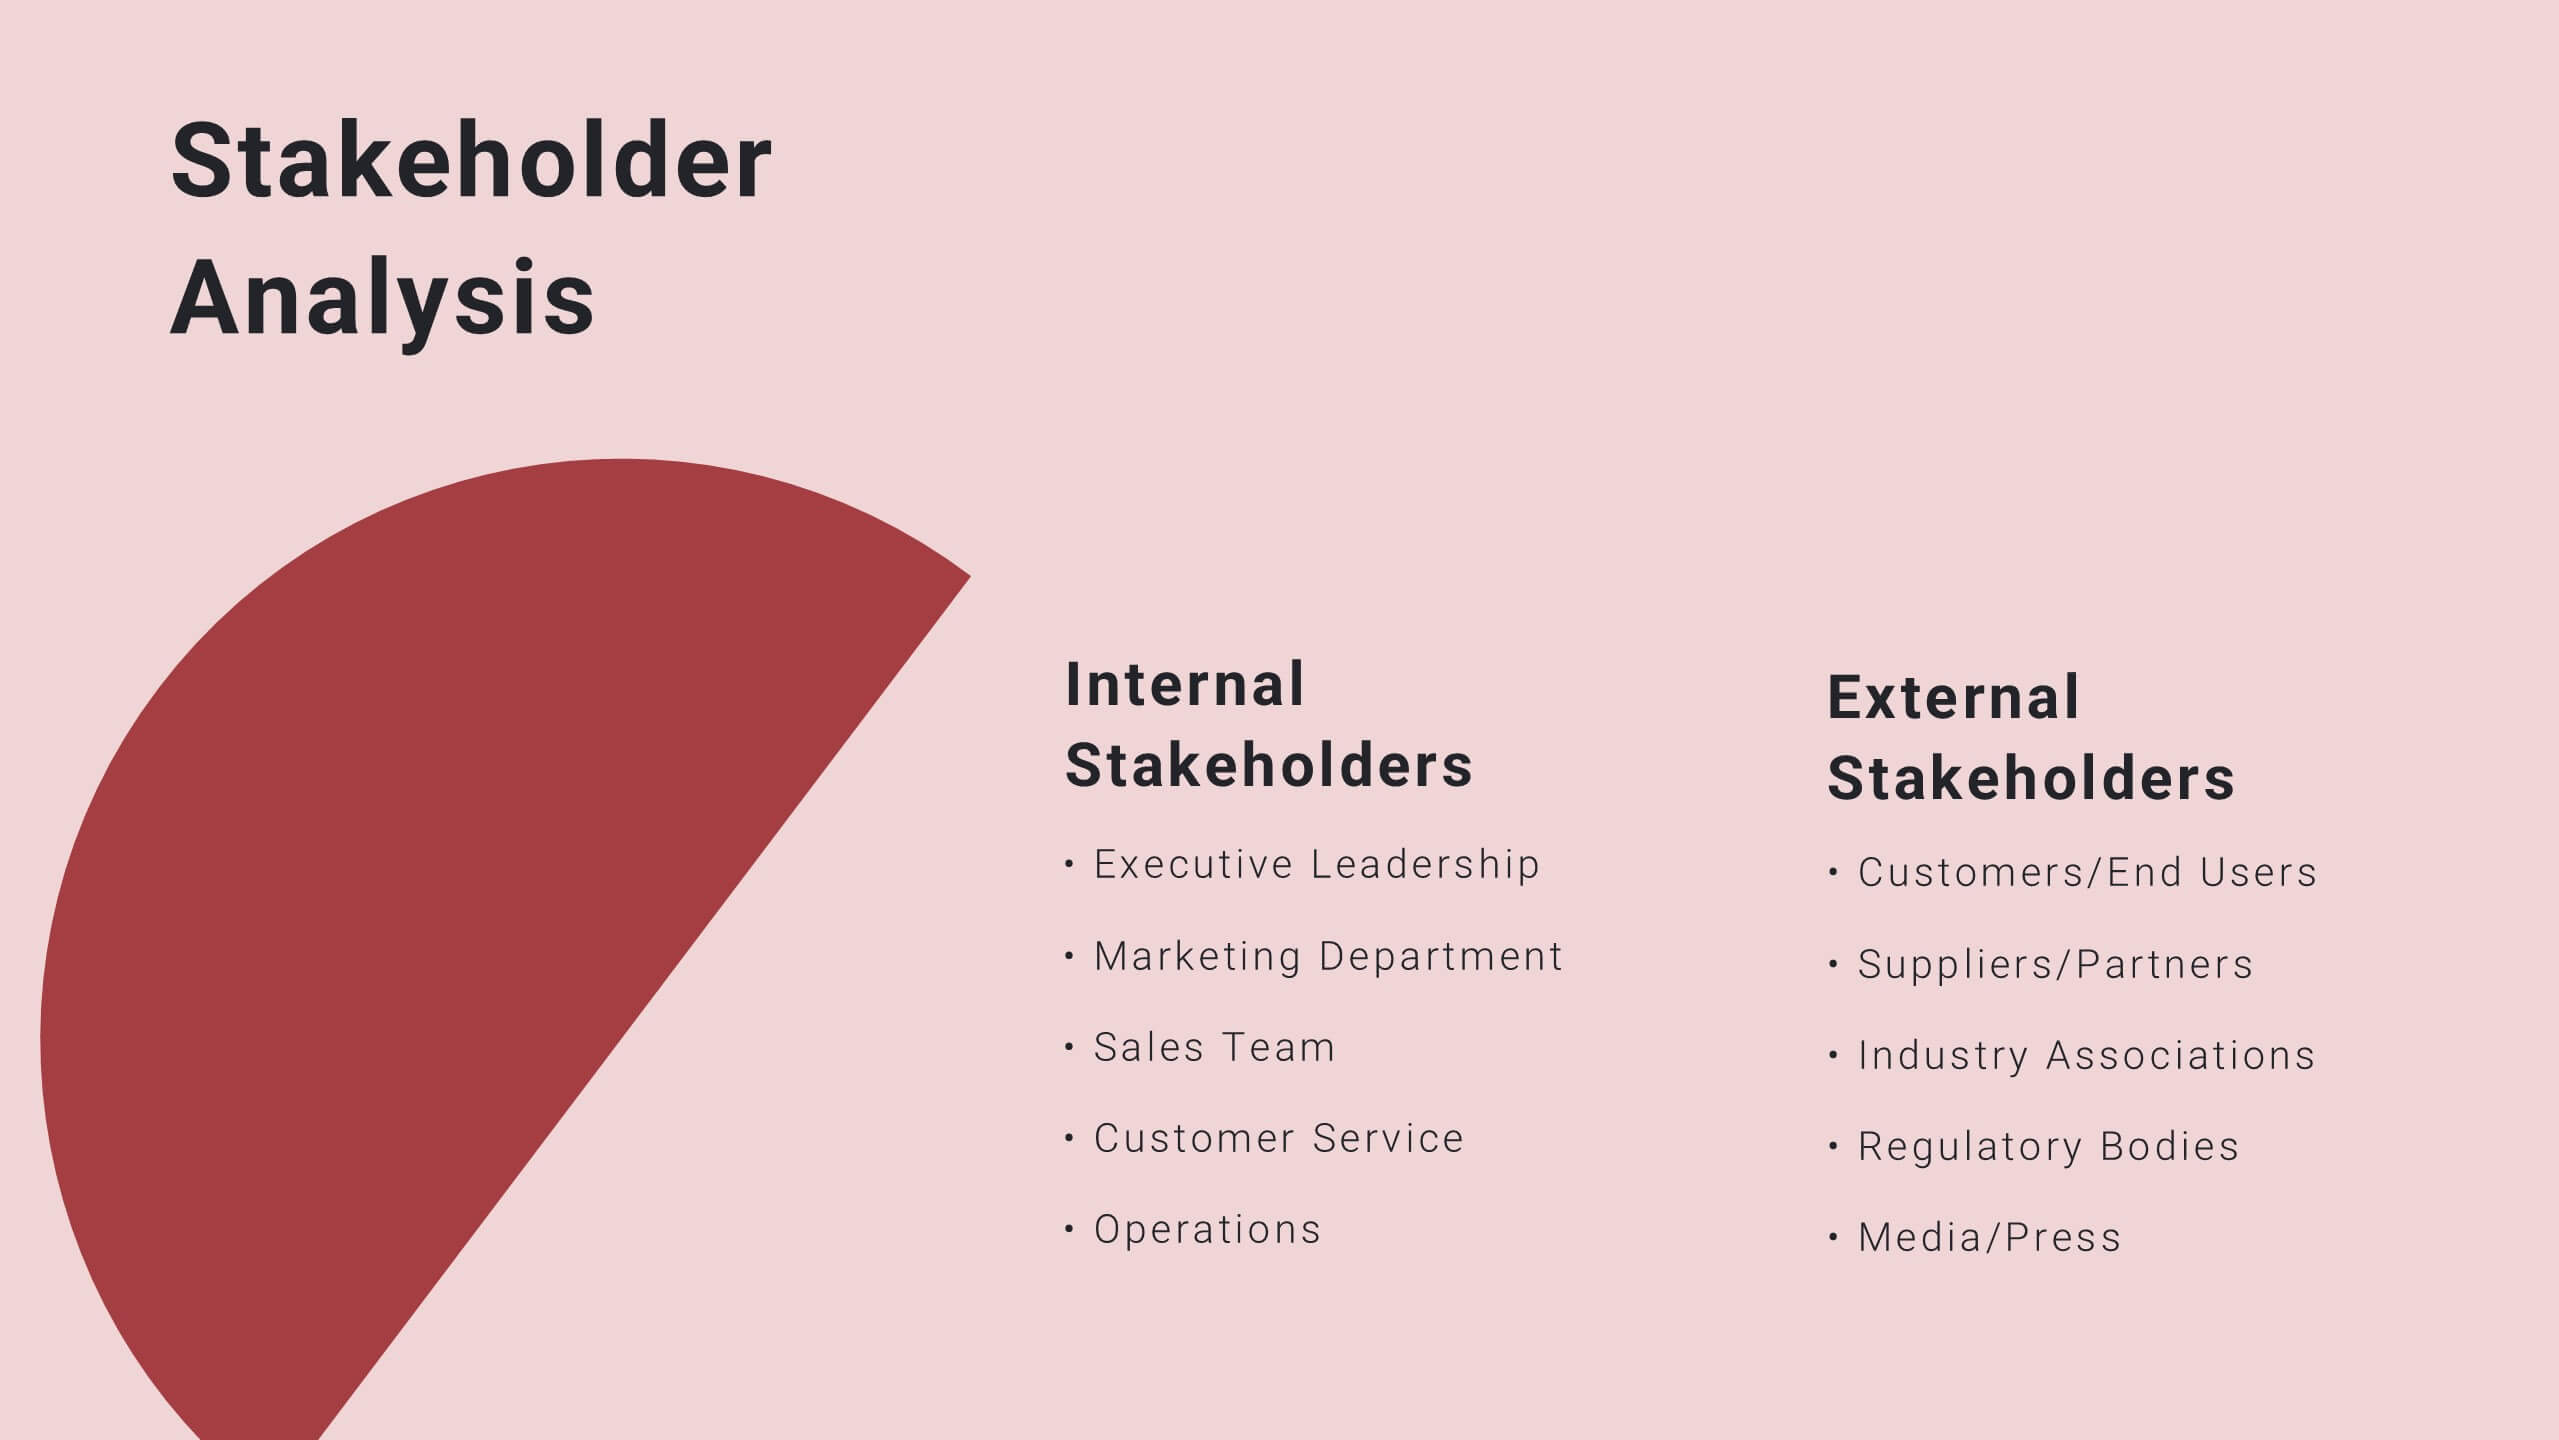
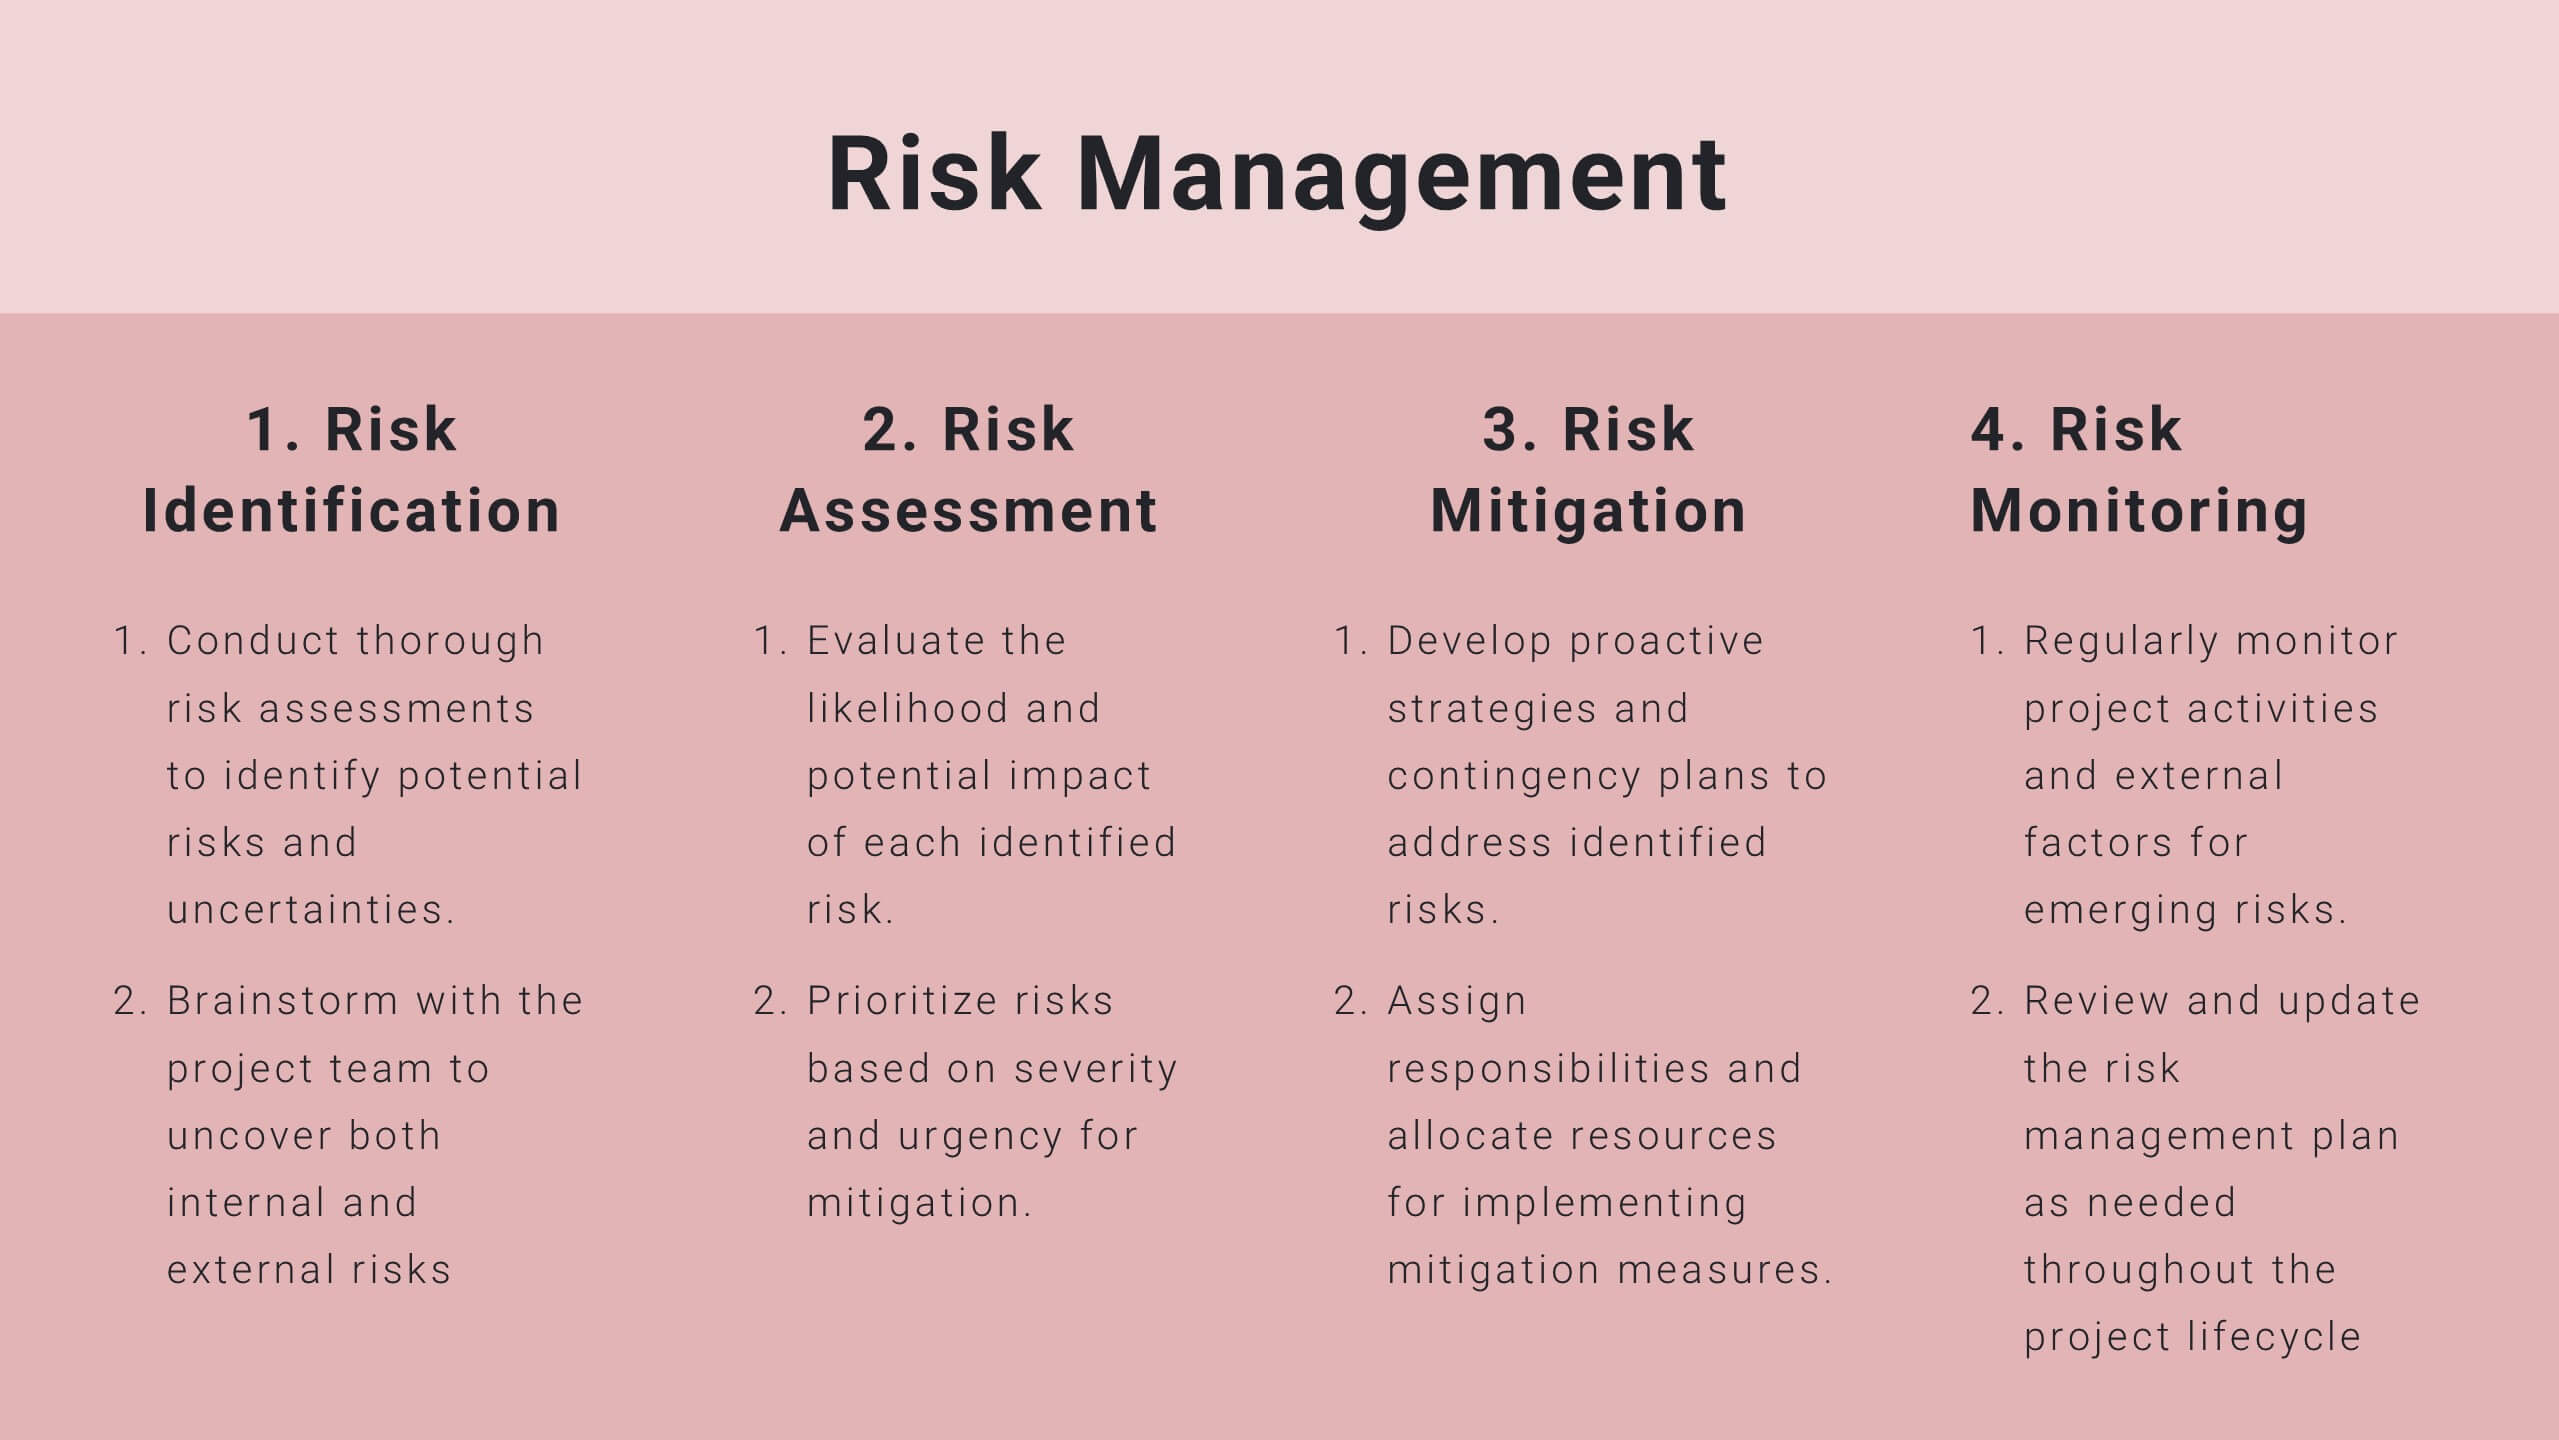
Present your project milestones and plan with clarity using this sleek project proposal template! It includes sections for objectives, timelines, budget breakdowns, and risk management. Perfect for organizing and presenting complex project plans, it’s fully customizable and compatible with PowerPoint, Keynote, and Google Slides, ensuring a professional presentation every time.


22 slides
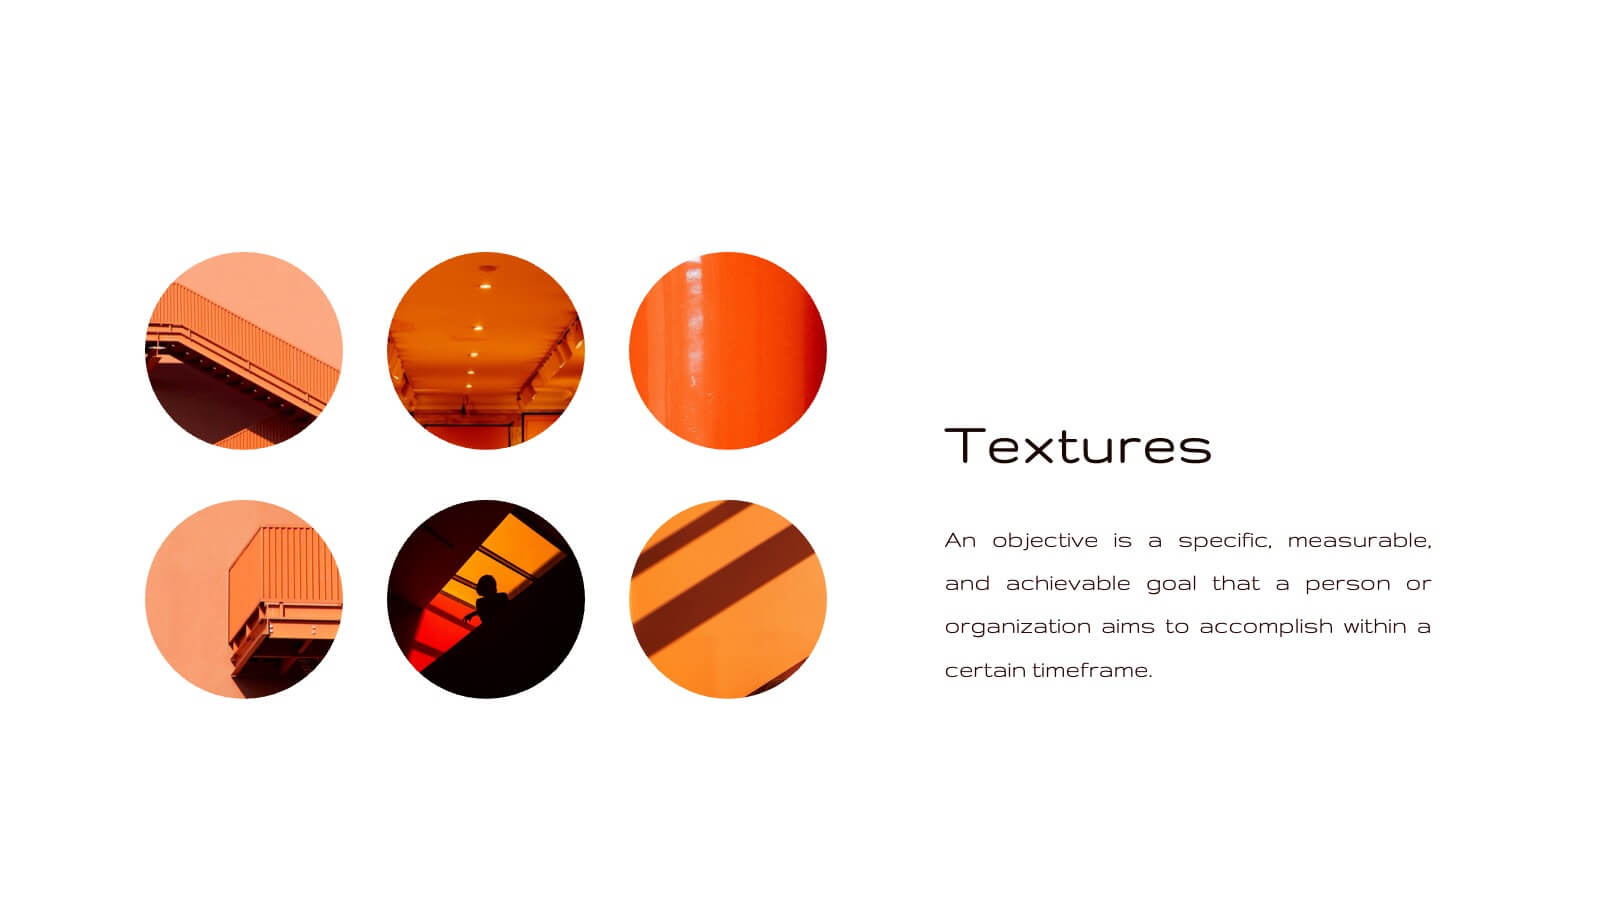
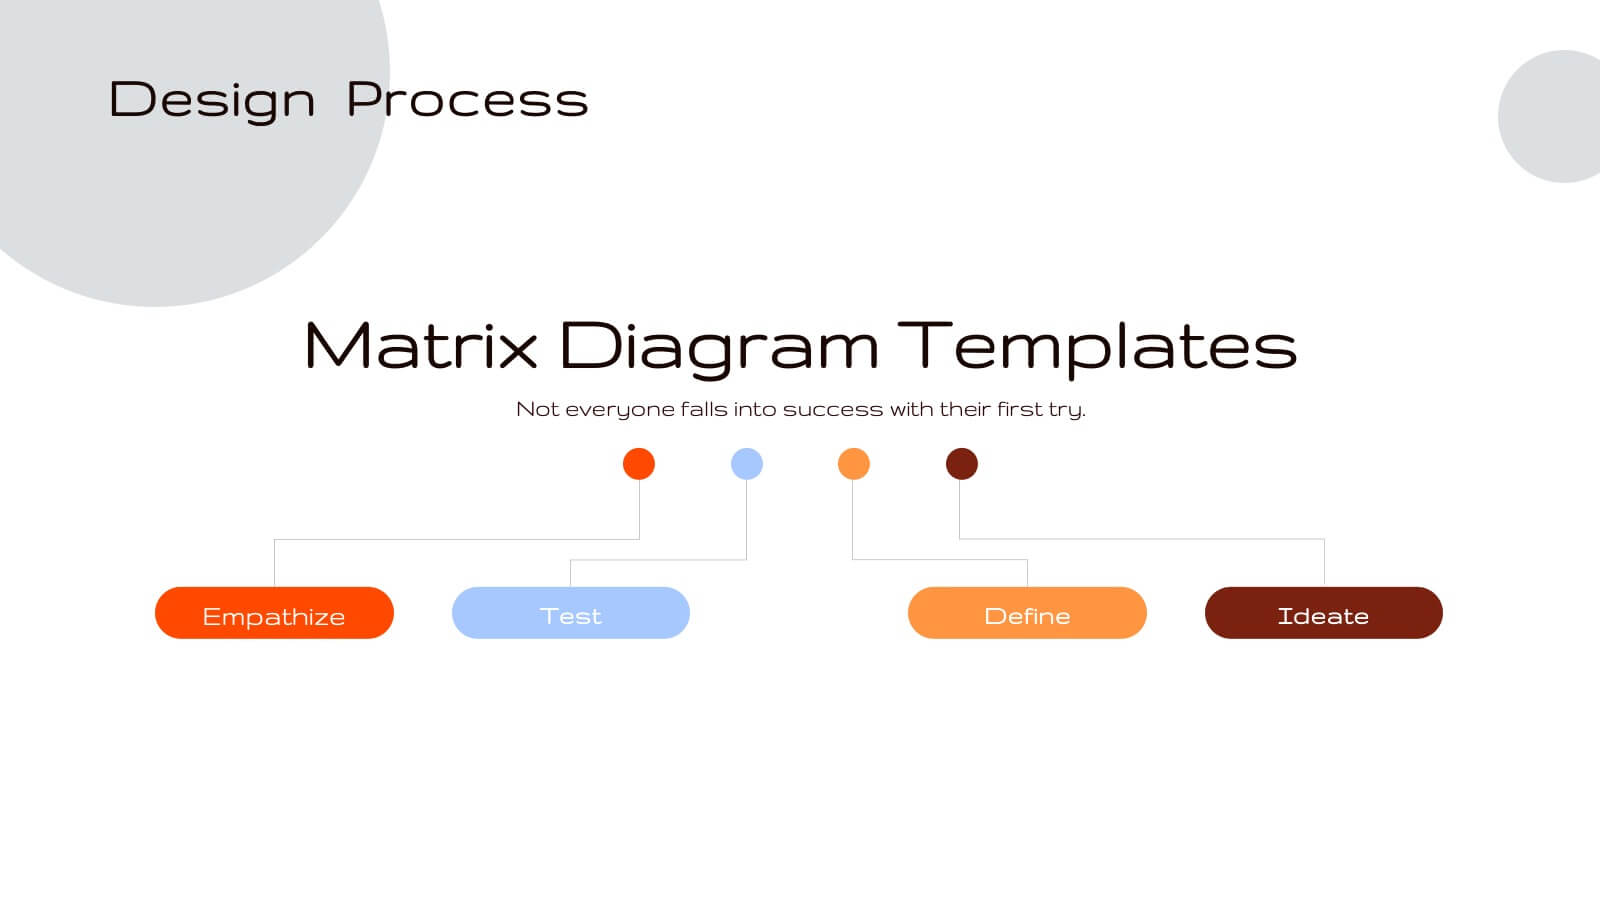
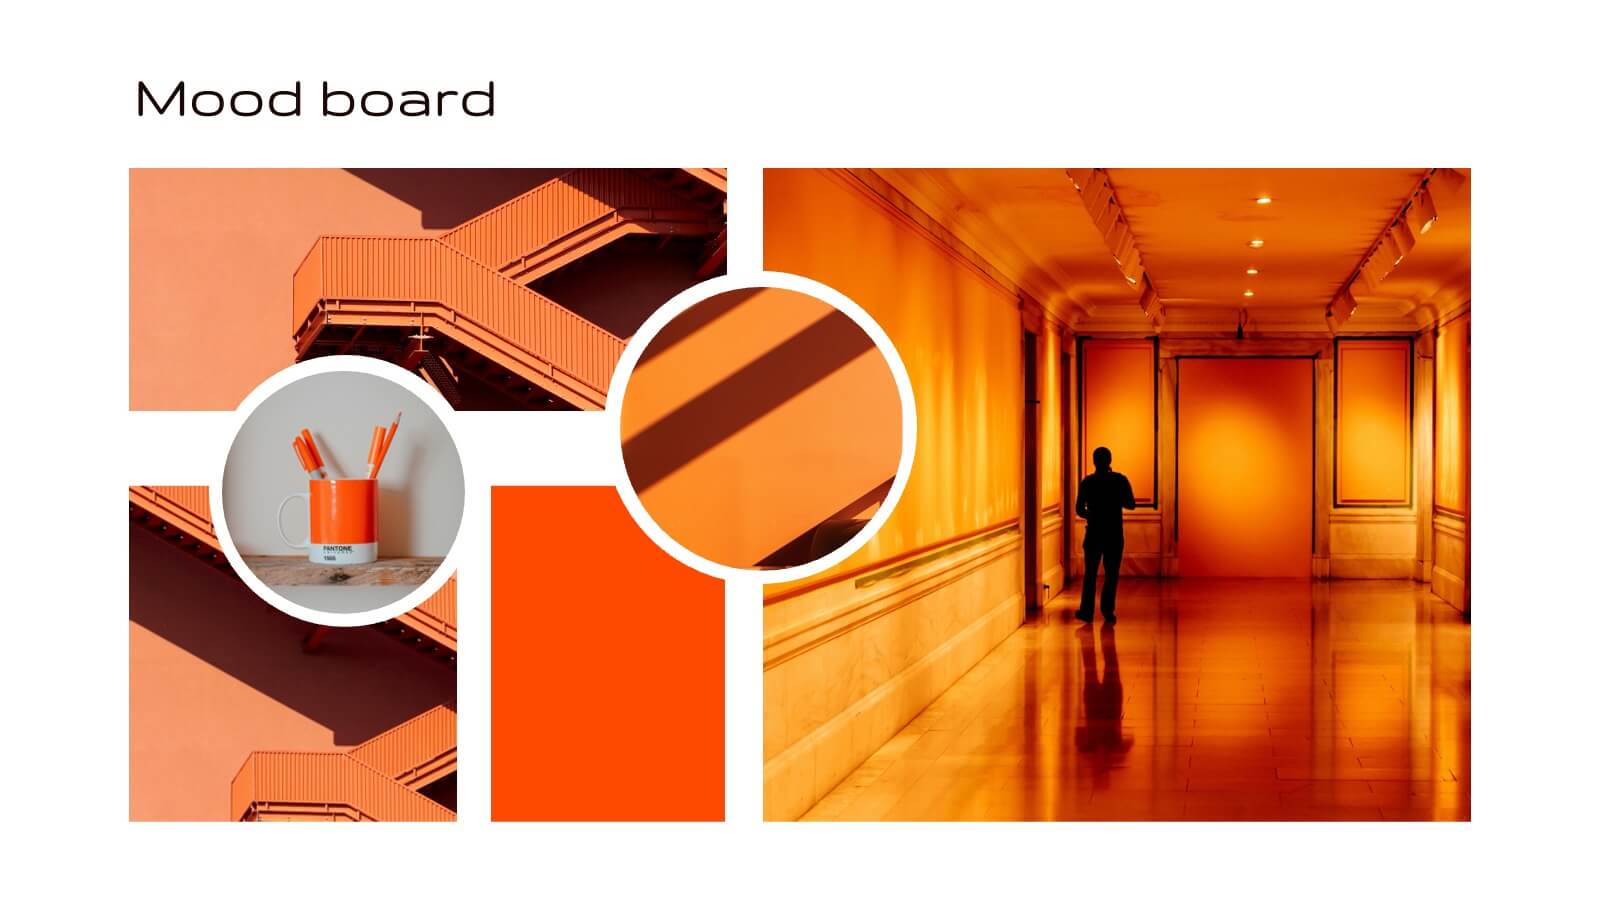
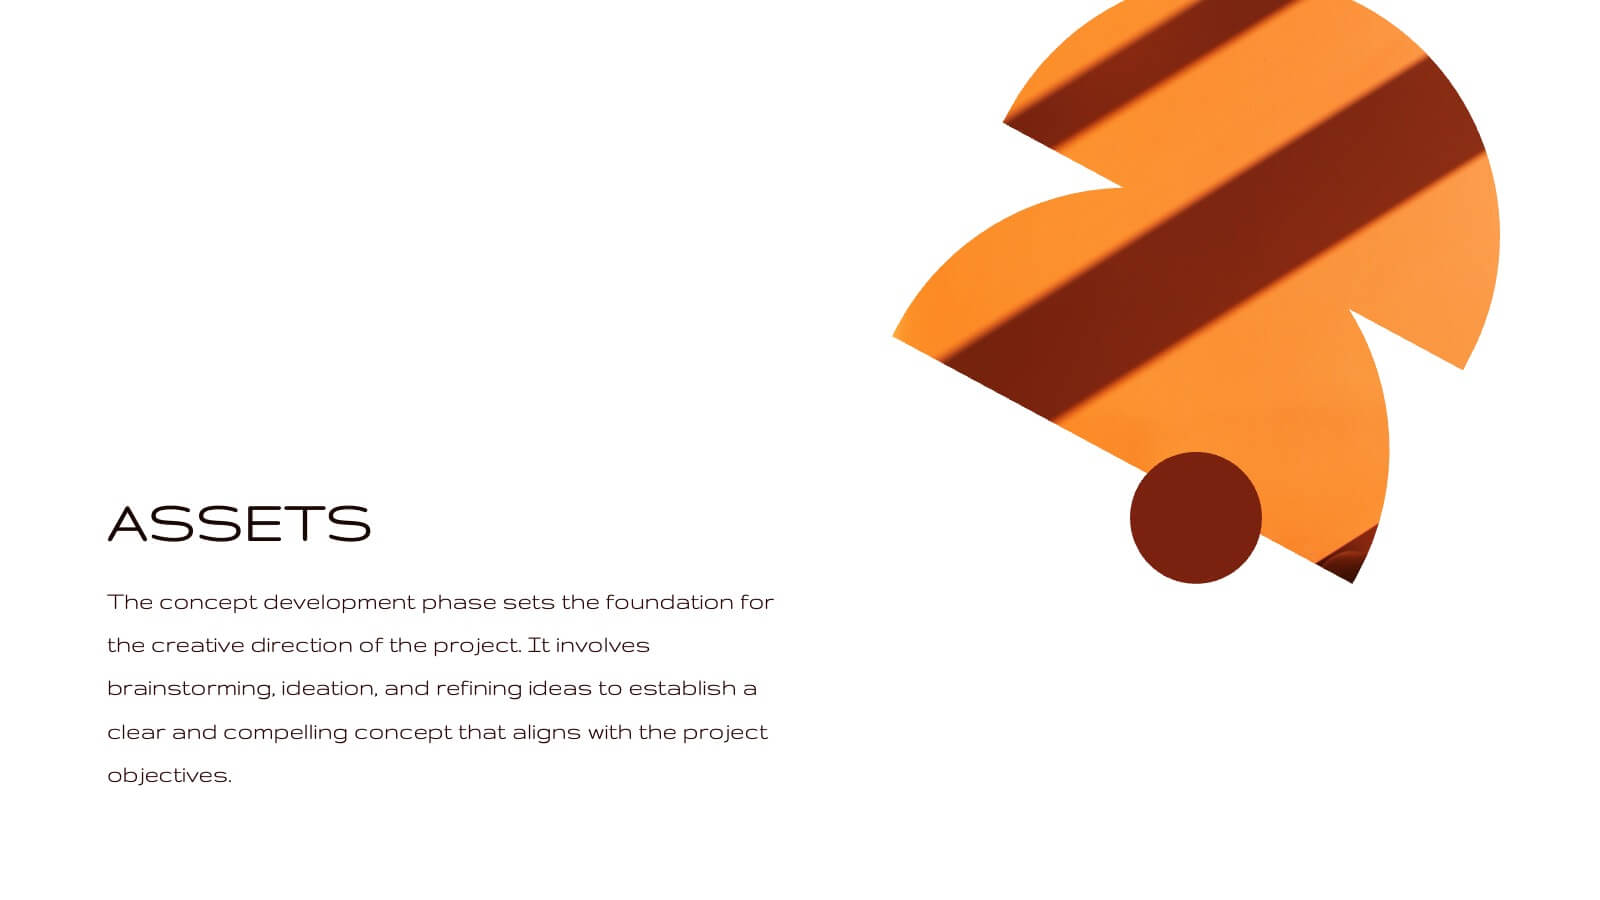
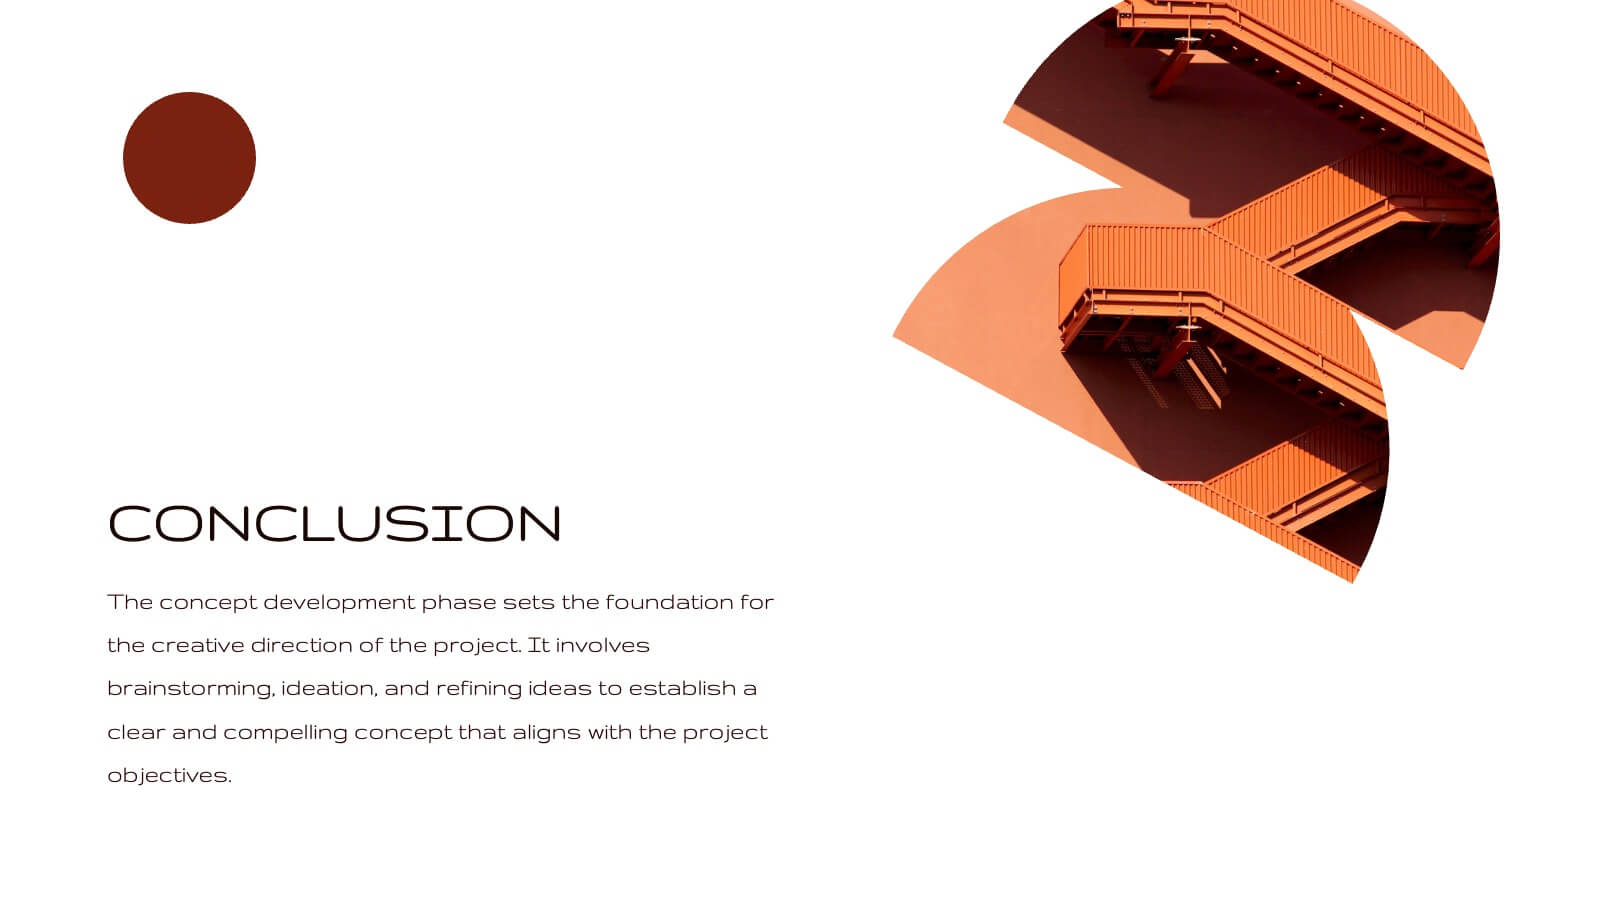
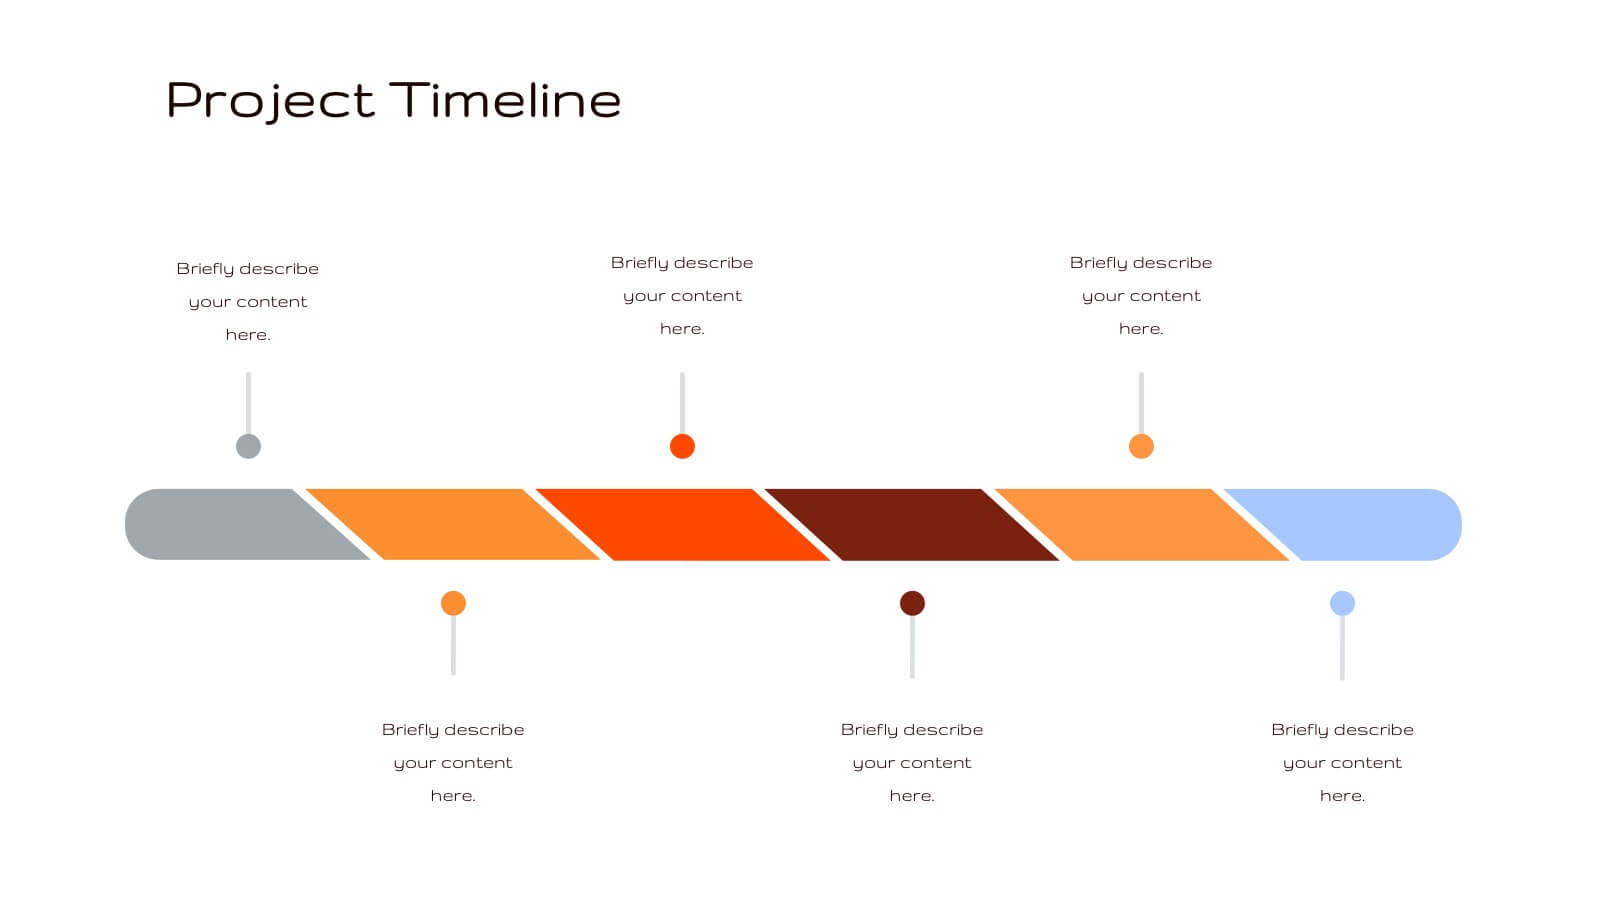
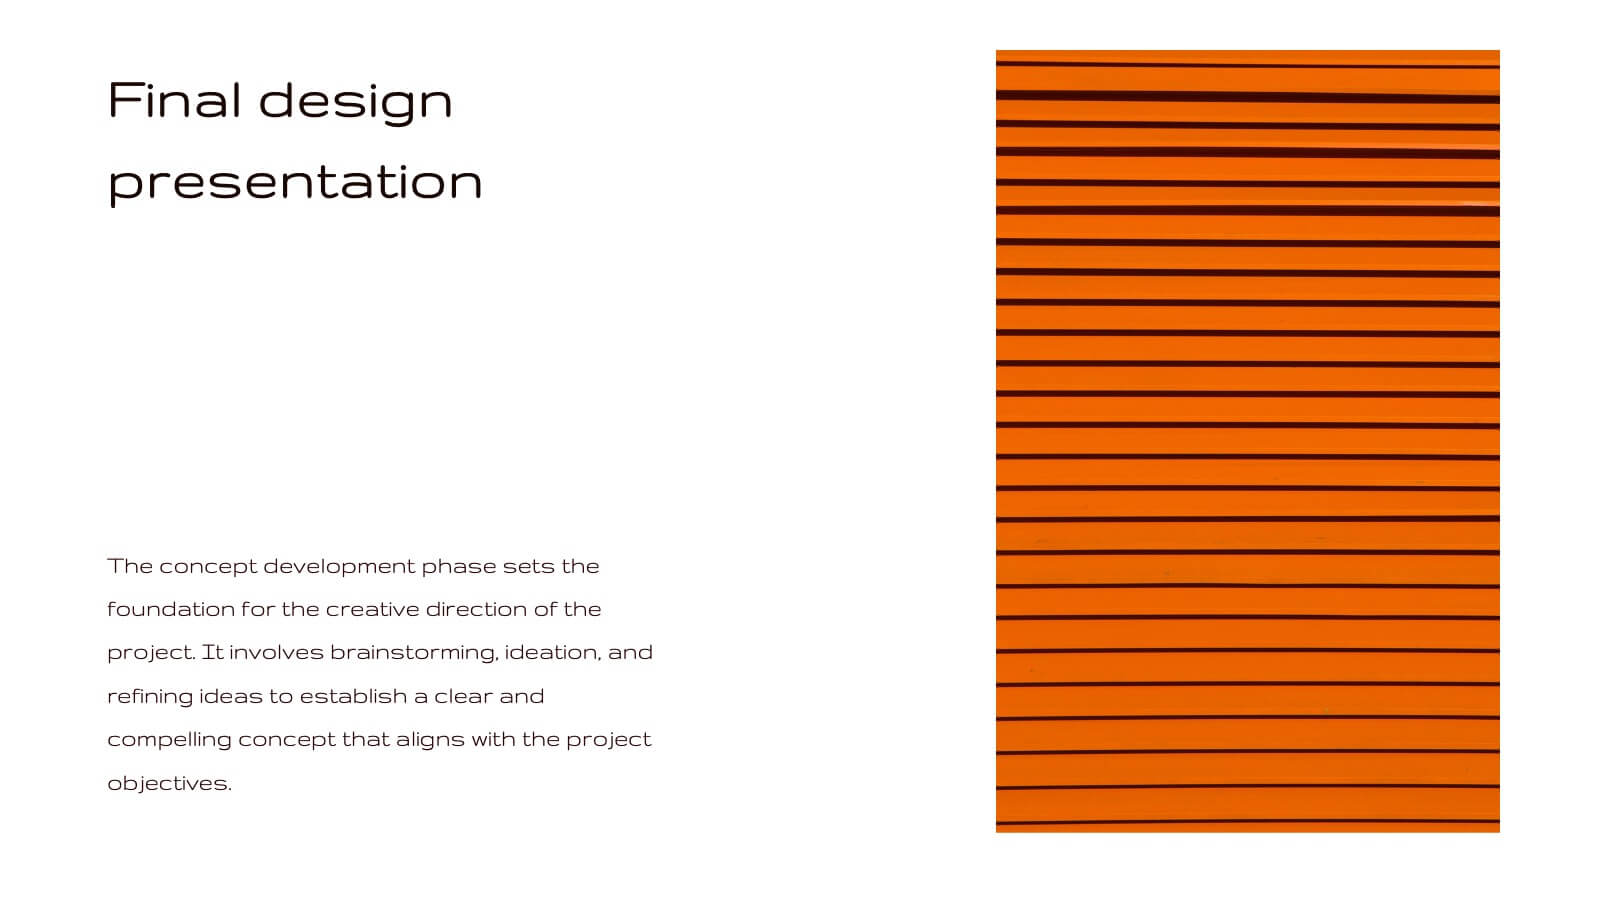
Radiance Creative Design Report Presentation
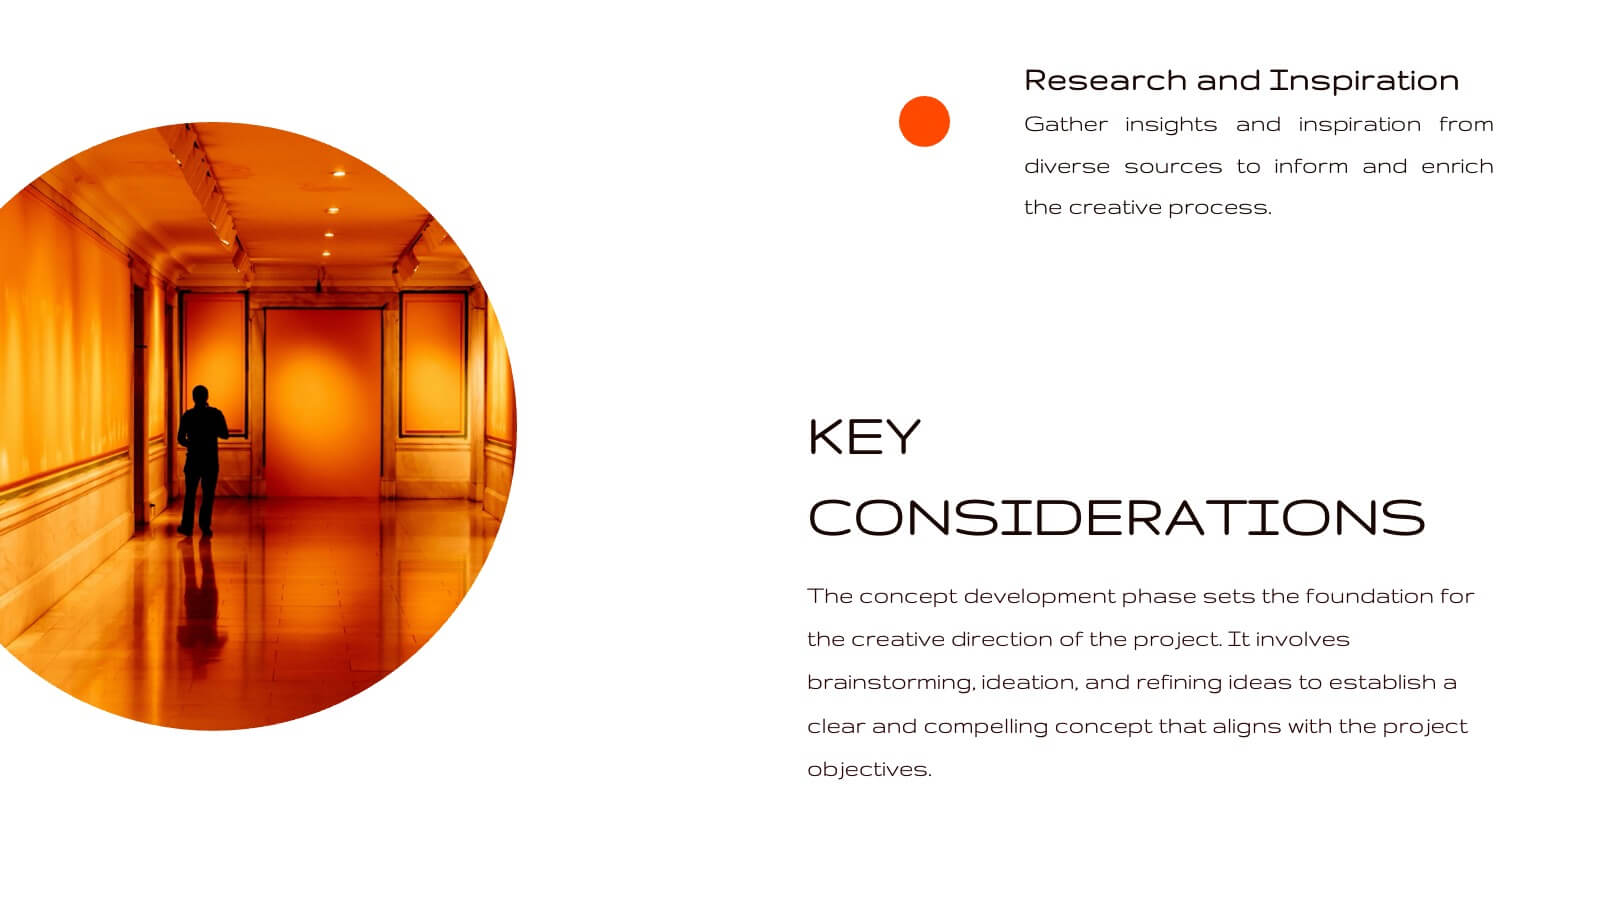
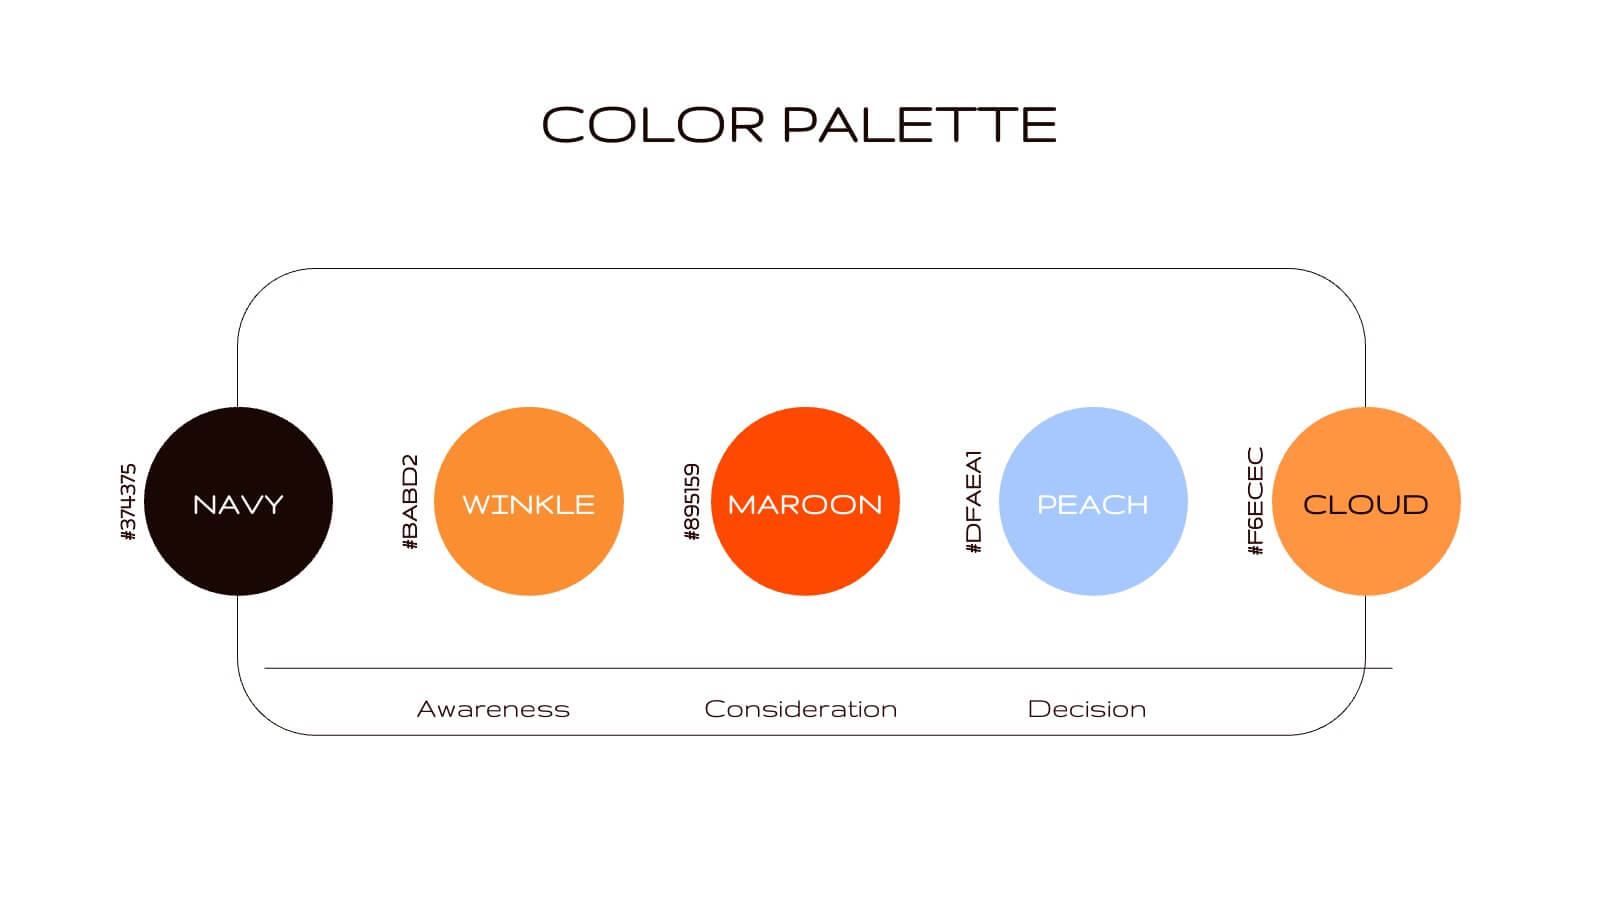
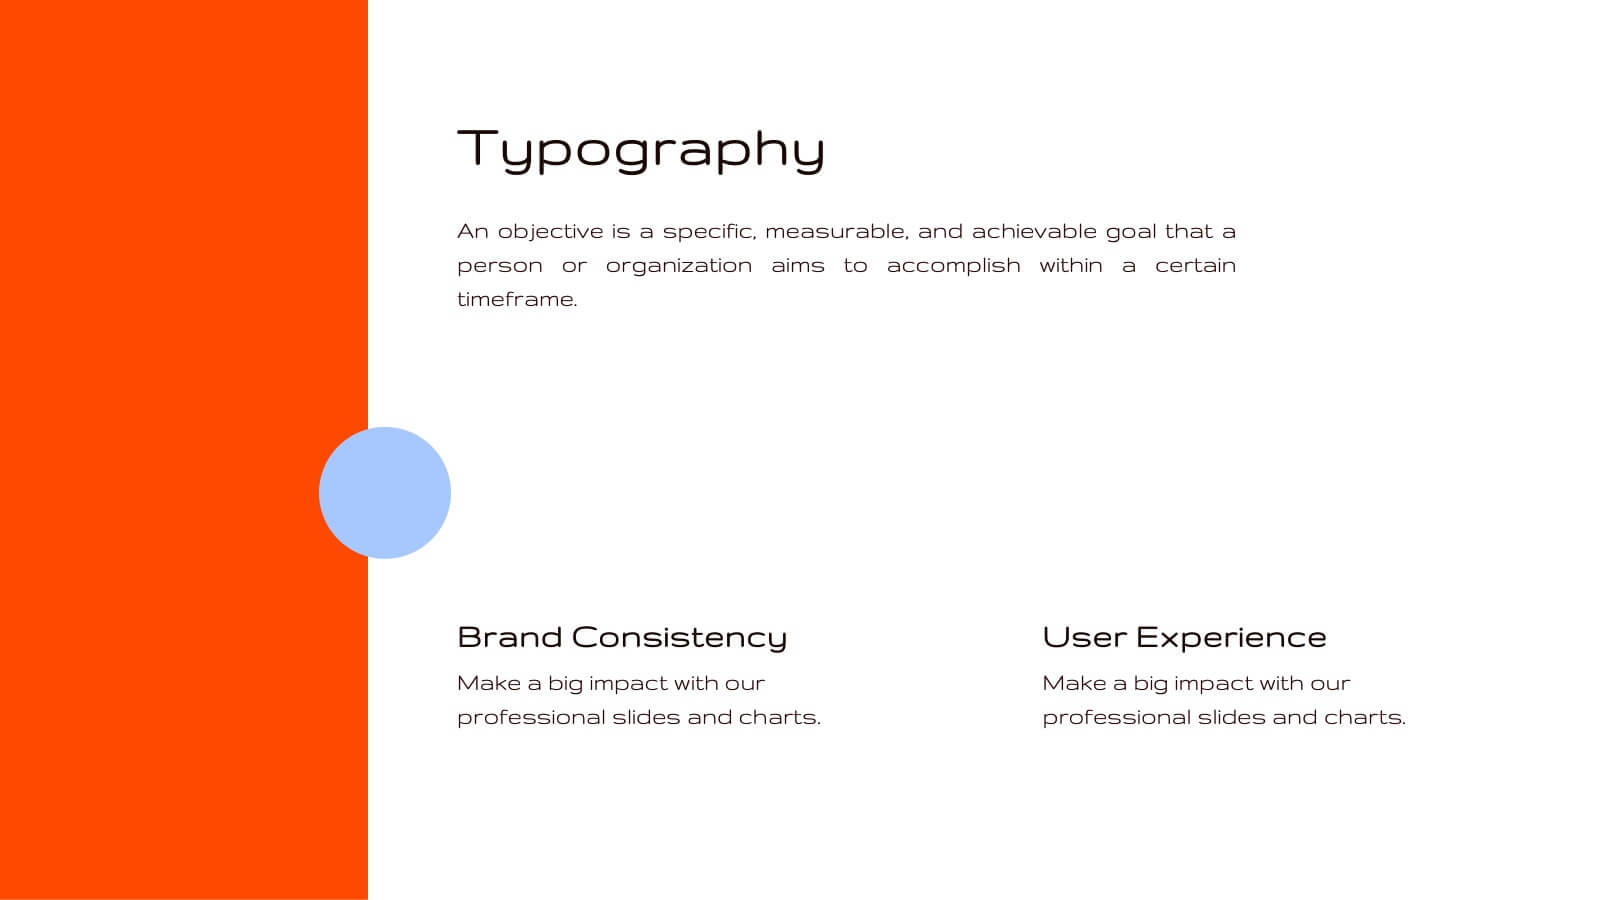
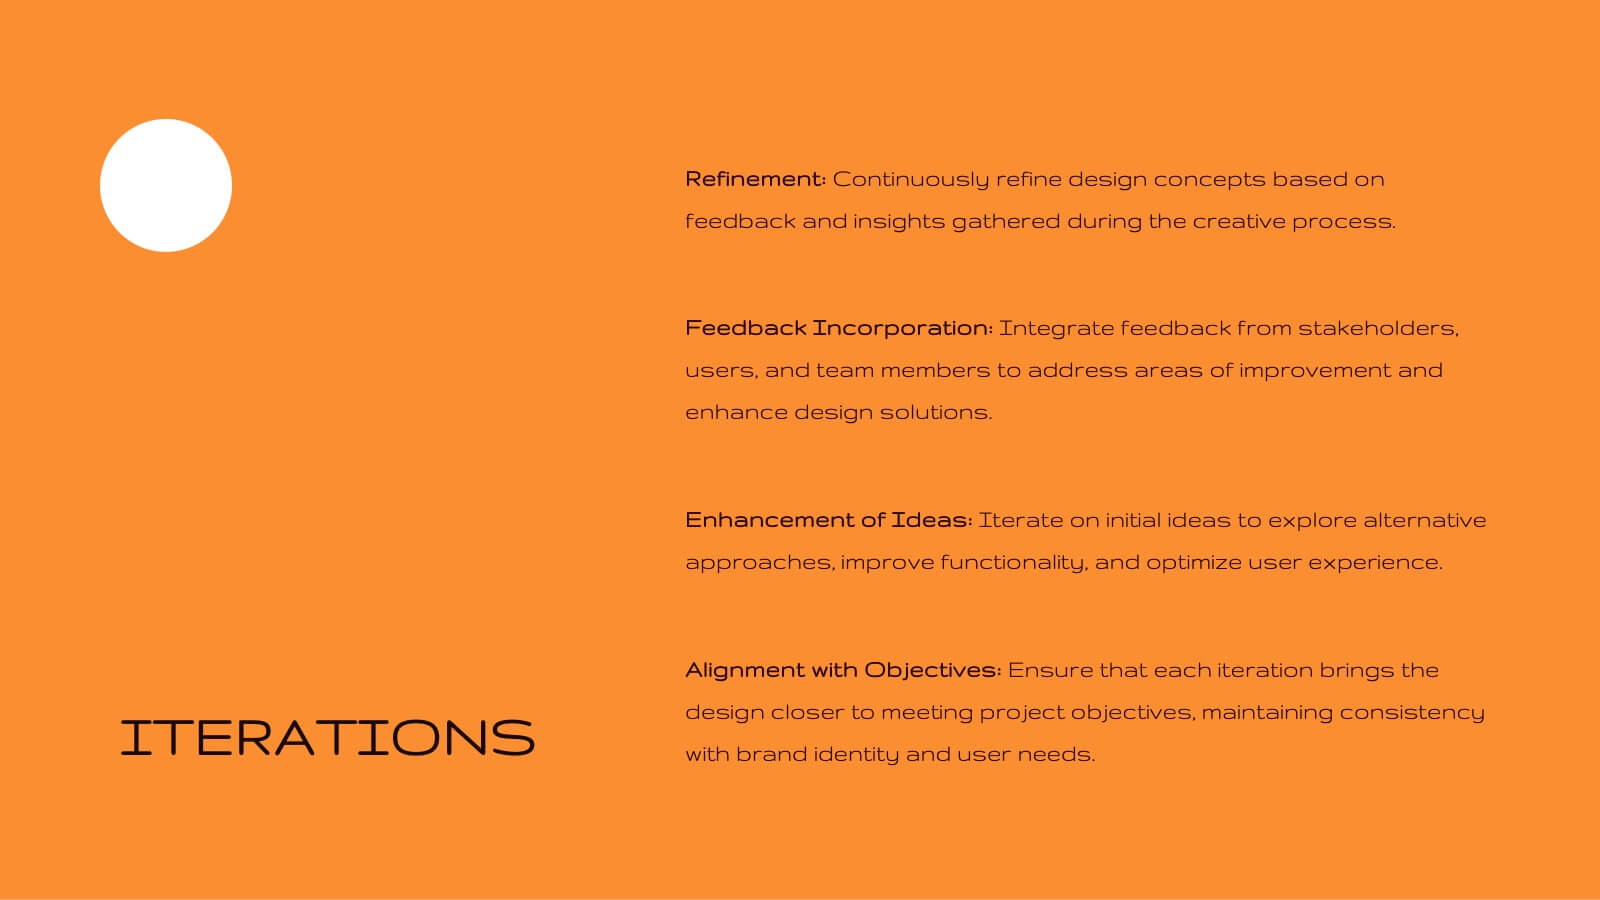
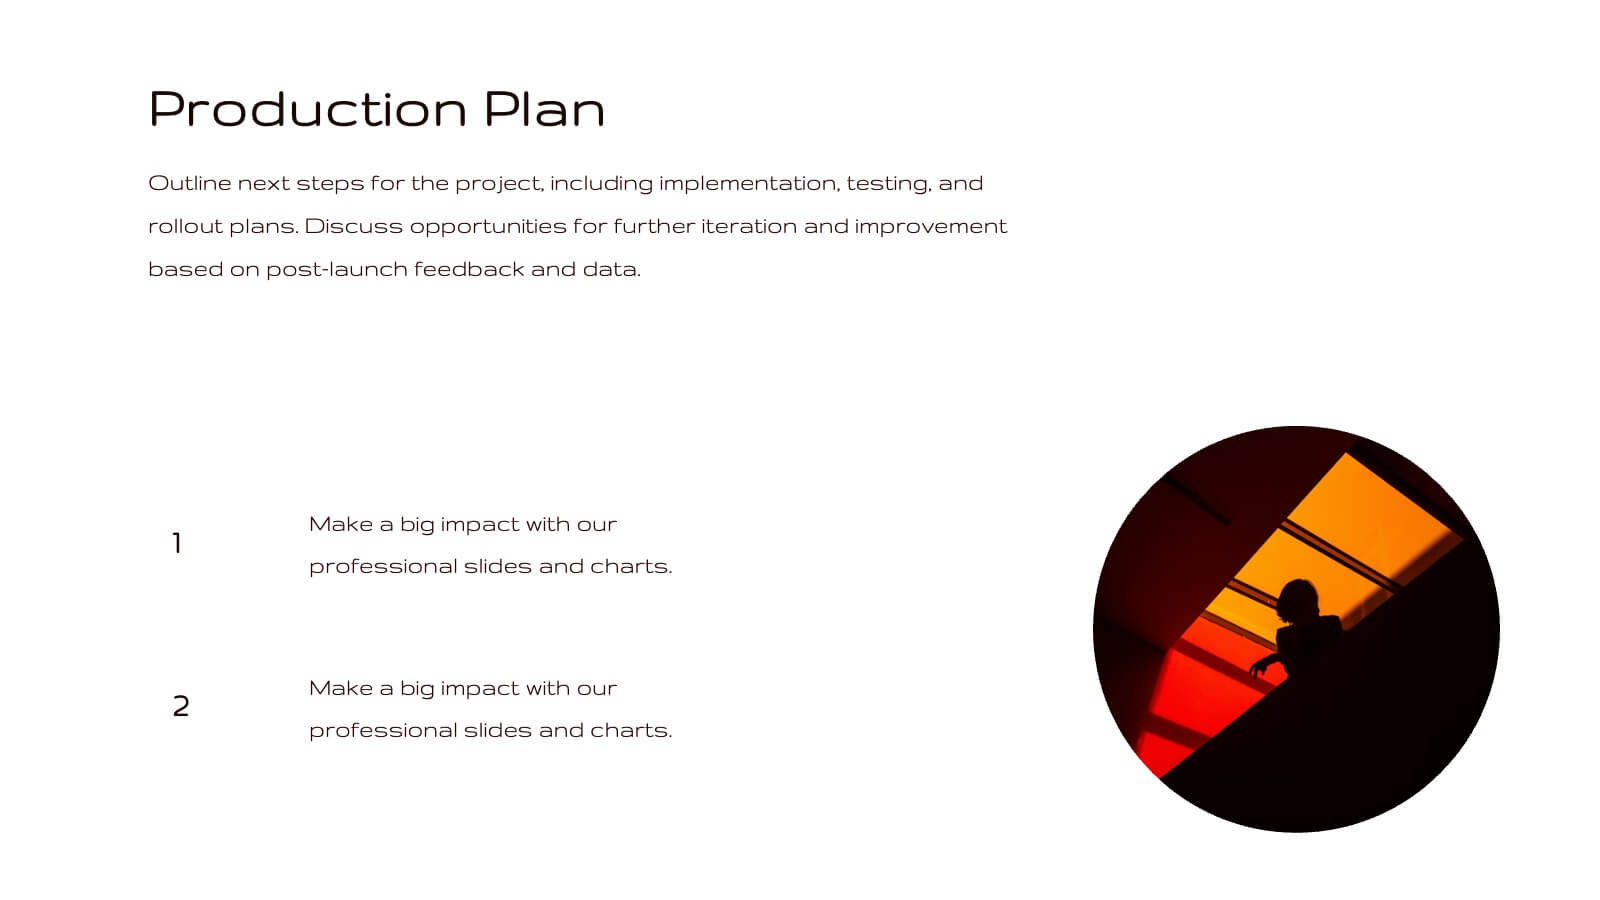
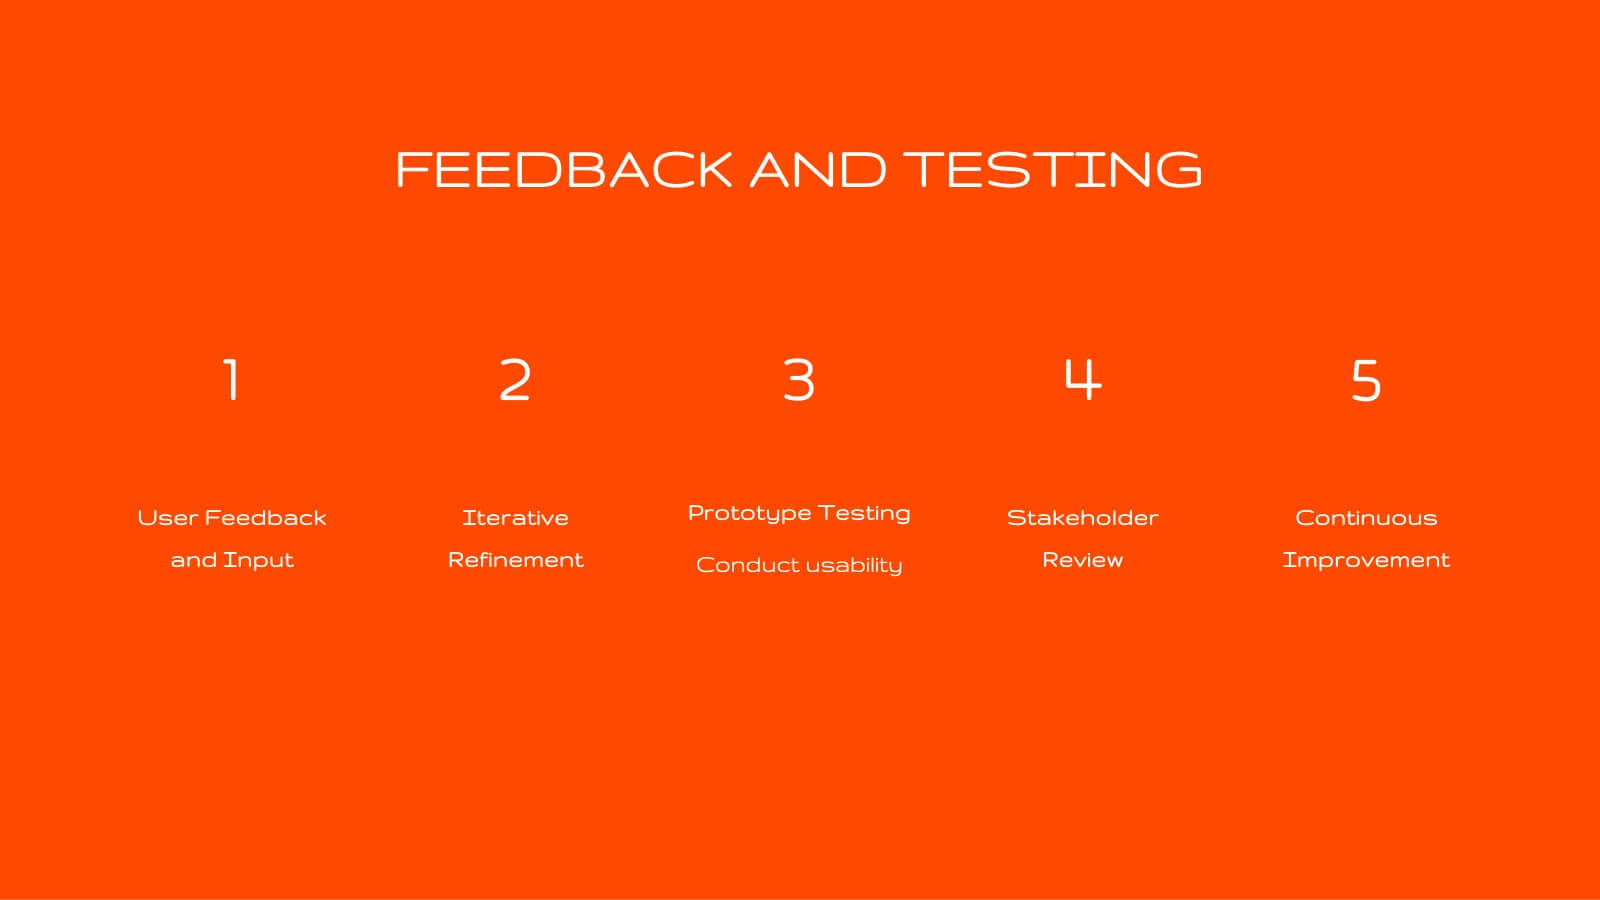
Bring your design ideas to life with this vibrant, engaging presentation template. Ideal for showcasing creative processes, concept development, and project timelines, it features a striking color palette and clean layout. This template is designed to captivate your audience and clearly communicate your design vision. Compatible with PowerPoint, Keynote, and Google Slides, it’s perfect for any platform.


6 slides
AIDA Communication Model Infographics
Embark on a journey through the AIDA Communication Model, a fundamental concept in marketing and advertising! This infographic serves as your guide to understanding how this powerful model can elevate your communication strategy. From capturing Attention and holding Interest to sparking Desire and driving Action, we unveil the secrets that make the AIDA model an indispensable tool. Delve into the art of holding the audience's interest. Discover methods to maintain engagement and curiosity as you convey your message. Learn how to keep your audience captivated and eager to learn more. With this engaging infographic, compatible with PowerPoint, Keynote, and Google Slides, sharing your understanding of the AIDA Communication Model becomes effortless. Empower yourself with the knowledge to enhance your marketing and advertising efforts. Dive into the world of AIDA and embark on a journey of effective communication and persuasion.


6 slides
Task Management Checklist
Stay on top of your workflow with this visually engaging task management checklist slide. Designed to help teams track progress across multiple tasks or project stages, this layout includes six editable sections with icon markers and color-coded completion states. Fully compatible with PowerPoint, Keynote, and Google Slides.


8 slides
Early Detection and Prevention of Breast Cancer Presentation
Take a proactive approach to health with the Early Detection and Prevention of Breast Cancer template, designed to emphasize essential awareness and prevention strategies. This template, compatible with PowerPoint, Keynote, and Google Slides, uses intuitive icons and a clean design to effectively communicate key prevention measures and screening importance, ideal for healthcare seminars and community health initiatives.


21 slides
Fahrenheit Scientific Research Presentation
Present your findings with clarity using this scientific research presentation template. Designed for researchers, it includes sections for objectives, methodology, data analysis, results, and recommendations. Perfect for academic and professional use, this template ensures a polished, organized presentation and is fully compatible with PowerPoint, Keynote, and Google Slides.


7 slides
Social Network Infographic Presentation
A Social Network Infographic is a visual representation of data that shows the connections and relationships between individuals, groups, or organizations within a social network. Use this template to illustrate the structure of a social network, and to analyze patterns and trends in the interactions between users. This Infographic includes a visual representation of networking, in graphs and diagram, with icons representing individuals and lines representing connections between them. This template can be customized with different colors, fonts, and text in Powerpoint, Keynote, and Google Slides.


7 slides
Editable Gantt Timeline Presentation
Stay on top of your project deadlines with this Editable Gantt Timeline Presentation. Designed with a clean monthly layout and six task rows, it makes scheduling and tracking progress simple. Customize task names, durations, and icons easily. Perfect for PowerPoint, Keynote, or Google Slides for professional project planning.


21 slides
Illusion Marketing Research Report Presentation
Energize your marketing presentations with this bold, modern template. Perfect for showcasing company stories, market research, and competitive landscapes, it features a vibrant design and clear layout. Highlight key insights and strategies with ease, ensuring your marketing plan stands out. Compatible with PowerPoint, Keynote, and Google Slides, it’s ideal for any platform.


4 slides
Task and Role Allocation Matrix
Clarify team responsibilities with this modern Task and Role Allocation Matrix. Easily visualize who is Responsible, Accountable, Contributing, and Informed for each task. Ideal for team leaders, HR planners, and project coordinators. Fully customizable in PowerPoint, Keynote, and Google Slides.


6 slides
Biology Tree Diagram Infographic
Tree diagrams in biology are graphical representations that show the hierarchical relationships and evolutionary history of different organisms, species, or biological traits. This infographic template is designed to simplify complex biological information and show the interconnectedness between different biological topics or classifications. This infographic is a visual representation of various biological concepts and relationships in a hierarchical tree structure. This template color codes the different branches to distinguishing between the different categories and make the infographic easier to navigate.


6 slides
AI-Driven Innovation in Business Presentation
Bring your ideas to life with a burst of tech brilliance—this bold, modern layout captures the synergy between artificial intelligence and business innovation. Use it to explore automation, data-driven insights, and future-focused strategies. Fully editable and compatible with PowerPoint, Keynote, and Google Slides for seamless presentation design.


20 slides
Alchemy Sales Forecast Presentation
Elevate your sales strategy with this sleek and modern sales forecast presentation template. Featuring sections for sales objectives, pricing strategies, performance metrics, and future opportunities, it’s perfect for teams aiming to analyze and plan effectively. Fully compatible with PowerPoint, Keynote, and Google Slides for seamless professional presentations.


5 slides
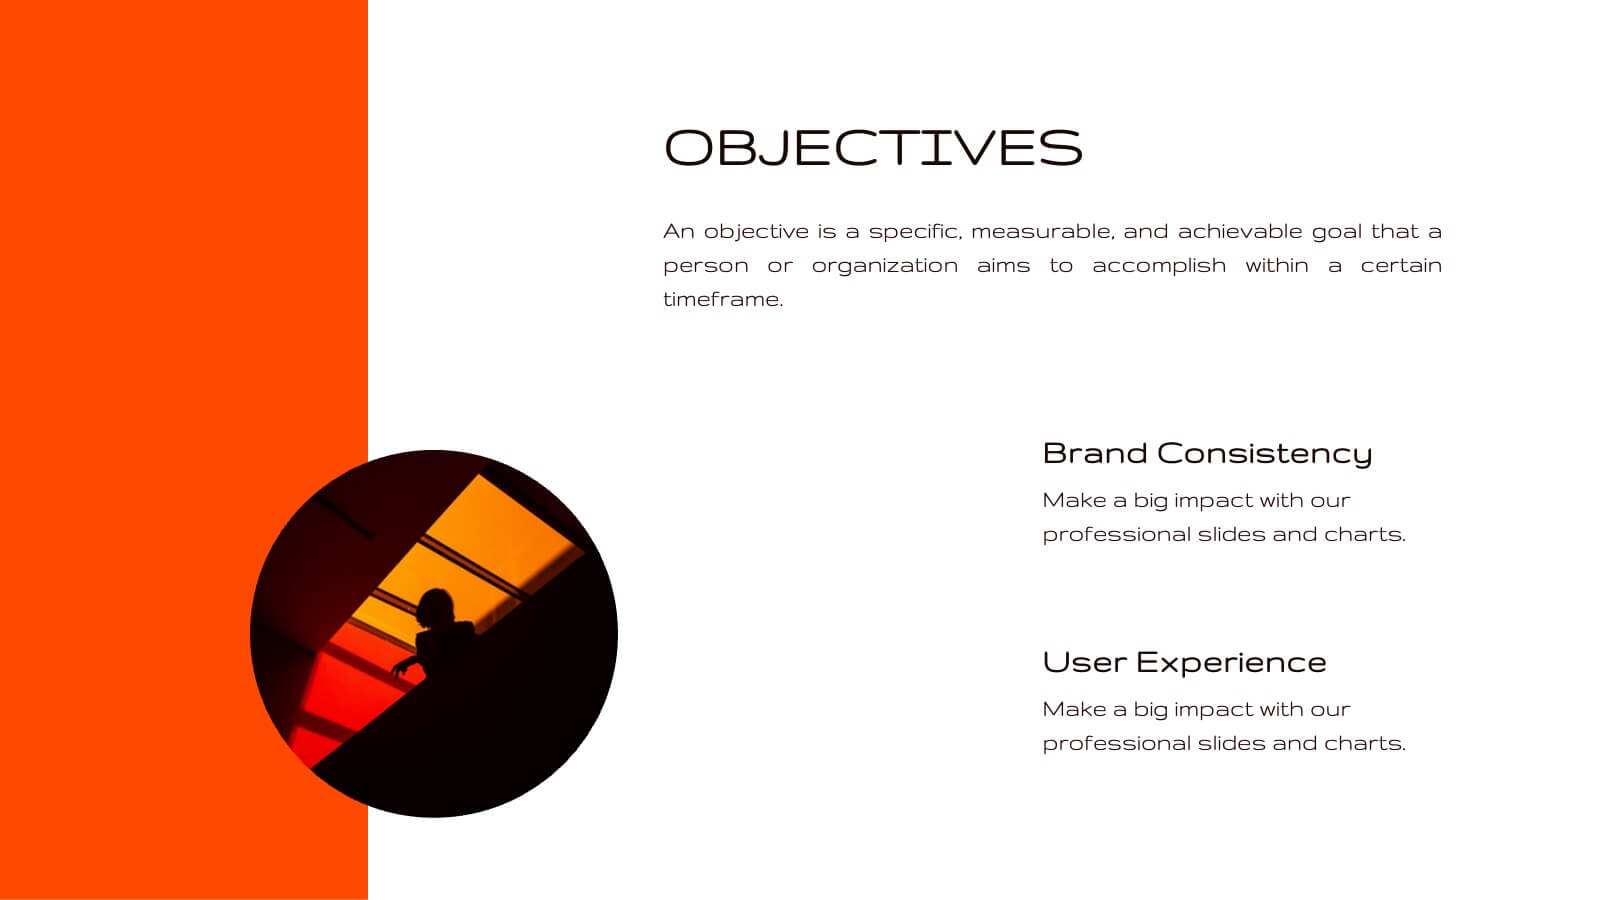
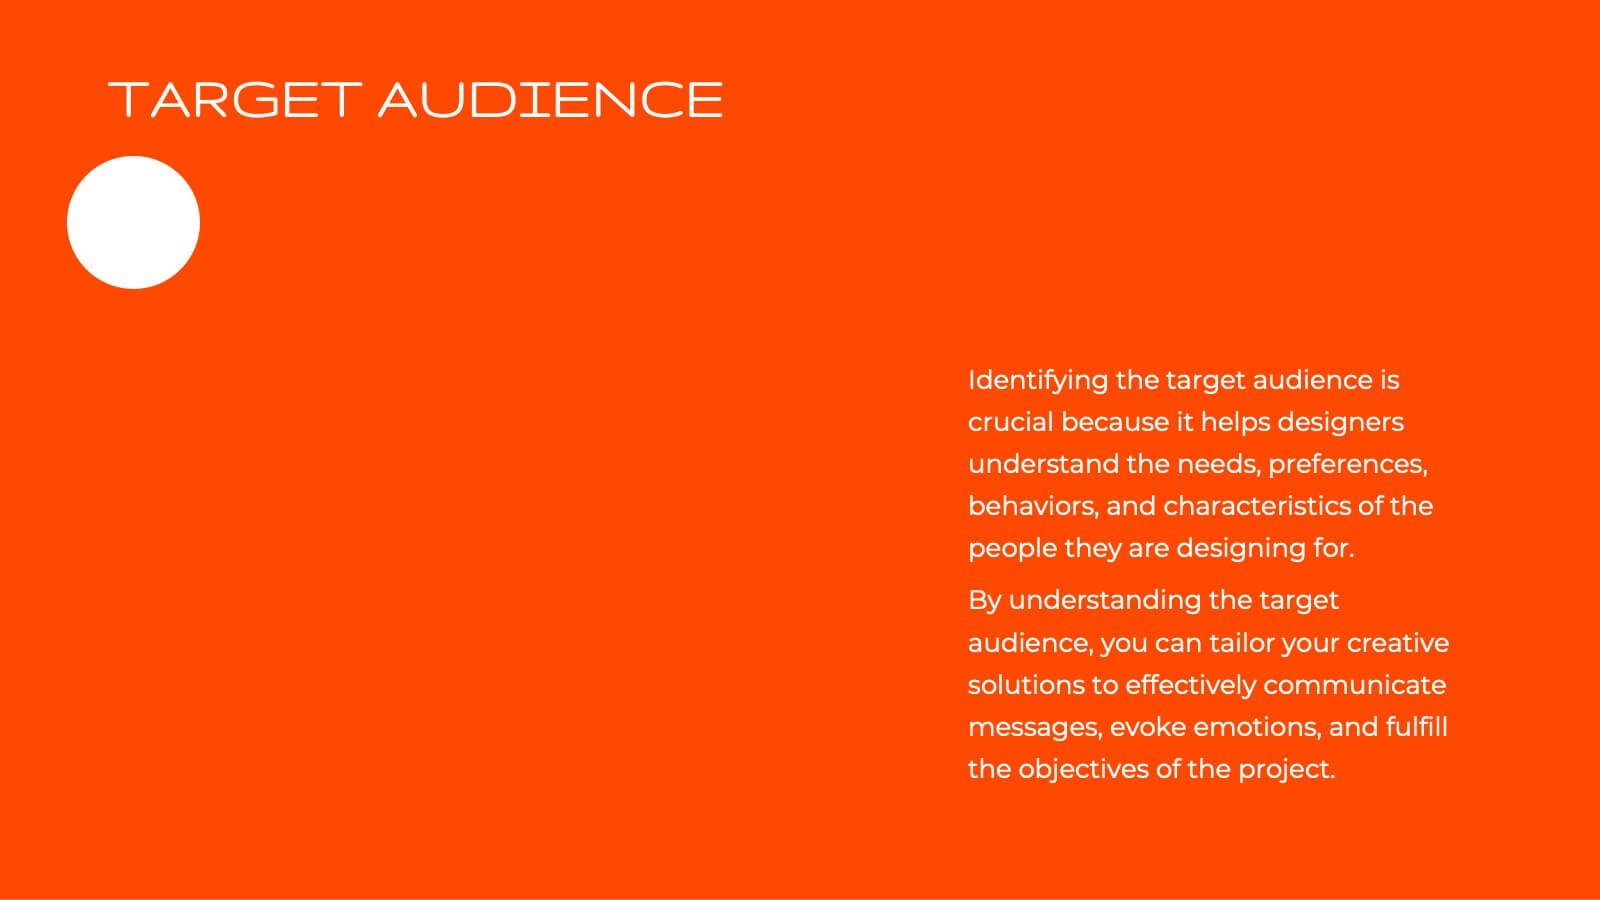
Clear Business Objectives Slide Presentation
Spark clarity and direction with a slide built to showcase key objectives in a straightforward, visually engaging way. This presentation helps teams define priorities, outline expected outcomes, and communicate strategic intent with ease. Perfect for planning, reporting, and leadership updates. Fully compatible with PowerPoint, Keynote, and Google Slides.


7 slides
Cyber Security News Infographic Presentation
Cyber Security is the practice of protecting computer systems, networks, and digital data from theft, damage, or unauthorized access. This Cyber Security template is the most comprehensive and easy to use cyber security resource. It contains visually attractive visuals, allowing you to easily create a infographic to present your ideas. By using this template, you can raise awareness about how to protect your network from hackers and reduce the risk of data theft or leaks. This infographic template is easy to edit, customize, and download in Powerpoint, Keynote, and Google slides.


15 slides
Business Roadmap Infographic
A business roadmap is a strategic plan that outlines the goals, milestones, and key initiatives a company intends to achieve over a specific period. This infographic template is designed to showcase the strategic journey and future goals of a business or organization. This infographic presents a clear and concise overview of the business's roadmap, highlighting key milestones, objectives, and action plans for achieving success. The infographic features a horizontal timeline that represents the business's journey from its inception to the envisioned future milestones. Each milestone is accompanied by a brief description or icon to provide context.


5 slides
Business Insights Through Dashboard Visualization Presentation
Visualize key metrics with this Business Insights Through Dashboard Visualization presentation. The funnel chart layout is ideal for showcasing conversion rates, customer journeys, or sales processes. Each section includes clear labels and percentage indicators. Fully editable in Canva, PowerPoint, and Google Slides to suit your business reporting needs.