


Features
- 4 Unique slides
- Fully editable and easy to edit in Microsoft Powerpoint, Keynote and Google Slides
- 16:9 widescreen layout
- Clean and professional designs
- Export to JPG, PDF or send by email


Do you have any questions?
Recommend


21 slides
Karma Design Portfolio Presentation
Step into the spotlight with this bold and contemporary design portfolio! It presents your creative work in a sleek, visually striking format. From featured projects to your creative process and collaborations, this portfolio will leave a lasting impression. Perfect for showcasing your design style on PowerPoint, Keynote, or Google Slides!


8 slides
AI Trends and Future Technology Presentation
Step into the future with this sleek, modern template designed to visualize cutting-edge concepts in artificial intelligence. Featuring futuristic robot graphics and a clean circular flow layout, this design is perfect for showcasing tech trends, automation strategies, or AI-driven innovations. Each section is color-coded and icon-supported for easy customization. Ideal for tech startups, AI researchers, and innovation consultants. Fully editable in PowerPoint, Keynote, and Google Slides.


4 slides
Task Delegation via RACI Model
Simplify task delegation and boost accountability with this clean RACI-based layout—perfect for clarifying roles and responsibilities across teams. Whether you're planning a project or tracking execution, this slide makes it easy to map who’s in charge, consulted, or informed. Fully compatible with PowerPoint, Keynote, and Google Slides.


6 slides
Problem Statement Infographic
Unleash the potential of your strategic presentations with our Infographic Templates, specifically designed to clarify and emphasize core challenges within any project or discussion. This collection features a versatile array of templates, from minimalistic single-point layouts to more detailed multi-section designs. Each template is crafted to help you articulate critical issues effectively, ensuring your audience grasps the essence of the discussion quickly. Customization is a breeze with options to adjust colors, fonts, and text, allowing you to align each slide with your corporate identity seamlessly. Ideal for use in PowerPoint, Google Slides, and Keynote, these templates are perfect for consultants, project managers, and business strategists looking to present problem statements in a clear, impactful manner. Equip yourself with these tools to drive understanding and foster problem-solving discussions in any professional setting.
20 slides
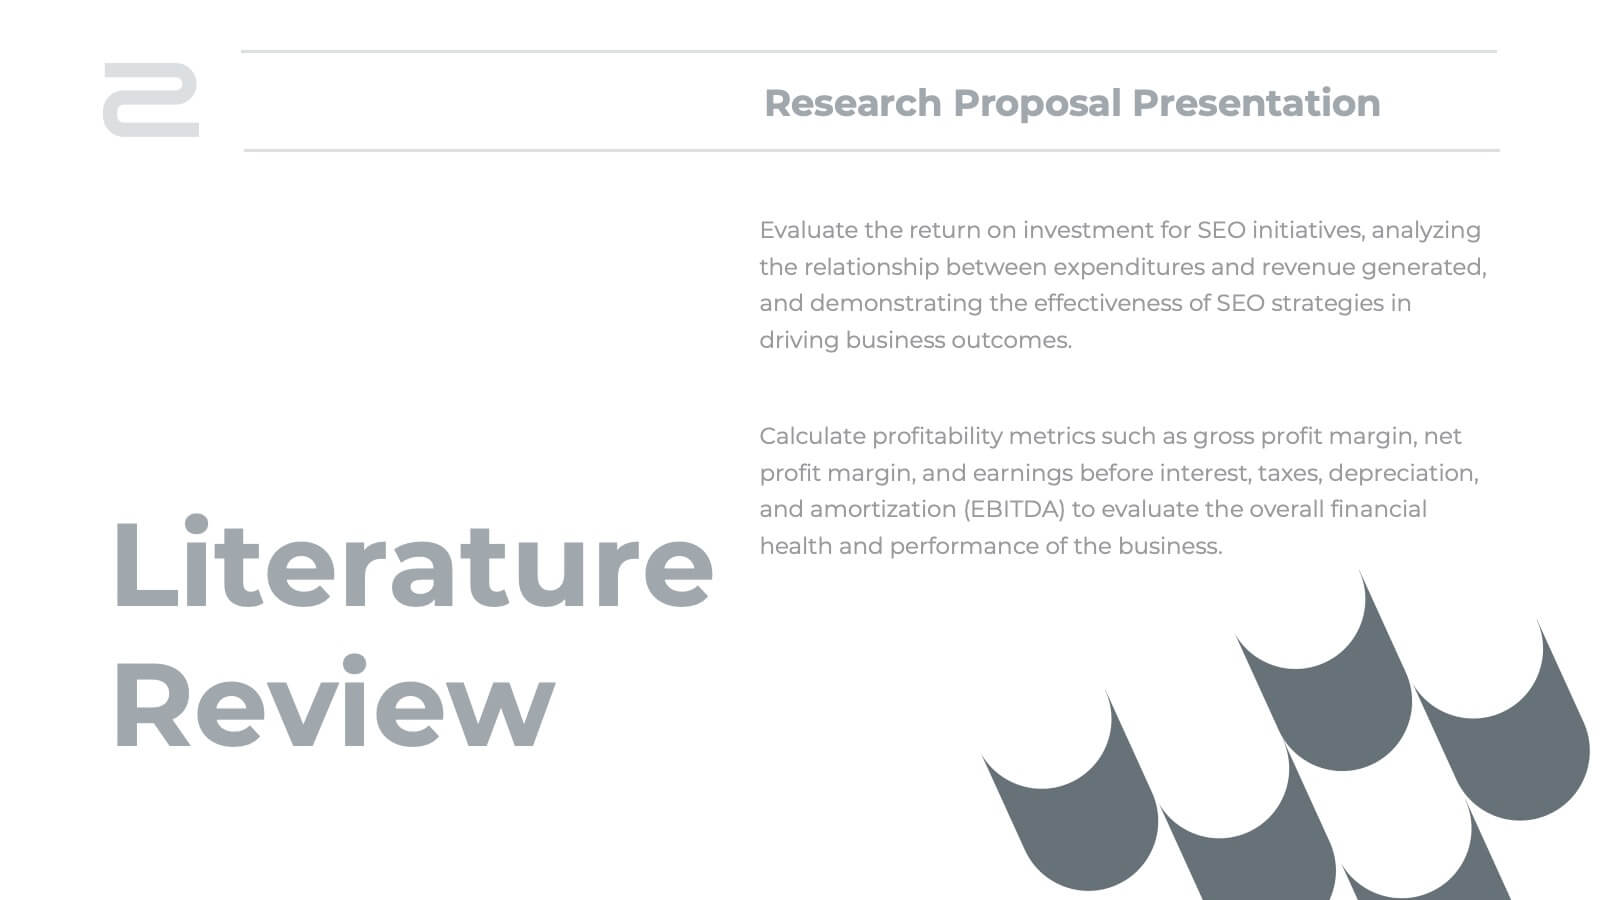
Malachite Research Proposal Presentation
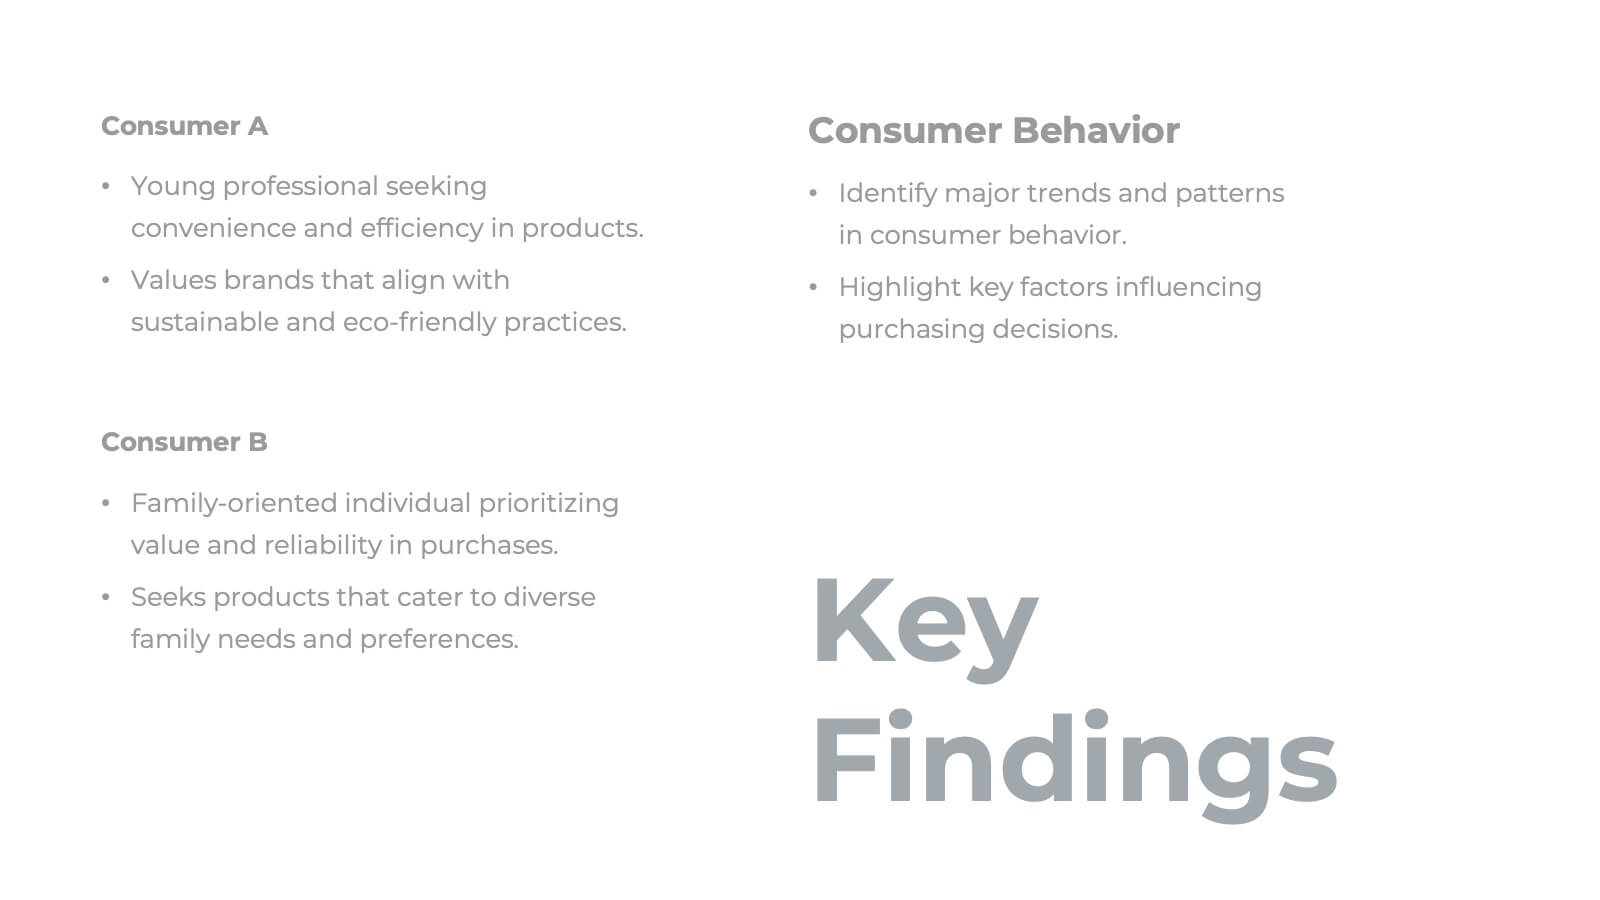
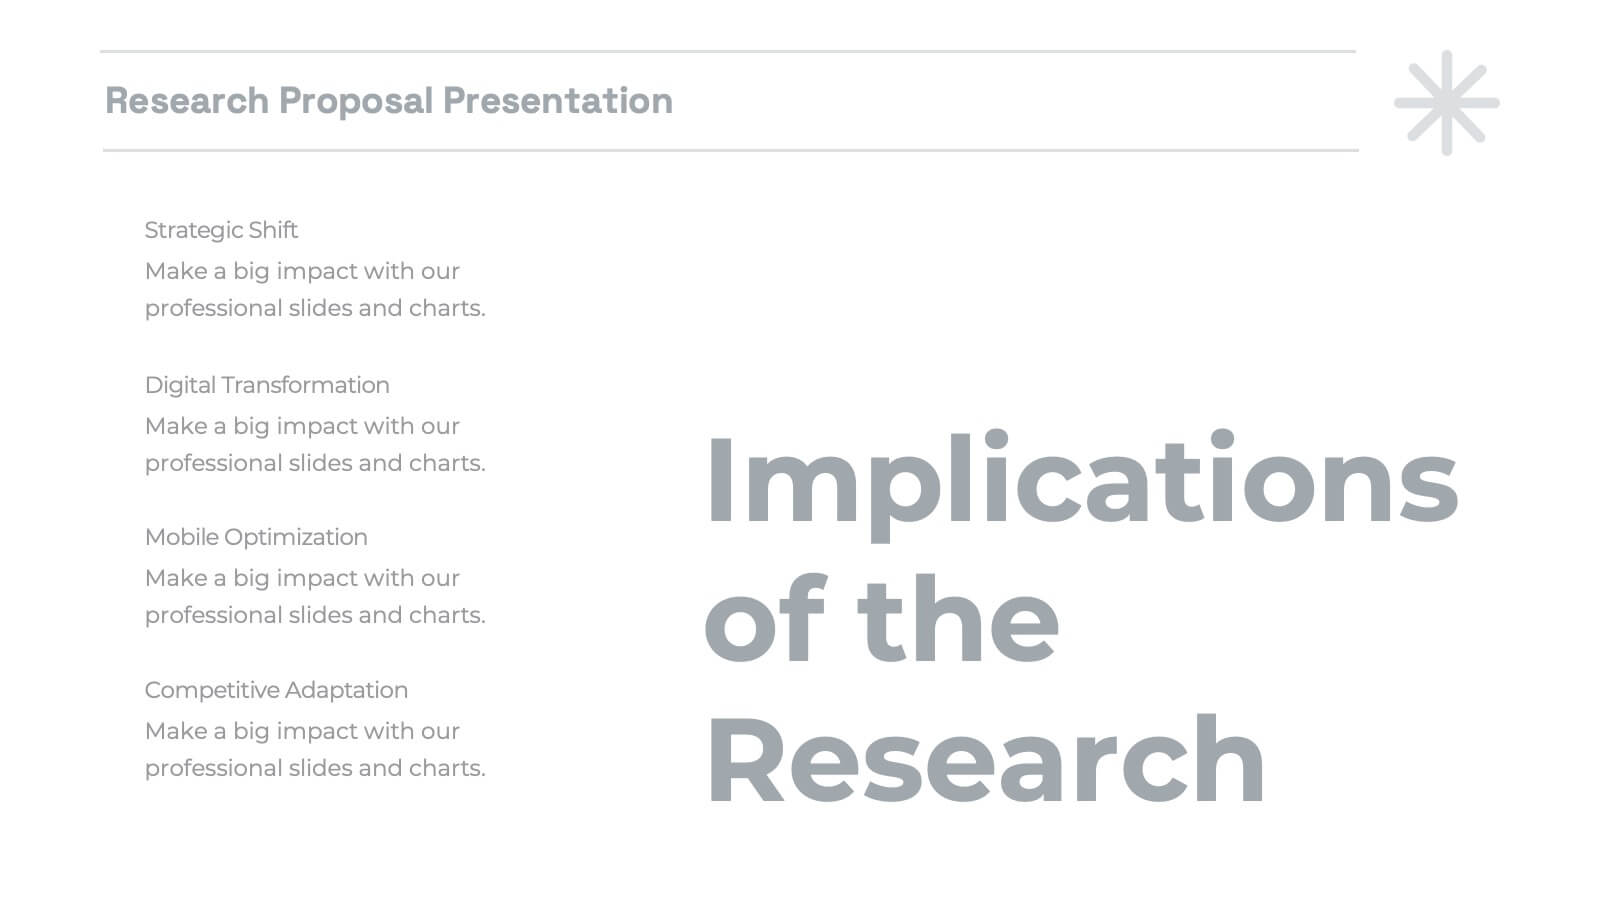
Present your research findings with clarity and professionalism using this structured research presentation template! Covering all essential elements, from research objectives and methodology to key findings and implications, this template ensures your work is communicated effectively. It's perfect for academic, corporate, or scientific presentations. Compatible with PowerPoint, Keynote, and Google Slides, it's versatile and ready for your next project.


5 slides
5G Use Cases and Industry Applications Presentation
Unlock the possibilities of next-generation connectivity with a clear, visual explainer designed to showcase how different industries benefit from faster, smarter networks. This presentation breaks down key applications, technology shifts, and real-world 5G impact in an easy, engaging format. Fully compatible with PowerPoint, Keynote, and Google Slides.


5 slides
Business SWOT Infographics
Dive deep into organizational analysis with our business SWOT infographics. Crafted in engaging shades of blue and pink, this collection is an essential tool for businesses aiming to uncover their strengths, weaknesses, and threats. This template, brimming with creative graphics and icons, is specifically designed for business strategists, educational instructors, and company executives who are keen to present SWOT analysis with clarity. Compatible with Powerpoint, keynote, and Google Slides. Its vertical, creative styling makes complex information digestible, fostering understanding and strategic thinking in your business planning sessions.


6 slides
4 Stage Roadmap Template
Navigate your projects with clarity using our "4 Stage Roadmap Template." This engaging presentation template offers a unique, pathway-like design to outline the progression of any project through four distinct stages. Each step is visually differentiated, making it easy to follow and understand the sequence and dependencies of tasks. Perfect for project managers and teams, this template ensures your strategic milestones are visually aligned and easy to communicate. Compatible with PowerPoint, Keynote, and Google Slides, it's an essential tool for effective project visualization and management.


4 slides
Hidden Elements Iceberg Strategy Presentation
Reveal what lies beneath the surface with this Hidden Elements Iceberg Strategy presentation. Perfect for exploring visible vs. underlying factors in strategy, risk, or behavior. Visually break down your content using layered iceberg graphics. Fully editable in Canva, PowerPoint, and Google Slides to fit your narrative and branding.


4 slides
Business KPI Metrics Dashboard Presentation
Track and present your key performance indicators clearly with this Business KPI Metrics Dashboard Presentation. Featuring modern gauge visuals, color-coded performance bars, and sectioned data blocks, this template helps you showcase financial, customer, and operational KPIs in a single glance. Fully editable and ideal for business reviews, team updates, and performance reports. Compatible with PowerPoint, Keynote, and Google Slides.


10 slides
National Distribution Network in the US Presentation
Present your logistics strategy with clarity using the National Distribution Network in the US Presentation. This slide visually maps out your key distribution hubs across the country, pairing each location with a numbered label and space for insights or logistics data. Ideal for supply chain overviews, retail operations, or partner briefings. Fully editable in Canva, PowerPoint, and Google Slides.


7 slides
Corporate Training Infographic
Enhance your corporate training program with our engaging Infographic, designed to succinctly communicate the key elements of effective employee development. Ideal for HR managers and corporate trainers, this Infographic provides a visual summary of training strategies and success metrics. Our Corporate Training Infographic includes sections on training goals, interactive learning approaches, progress tracking, and feedback collection. It's crafted to facilitate quick comprehension and retention of corporate training concepts, making it a perfect tool for internal communication and team meetings. The customizable layout allows you to highlight specific training outcomes, participant engagement, and the benefits of ongoing professional development. This SEO-friendly Infographic is tailored to attract professionals focused on boosting their team's performance and skills. Implement our Infographic to streamline your training processes and showcase the value of learning and development within your organization.


26 slides
Human Resources Colorful Vectors
Dive into the dynamic realm of human resources, where talent thrives and organizations find their heartbeat. Radiating with a playful palette of sunny yellow, refreshing green, blush pink, and crisp white, our template captures the vibrancy and diversity of the HR world. Adorned with colorful graphics, relatable icons, and insightful image placeholders, it's a testament to the human touch in every organization. Expertly tailored for Powerpoint, Keynote, or Google Slides. An invaluable tool for HR professionals, recruitment agencies, corporate trainers, or anyone focused on building and nurturing talent. Engage, empower, and elevate; let your HR endeavors shine.


6 slides
Audience Targeting and Segmentation
Get to know your audience like never before with this human-centered visual layout—ideal for mapping out key segments, demographics, and targeting strategies. Great for marketing plans, user personas, or customer insights presentations, this slide keeps your data visually focused and easy to digest. Fully compatible with PowerPoint, Keynote, and Google Slides.


21 slides
Aetherion New Product Proposal Presentation
This Product Presentation Template is designed to effectively showcase your product's features, target market, and competitive advantages. It includes sections for customer pain points, pricing strategy, technical specifications, and marketing plans. Fully customizable for PowerPoint, Keynote, and Google Slides, it's perfect for product launches and investor pitches.


6 slides
Blue Ocean Market Infographics
Dive into the concept of Blue Ocean Markets with our customizable infographic template. This template is fully compatible with popular presentation software like PowerPoint, Keynote, and Google Slides, allowing you to easily customize it to illustrate and communicate various aspects of Blue Ocean Strategy and market creation. The Blue Ocean Market infographic template offers a visually engaging platform to explain the principles, strategies, and advantages of creating new market spaces by focusing on innovation and value innovation. Whether you're a business leader, strategist, entrepreneur, or anyone interested in market expansion, this template provides a user-friendly canvas to create informative presentations and educational materials. Deepen your knowledge of Blue Ocean Markets with this SEO-optimized infographic template, thoughtfully designed for clarity and ease of use. Customize it to showcase the differentiation factors, examples of successful blue ocean strategies, and the shift from competition to uncontested market space, ensuring that your audience gains valuable insights into this innovative approach. Start crafting your personalized infographic today to explore the world of Blue Ocean Markets.


6 slides
Veterinary School Infographics
Explore the world of Veterinary School with our customizable infographic template. This template is fully compatible with popular presentation software like PowerPoint, Keynote, and Google Slides, allowing you to easily customize it to illustrate and communicate various aspects of veterinary education and training. The Veterinary School infographic template offers a visually engaging platform to outline the curriculum, admissions process, career prospects, and importance of veterinary education. Whether you're a veterinary student, educator, prospective applicant, or simply interested in animal healthcare, this template provides a user-friendly canvas to create informative presentations and educational materials. Enhance your understanding of Veterinary School with this SEO-optimized infographic template, thoughtfully designed for clarity and ease of use. Customize it to showcase admission requirements, core subjects, clinical training, and the impact of veterinary professionals on animal health and welfare. Ensure that your audience gains valuable insights into the world of veterinary education. Start crafting your personalized infographic today to explore the realm of Veterinary School.