


Features
- 10 Unique slides
- Fully editable and easy to edit in Microsoft Powerpoint, Keynote and Google Slides
- 16:9 widescreen layout
- Clean and professional designs
- Export to JPG, PDF or send by email


Do you have any questions?
Recommend


8 slides
Construction Project Planning Presentation
Streamline project timelines with the Construction Project Planning template. This visually structured design helps organize key phases, tasks, and milestones for efficient workflow management. Ideal for project managers and construction professionals, it enhances clarity in presentations. Fully customizable and compatible with PowerPoint, Keynote, and Google Slides for seamless integration.


5 slides
Demographic and Psychographic Segments Presentation
Break down your audience with clarity using the Demographic and Psychographic Segments Presentation. This slide is ideal for showcasing four key consumer dimensions through a centered circular layout and quadrant icons. Perfect for marketing campaigns, branding strategies, and audience targeting. Fully editable in Canva, PowerPoint, Keynote, or Google Slides.


6 slides
5-Year Financial Forecast Slide Presentation
Show your long-term growth with a clean, visual touch that makes numbers easy to follow and goals clear to everyone. This modern layout highlights yearly progress using engaging icons and percentage indicators, perfect for financial reports or investor decks. Fully compatible with PowerPoint, Keynote, and Google Slides for seamless editing.


6 slides
6-Step Training Program Slide Presentation
Make your training process feel like a journey worth taking. This vibrant 6-step infographic template helps you break down each stage of your program with clear icons, color-coded steps, and a clean visual path. Ideal for onboarding, workshops, or employee development. Fully compatible with PowerPoint, Keynote, and Google Slides.


5 slides
European Countries Editable Map Presentation
Bring your data to life with a detailed and modern map layout that showcases insights across Europe. Perfect for visualizing country comparisons, regional statistics, or business expansion plans, this clean design ensures clarity and impact. Fully compatible with PowerPoint, Keynote, and Google Slides for easy editing and presentation.


5 slides
Business Issue Root Cause Identification
Pinpoint the real reasons behind business challenges with this clear and visual layout. This root cause identification template breaks down effects and traces them back to their sources, making it easier to align your team and propose actionable solutions. Fully customizable in PowerPoint, Keynote, and Google Slides.


5 slides
Agile Workflow and Role Breakdown Presentation
Visualize Agile processes with this streamlined workflow and role breakdown diagram. Perfect for Scrum teams and project leads, this layout maps out five stages using arrows, icons, and a circular feedback loop. Easily editable in PowerPoint, Keynote, and Google Slides to fit any development cycle or team structure.


5 slides
Oil Industry Trends Infographics
The oil industry, also known as the petroleum industry, is a crucial sector of the global economy that involves exploration, production, refining, and distribution of petroleum products. These infographic templates are designed to showcase key trends and insights in the oil industry. They aims to present complex information in a clear and visually appealing manner, making it easy for your viewers to grasp important concepts and trends in the industry. This is perfect for anyone interested in understanding the trends and dynamics shaping the oil industry. Compatible with Powerpoint, Keynote, and Google Slides.


6 slides
Closing Summary and Key Takeaways Presentation
Wrap up your presentation with clarity using the Closing Summary and Key Takeaways Presentation. This slide features a semi-circular segmented layout, ideal for highlighting 3–5 final points, action steps, or reflections. Clean, modern, and easy to customize in PowerPoint, Keynote, Google Slides, or Canva—perfect for impactful conclusions.


7 slides
Half Year Survey Results Infographic
Evaluating progress mid-year is essential for adapting and thriving. Our half-year survey results infographic, painted in vibrant hues of orange and blue, transforms raw data into visually appealing insights. Whether it's customer feedback, employee performance, or market trends, this template makes understanding findings both effortless and impactful. Ideal for business managers, data analysts, market researchers, and educators, it's designed to communicate complex survey results in an easily digestible manner. Fully compatible with PowerPoint, Keynote, and Google Slides, it's your companion for dynamic presentations that resonate and inform.


5 slides
HIV Prevention & Awareness Infographics
HIV Prevention and Awareness play a crucial role in combating the spread of the virus and reducing the impact of HIV/AIDS on individuals and communities. These infographic templates are designed to educate and raise awareness about HIV prevention and promote safer behaviors. These infographics provide a visually compelling way to present key information, statistics, and strategies related to HIV prevention and awareness. The templates features a range of eye-catching charts and icons that can be easily customized to suit your specific needs. Compatible with PowerPoint, Keynote, and Google Slides.


23 slides
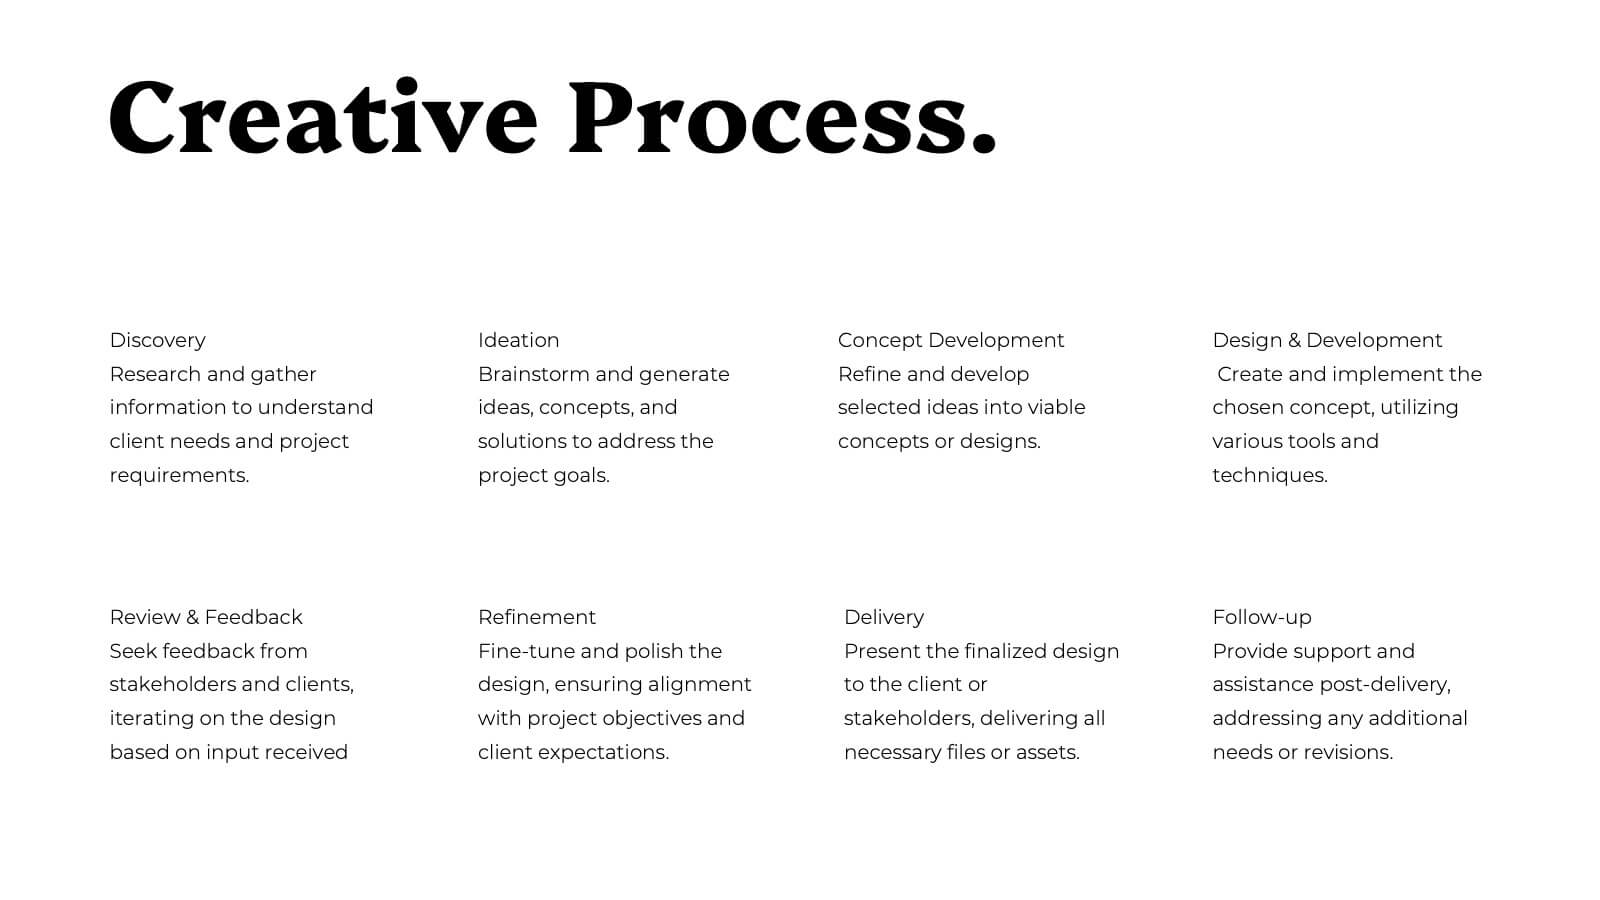
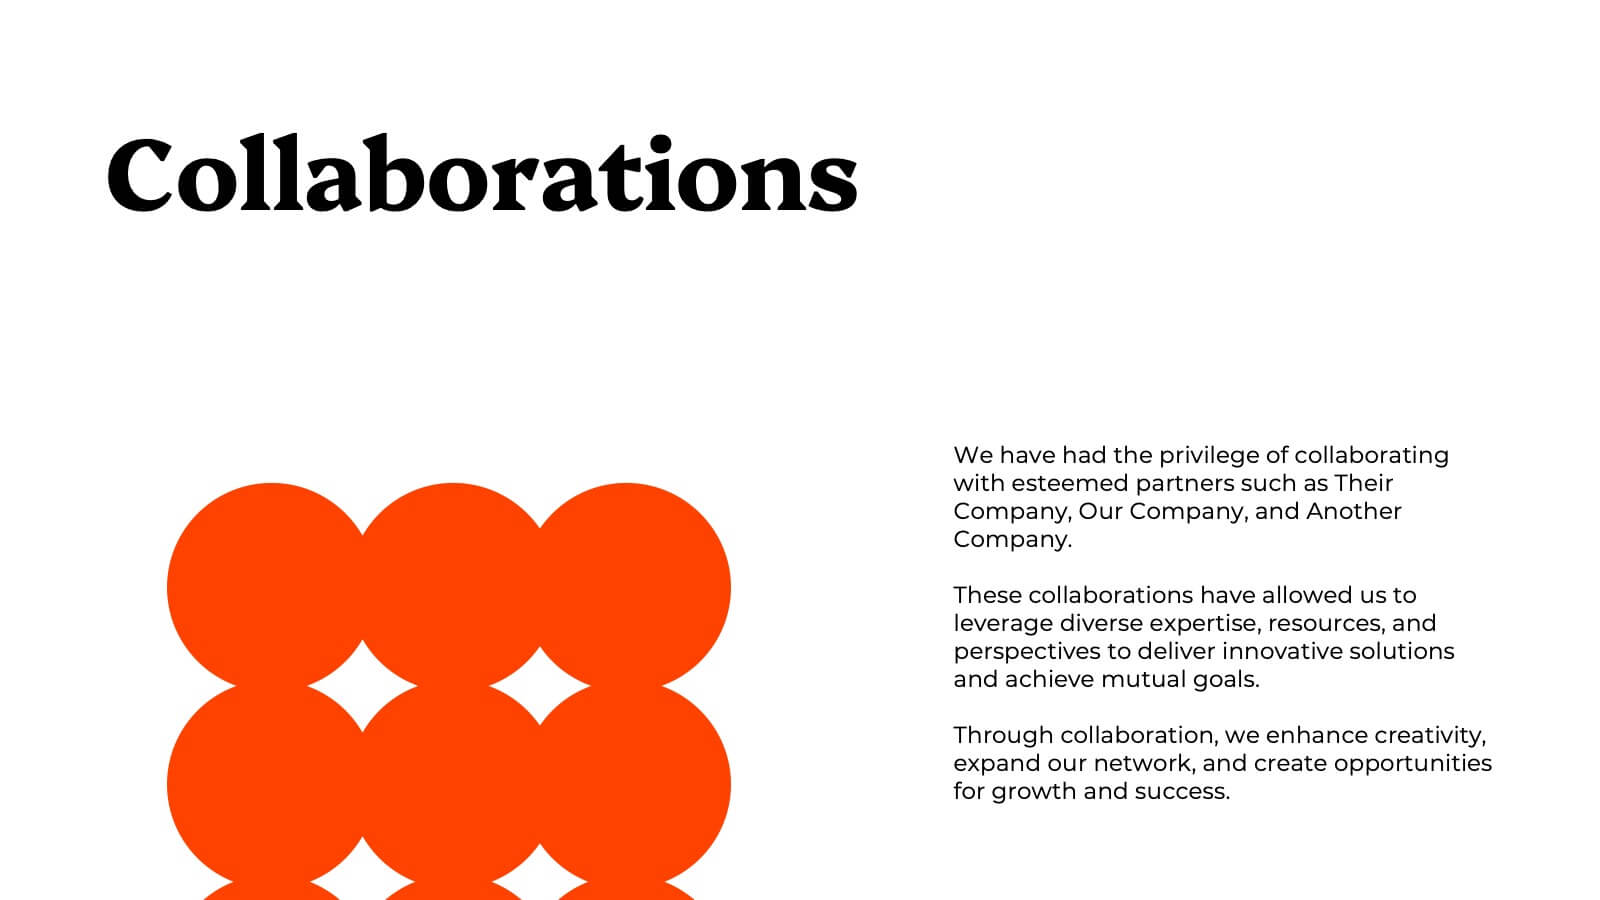
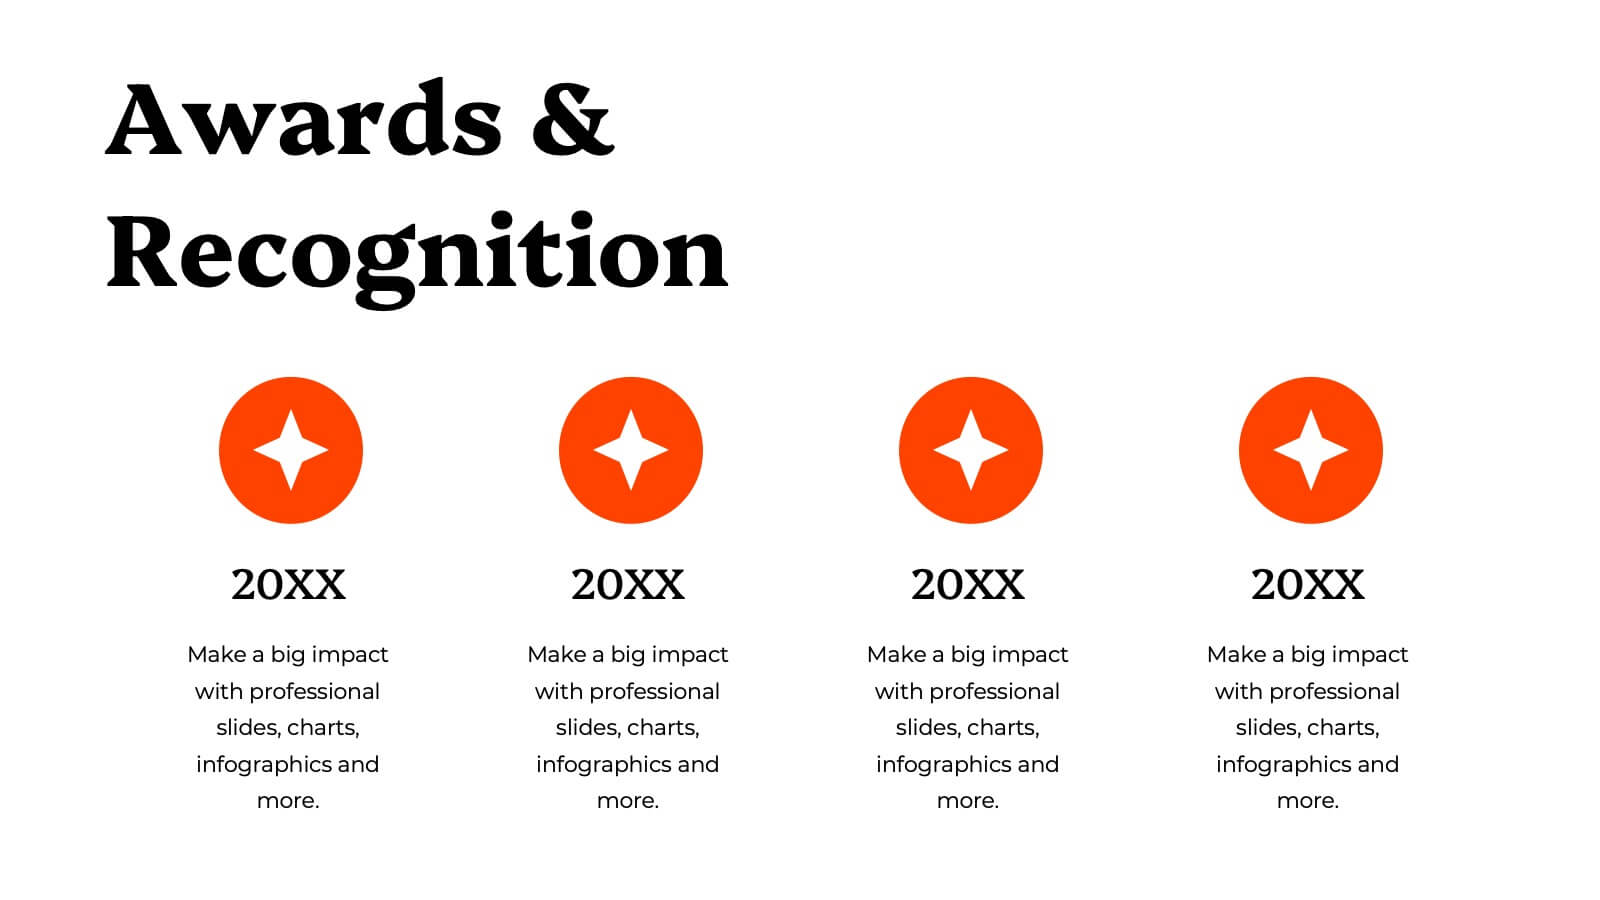
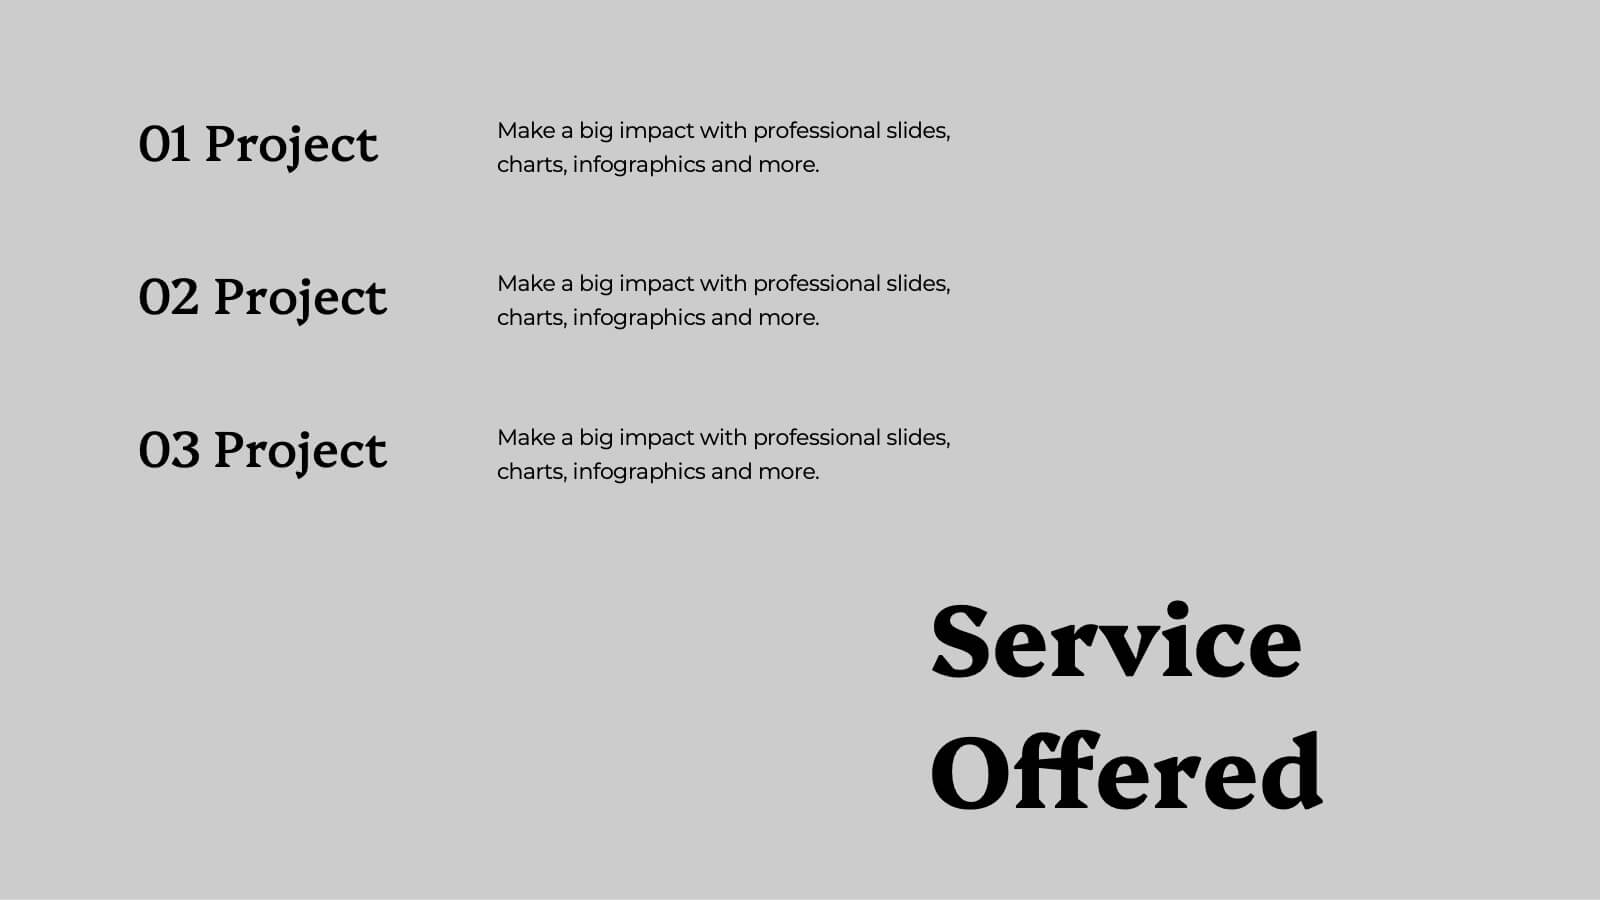
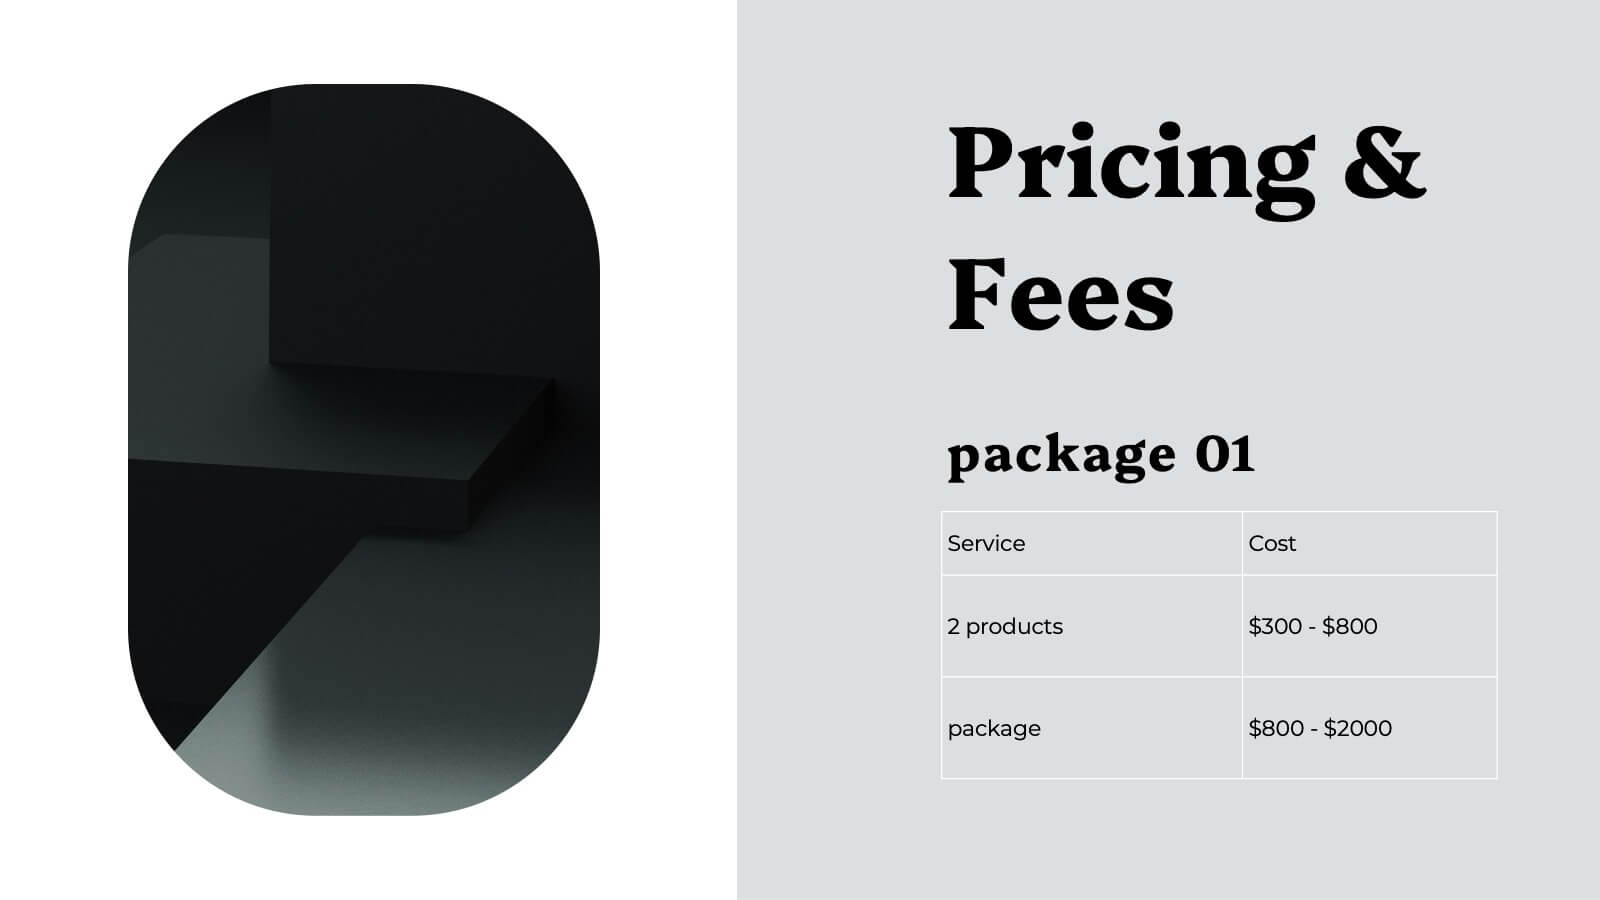
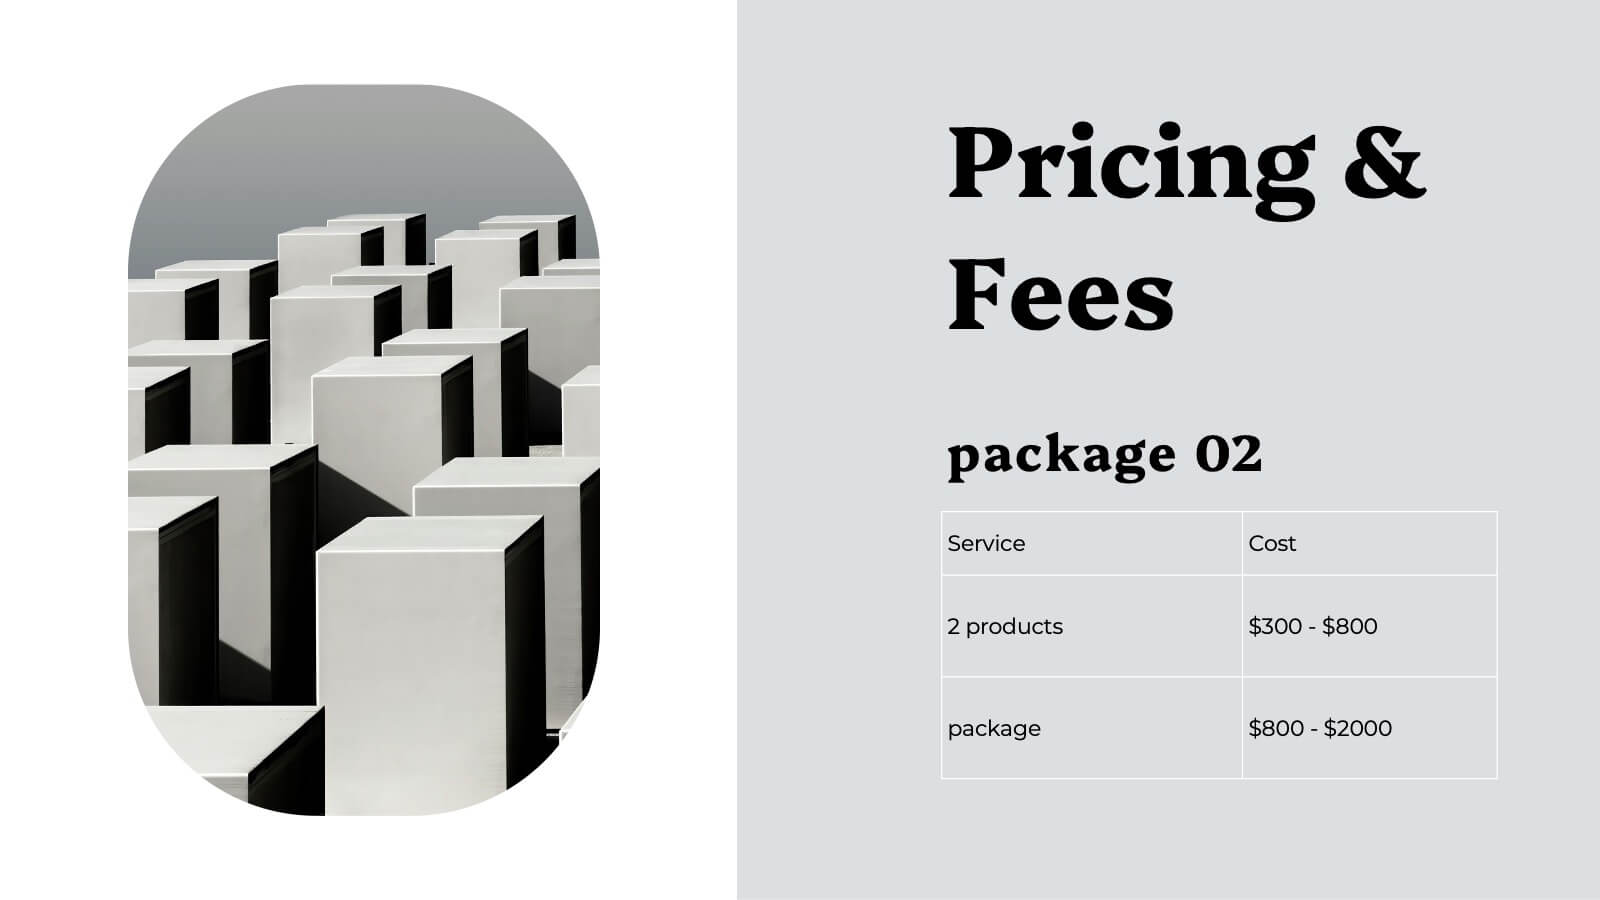
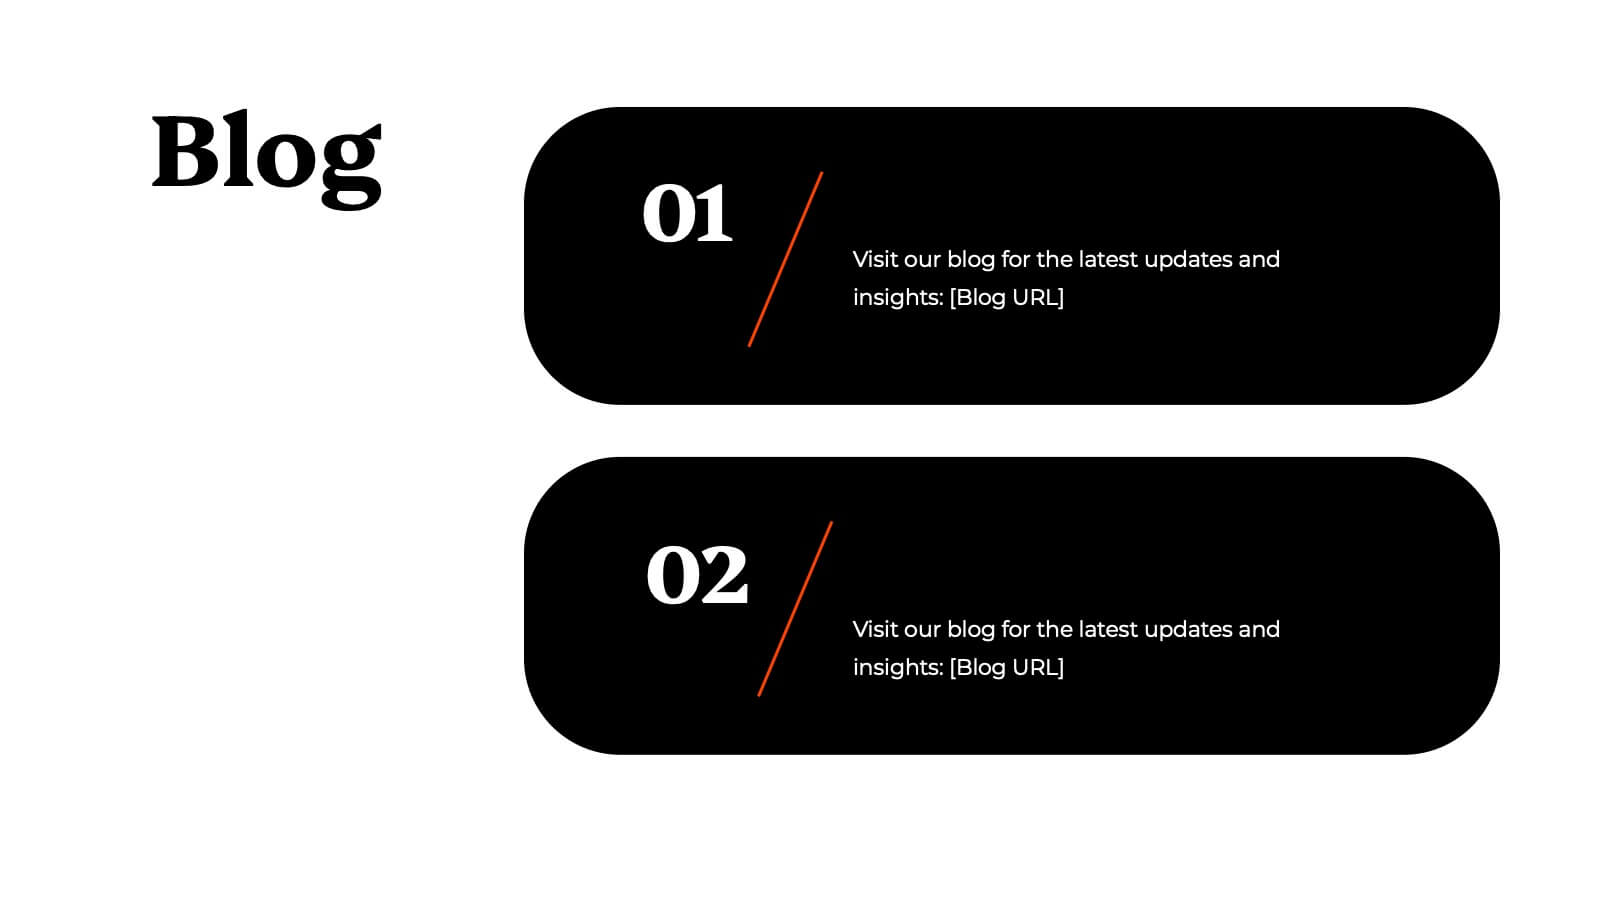
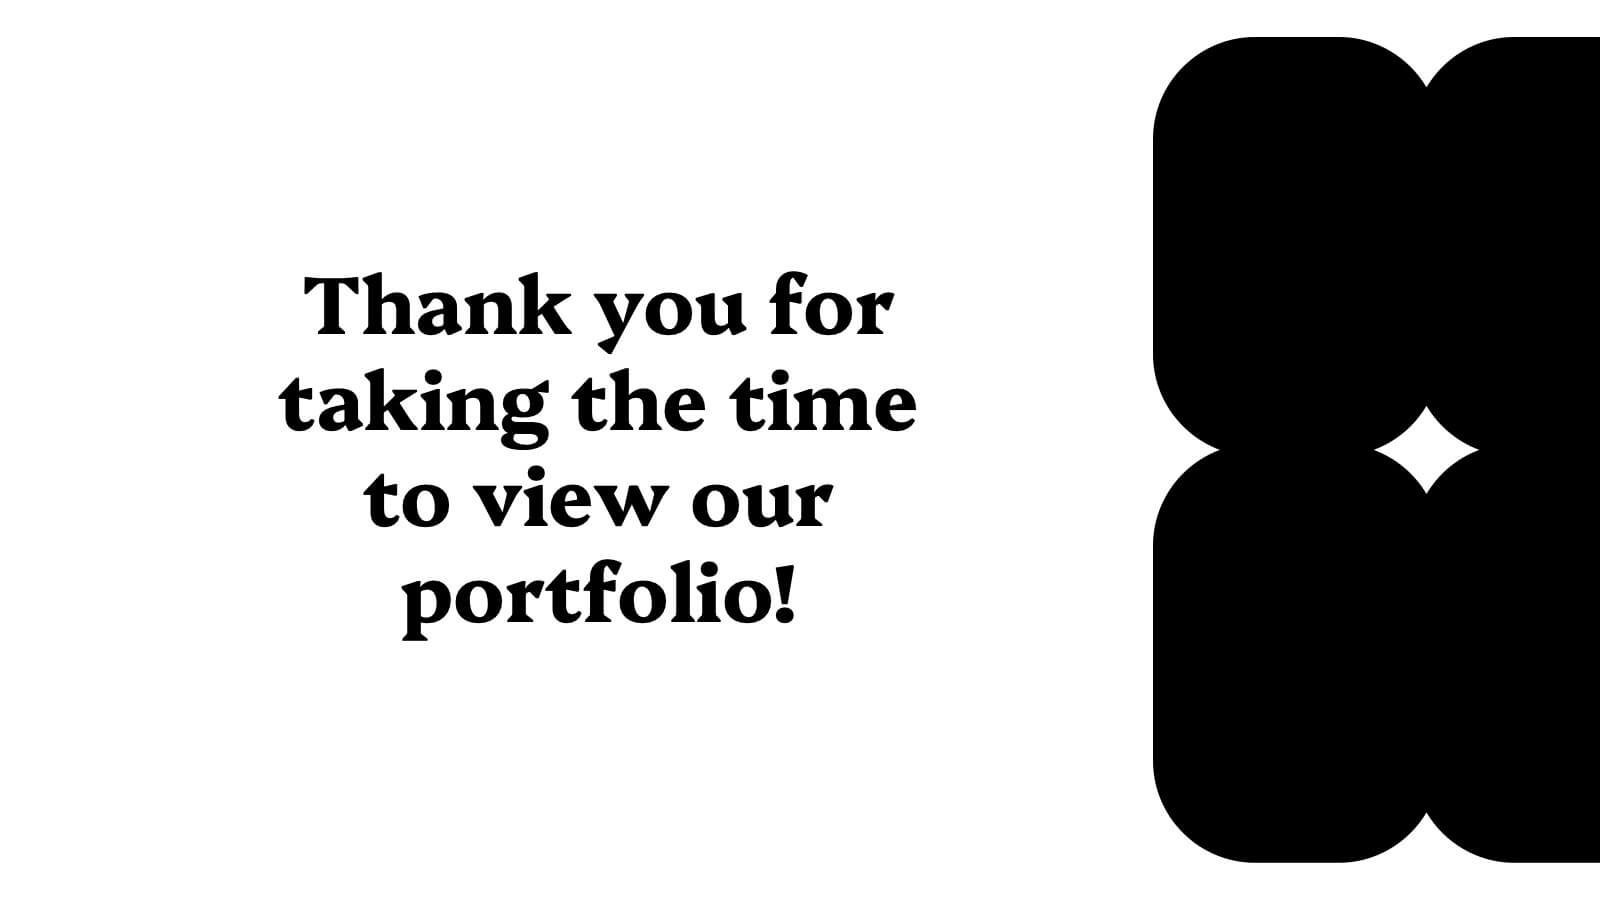
Tempest Design Portfolio Presentation
Elevate your creative showcase with the Tempest Design Portfolio Presentation template! This beautifully crafted layout is designed to highlight your best work in a sophisticated and professional manner. The subtle earthy tones and minimalist design create a perfect backdrop for presenting your projects, from the initial concept to the final execution. Whether you're an individual designer or a creative agency, this template allows you to elegantly present your portfolio, philosophy, and style, making a powerful impact on your audience. Each slide is thoughtfully designed to emphasize your achievements, client testimonials, and services offered, ensuring that your work shines through with clarity and style. Ideal for client presentations, creative pitches, or showcasing your portfolio online, this template is fully compatible with PowerPoint, Keynote, and Google Slides. Make your design story unforgettable with the Tempest template, and let your creativity speak volumes!


7 slides
Time Management Goal Infographic
Time management is the process of organizing and planning how to divide your time between specific activities effectively and efficiently to achieve desired goals or outcomes. This infographic template is designed to empower you in mastering time, optimizing productivity, and seizing the day. This infographic provides a visually striking way to illustrate time management strategies, tips, and hacks for anyone looking to make the most of their time. Fully customizable and compatible with Powerpoint, Keynote, and Google Slides. This showcases time-bound tasks, emphasizing the importance of setting deadlines and managing tasks within periods.


21 slides
Arcadian Photography Portfolio Template Presentation
Showcase your best work with this sleek and stylish photography portfolio presentation template! It’s perfect for presenting your featured projects, creative process, and client testimonials in a visually stunning way. This template is fully customizable and offers a professional touch to your portfolio, making it ideal for both personal and client presentations. Compatible with PowerPoint, Keynote, and Google Slides.


6 slides
Logistic Growth Infographics
Explore the concept of Logistic Growth with our customizable infographic template. This template is fully compatible with popular presentation software like PowerPoint, Keynote, and Google Slides, allowing you to easily customize it to illustrate and communicate the key principles of logistic growth. The Logistic Growth infographic template offers a visually engaging platform to explain the concept of population growth, including the phases of exponential growth and leveling off. Whether you're a student, educator, or researcher, this template provides a user-friendly canvas to create informative presentations and educational materials on logistic growth. Deepen your understanding of Logistic Growth with this SEO-optimized infographic template, thoughtfully designed for clarity and ease of use. Customize it to showcase the growth curve, carrying capacity, and factors affecting population dynamics, ensuring that your audience gains a comprehensive grasp of this important ecological concept. Start crafting your personalized infographic today to explore the dynamics of Logistic Growth.


6 slides
Strategic Expansion in Africa Map Presentation
Showcase your regional growth plan with the Strategic Expansion in Africa Map Presentation. This layout combines a clean Africa map with color-coded country highlights and directional labels, making it perfect for outlining market entry, regional operations, or investment focus. Ideal for business consultants or NGOs. Works in PowerPoint, Canva, and Google Slides.


7 slides
Breast Cancer Stages Infographic
The Breast Cancer Stages infographic template is designed to educate and inform about the different stages of breast cancer in a visually engaging and clear manner. The template, compatible with PowerPoint, Google Slides, and Keynote, features a variety of diagram styles such as percentage charts, stage progressions, and anatomical illustrations. It uses a soft color palette of pinks and whites, which is sympathetic to the subject matter. Each slide is carefully constructed to convey essential information about the stages of breast cancer, recommended screenings, and treatment methods. This template is an excellent resource for healthcare professionals, and advocacy groups looking to raise awareness and provide education on breast cancer.