


Features
- 5 Unique slides
- Fully editable and easy to edit in Microsoft Powerpoint, Keynote and Google Slides
- 16:9 widescreen layout
- Clean and professional designs
- Export to JPG, PDF or send by email


Do you have any questions?
Recommend


6 slides
Learning and Development Plan Presentation
Turn growth goals into action with a presentation built for clarity and impact. Perfect for HR teams, managers, or educators, it helps outline training paths, skill development, and employee progress with a clean, organized layout. Fully editable and compatible with PowerPoint, Keynote, and Google Slides for easy customization.


7 slides
Social Media Report Infographic
A Social Media Report is a comprehensive document that provides an in-depth analysis and summary of a brand or individual's performance on various social media platforms. This template is designed to transform your digital statistics and strategies into a captivating visual story. Just like a well-crafted social media post, this template blends creativity with analytics, enabling you to present your online endeavors in an engaging and informative manner. Compatible with Powerpoint, Keynote, and Google Slides. This is a testament to your brand's digital journey, illustrating the vibrant and diverse landscape of your online presence.


5 slides
Organizational Decision Support System Presentation
Visually showcase team alignment and consensus using the Organizational Decision Support System slide. This layout features a row of team icons paired with "Yes"/"No" speech bubbles, making it perfect for illustrating decision outcomes, vote breakdowns, or approval processes. Easily editable in PowerPoint, Keynote, and Google Slides.


6 slides
6-Factor PESTEL Analysis Slide Deck Presentation
Spark fresh strategic insights with a vibrant hexagon layout that turns complex external factors into a clear, engaging story. This presentation helps teams explore key influences, compare trends, and guide smarter decision-making with confidence. Easy to edit and fully compatible with PowerPoint, Keynote, and Google Slides.


26 slides
Water Pollution in the Pacific Presentation
Water Pollution in the Pacific refers to the contamination of water bodies in the Pacific Ocean, which can have severe consequences for marine life, ecosystems, and human health. This template is designed to raise awareness about the critical issue of water pollution in the Pacific Ocean. This template can effectively convey the urgency and significance of addressing water pollution in the Pacific Ocean. This serves as a powerful tool to educate and inspire individuals, organizations, and policymakers to take action and work towards sustainable solutions for the preservation of our precious marine ecosystems.


21 slides
Inventra Creative Portfolio Presentation
Make a lasting impression with this sleek and modern creative portfolio presentation template. Perfect for showcasing your artistic journey, featured projects, unique style, and client testimonials. Highlight your creative process, pricing, and services with a bold and professional layout. Fully customizable in PowerPoint, Keynote, and Google Slides.


7 slides
South America Population Infographic Presentation
A South America map infographic is a visual representation of the continent of South America, highlighting its geography, population, culture, history, and other relevant information. Use this template as a graphic representation of South America that combines text, data, and images in an informative way. This infographic can be designed in different styles and formats, including political maps, physical maps, topographic maps, population density maps, and climate maps. You can also include information about major cities, landmarks, natural resources, and cultural traditions.


7 slides
Environmental Specialist Infographic
An Environmental Specialist, is a professional who focuses on environmental issues and challenges, aiming to develop solutions and strategies to address them. This engaging infographic template is designed to shed light on the critical role of environmental specialists, presenting data, facts, and strategies to inspire and educate on the path towards a sustainable and eco-friendly world. Fully customizable and compatible with Powerpoint, Keynote, and Google Slides. This infographic is your guide to understanding and appreciating the invaluable work of environmental specialists.


7 slides
Project Management Tools Infographic
Project management is the discipline of planning, organizing, securing, and managing resources to achieve specific goals within a defined time frame and budget. This visually appealing and informative template allows you to represent project lifecycles, key milestones, team roles, and more, making complex project data easily digestible. Fully customizable and compatible with Powerpoint, Keynote, and Google Slides. Illustrate the project lifecycle from initiation to completion for a comprehensive understanding. Utilize this template to effectively show project progress and objectives, ensuring your audience is informed throughout the project's lifecycle.


23 slides
Wave Small Business Pitch Deck Presentation
This business pitch deck is your key to winning over investors! It covers everything from company background and product overview to SWOT analysis and market opportunity. With clear visuals of financial performance and strategic goals, this deck provides the perfect roadmap for success. Ideal for PowerPoint, Keynote, and Google Slides presentations!


4 slides
Human Anatomy Infographic
Visualize internal body systems with clarity using this editable human anatomy slide. Ideal for educational, medical, or health-related topics, this layout helps present organs and body functions with precision. Fully customizable in PowerPoint, Keynote, and Google Slides—adjust labels, icons, and colors to fit your needs.


5 slides
Business Innovation Strategy Presentation
Present a compelling Business Innovation Strategy with this modern infographic. Designed to highlight key insights, innovative solutions, and strategic approaches, this template is perfect for business professionals, consultants, and startups. Fully editable and compatible with PowerPoint, Keynote, and Google Slides.


5 slides
Project Summary and Executive Highlights Presentation
Summarize key milestones with this Project Summary and Executive Highlights slide. Featuring a clean horizontal layout with icons and numbered steps, it’s perfect for spotlighting major achievements, phases, or metrics. Use it to present updates with clarity and professionalism. Fully editable in PowerPoint, Google Slides, or Canva.


23 slides
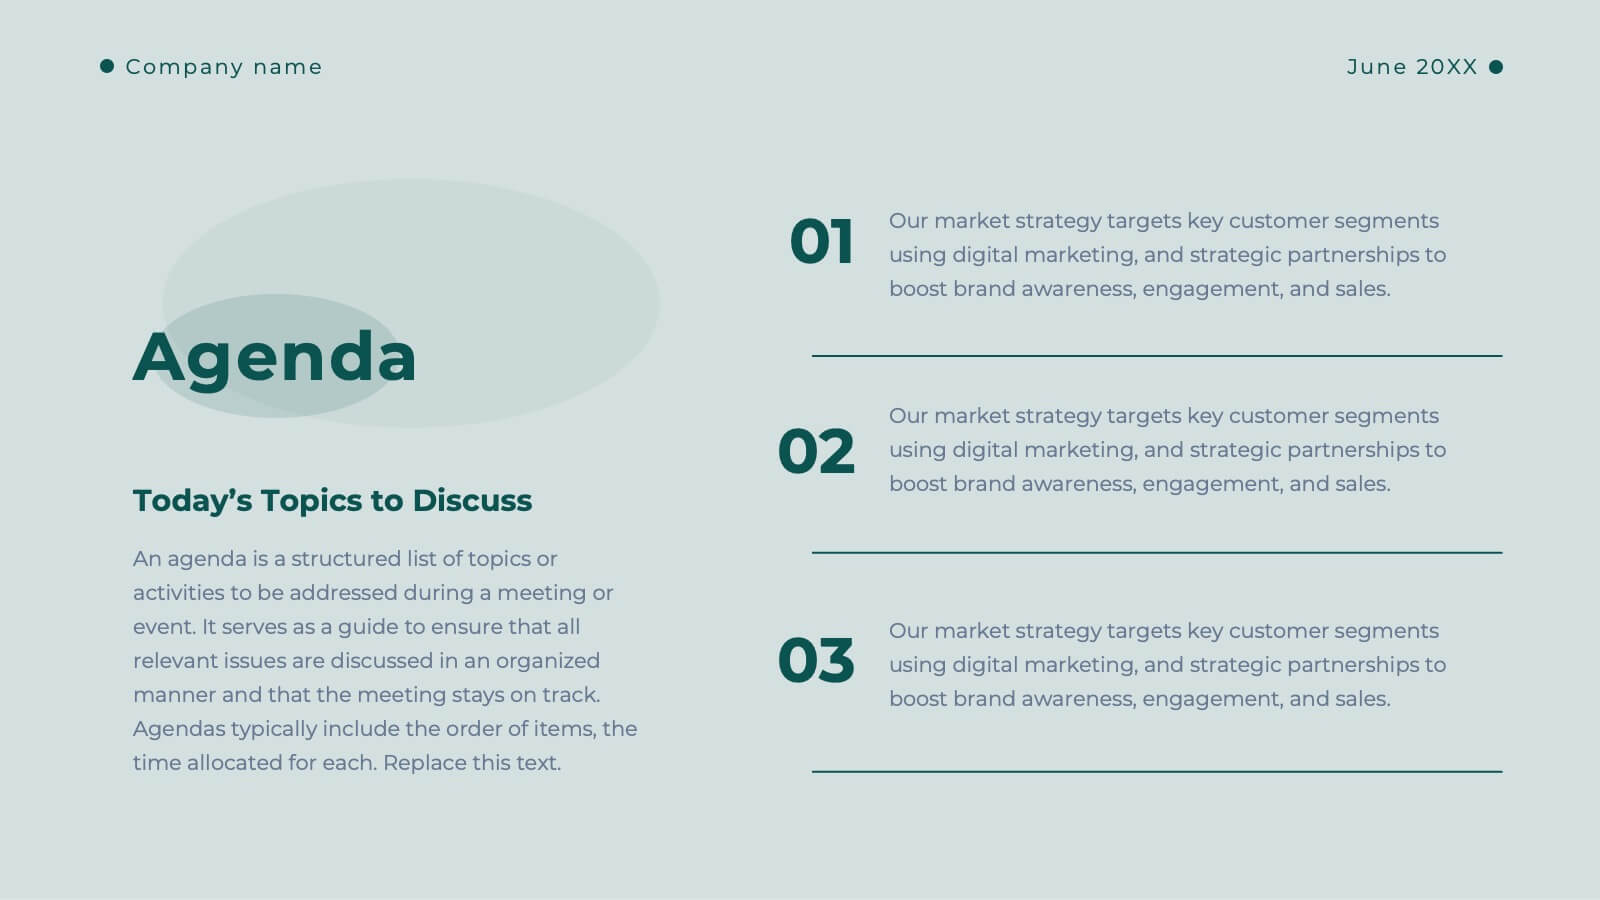
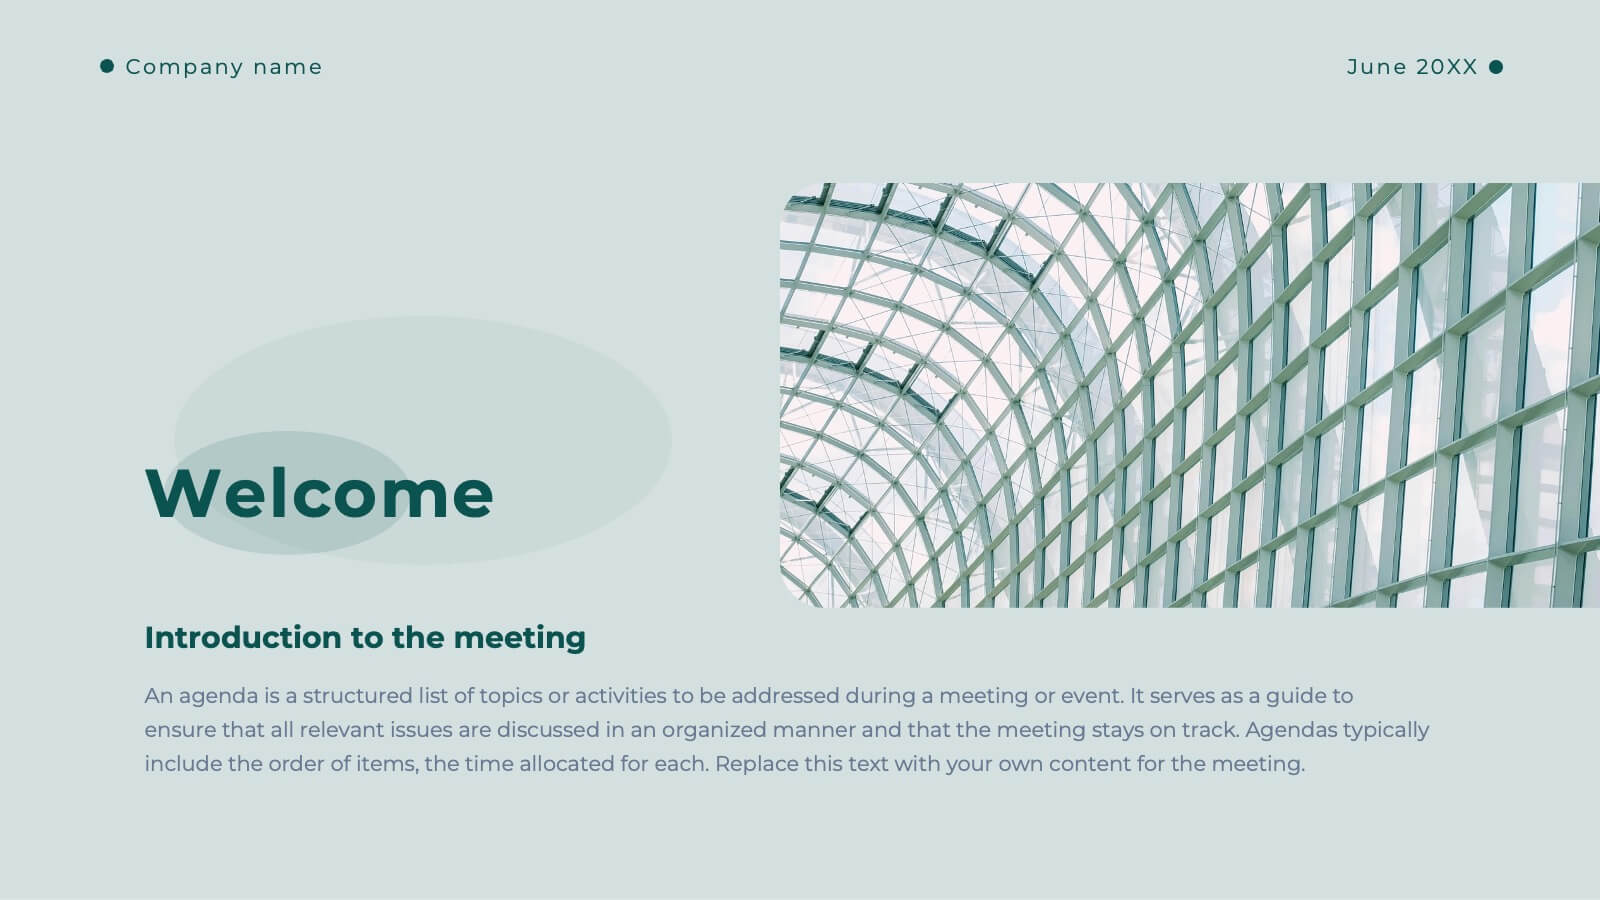
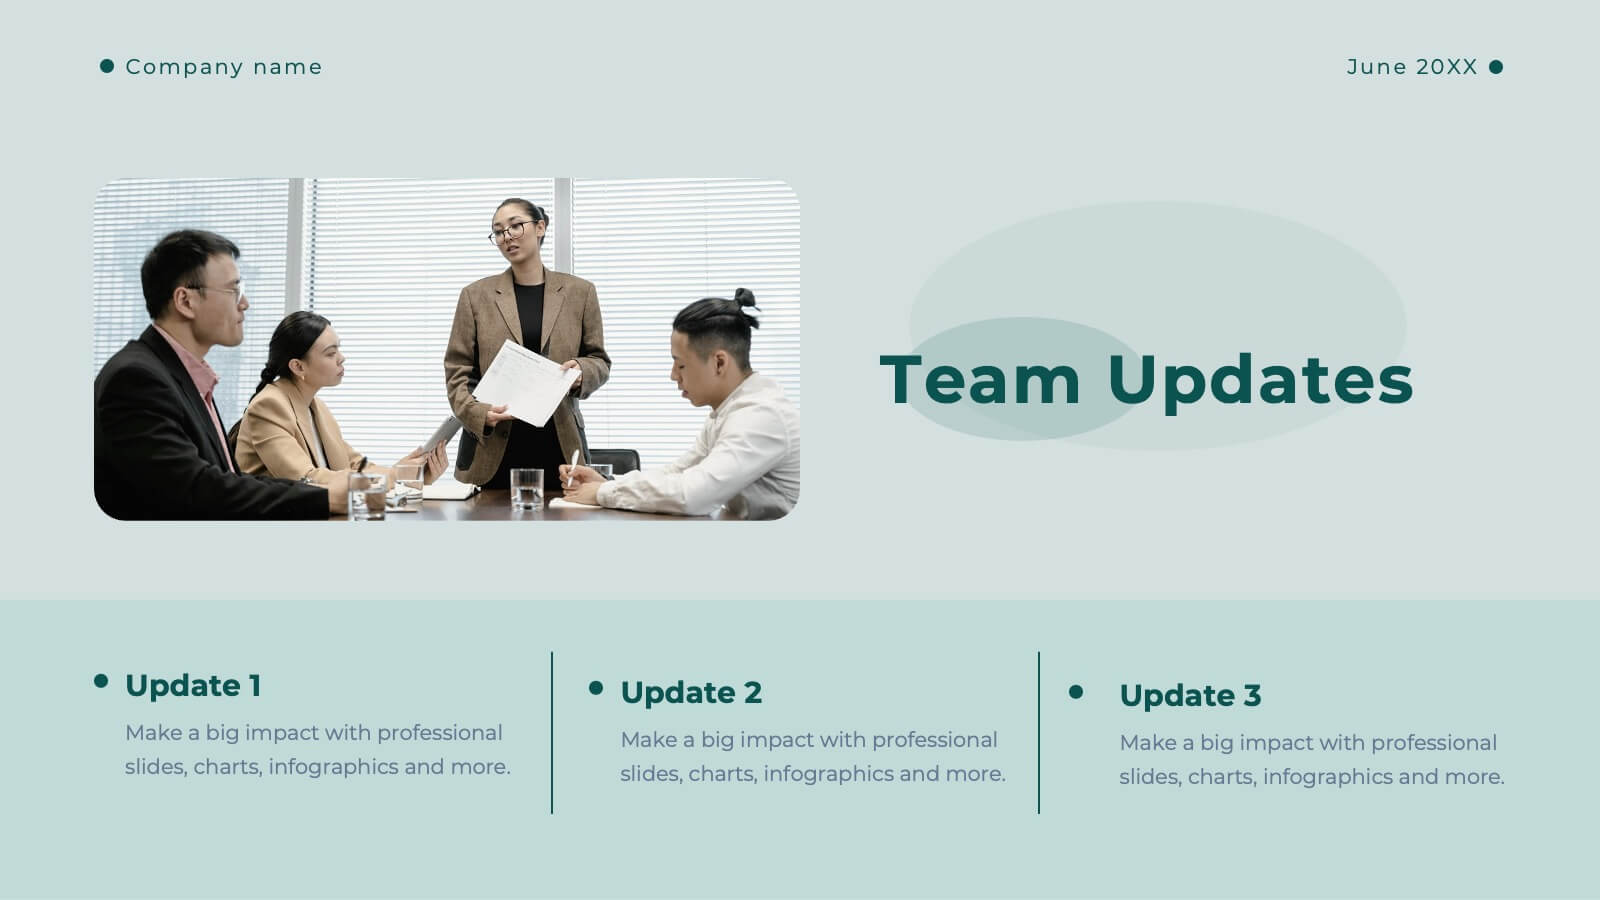
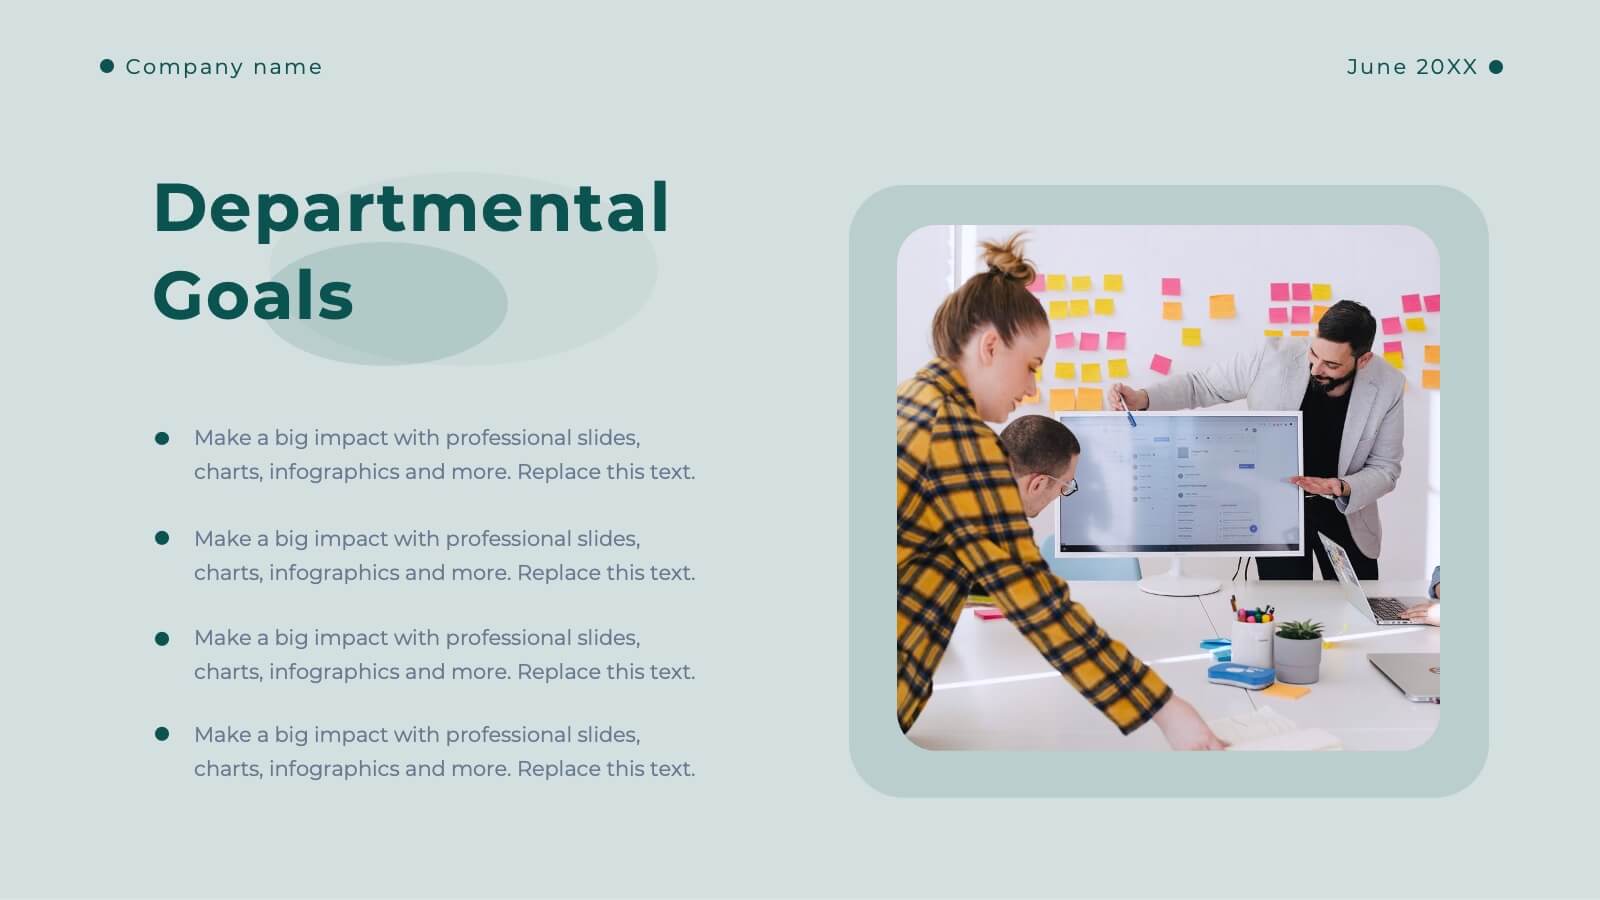
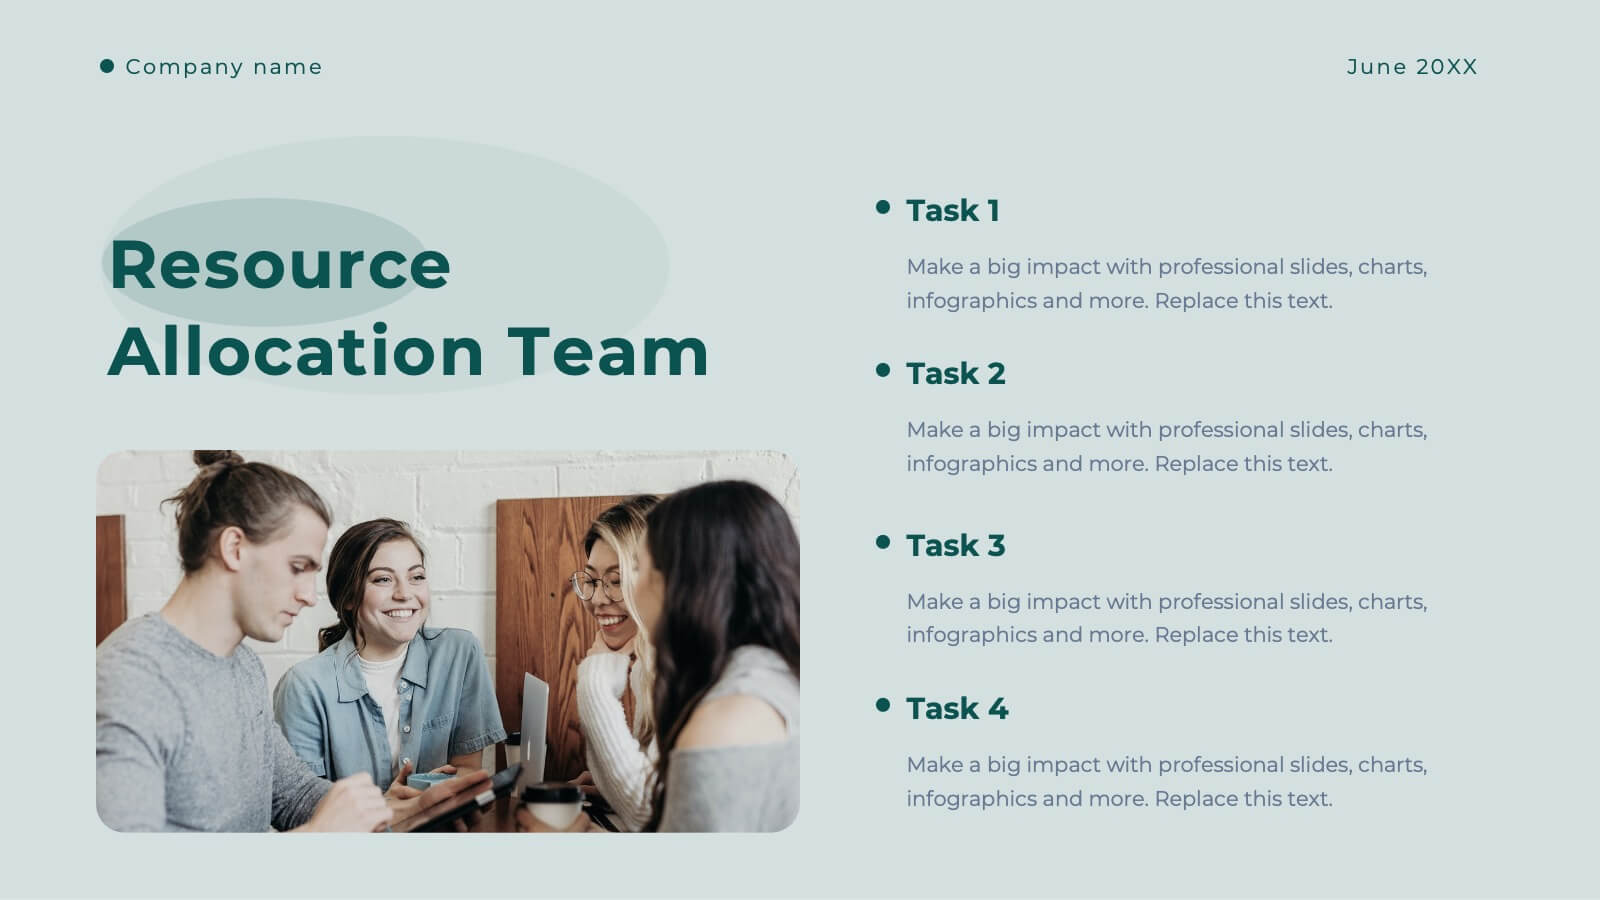
Clarity Business Operations Plan Presentation
Optimize your business operations with this sleek presentation template! Perfect for outlining team updates, key achievements, and performance metrics, it includes slides for departmental goals, process improvements, and upcoming events. Engage your team with clear visuals and detailed content. Compatible with PowerPoint, Keynote, and Google Slides for seamless presentations on any platform.


7 slides
Customer Question for Support Infographic
Step into the spotlight with our vibrant Infographic Template, where every inquiry is a star! Designed to dazzle, this template offers a show-stopping way to address customer queries with flair and precision. Imagine vibrant backdrops and playful fonts that turn ordinary support interactions into captivating visual stories.Tailor-made for businesses eager to shine in customer service, this template transforms FAQs into eye-popping, memorable visuals. Whether it’s tech glitches, product how-tos, or service details, your answers will not only be seen—they’ll be remembered. Customize to fit your brand’s personality, deploying colors and styles that resonate with your audience.Ideal for help centers, product support pages, or digital kiosks, it makes customer support not just helpful, but spectacularly engaging. Ready for use with popular graphic design tools, it’s your backstage pass to standing ovations in customer care.


26 slides
Hypnosia Brand Guidelines Proposal Presentation
This Brand Guidelines Proposal Template provides a sleek, professional layout to showcase key branding elements like vision, values, identity, and strategy. Perfect for businesses and agencies, it ensures brand consistency. Fully customizable and compatible with PowerPoint, Keynote, and Google Slides for seamless adaptation to your brand’s style.


2 slides
End Slide with Contact and Gratitude Message Presentation
Say goodbye with impact and leave a lasting impression! This clean, modern slide is perfect for ending presentations with a clear contact section and a heartfelt thank-you message. Ideal for client decks, proposals, or reports. Fully compatible with PowerPoint, Keynote, and Google Slides for easy editing and customization.