


Features
- 5 Unique slides
- Fully editable and easy to edit in Microsoft Powerpoint, Keynote and Google Slides
- 16:9 widescreen layout
- Clean and professional designs
- Export to JPG, PDF or send by email


Do you have any questions?
Recommend


7 slides
Customer Service Profile Infographic Presentation
A Customer Profile infographic is a visual representation of a target customer or customer segment that provides important information about their demographics, behavior, preferences, and needs. This template can help businesses and organizations understand their customers better, tailor their products or services to meet their needs, and develop effective marketing strategies. This template can be used for various purposes, such as to guide product development, to inform marketing campaigns, or to improve customer service. This template is compatible with Powerpoint, keynote and google slides.


7 slides
Modern Artificial Intelligence Infographic
Modern Artificial Intelligence refers to the contemporary state of AI technology, methods, and applications that have evolved significantly in recent years, especially from the early 21st century onwards. This infographic template is designed to present complex information in a clear and engaging manner. This template uses visuals like charts, graphs, icons, and text to enhance understanding. The objective of this infographic is to provide a visual and informative snapshot of the contemporary landscape of artificial intelligence, making complex concepts accessible to a broad audience.


10 slides
Professional Table of Content Slide Presentation
Give your presentation a polished and organized introduction with this Professional Table of Content slide. Designed for clarity and navigation, it features four sleek, color-coded content banners—perfect for outlining major sections or chapters. Each icon and title can be customized to reflect your topic structure. Ideal for business plans, proposals, or reports. Fully editable in PowerPoint, Keynote, and Google Slides.


26 slides
Dante Presentation Template
Featuring our new Dante Sportswear template this is a great way to present your products and ideas in an attractive, easy-to-read and easily understanding presentation. It includes all the elements you need to create a marketing presentation with style that will stand out. This template has plenty of space for displaying statistics and other data with images that complement your product/service information. You can use this template for valuable sportswear content or information to educate or entertain your audience. This template is fully and easily editable in powerpoint as well!


5 slides
4-Piece Puzzle Diagram Presentation
Break down complex concepts with the 4-Piece Puzzle Diagram. This intuitive visual aid allows you to illustrate relationships, key components, and strategic elements in a clear and structured format. Perfect for business presentations, project planning, and educational content, this template ensures seamless customization and compatibility with PowerPoint, Keynote, and Google Slides.


5 slides
Business Insight Iceberg Presentation
Visualize surface-level data and deeper insights with the Business Insight Iceberg Presentation. Perfect for showcasing organizational structure, decision-making layers, or strategy breakdowns. Each editable layer helps communicate complexity clearly and effectively. Fully compatible with PowerPoint, Keynote, and Google Slides—ideal for professionals, analysts, and educators aiming for clarity and impact.


6 slides
Efficient Workflow Management
Highlight process optimization, task delegation, or team productivity strategies using this linear gear-style workflow design. Perfect for operations leaders, project managers, or consultants presenting step-by-step plans. Fully customizable in PowerPoint, Keynote, and Google Slides—edit icons, text, and colors to fit your message.


4 slides
Vision Statement Slide Presentation
Spark inspiration from the very first slide with a clean, modern layout designed to express future goals with clarity and confidence. This presentation helps teams communicate direction, long-term aspirations, and strategic focus in a simple, structured format. Fully compatible with PowerPoint, Keynote, and Google Slides.


6 slides
Geometric Distribution Infographic
The geometric distribution is a probability distribution that models the number of trials needed for a specific event to occur for the first time in a sequence of independent and identically distributed Bernoulli trials. This Infographic template is a visual representation of the geometric distribution, which is a probability distribution that models the number of Bernoulli trials required for a success to occur. This is can be used in scenarios where you're interested in the number of trials needed for a specific event to occur. This template can help explain the geometric distribution concept, formula, and application in a clear and visually appealing manner.


21 slides
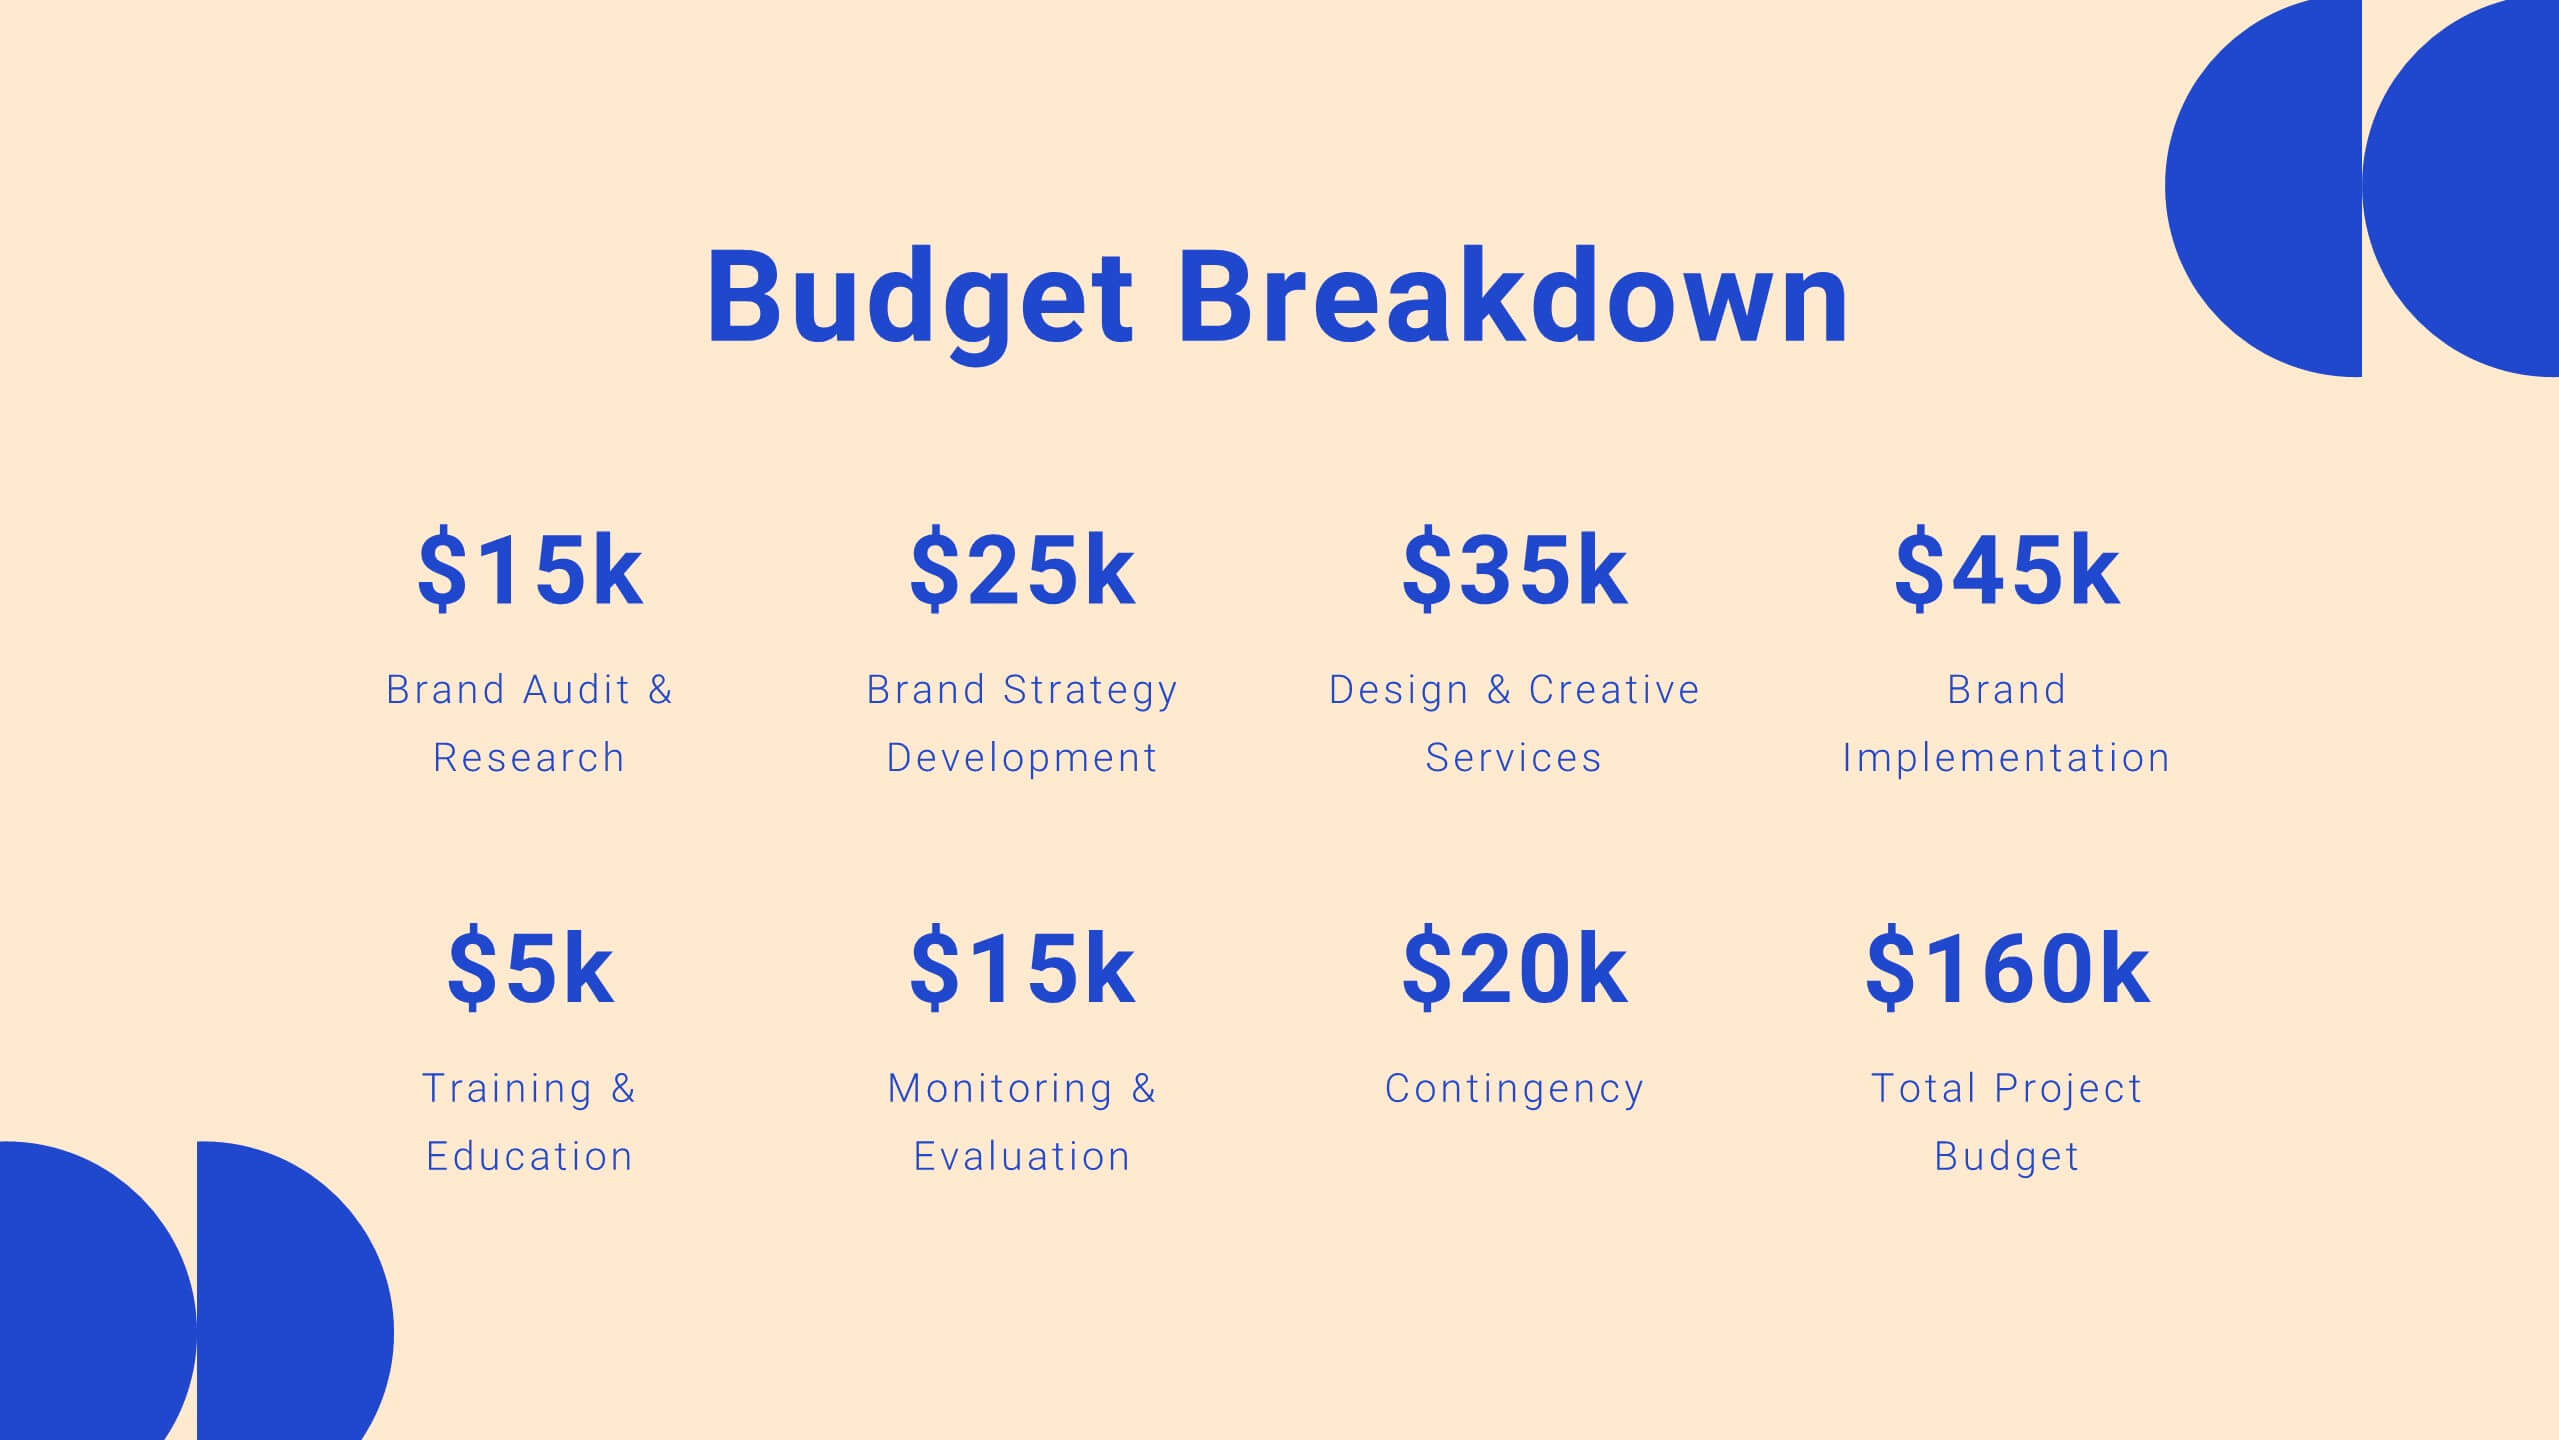
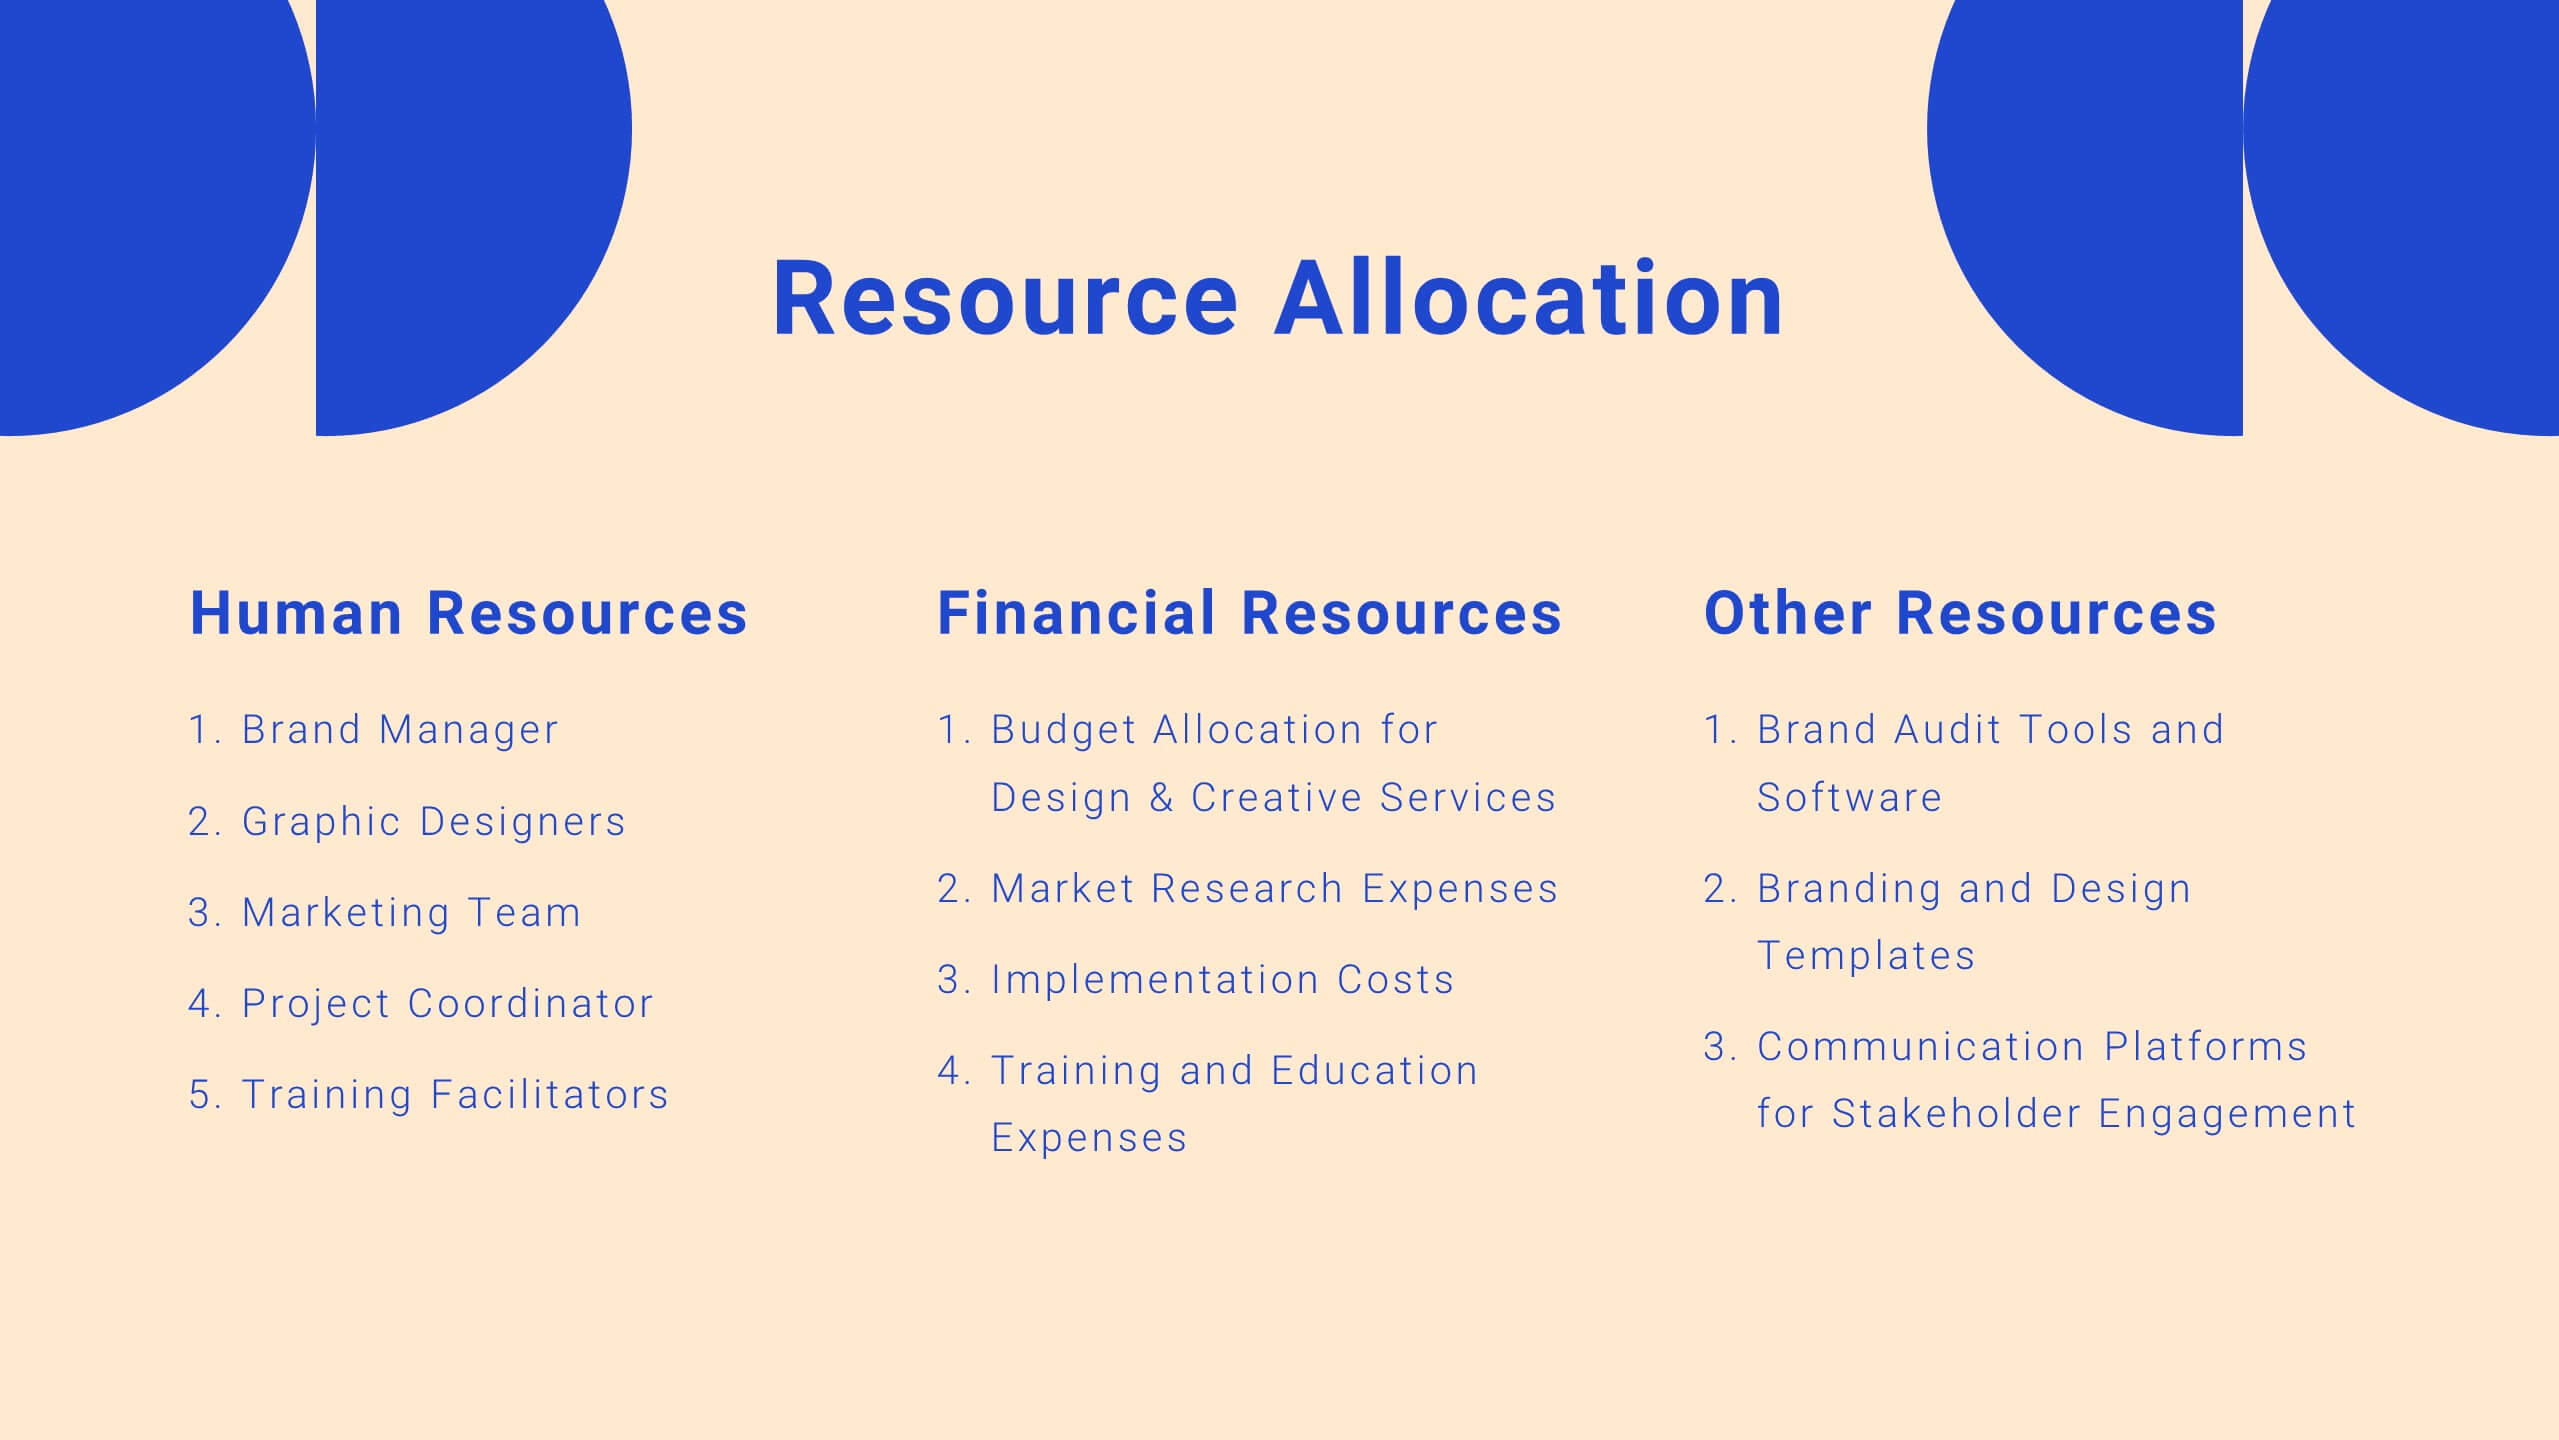
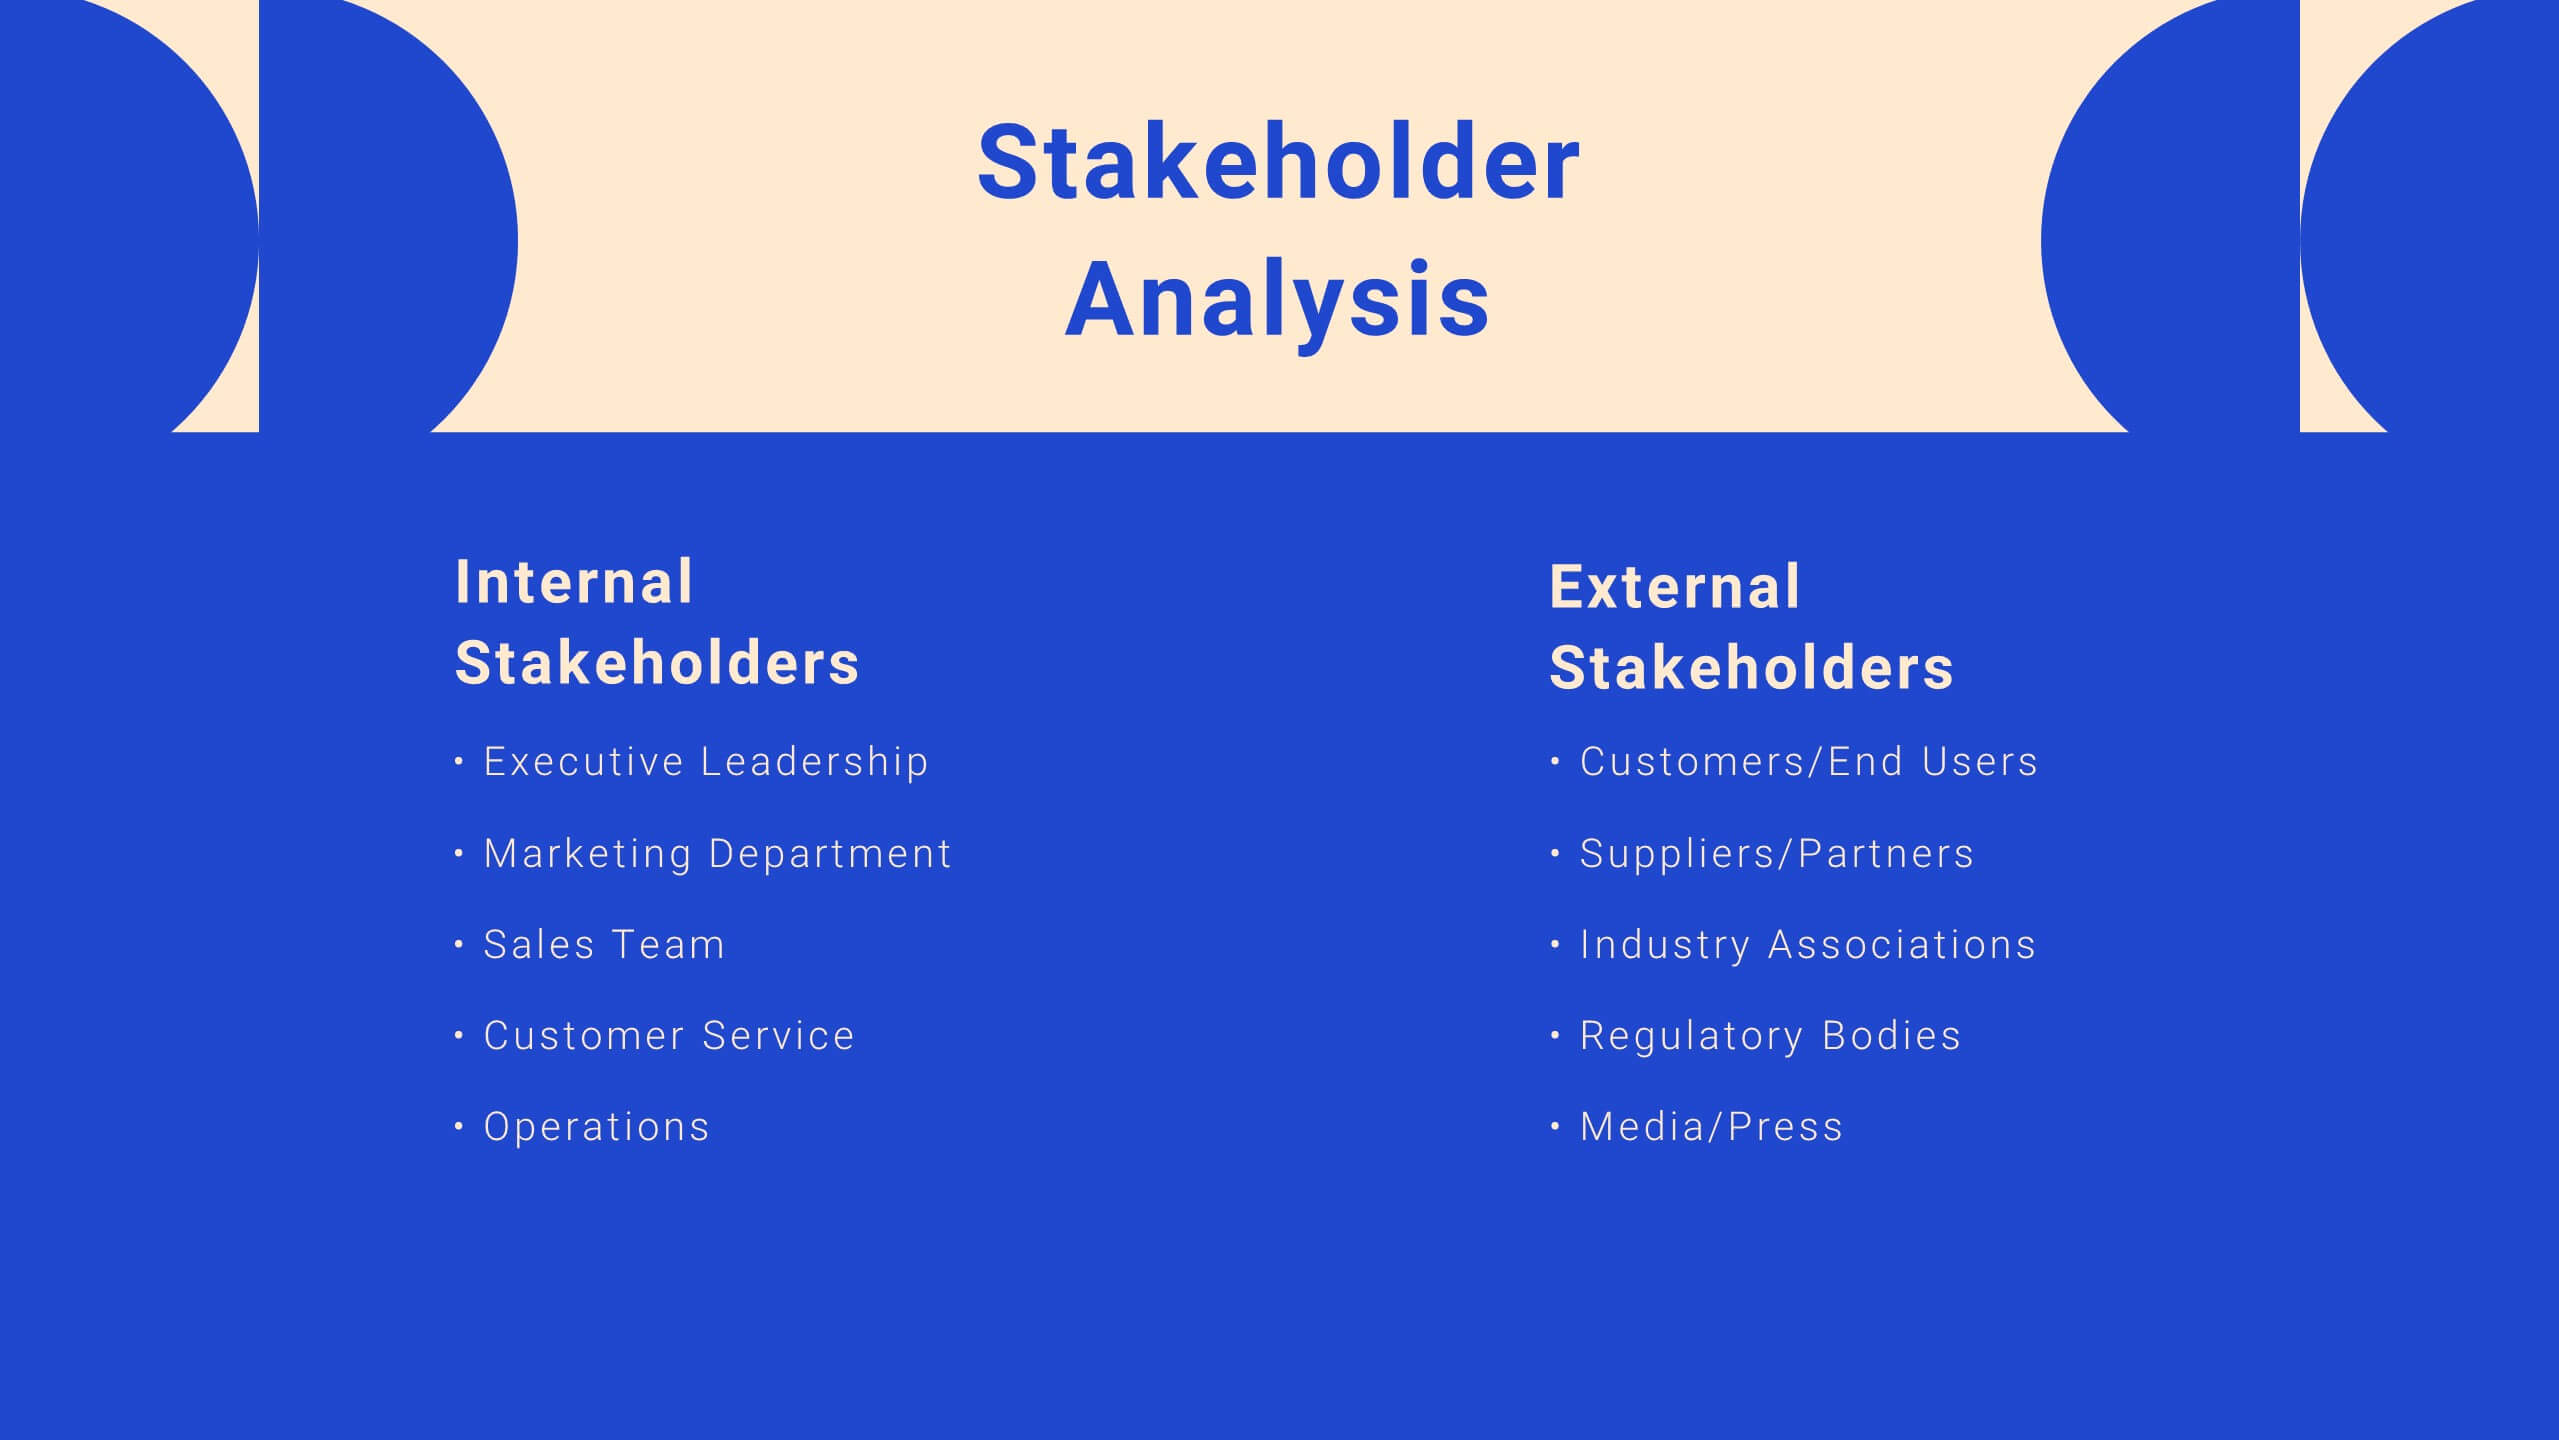
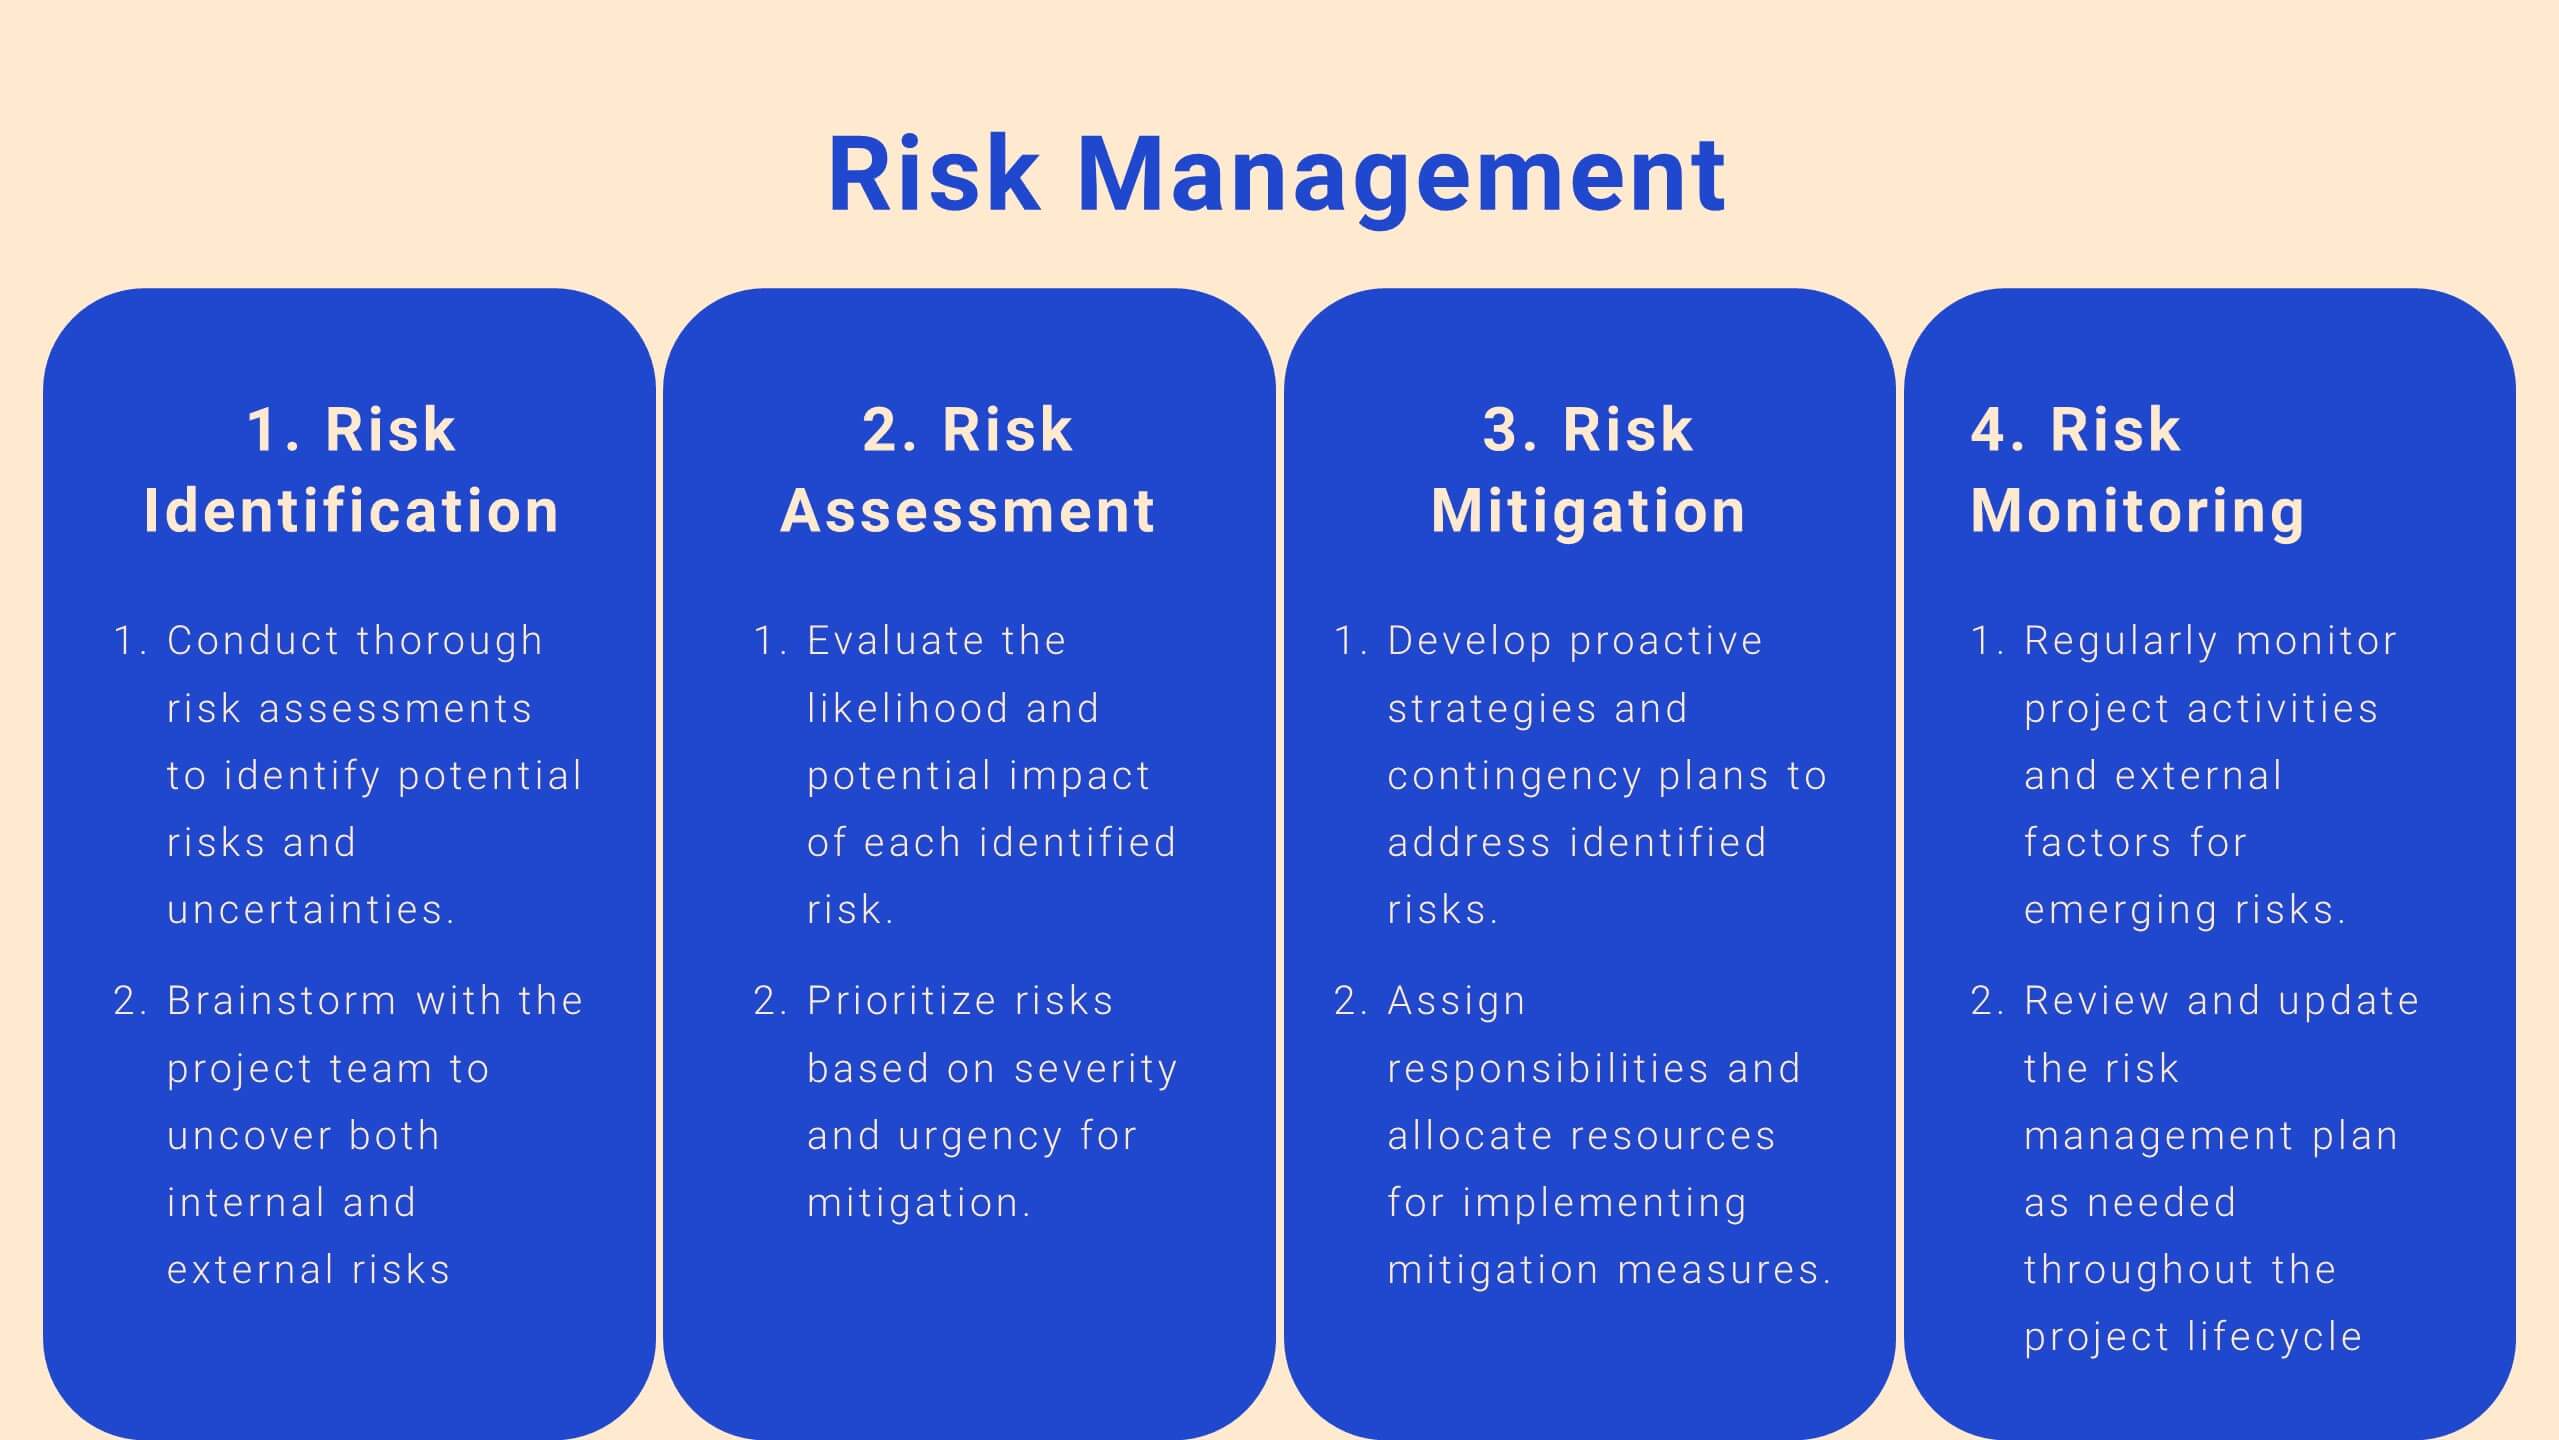
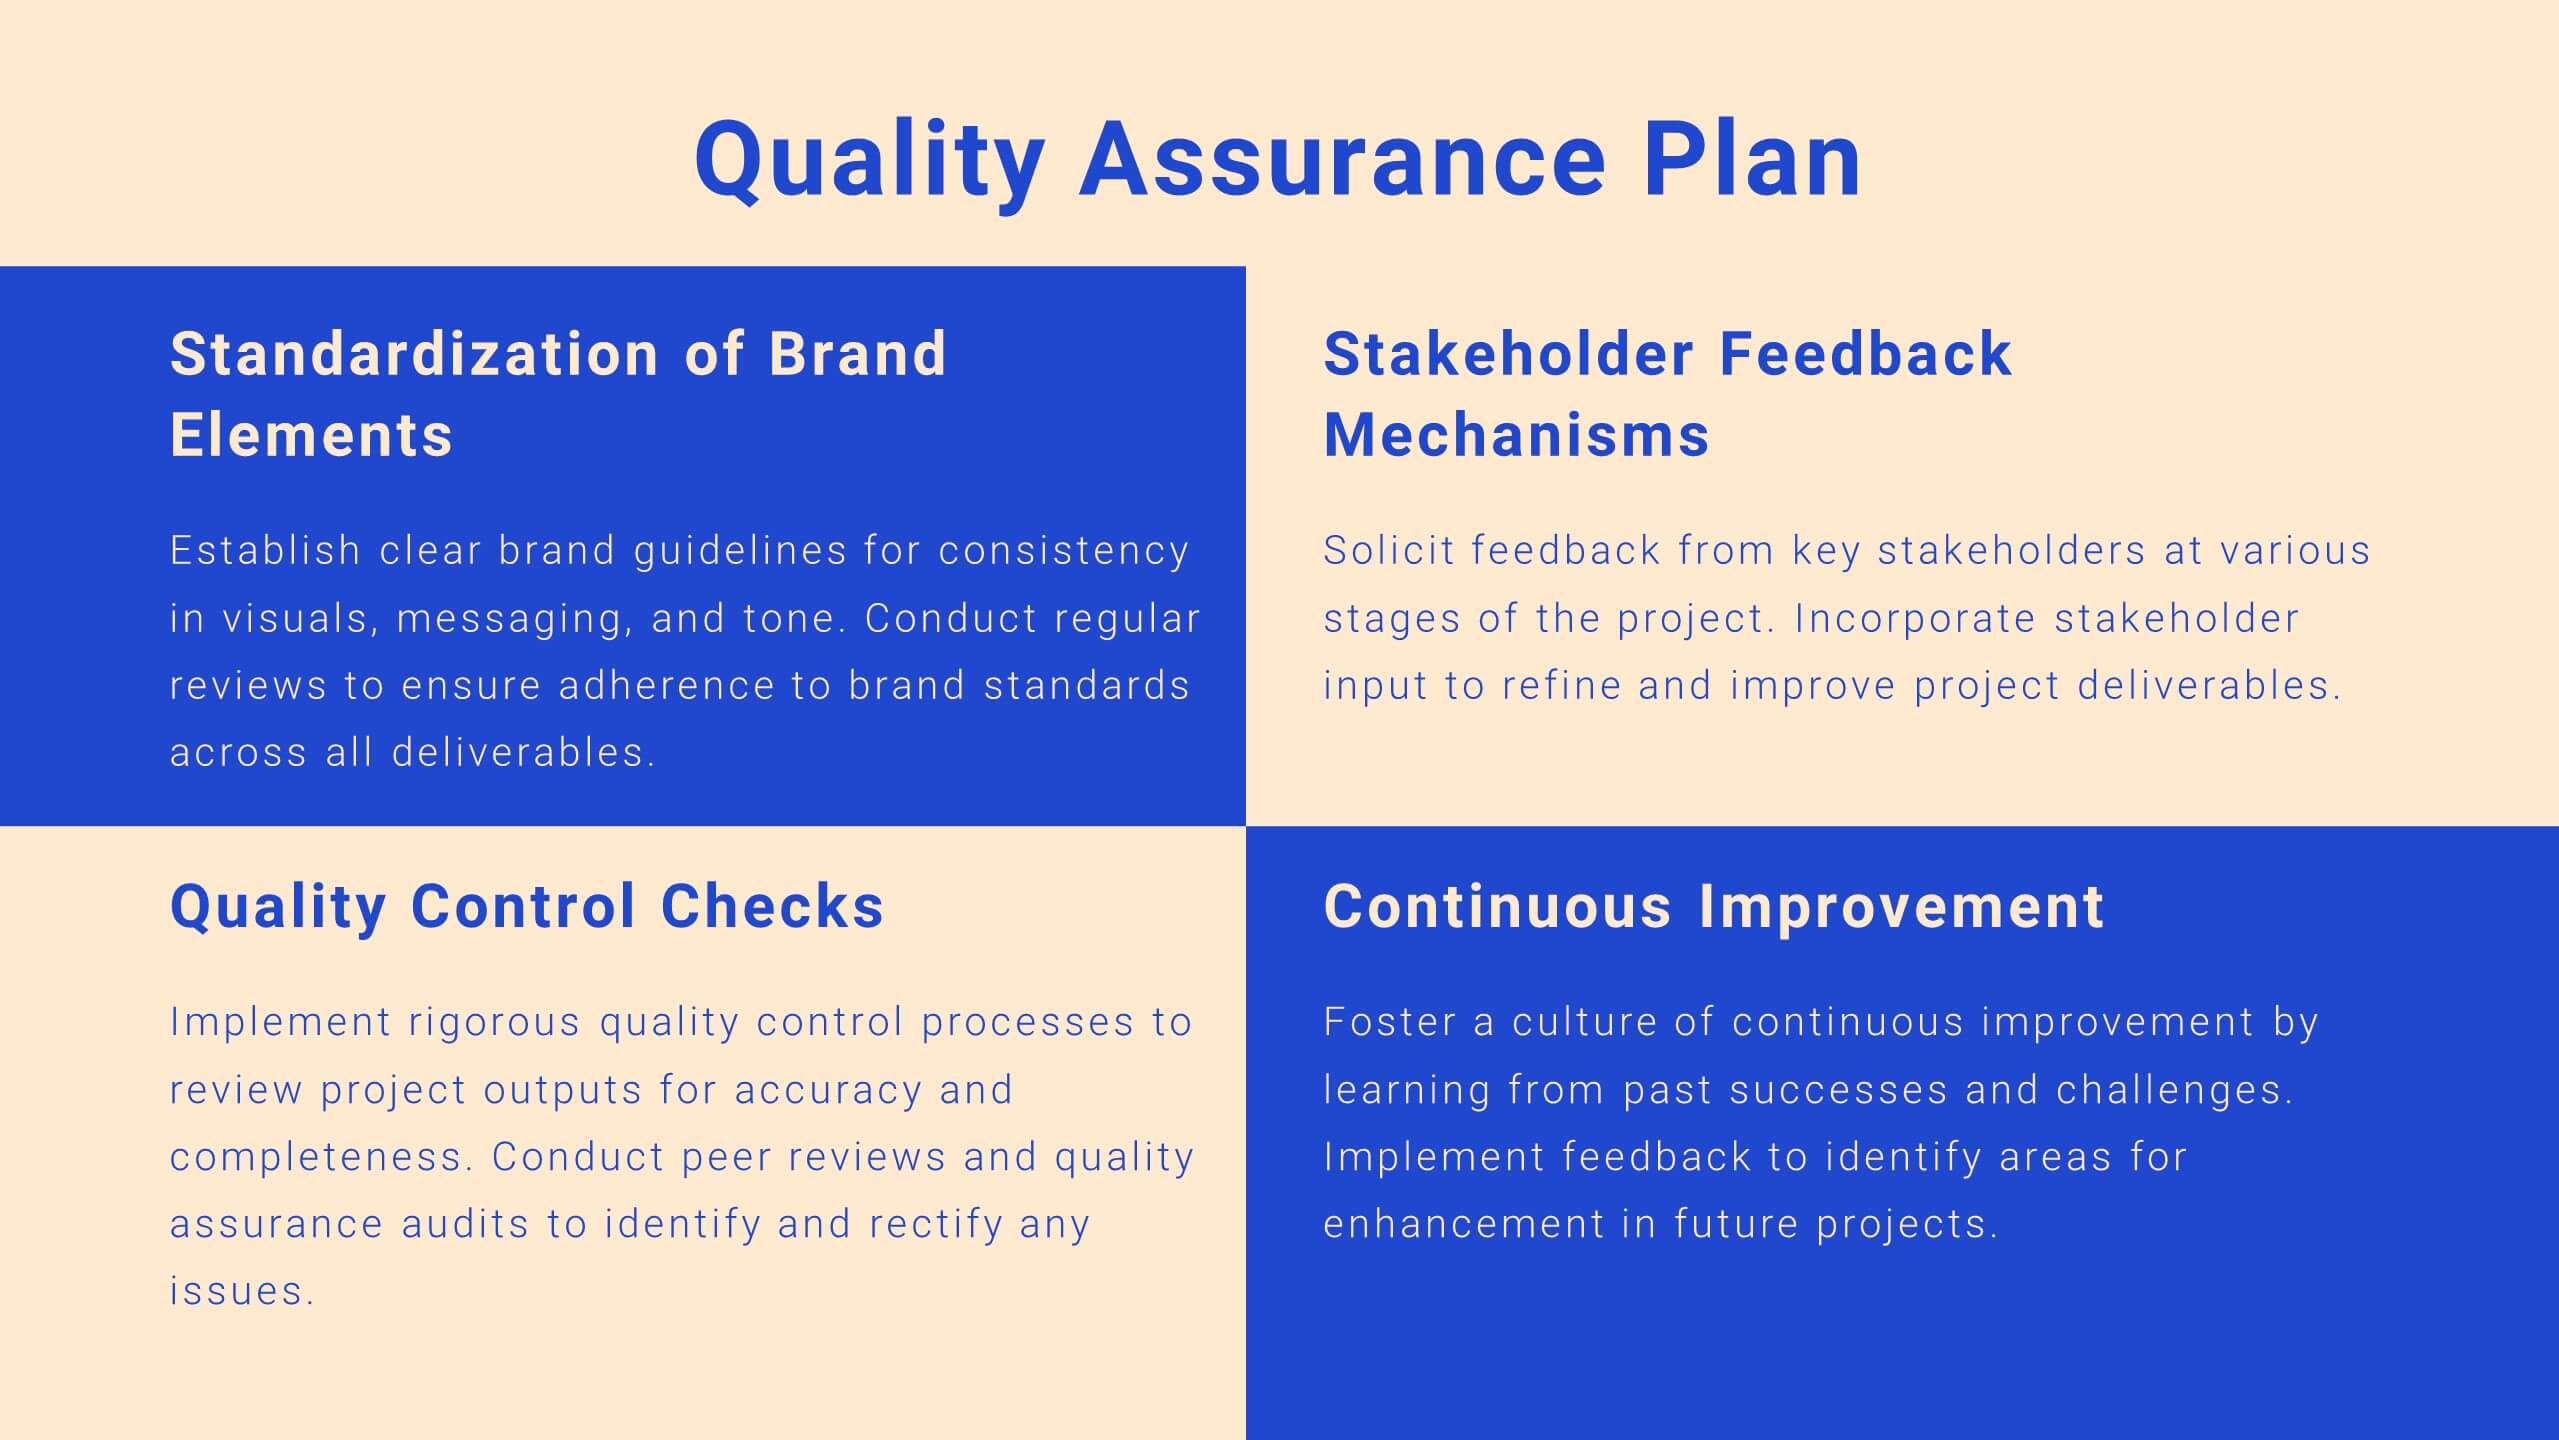
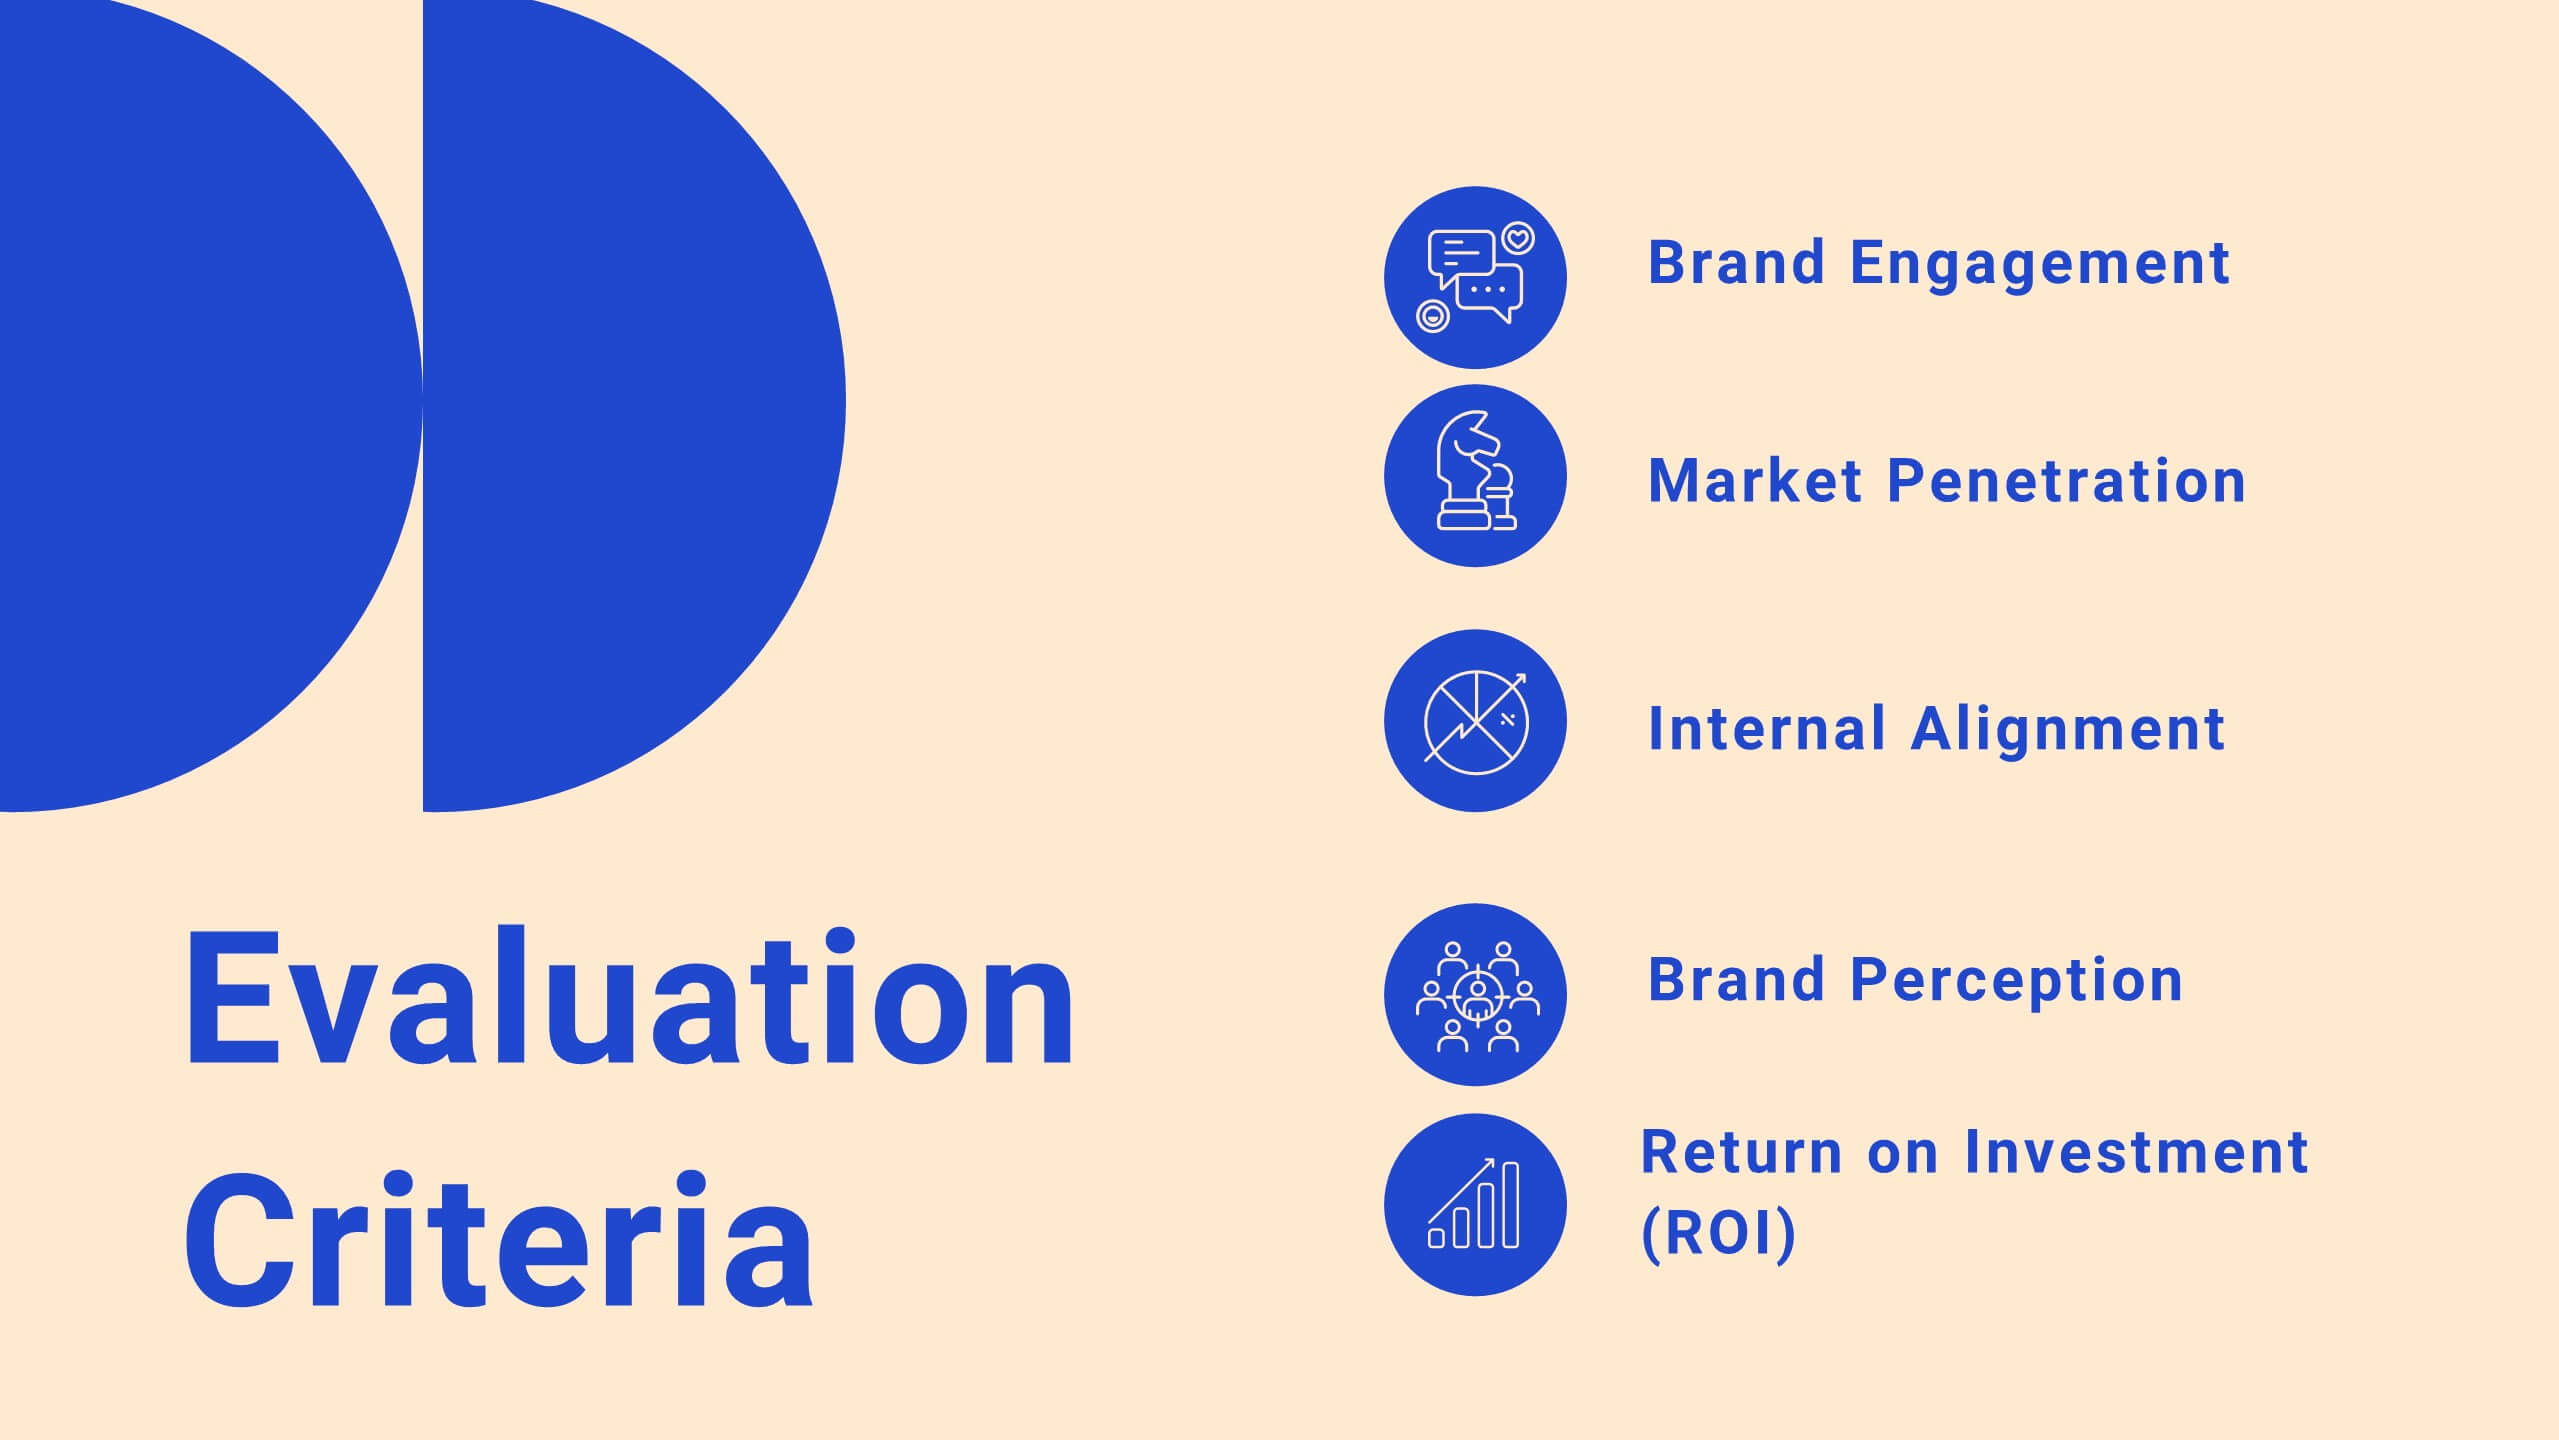
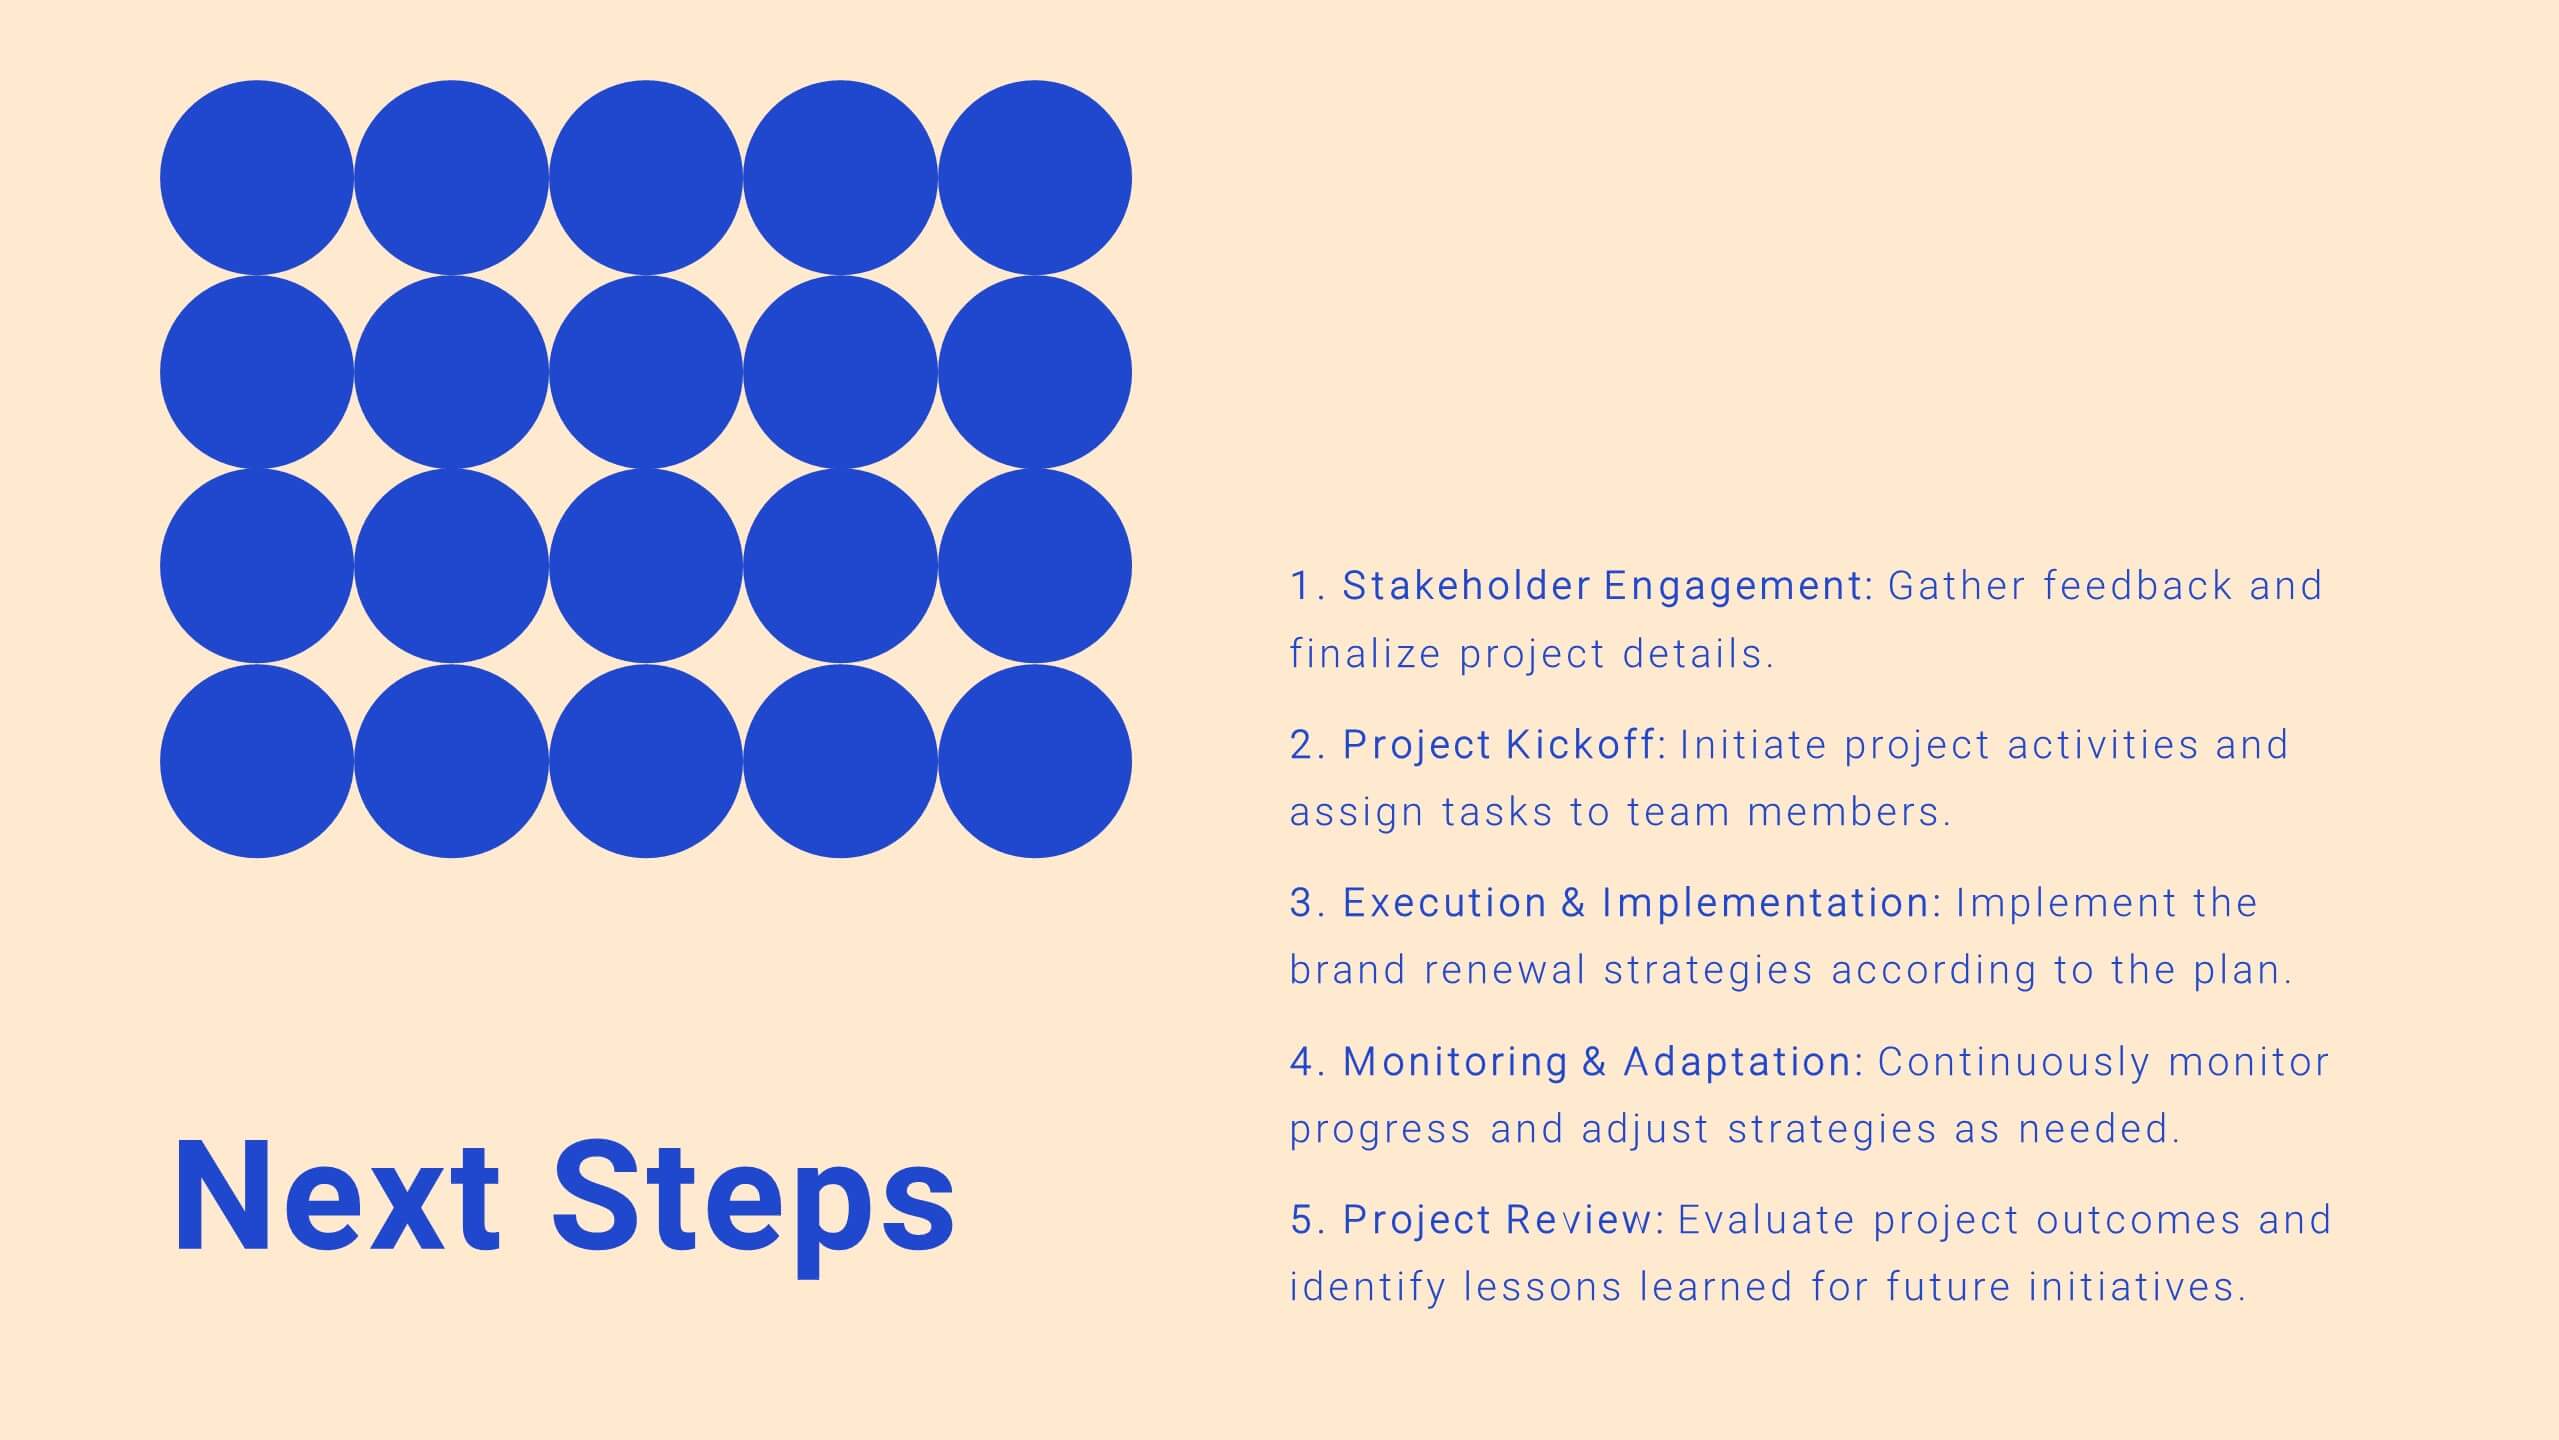
Drift Agile Project Plan Presentation
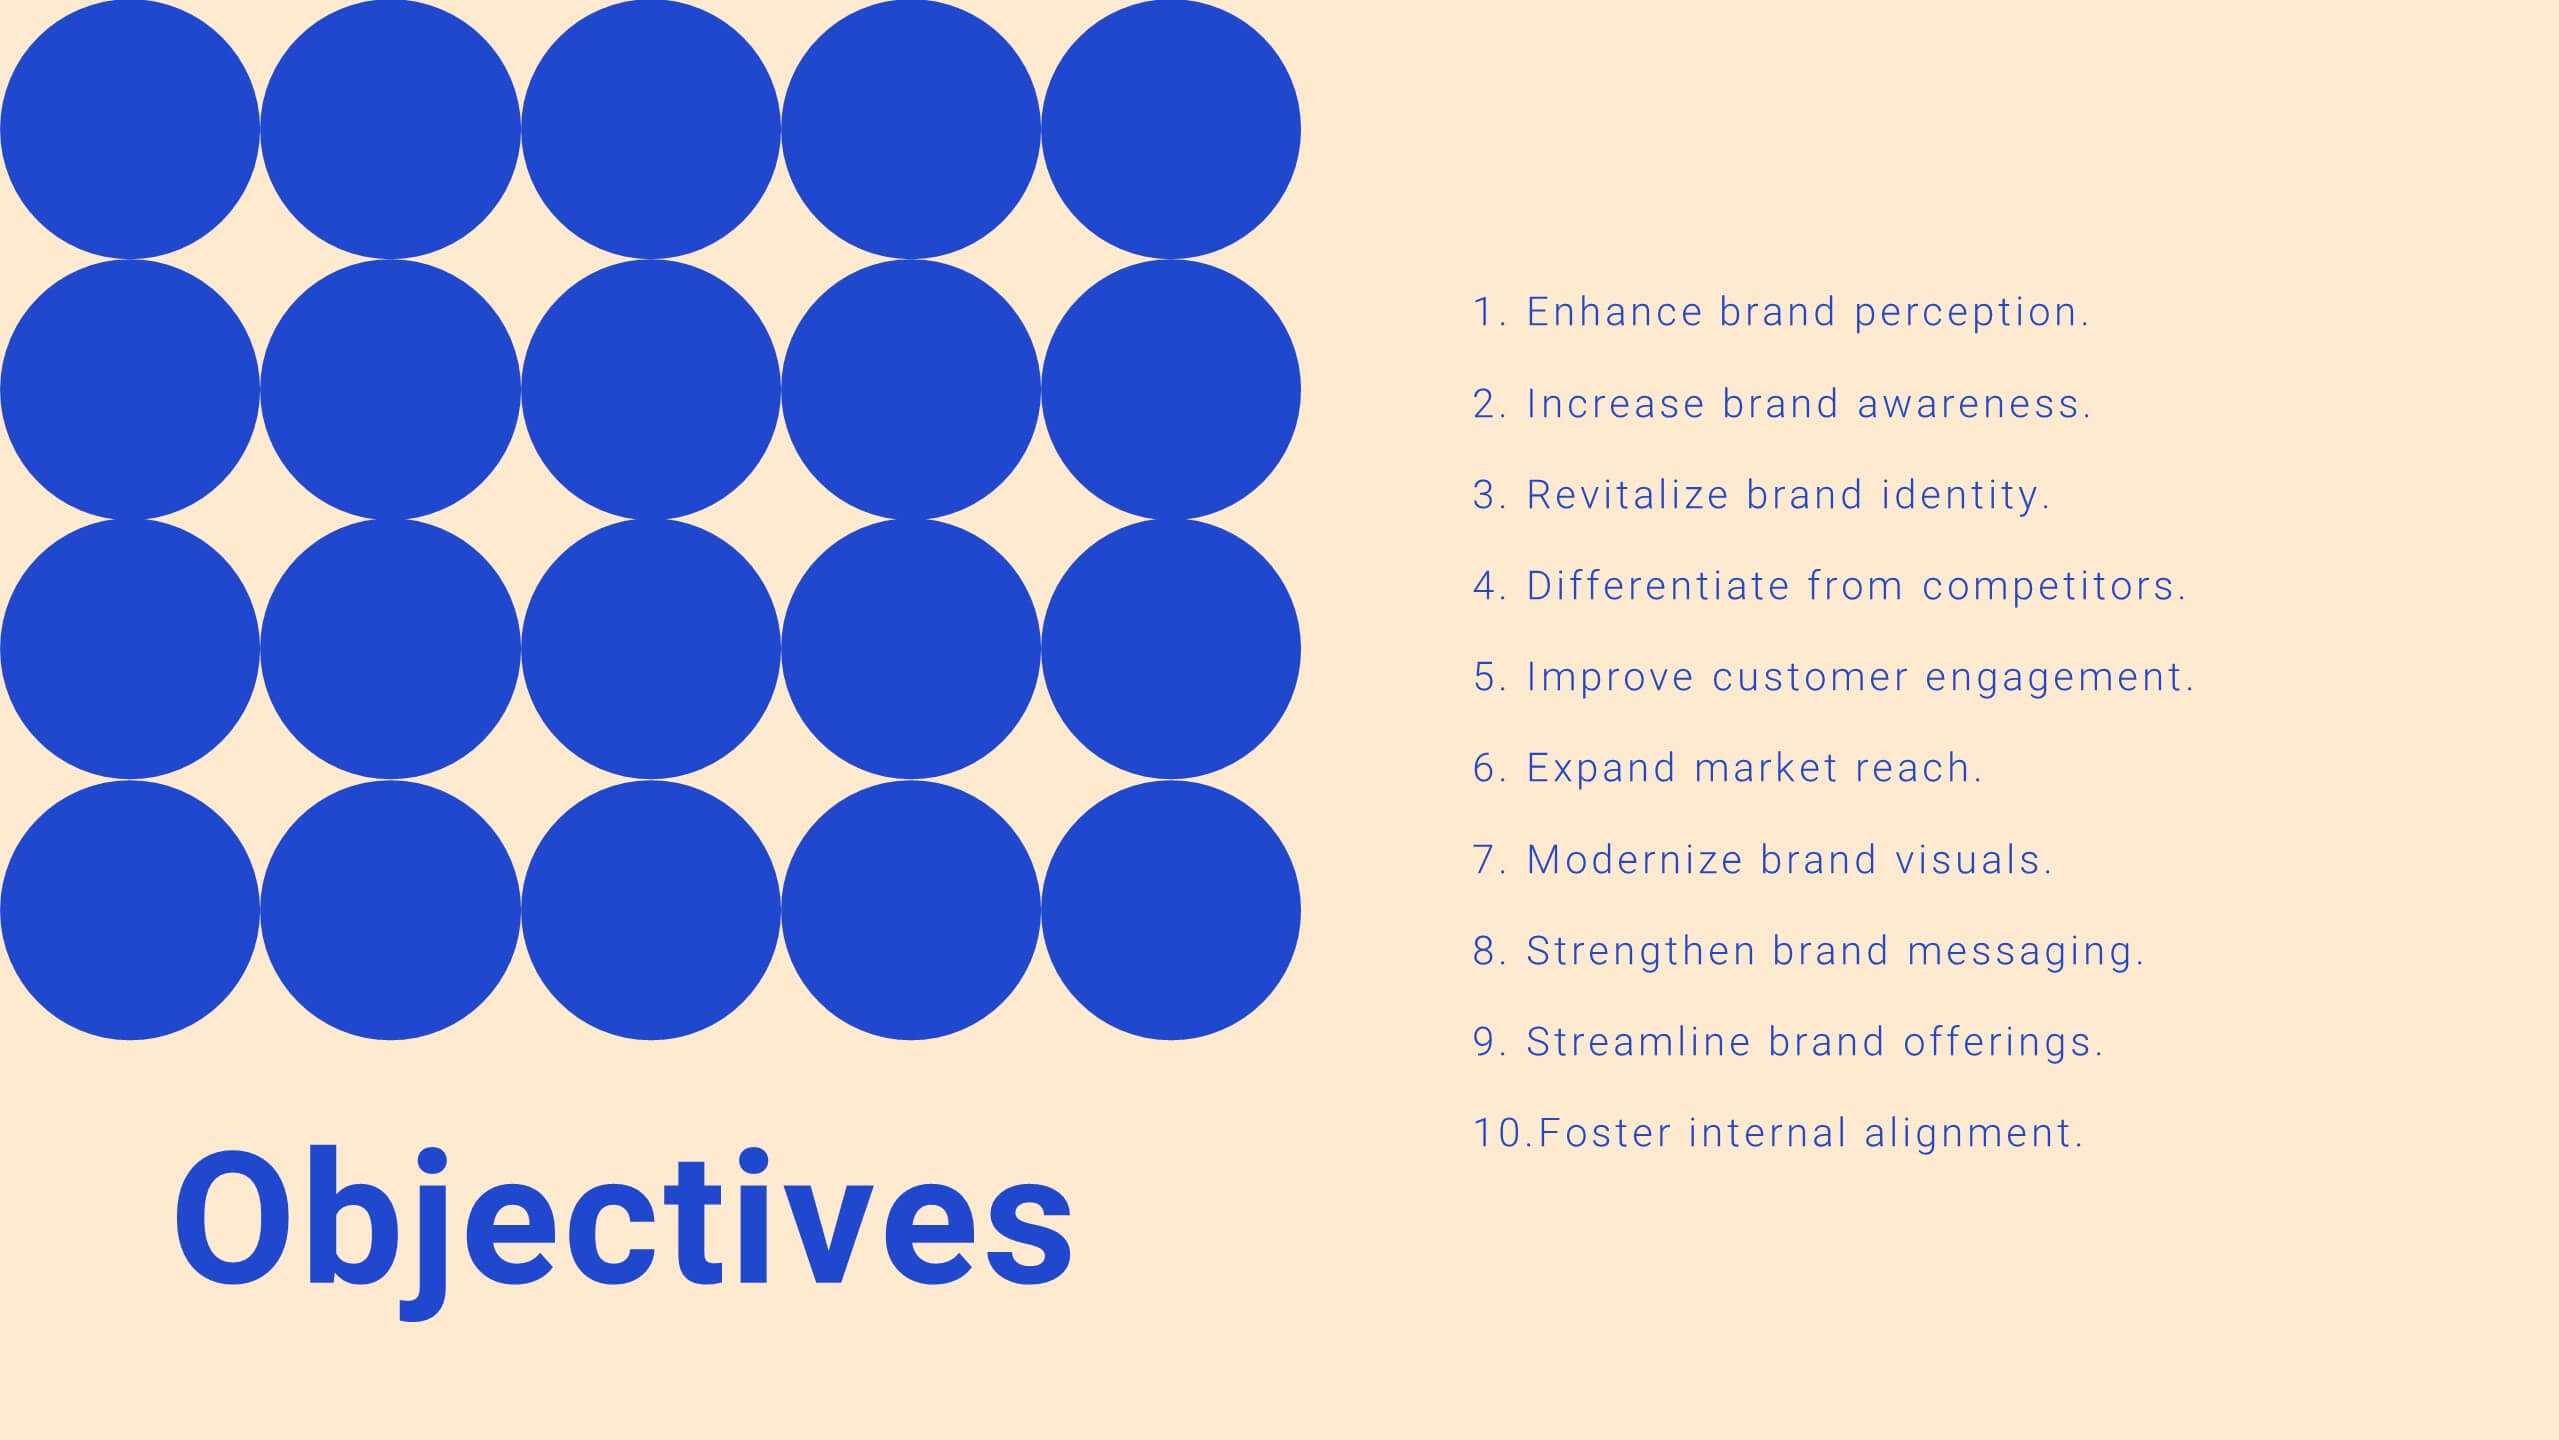
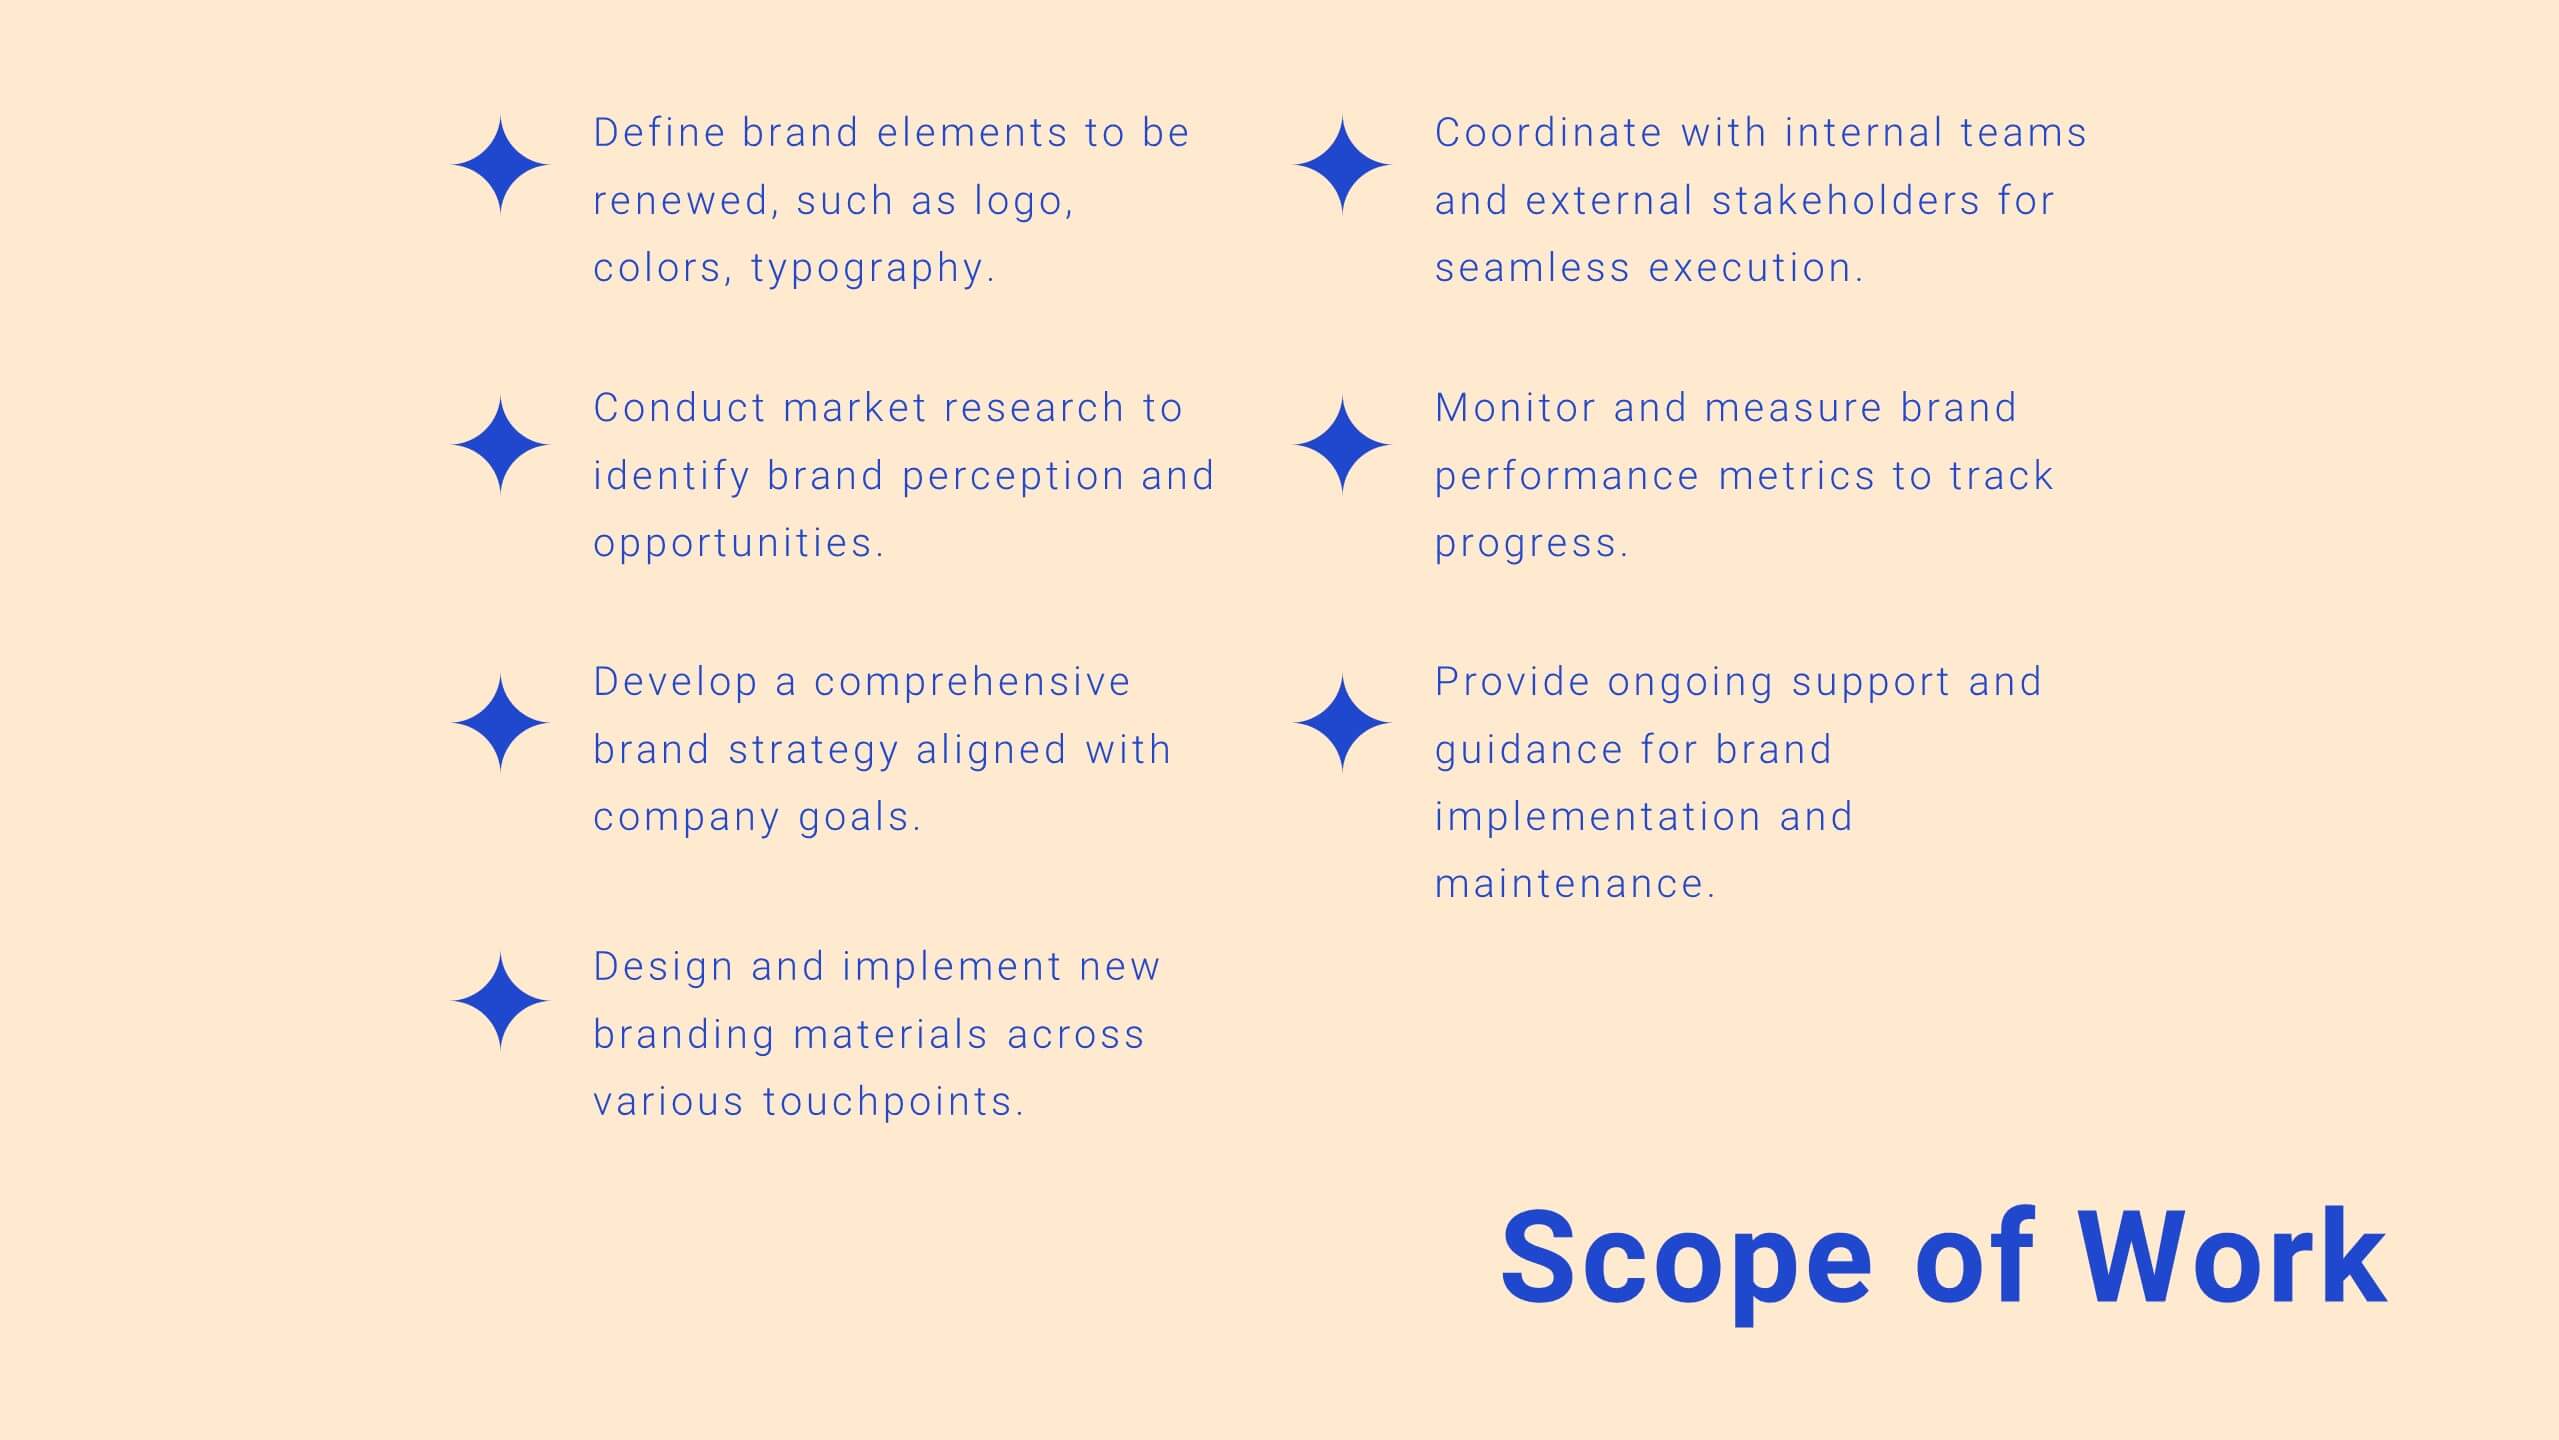
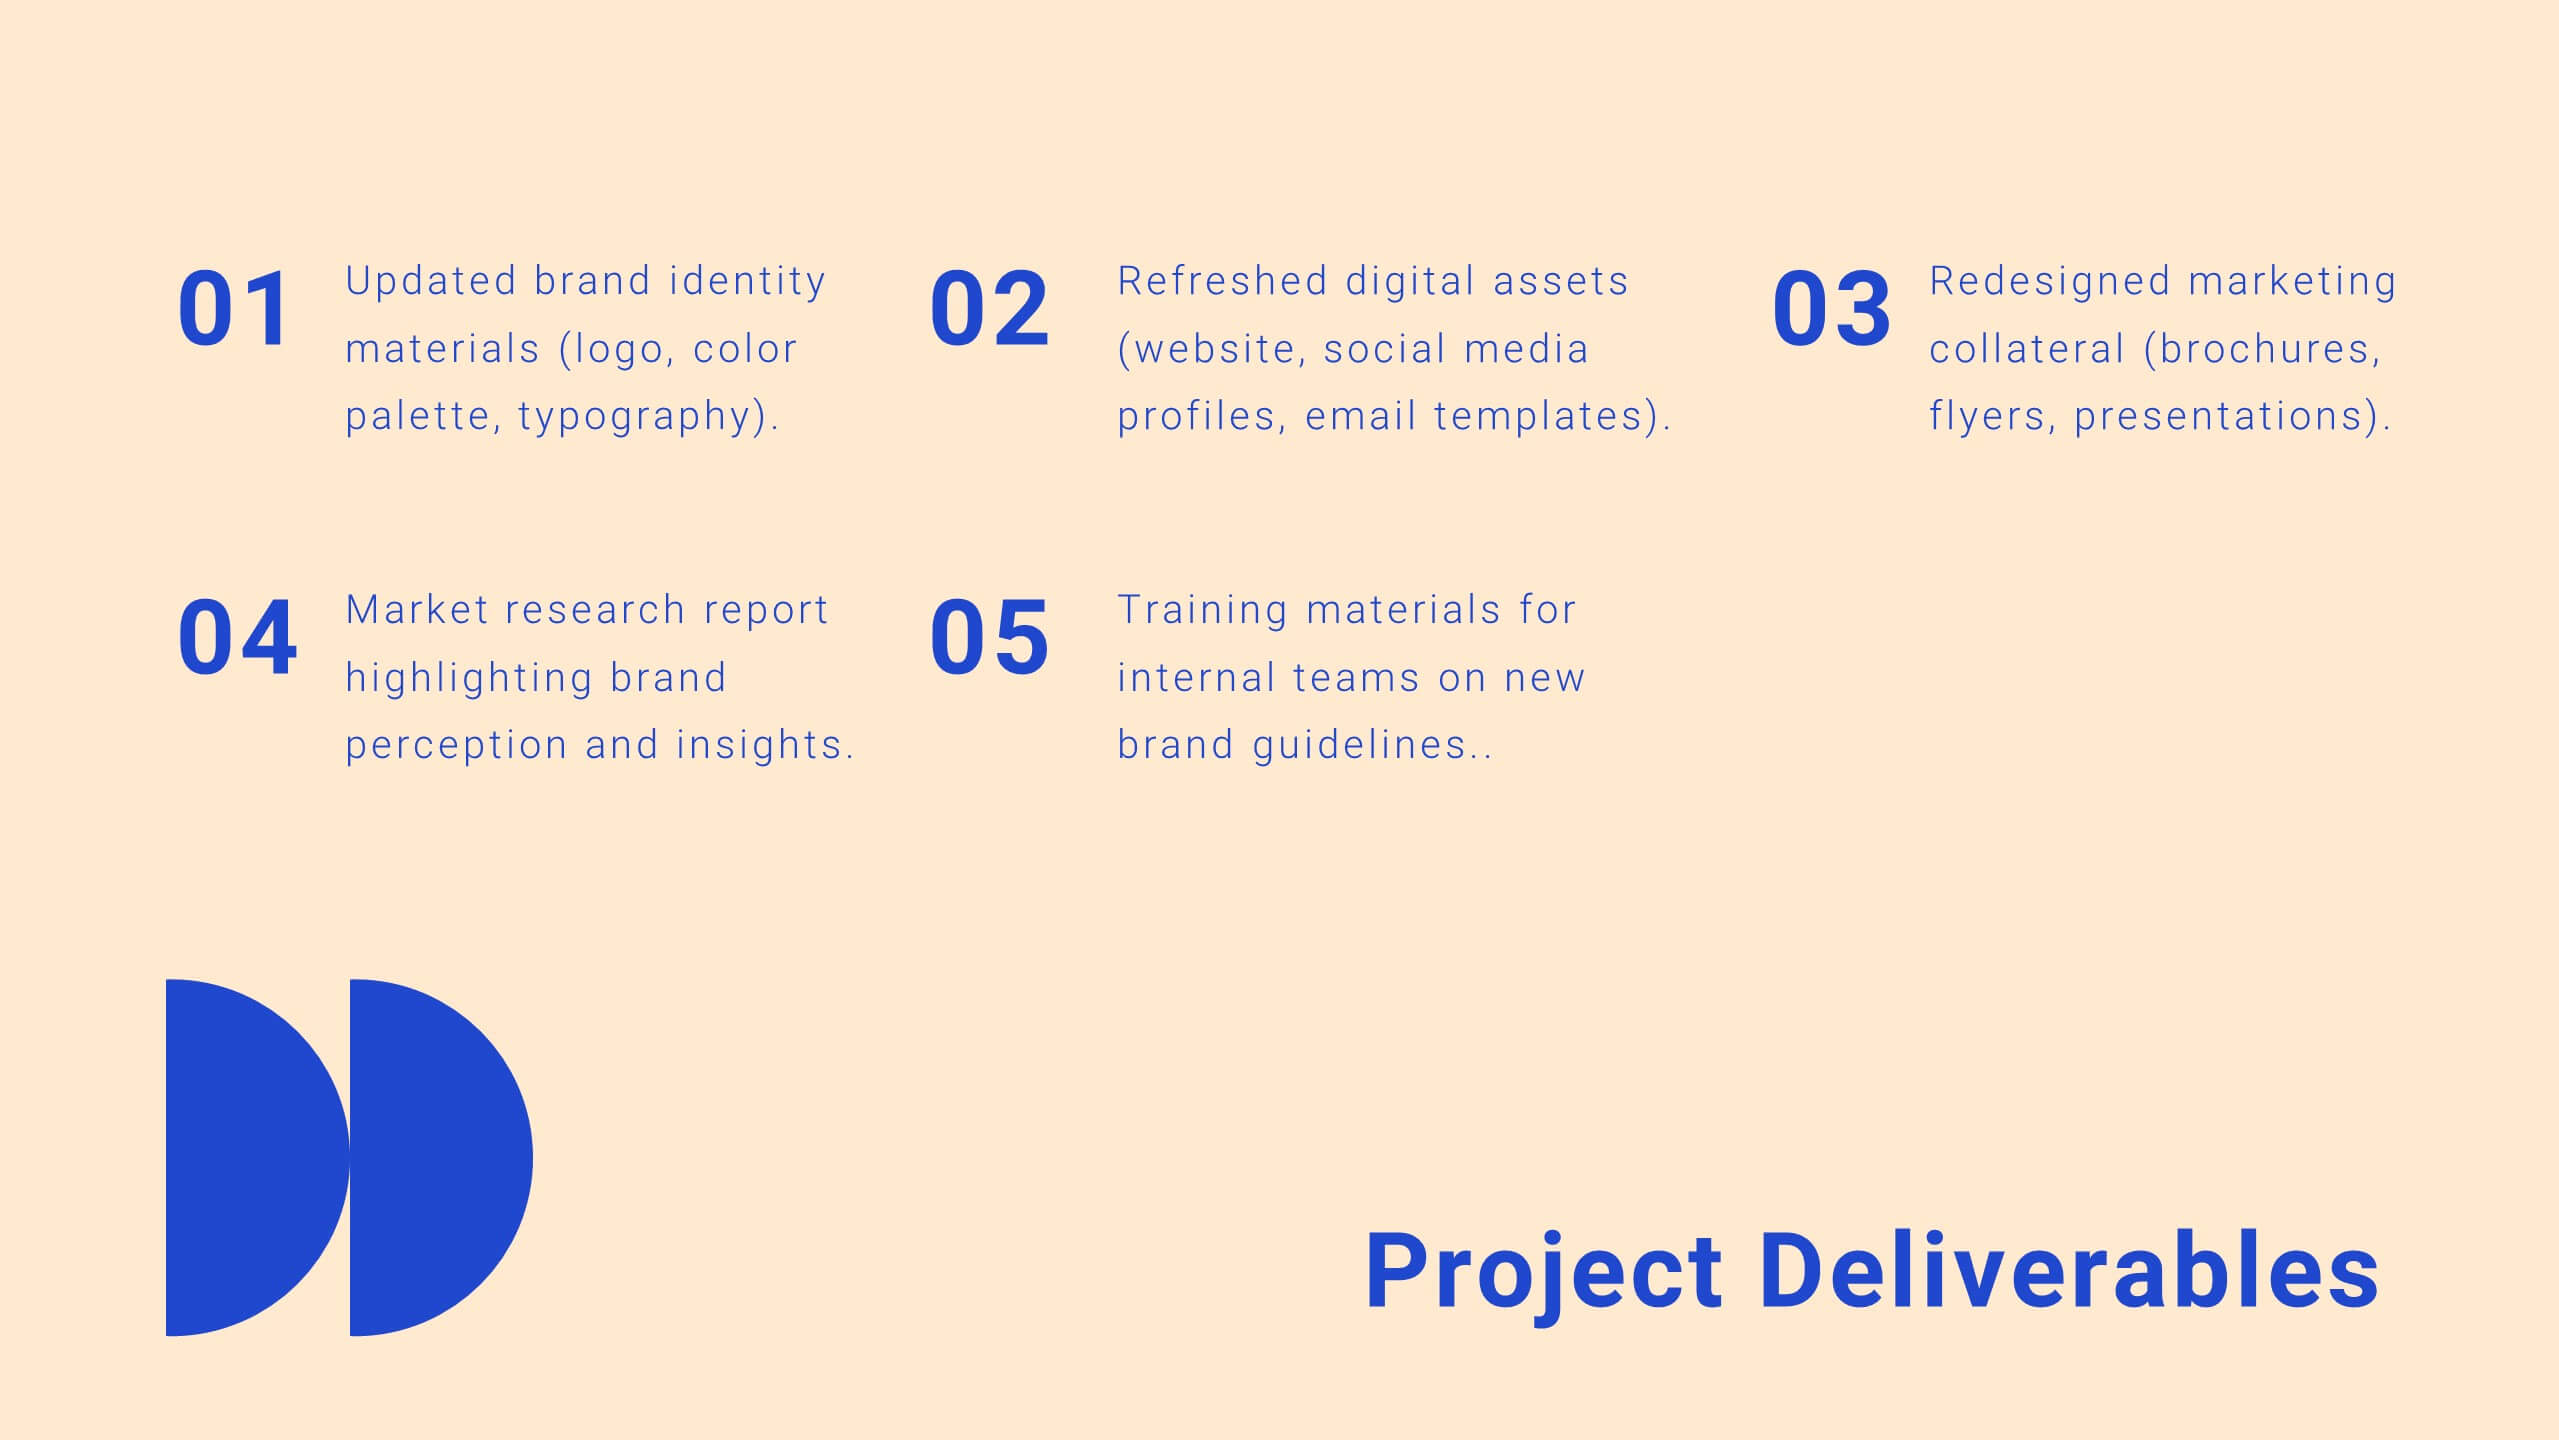
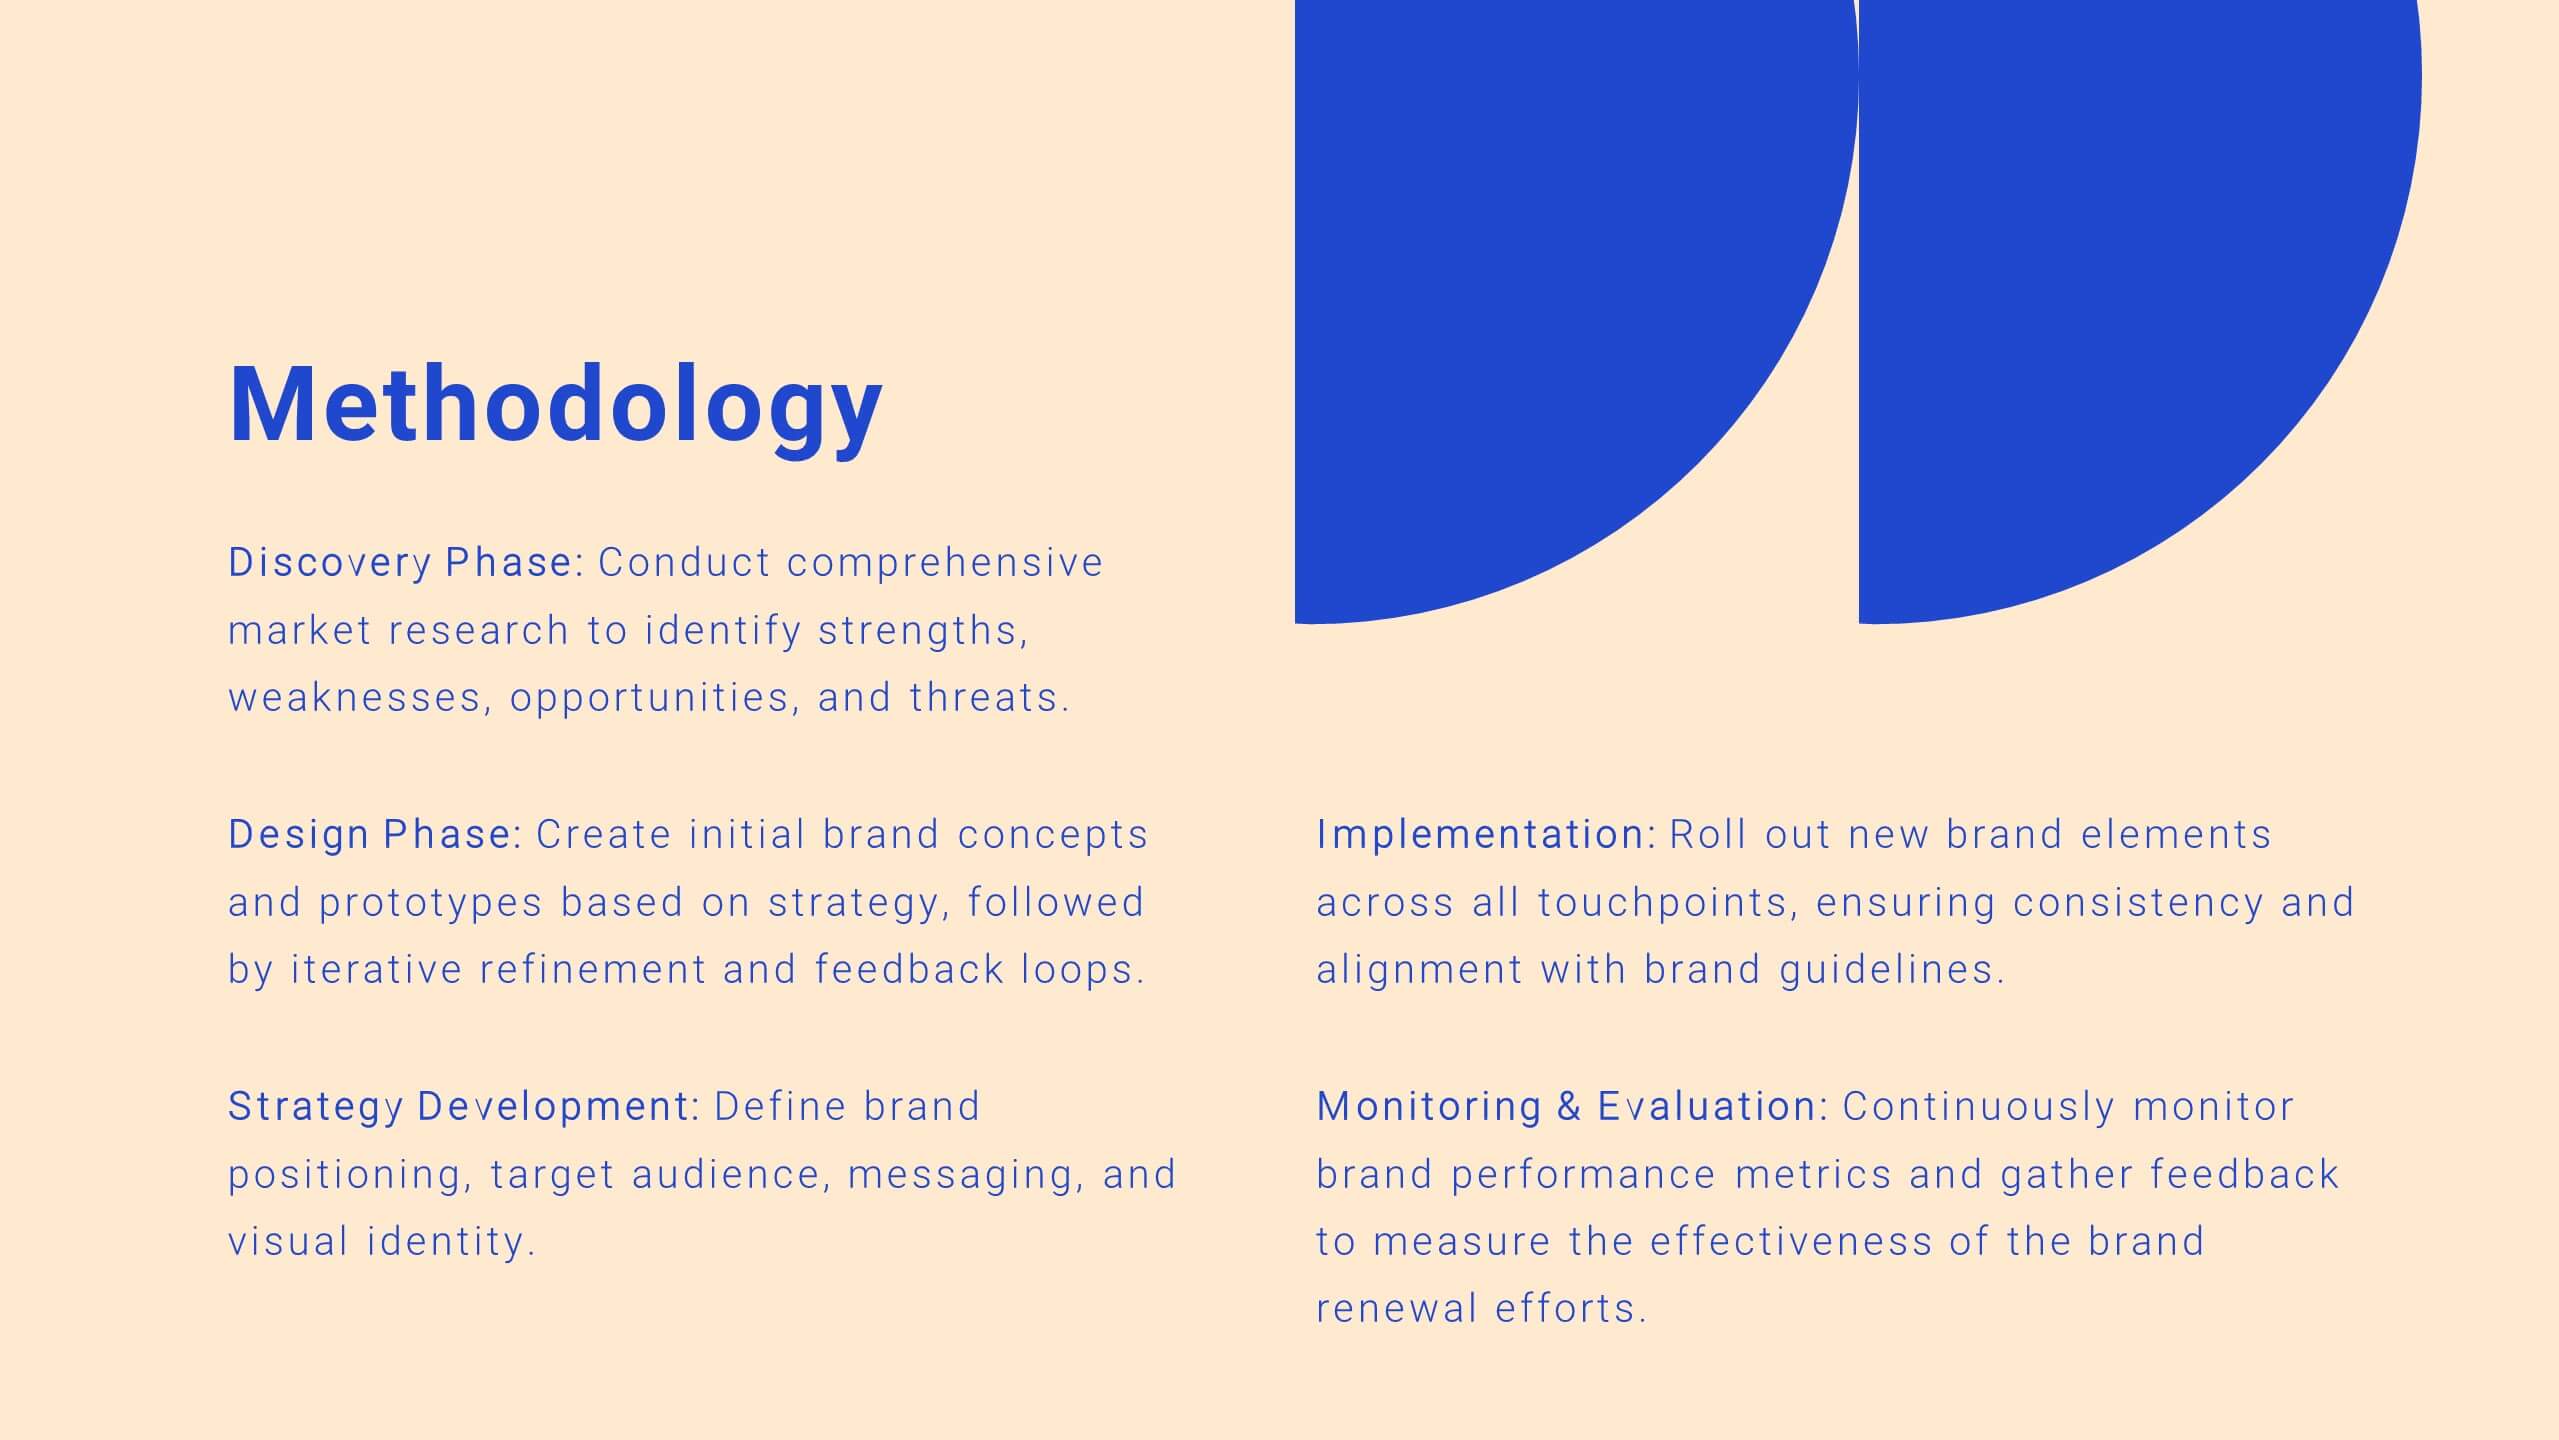
Take control of your projects with this comprehensive project plan template! From introductions to detailed objectives, this template covers scope of work, methodology, timelines, budget breakdowns, and risk management. Ideal for ensuring your project stays on track, it also includes stakeholder analysis and quality assurance plans. Compatible with PowerPoint, Keynote, and Google Slides.


6 slides
Create Challenge Infographic
Challenges are obstacles, difficulties, or problems that individuals, organizations, or societies face while trying to achieve their goals or navigate through various situations. This infographic template involves visually presenting a specific challenge, its context, and possible solutions in an informative way. Summarize the key takeaways from the infographic, emphasizing the importance of addressing the challenge and implementing the suggested solutions. An effective challenge infographic can be used for educational purposes, presentations, or as a reference guide to help individuals and teams overcome challenges in a structured and informed manner.


5 slides
Topic Web Mind Mapping
Visualize your ideas with clarity and structure using the Topic Web Mind Mapping Presentation. Perfect for brainstorming, educational planning, or strategic thinking, this layout helps you centralize a core concept and expand with five supporting branches. Customize easily in PowerPoint, Keynote, or Google Slides to fit any topic or audience.


7 slides
Problem Solution Infographic
The Problem Solution Infographic is a versatile template designed to clearly articulate challenges and corresponding strategies. It guides viewers through a sequence of problem identification to the implementation of solutions, offering a structured approach to problem-solving. This template is perfect for professionals who aim to present issues and their solutions in a logical, step-by-step manner. With its compatibility across PowerPoint, Google Slides, and Keynote, this tool is ideal for workshops, business meetings, academic environments, or any scenario where clear communication of problem-solving is required.


26 slides
Textures Company Profile Black Presentation
A company profile is a concise document that provides an overview of a business, its history, products or services, achievements, mission, vision, values, and other relevant information. This presentation template is designed for businesses to showcase their brand identity and services in an elegant and professional manner. With a dominant black color theme, this presentation exudes a sense of modernity and class, making it perfect for businesses in various industries. Introduce your company's history, mission, and values in a concise and compelling manner. Utilize the clean and clear typography to maintain a professional and sophisticated look.


6 slides
Editable Weekly Calendar Slide Presentation
Bring your week into focus with a vibrant layout that turns daily planning into something you actually look forward to. This presentation helps you outline tasks, deadlines, and priorities in a clear, color-coded structure perfect for productivity. Fully editable and compatible with PowerPoint, Keynote, and Google Slides.


13 slides
Simple Sales Proposal Presentation
This proposal template provides a streamlined approach for presenting sales strategies and solutions. Starting with a visually striking cover slide, it sets the scene for an engaging pitch. The template meticulously organizes content from the initial problem identification to the presentation of real numbers that underscore the proposal's validity. Each section, from the elucidation of the problem to the detailed solutions and real-world case studies, is laid out for maximum impact and understanding. Personable touches are incorporated through the 'Meet Our Team' segment, bolstering the proposal with credibility. The template culminates with a strong call to action, urging the audience to seize the collaborative opportunity, and is rounded off with a polite 'Thank You' to leave a lasting impression. This template is a boon for sales professionals seeking to communicate their value proposition with clarity and persuasiveness.


6 slides
Change Management Process Infographic
Change management is a structured approach used by organizations to transition from their current state to a desired future state. This infographic template is designed to showcase the steps and components involved in managing organizational changes effectively. This template helps viewers understand the process and key elements required for successful change management. This informative infographic can be shared with employees, managers, or students to provide a clear understanding of the steps and strategies involved in successfully implementing organizational changes. Compatible with Powerpoint, Keynote, and Google Slides.