


Features
- 4 Unique slides
- Fully editable and easy to edit in Microsoft Powerpoint, Keynote and Google Slides
- 16:9 widescreen layout
- Clean and professional designs
- Export to JPG, PDF or send by email


Do you have any questions?
Recommend


5 slides
Oceania Business Opportunities Map Presentation
Unlock growth potential with the Oceania Business Opportunities Map template, crafted to showcase key investment zones and emerging markets across the region. Utilize interactive mapping tools to analyze market viability and sector-specific opportunities effectively. Ideal for businesses looking to expand in Oceania. Compatible with PowerPoint, Keynote, and Google Slides.


7 slides
Personal SWOT Infographic
Evaluate your individual potential with our personal SWOT infographic. Set against a clean white backdrop, and punctuated with optimistic yellow, intuitive blue, and assertive red, this template meticulously breaks down strengths, weaknesses, opportunities, and threats on a personal level. Adorned with concise infographics, suggestive icons, and adaptable image placeholders, it offers a panoramic introspection into personal growth avenues. Flawlessly designed for Powerpoint, Keynote, or Google Slides. An invaluable asset for career counselors, personal coaches, individuals looking for self-improvement, or anyone aiming for personal development.


7 slides
Time Management Goal Infographic
Time management is the process of organizing and planning how to divide your time between specific activities effectively and efficiently to achieve desired goals or outcomes. This infographic template is designed to empower you in mastering time, optimizing productivity, and seizing the day. This infographic provides a visually striking way to illustrate time management strategies, tips, and hacks for anyone looking to make the most of their time. Fully customizable and compatible with Powerpoint, Keynote, and Google Slides. This showcases time-bound tasks, emphasizing the importance of setting deadlines and managing tasks within periods.


5 slides
SWOT Analysis Framework Presentation
The "SWOT Analysis Framework Presentation" template is strategically designed to help businesses and teams visually map out their Strengths, Weaknesses, Opportunities, and Threats. Each quadrant of the SWOT analysis is distinctly colored to facilitate quick recognition and understanding, enabling teams to efficiently analyze their internal and external environments. This template is versatile, suitable for a variety of industries and settings, from corporate strategic planning sessions to educational business courses. It aids in clearly identifying key factors that could influence future business decisions and strategies, making it an essential tool for any organization aiming to enhance its strategic planning process.


6 slides
Target Market Analysis Infographics
Present your target market analysis with our vibrant and professional infographic template. Tailored for PowerPoint, Keynote, and Google Slides, this template is an ideal choice for marketers, business analysts, and entrepreneurs who aim to communicate their market insights effectively. The design of this template is focused on showcasing market demographics, consumer behaviors, and segmentation in a visually compelling manner. Its modern layout and vibrant color scheme are crafted to capture attention while maintaining a professional tone. This makes it perfect for presentations that need to convey complex market data in an understandable and engaging way. What sets this template apart is its versatility and ease of use. It allows you to highlight key aspects of your target market analysis, from demographic breakdowns to consumer preferences. Whether you're presenting to stakeholders, team members, or at a conference, this infographic template will help you deliver your message with impact and clarity.


5 slides
Cross-Functional Team Collaboration Presentation
Visualize multi-department synergy with the Cross-Functional Team Collaboration Presentation. Ideal for mapping collaborative structures, workflows, or project roles across divisions. This layout emphasizes alignment and cooperation between teams. Easily customizable in PowerPoint, Keynote, and Google Slides—perfect for strategy sessions, management briefings, or team onboarding presentations.


6 slides
Creative Process Infographic
The Creative Process Infographic offers a visually engaging and systematic approach to outlining the steps of a successful project or strategy. This template beautifully segments the process into distinct, color-coded stages, making it ideal for presentations, workshops, or educational materials that aim to simplify and illustrate the progression from concept to completion. Each section is clearly defined, providing a structured pathway that can be customized to detail specific tasks, checkpoints, or goals. This infographic is versatile and fully editable, suitable for Powerpoint, Google Slides, and Keynote, ensuring that it can be adapted to a wide range of topics and audiences.


10 slides
Data-Driven Feedback Analysis Presentation
Gain deep insights into your business performance with the Data-Driven Feedback Analysis infographic. This dynamic visual presentation helps you track key metrics, analyze trends, and present findings with clarity. Fully customizable and compatible with PowerPoint, Keynote, and Google Slides.


4 slides
Feature Comparison Using Harvey Balls Presentation
Easily visualize performance levels with the Feature Comparison Using Harvey Balls Presentation. This slide is perfect for showing side-by-side comparisons across multiple categories, using universally understood Harvey Ball icons to represent completeness or satisfaction. Ideal for product evaluations, vendor selections, or strategic reviews. Fully editable in PowerPoint, Keynote, and Google Slides.


6 slides
Defined Company Objectives Breakdown
Break down your company’s key priorities using this Defined Company Objectives slide. Featuring upward-pointing arrows from a central base, it visually maps out strategic goals in a clear, directional format. Fully customizable in PowerPoint, Keynote, and Google Slides.


7 slides
Solutions to Problems Infographic
These slides are designed to outline and explore solutions to identified problems in a clear and effective manner. Each slide uses a clean layout with a consistent color theme that enhances readability and focus. They effectively combine text and graphical elements to showcase problem-solving strategies, making the slides ideal for business presentations or strategic meetings. The inclusion of icons and diagrams aids in visualizing the problem-solving process, and the structured design ensures that the information is presented in a logical sequence. This approach not only aids in communicating the solutions effectively but also engages the audience by making complex information easier to understand. These templates can be adapted for various industries and scenarios, where clear communication of problem-solving steps is crucial. They are especially useful for team discussions, stakeholder presentations, and strategic planning sessions.


6 slides
Corporate Performance Annual Report
Present key business metrics with precision using this Corporate Performance Annual Report slide. Designed with progress bars and intuitive icons, this layout clearly communicates departmental or project-based performance. Ideal for year-end reviews, board meetings, and investor updates. Fully editable in PowerPoint, Keynote, and Google Slides.


26 slides
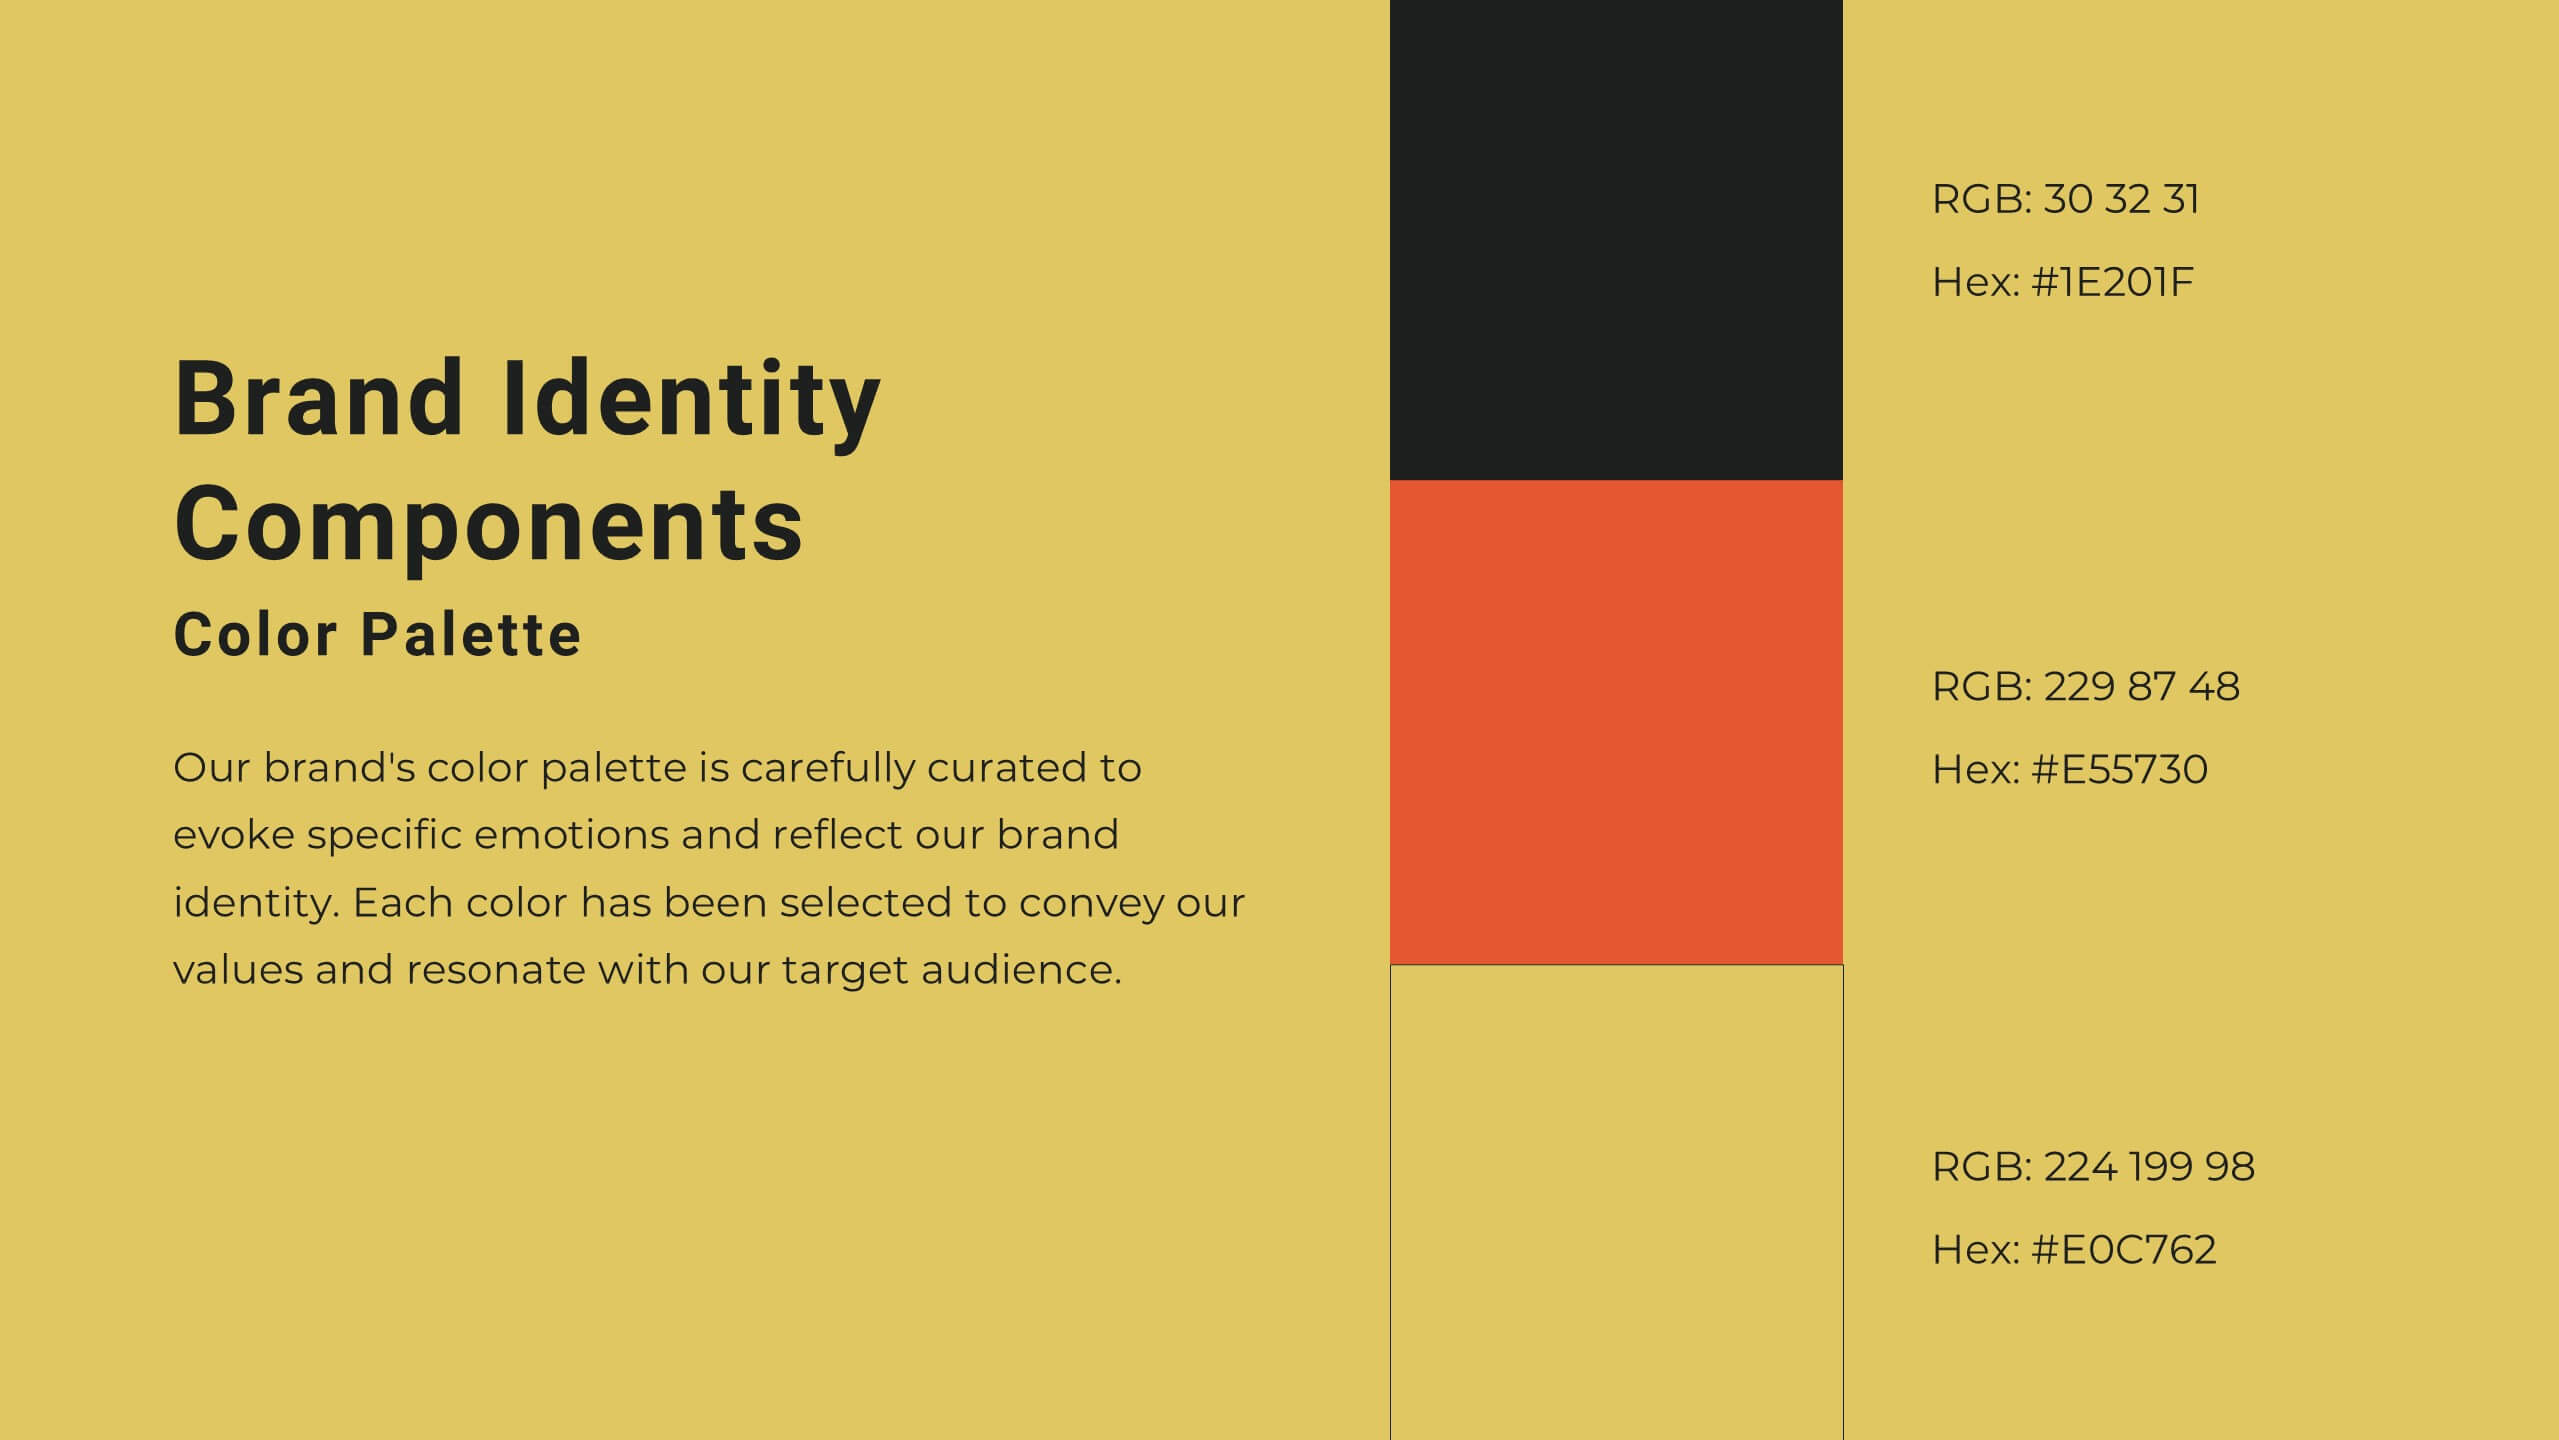
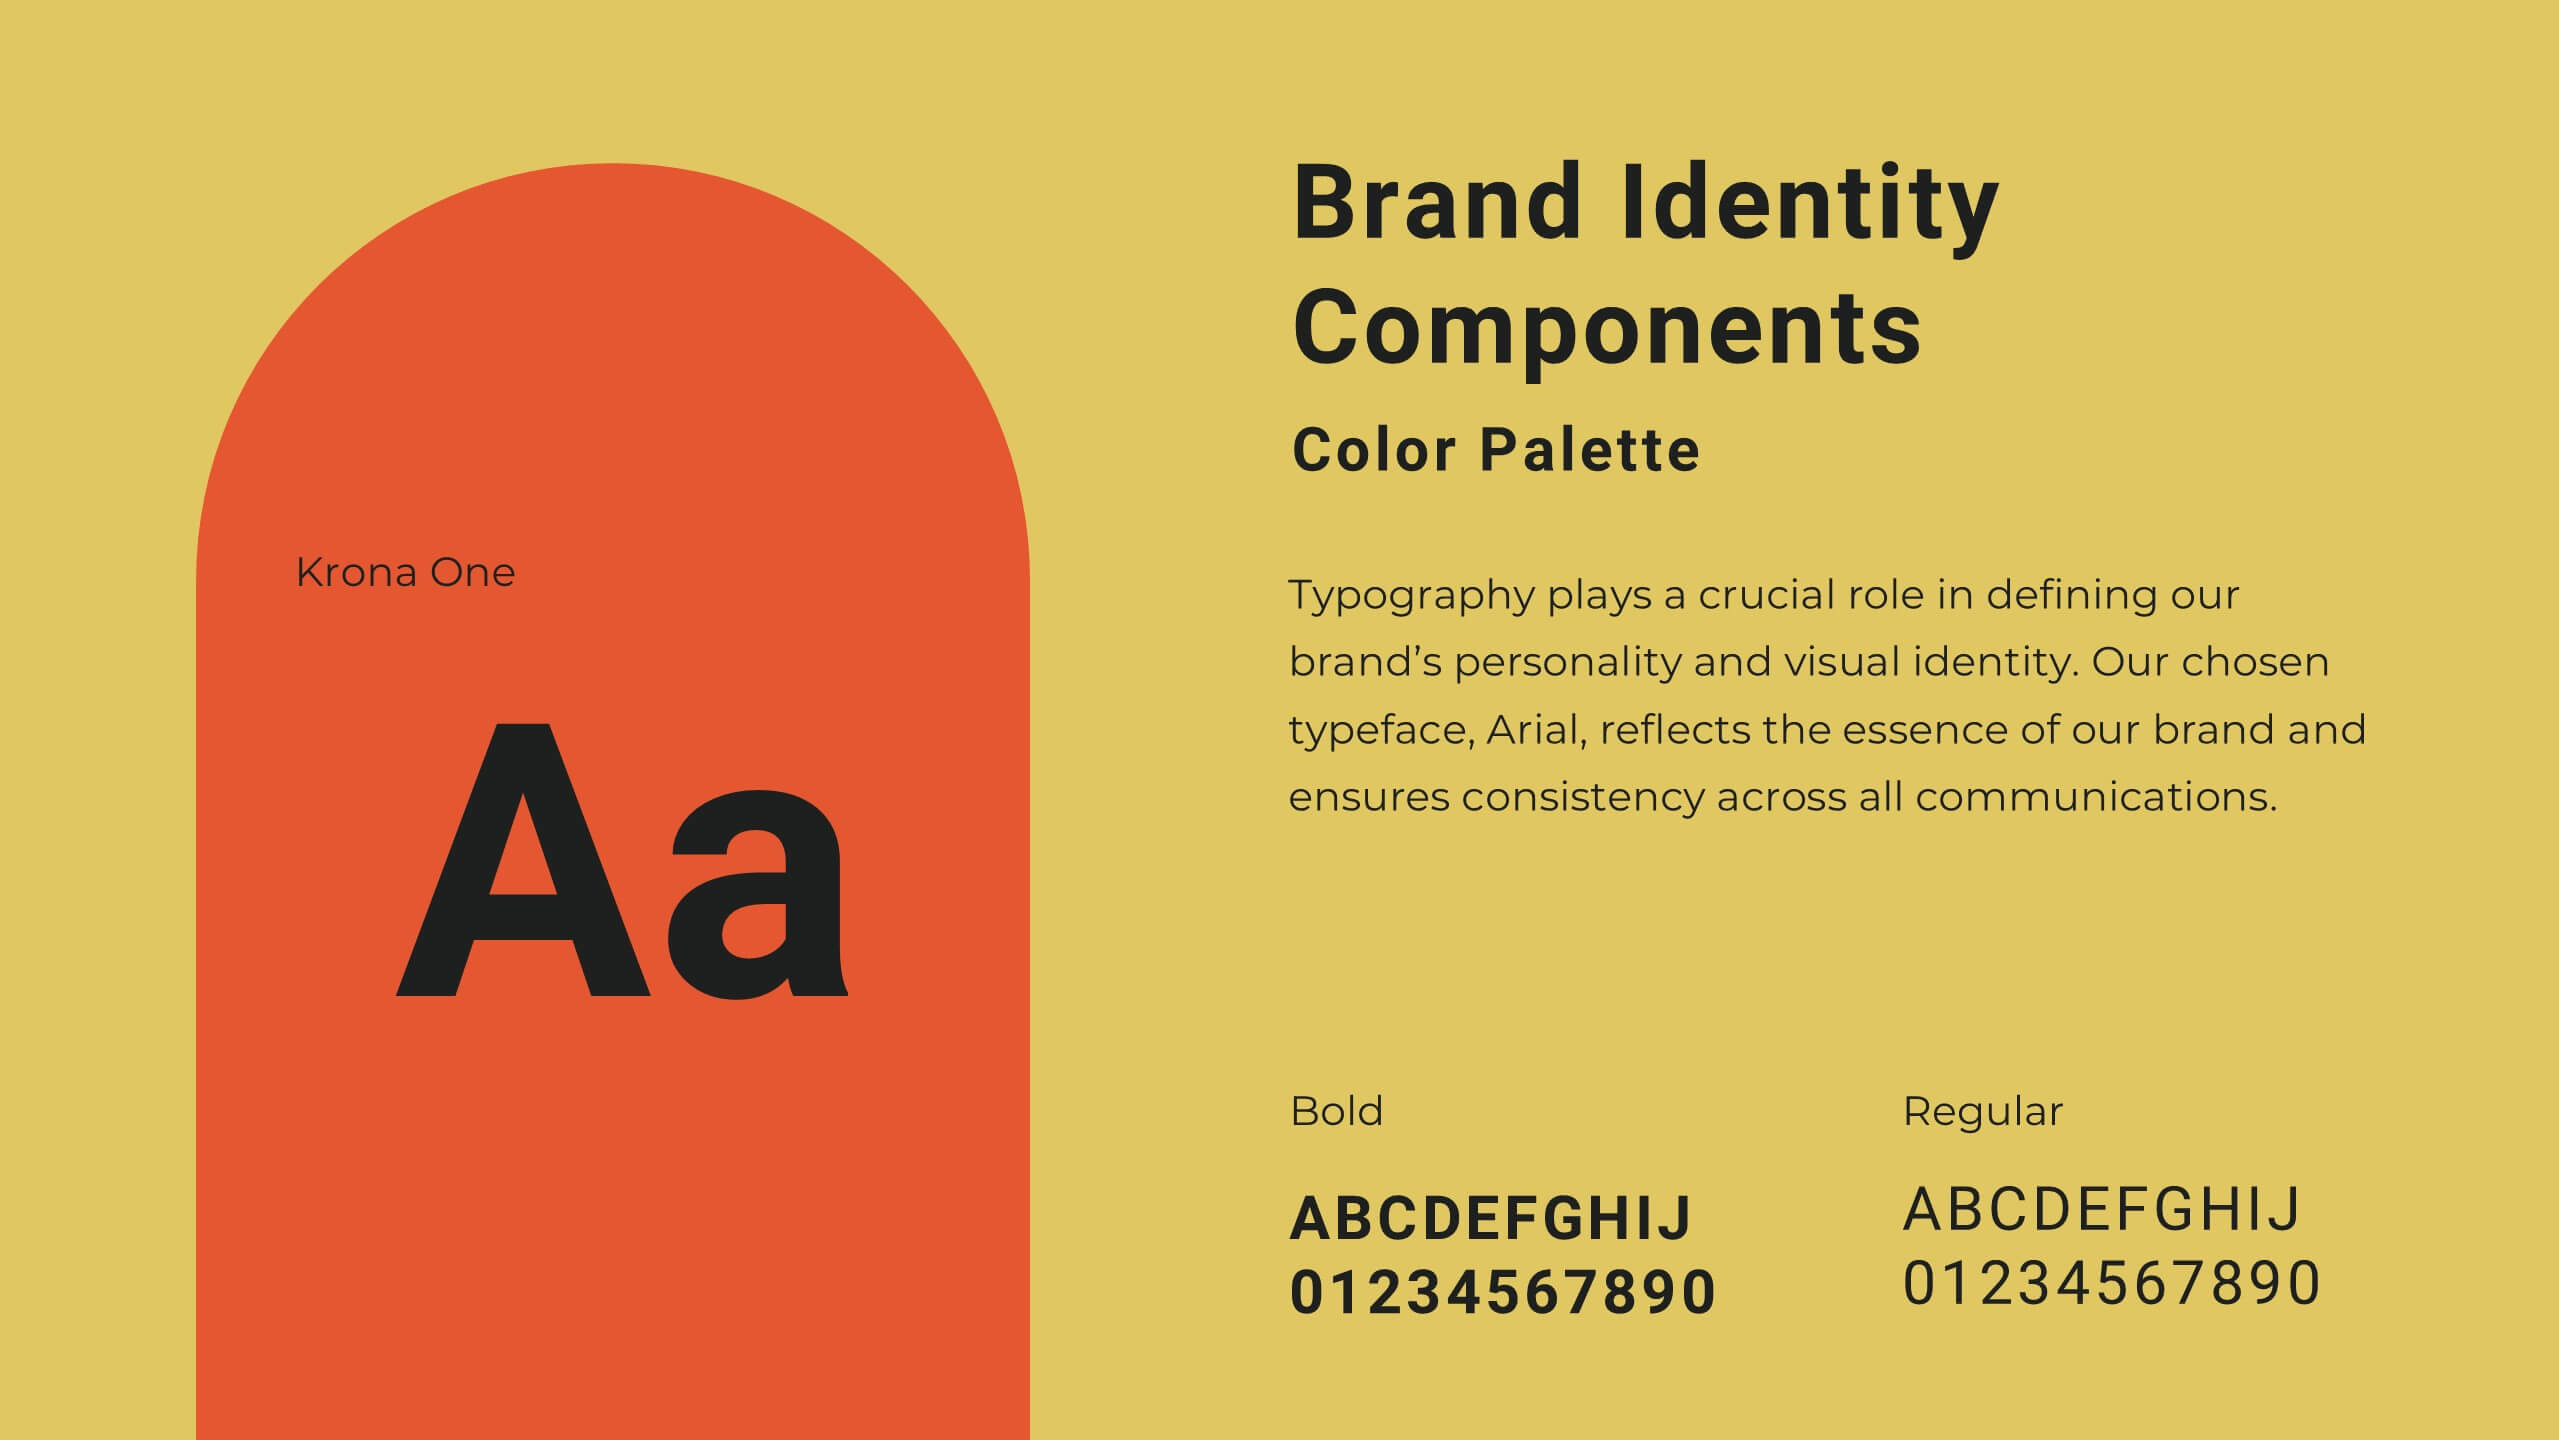
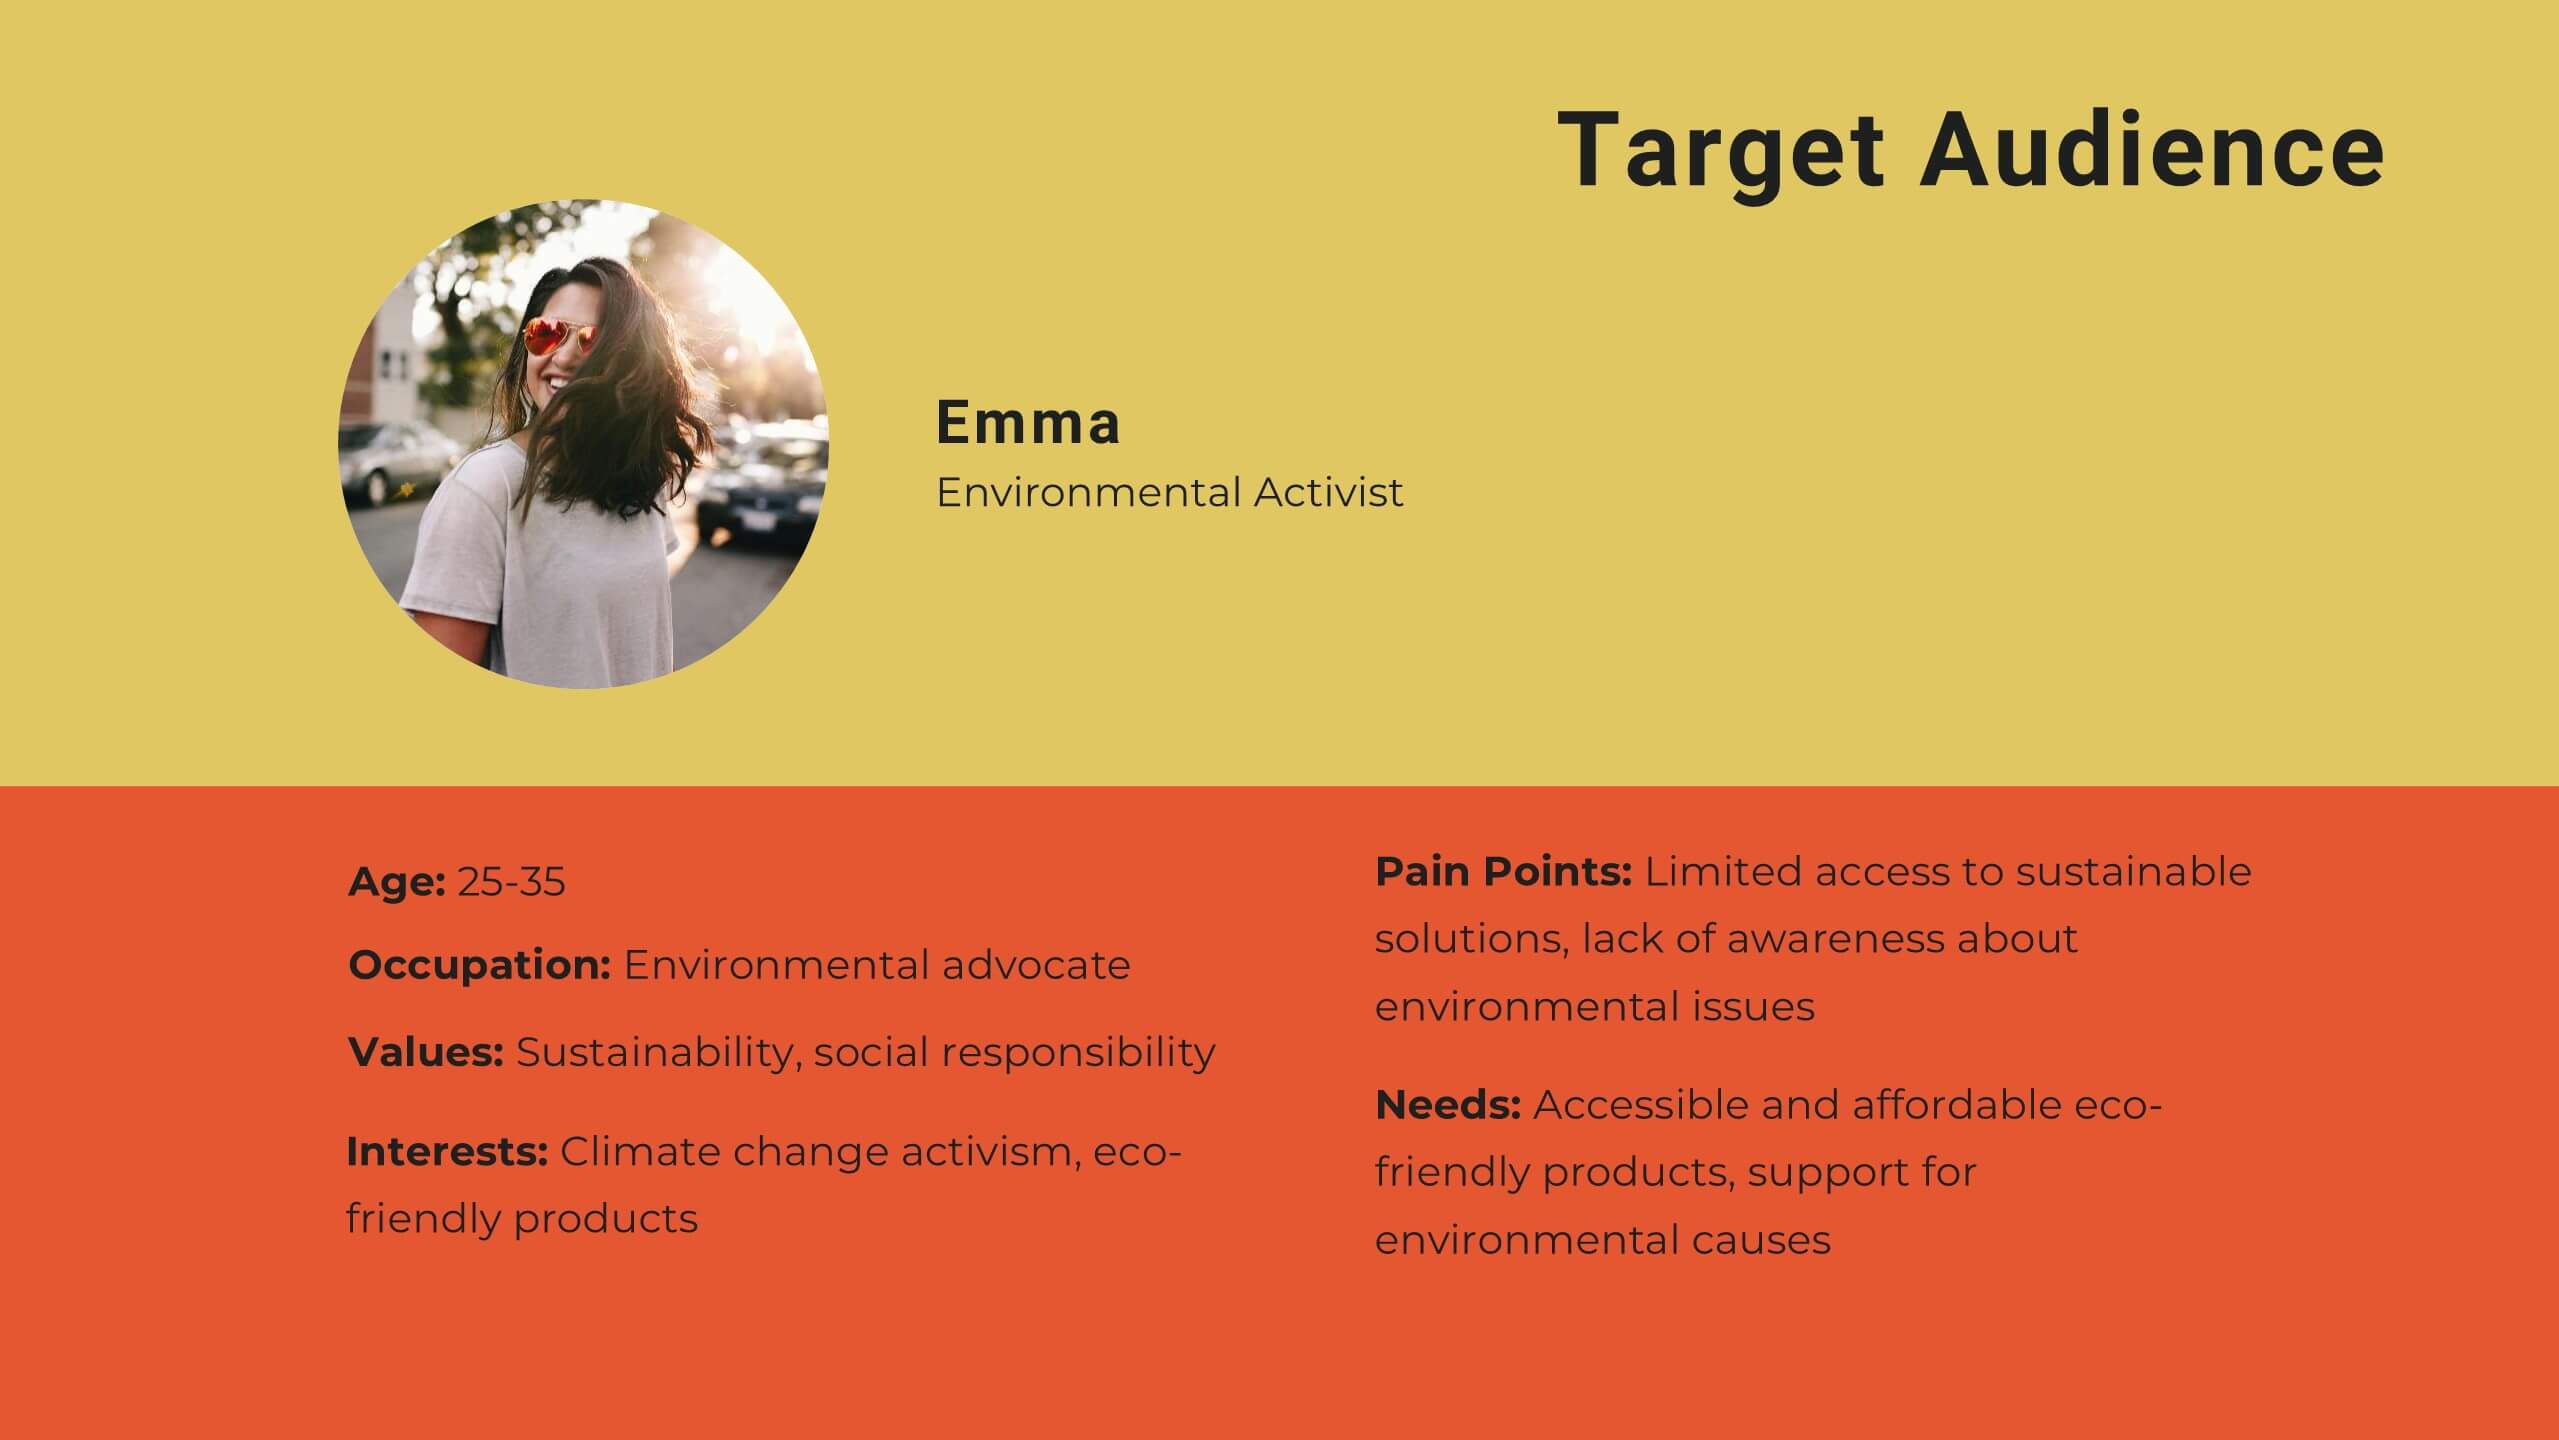
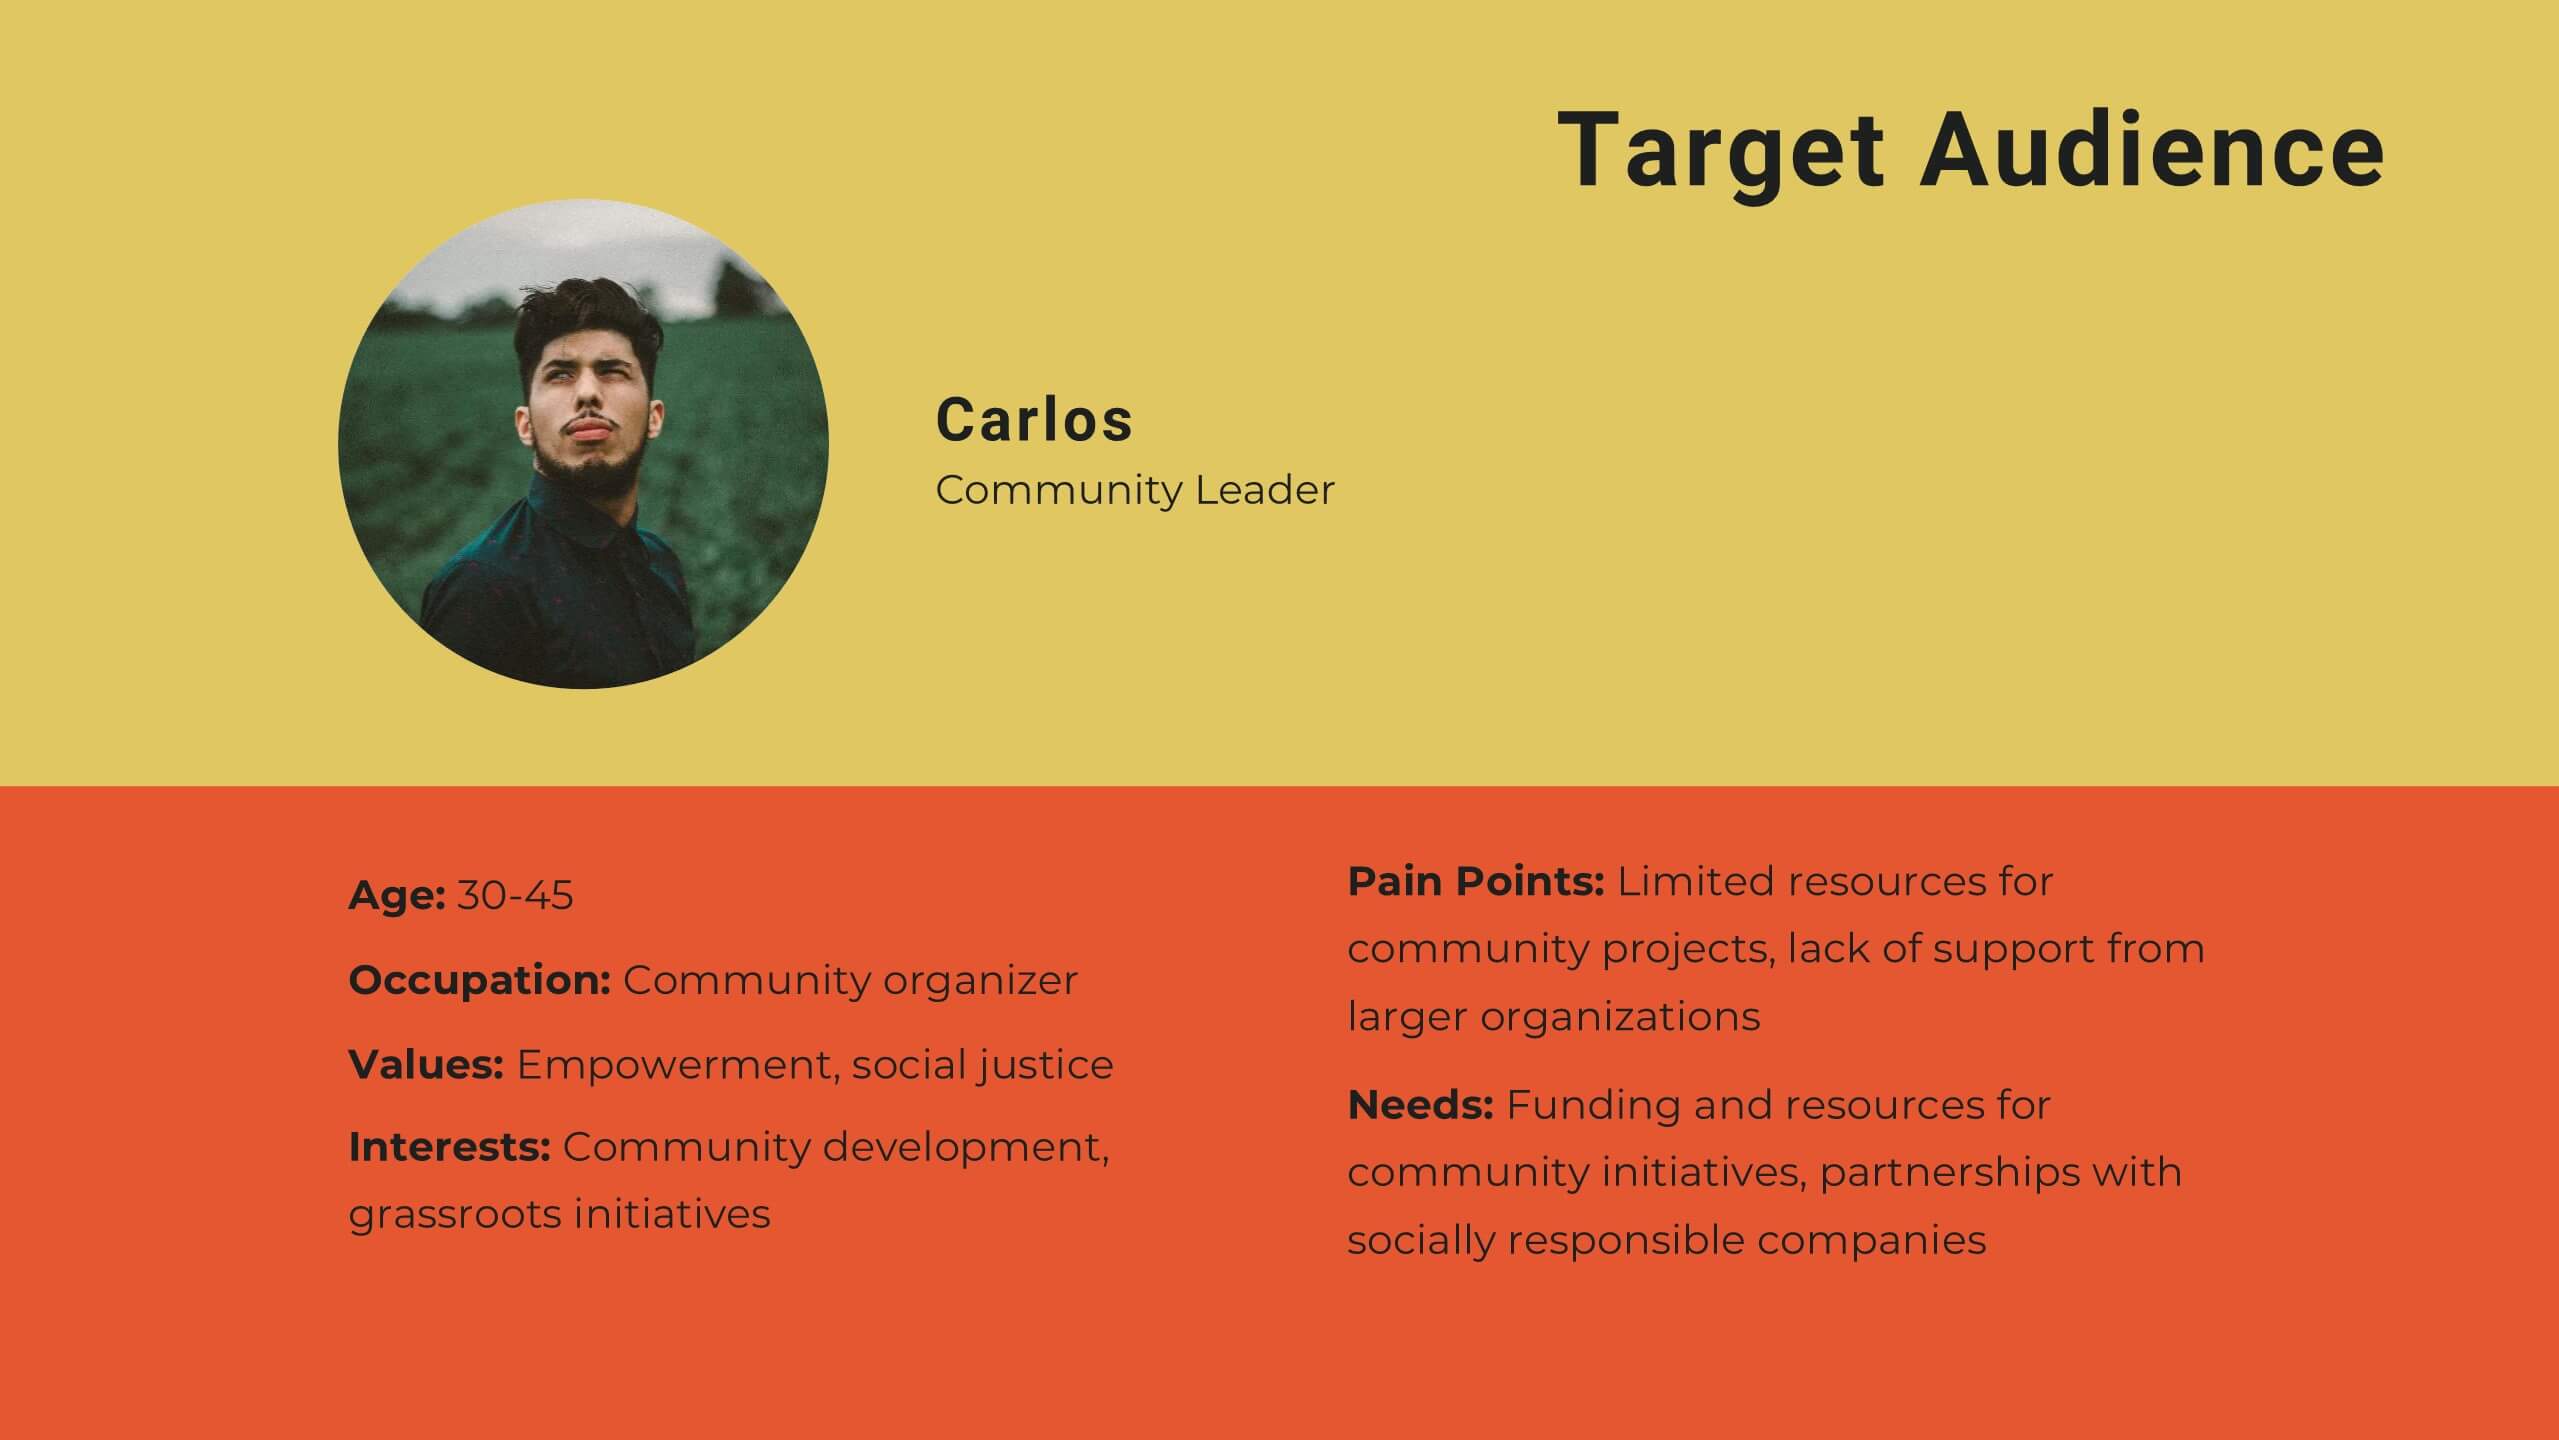
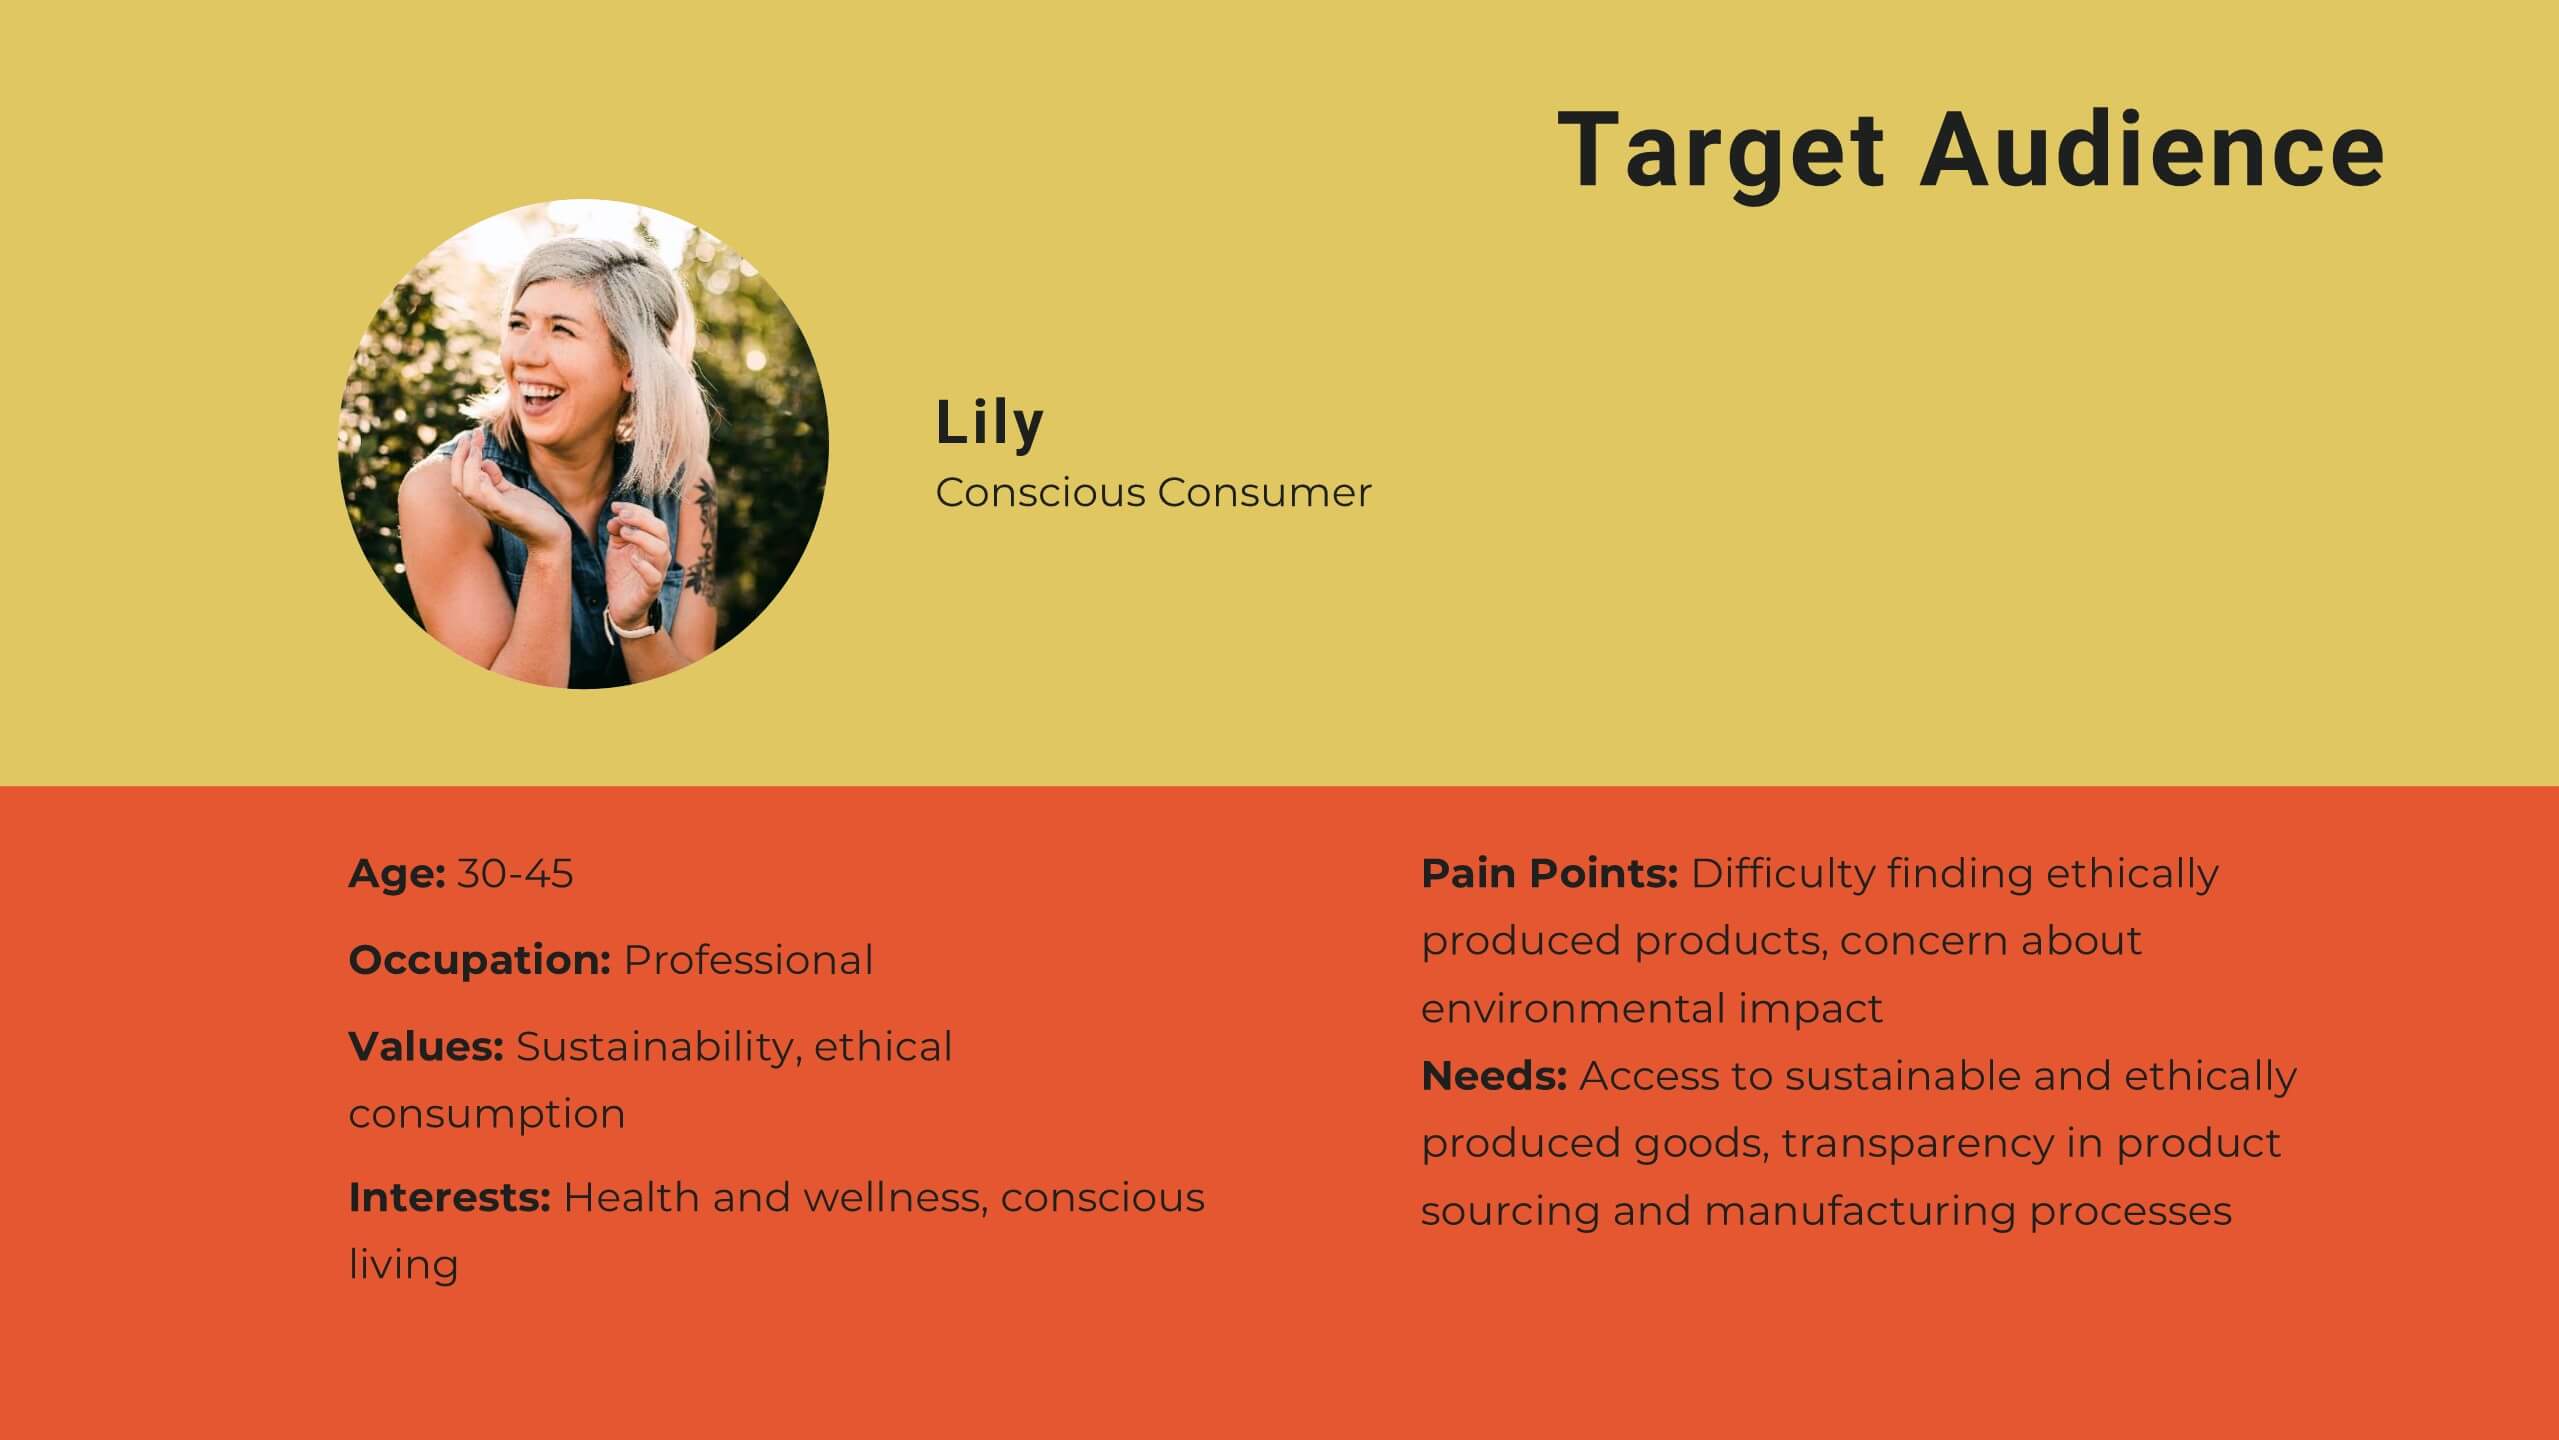
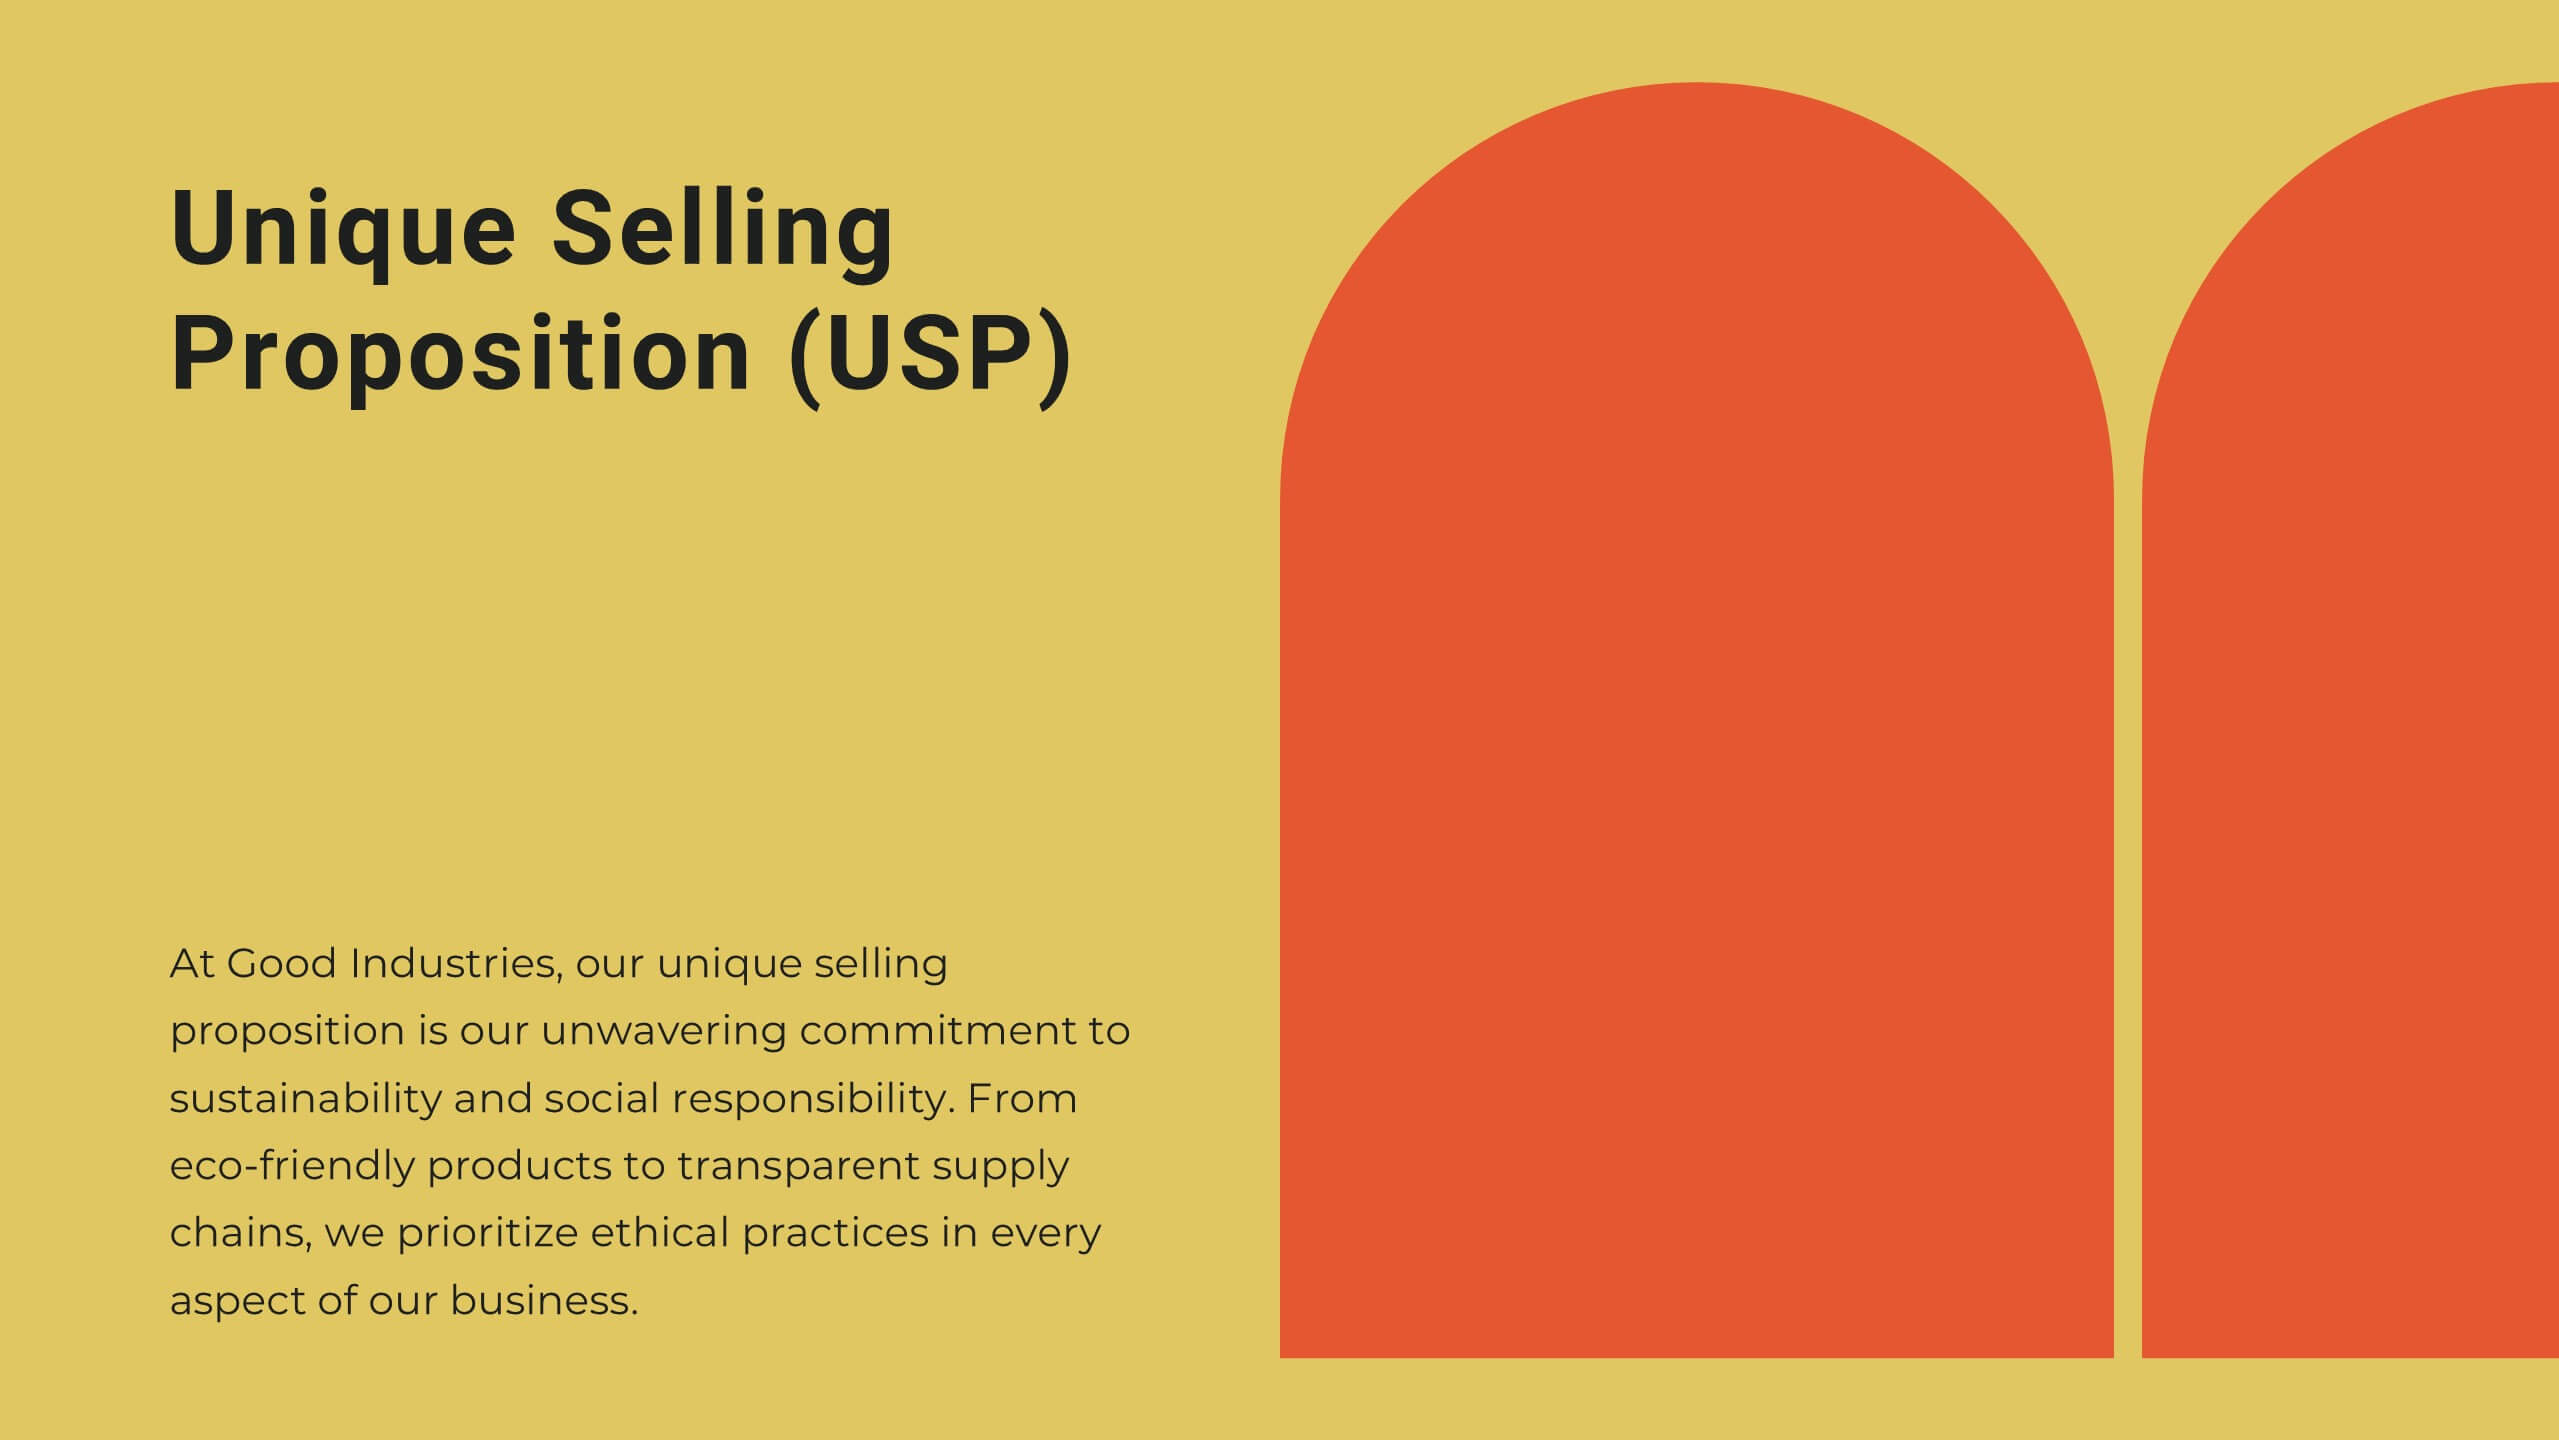
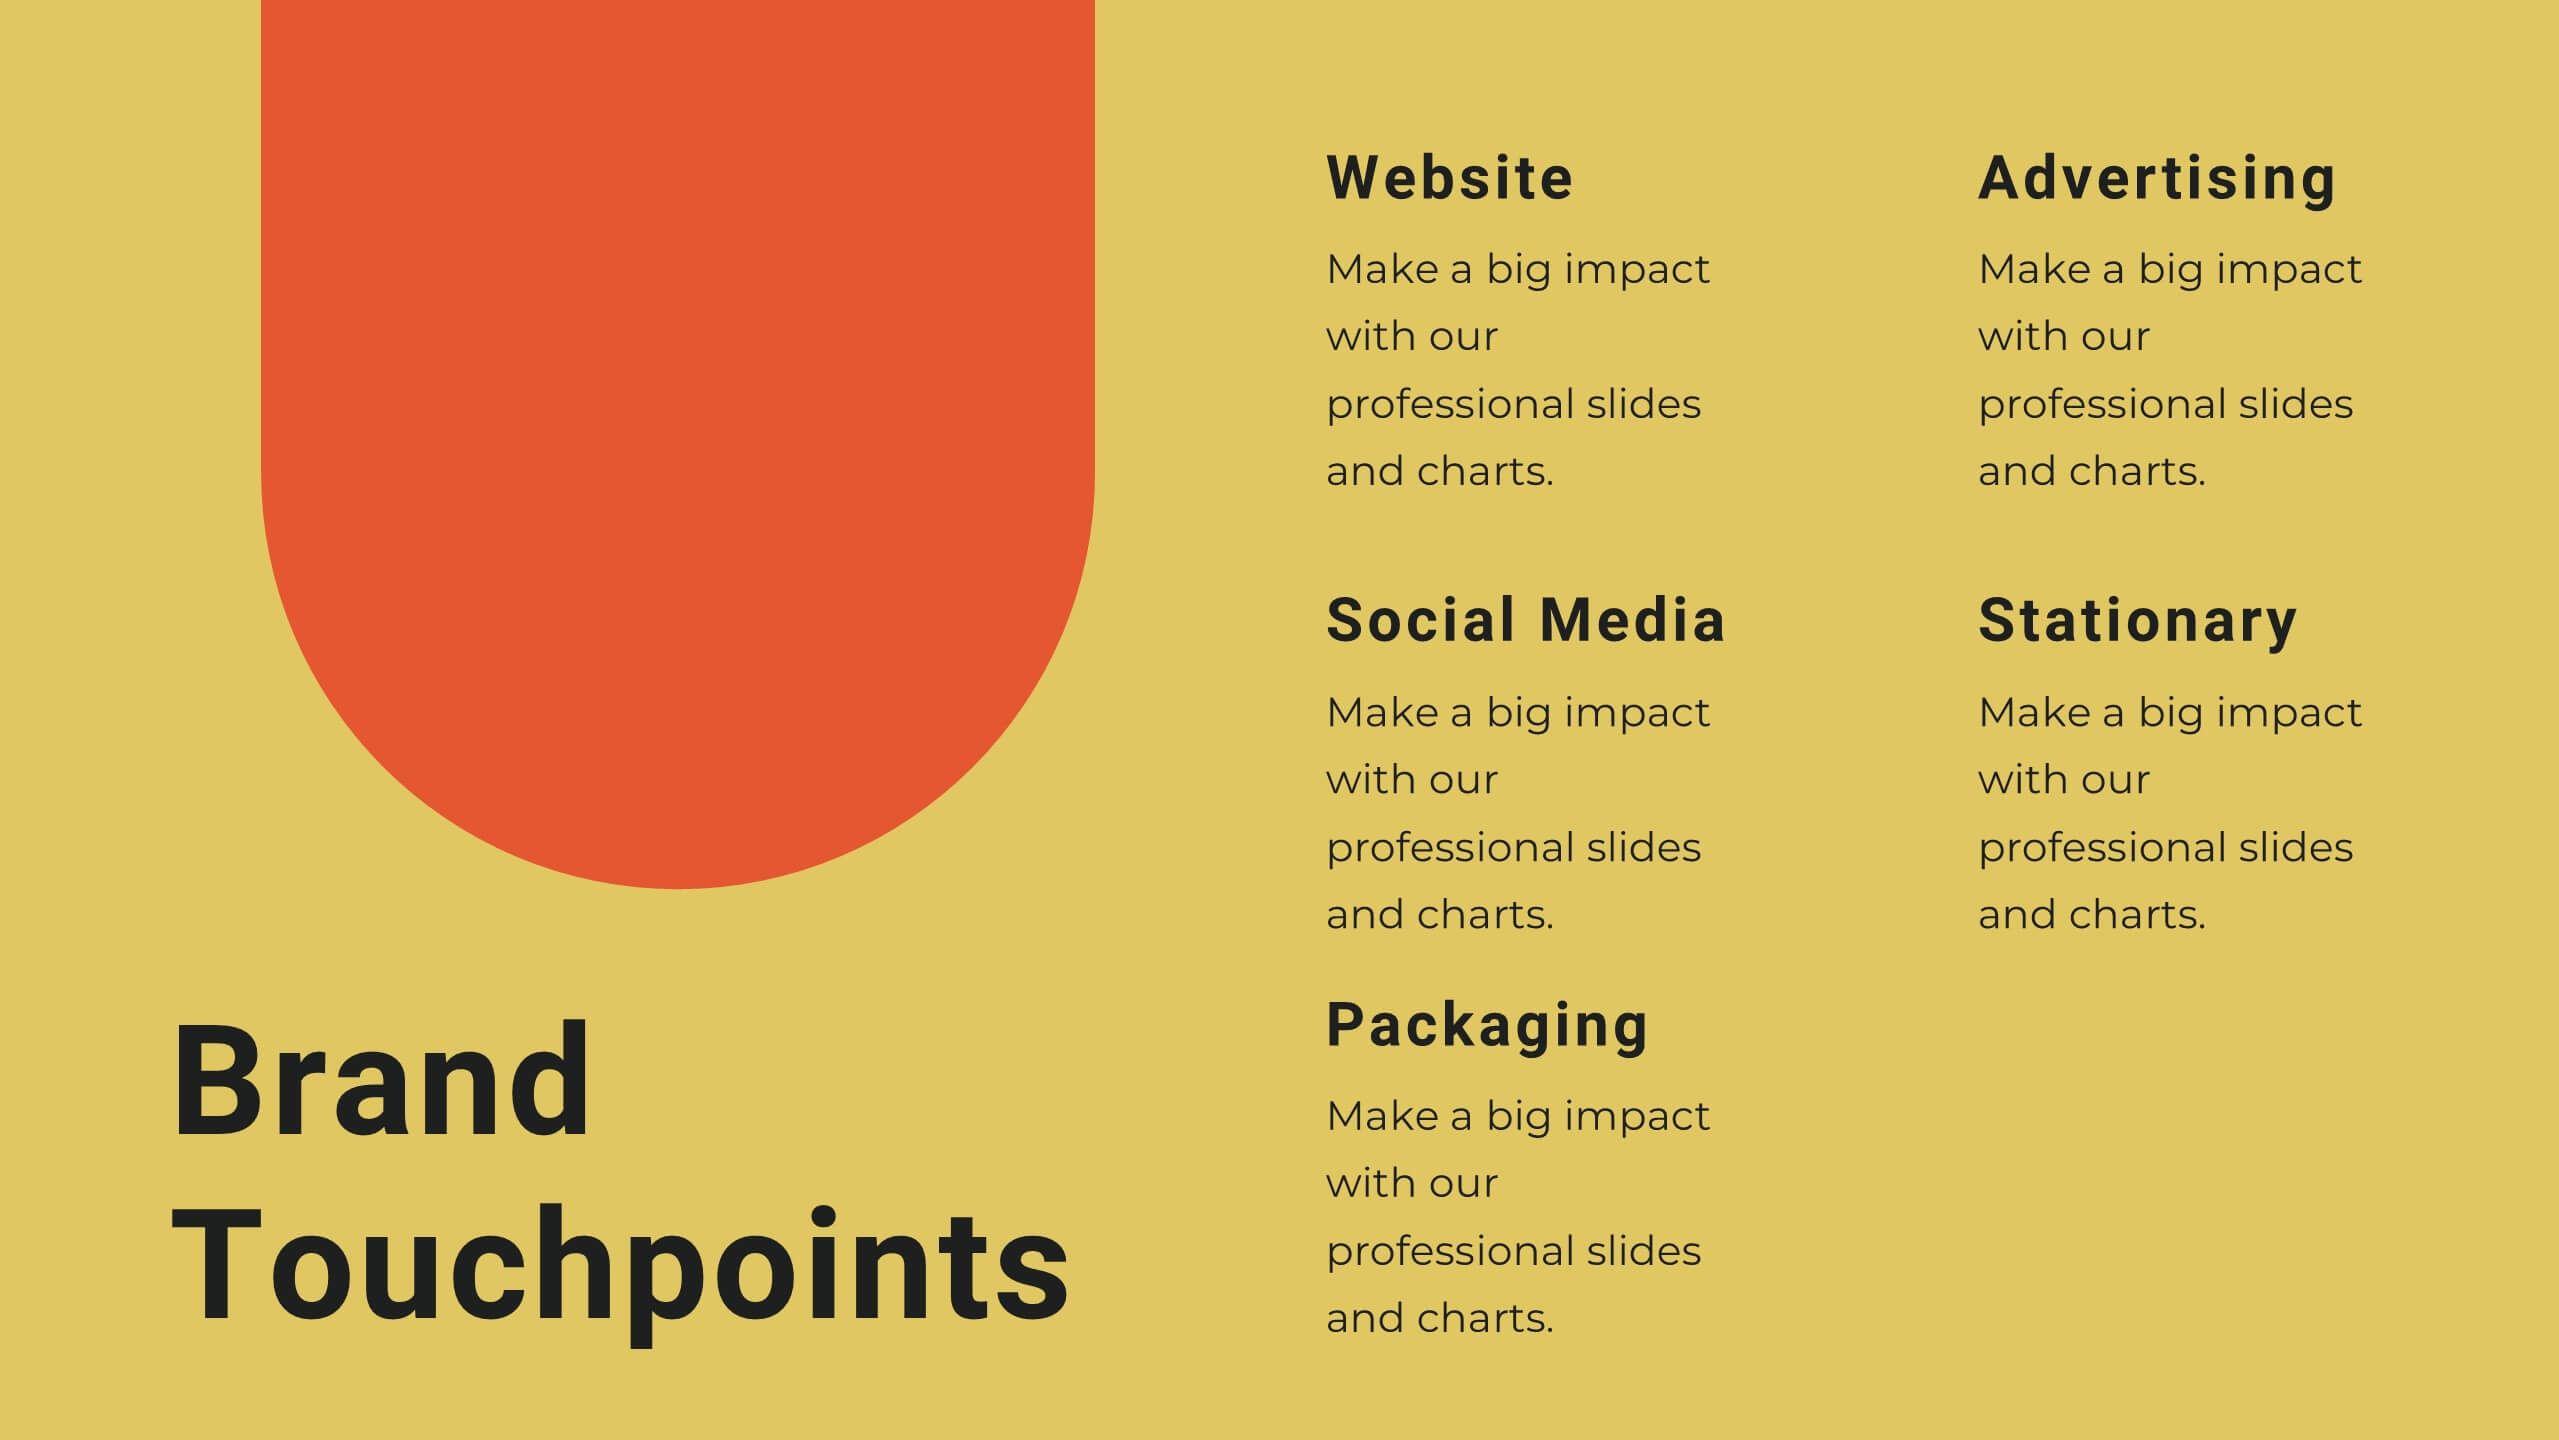
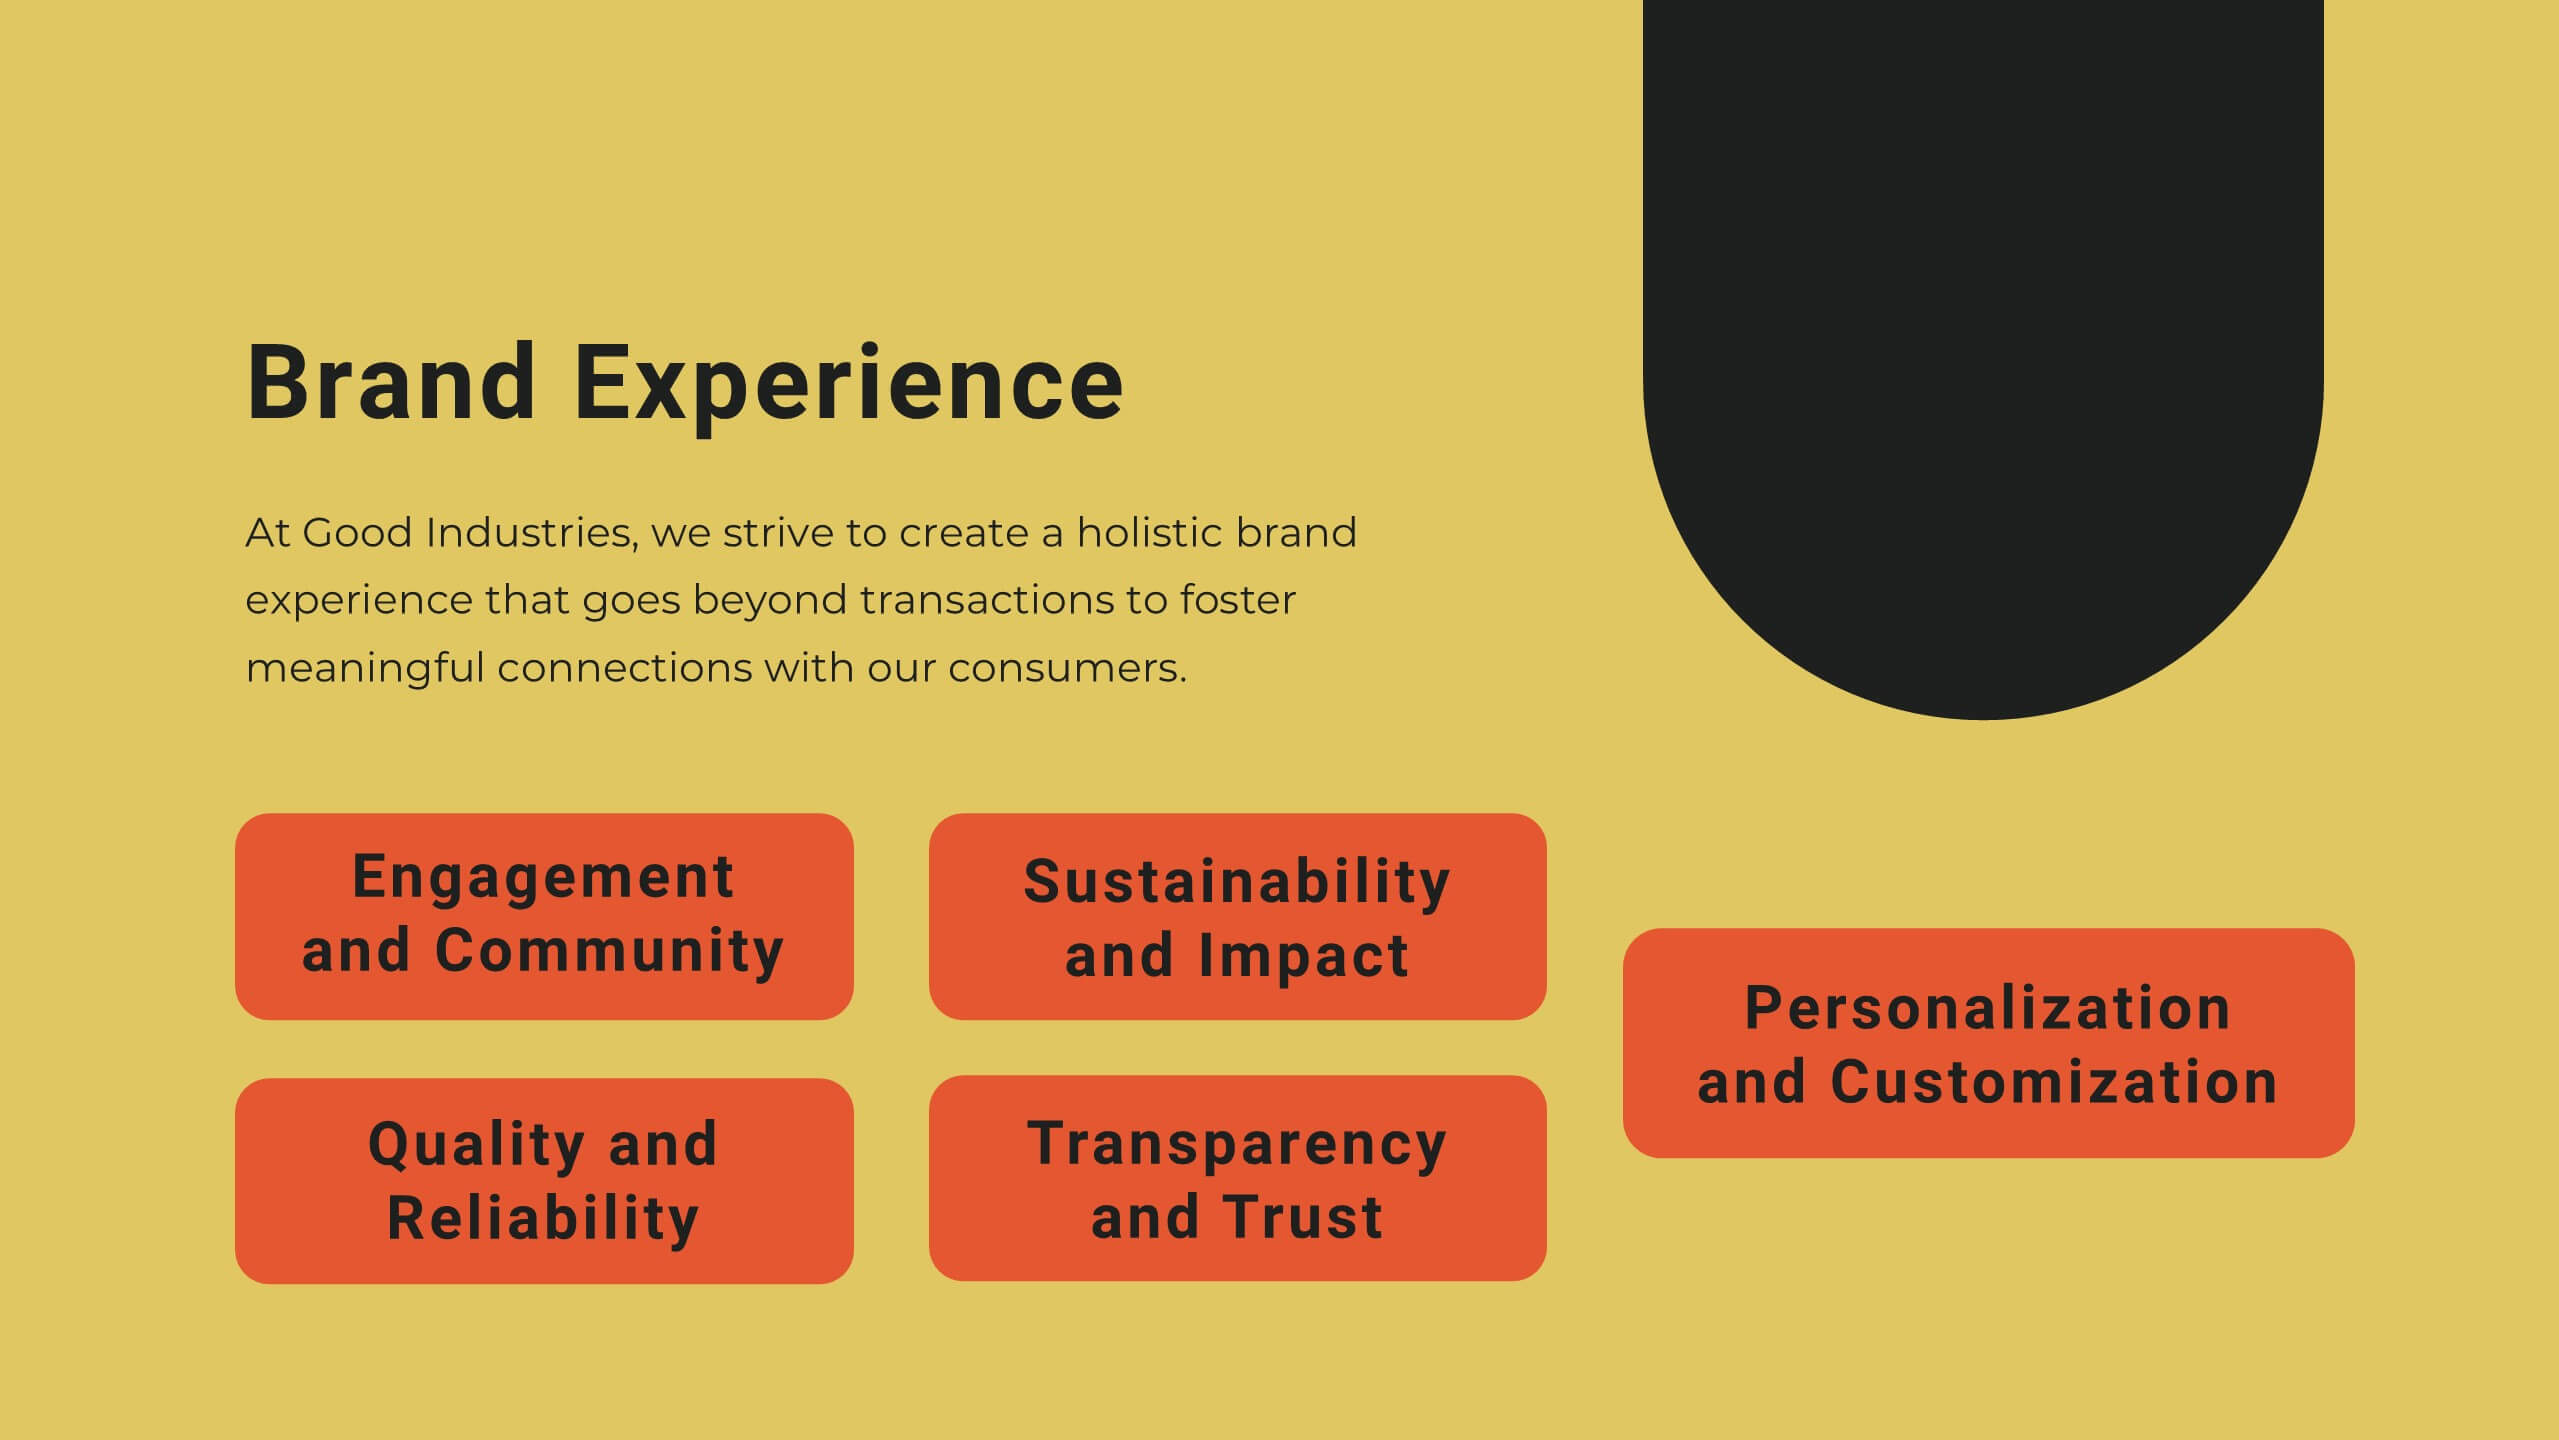
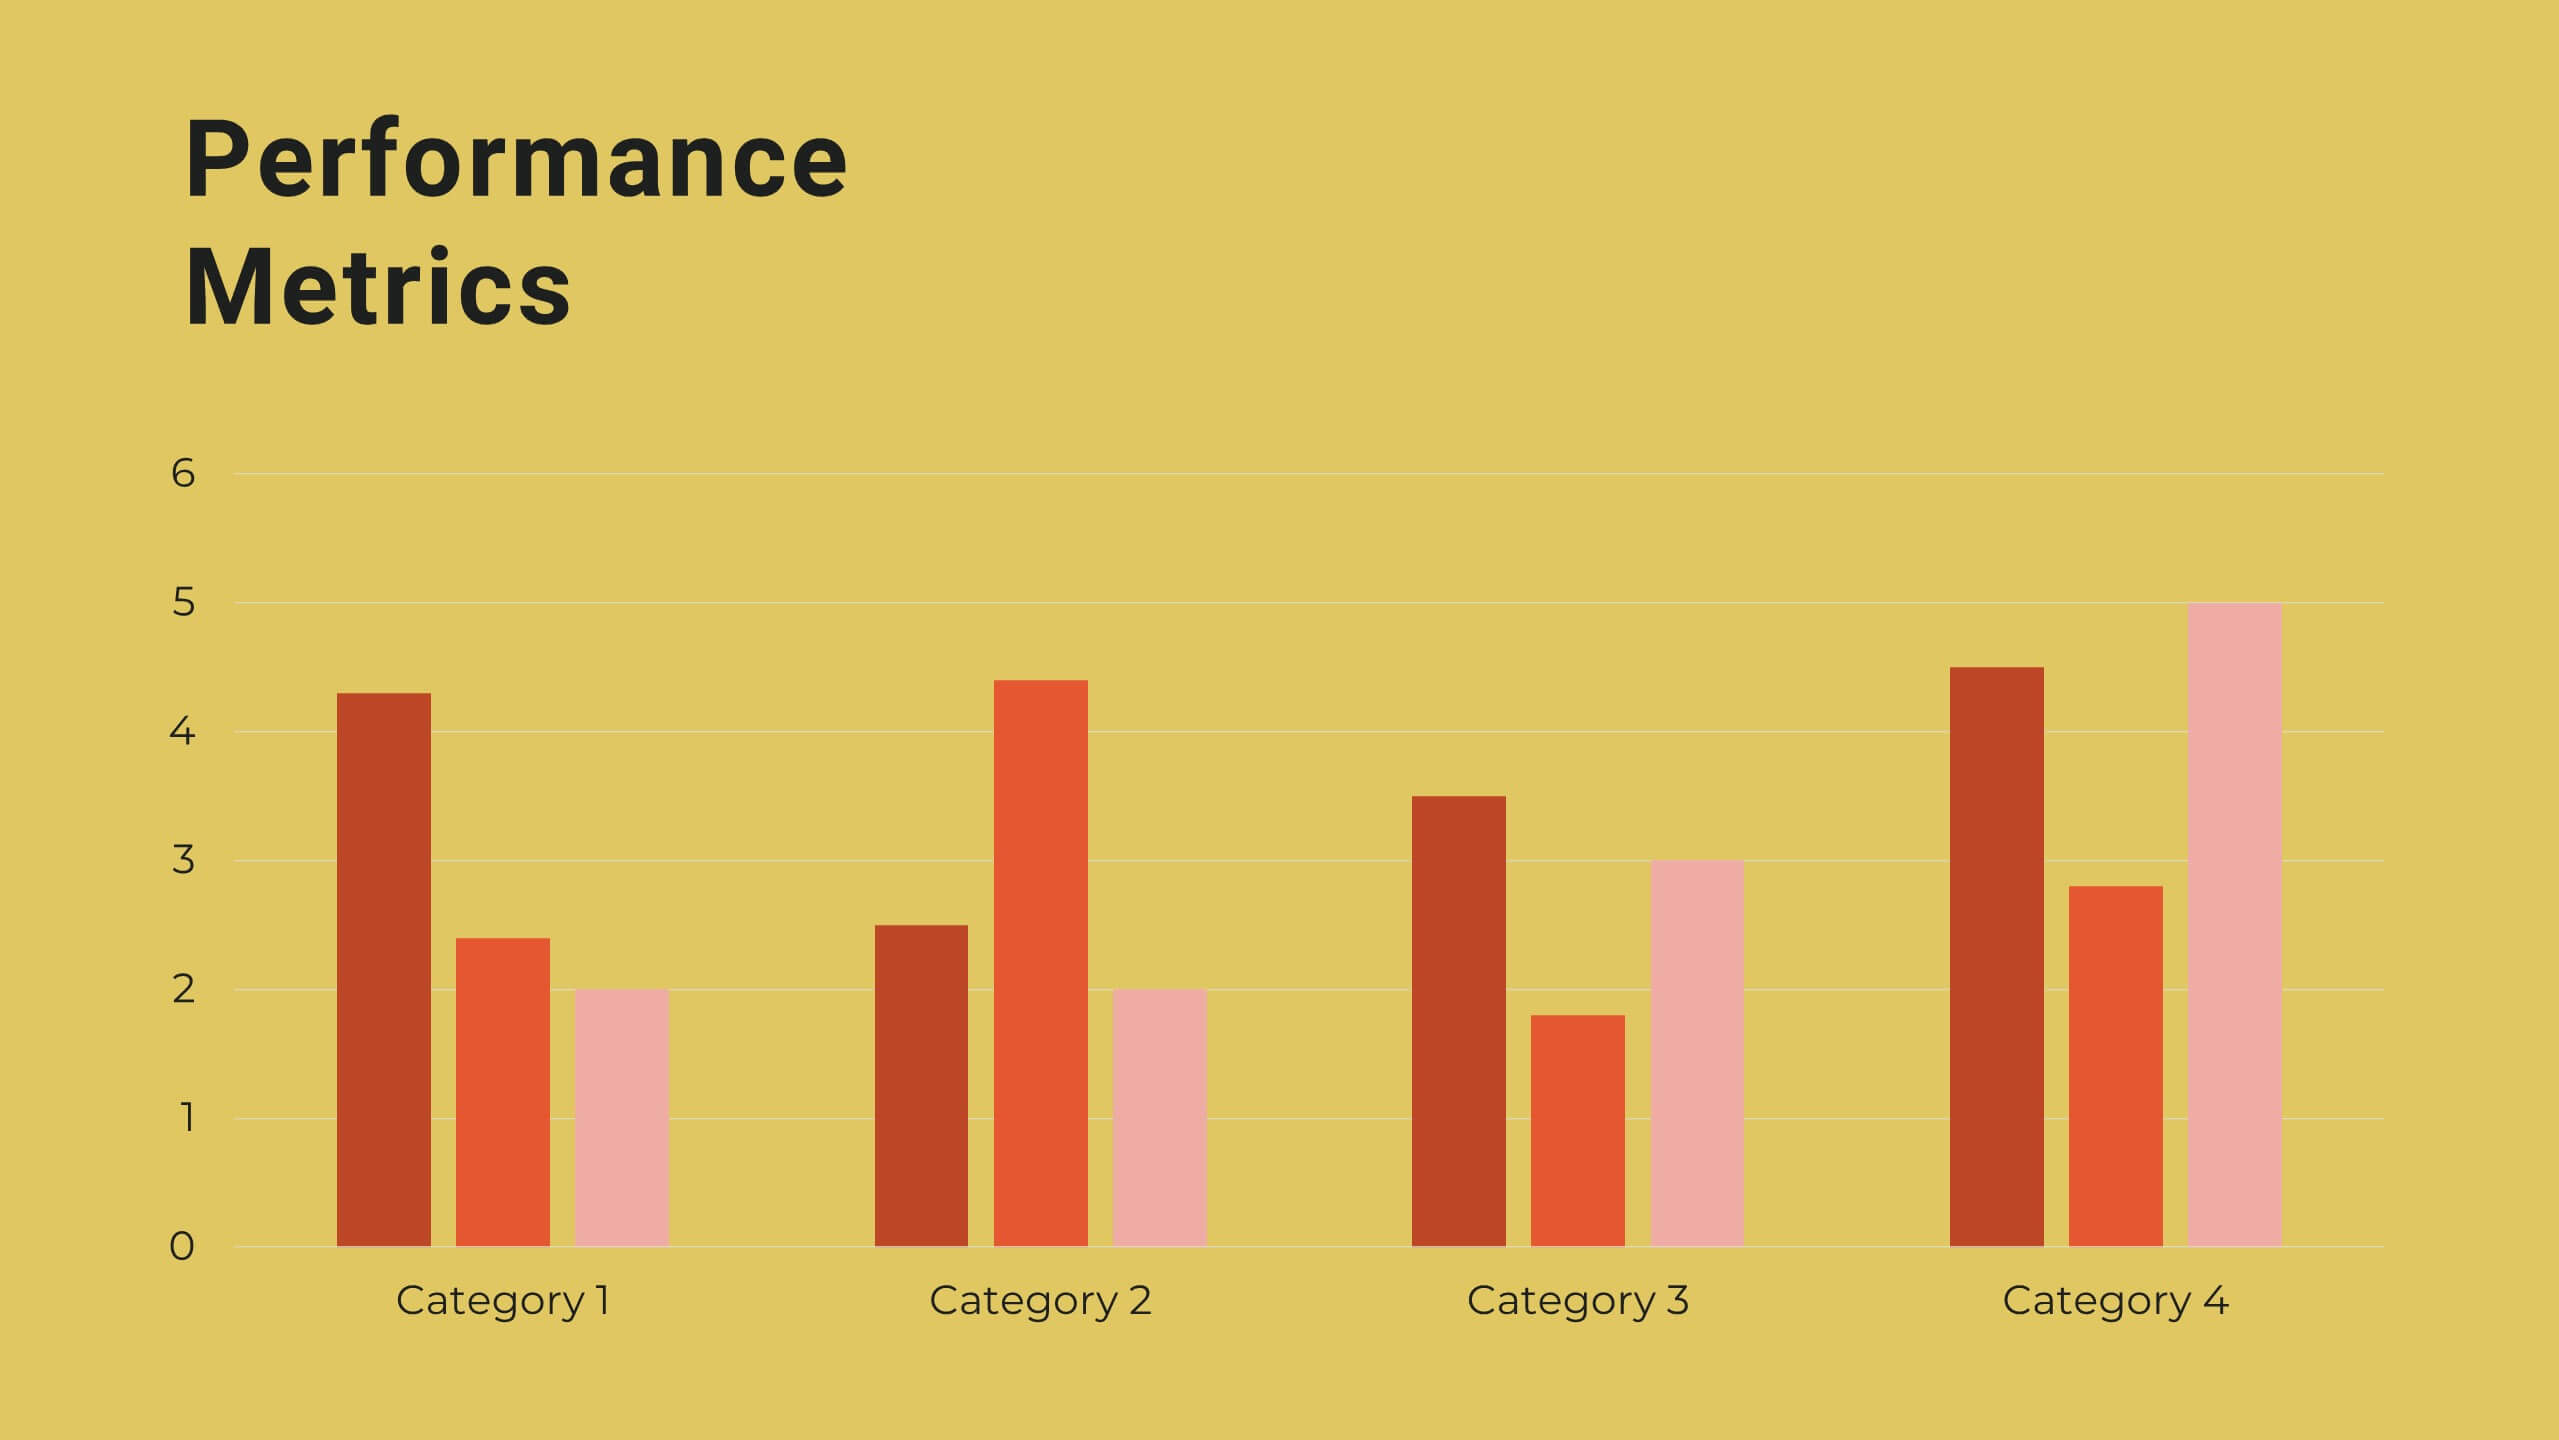
Yttrium Brand Strategy Report Presentation
Present your brand strategy with confidence using this vibrant, structured template! Covering brand identity, values, audience personas, and positioning, this template is perfect for crafting a compelling brand narrative. Fully customizable, it’s designed for seamless use in PowerPoint, Keynote, and Google Slides, making it an ideal tool for branding presentations.


5 slides
Country Data Mapping in South America Presentation
Present data with impact using the Country Data Mapping in South America Presentation. This clean, professional slide highlights key statistics across up to five countries using labeled connectors, icons, and a gradient-based map. Ideal for showcasing regional growth, KPIs, or operational breakdowns across South America. Fully editable and compatible with PowerPoint, Keynote, Google Slides, and Canva.


10 slides
Corporate Governance and Law Presentation
Master the essentials of organizational oversight with the "Corporate Governance and Law" template, which offers a structured approach to business management, effectively illustrating key elements such as performance, strategy, governance, talent, and integrity. This layout ensures easy comprehension and is ideal for illustrating the hierarchical relationships and regulatory frameworks in corporate environments. Compatible with PowerPoint, Keynote, and Google Slides.


12 slides
Business Growth and Expansion Presentation
Showcase your Business Growth and Expansion strategy with this dynamic presentation template. Featuring bold arrow visuals, it effectively illustrates progression, milestones, and key business insights. Ideal for startups, corporate planning, and market analysis. Compatible with PowerPoint, Keynote, and Google Slides.


5 slides
AIDA Model Marketing Infographics
The AIDA model is a marketing and advertising framework that outlines the stages a consumer goes through during the decision-making process.This AIDA model is a widely used marketing framework that outlines the stages a customer goes through in the buying process: Attention, Interest, Desire, and Action. These infographic templates are effective tools for explaining and illustrating the AIDA model in marketing presentations, training sessions, or educational materials. These infographics will enable your audience to apply the AIDA model in their marketing strategies, campaigns, and customer engagement efforts.