


Features
- 5 Unique slides
- Fully editable and easy to edit in Microsoft Powerpoint, Keynote and Google Slides
- 16:9 widescreen layout
- Clean and professional designs
- Export to JPG, PDF or send by email


Do you have any questions?
Recommend


6 slides
Technology Education Infographic
Technology education refers to the teaching and learning of skills, knowledge, and concepts related to technology. This infographic template is designed to present key information about technology education in a concise manner. It aims to educate and inform the audience about the importance of technology education and its impact on students' learning and future careers. The template utilizes visually appealing icons, illustrations, and graphics to enhance understanding and engagement. It includes images of computers, coding symbols, robots, and other technology-related visuals that help to reinforce the information presented.


6 slides
Vision to Execution Business Strategy Presentation
Bridge the gap between strategic vision and operational execution with this visual funnel-style template. Ideal for mapping high-level goals to tactical outcomes, this slide helps communicate transformation processes, business initiatives, or product strategies. Fully editable in PowerPoint, Keynote, or Google Slides for strategic planning, leadership sessions, or roadmap presentations.


20 slides
Cinderbark Product Launch Pitch Deck Presentation
Showcase your product launch with a sleek, modern, and professional pitch deck template. This design empowers you to captivate stakeholders by clearly presenting your problem statement, unique solutions, and market opportunity. Effectively highlight your target audience, revenue model, and competitive landscape to demonstrate market viability. Create impact with visuals detailing your sales strategy, growth projections, and financial summary, ensuring transparency and confidence in your business plan. Timeline and milestone slides keep the focus on key achievements and future goals, while team introduction pages establish credibility and expertise. Fully customizable and compatible with PowerPoint, Google Slides, and Keynote, this template is ideal for startups, entrepreneurs, and product managers aiming for a polished and compelling presentation. Tailor it to your needs and deliver your vision with clarity and style.


7 slides
Blue Ocean Diagram Presentation
The Blue Ocean Strategy goal is to create a market space that is untapped, and in doing so, break away from the competition, create new demand, and increase profits. This template is designed for use in Powerpoint, Keynote, and Google Slides, and is perfect for anyone looking to create an informative and engaging presentation on this topic. This template is a useful tool for professionals and students. It provides informative illustration and information about the Blue Ocean Strategy to help you visually present your research, build a strategy or deliver a presentation on blue ocean strategies.


20 slides
Vivid Product Development Plan Presentation
Develop your product with confidence using this detailed product development plan template! Perfect for outlining features, market analysis, and competitive advantages. Ideal for product managers and teams. Compatible with PowerPoint, Keynote, and Google Slides, this template ensures your plan is clear, professional, and comprehensive. Achieve product success today!


7 slides
Target Audience Demographics Slide Presentation
Capture attention with a clean, data-driven layout that makes understanding your audience quick and intuitive. This presentation helps you showcase key demographic insights, highlight behavioral patterns, and communicate strategic findings with clarity. Designed for easy editing and smooth workflow, it’s fully compatible with PowerPoint, Keynote, and Google Slides.


6 slides
Detailed Info Table with Metrics
Present complex insights with clarity using the Detailed Info Table with Metrics Presentation. Designed to showcase up to five key items or categories, this layout includes structured rows and multiple columns—perfect for comparing metrics, milestones, or KPIs across several dimensions. With bold numbering and clean typography, this editable slide works in PowerPoint, Keynote, and Google Slides.


7 slides
Asia Population Infographic Presentation
An Asia Map infographic is a visual representation of the Asian continent, highlighting its geographic features, population, culture, history, and other relevant information. Use this template as a graphic representation of Asia that combines text, data, and images in a visually appealing and informative way. This template can be used as a political or physical maps, regional map, thematic maps, or a combination of these. They may also include charts, graphs, illustrations, photographs, or other visual elements to convey information effectively. This template is completely customizable.


4 slides
Project Development Progress Report Presentation
Track milestones with precision using this clean, data-driven slide designed for showcasing project completion percentages. Circular progress visuals paired with text blocks allow you to highlight achievements, issues, or next steps at a glance. Perfect for project managers, teams, and stakeholders. Fully editable in PowerPoint, Keynote, and Google Slides.


23 slides
Orbit Corporate Strategy Report Presentation
Elevate your strategic planning and reporting with a sleek and dynamic template that exudes professionalism and clarity! This Strategy Report template is designed to empower your organization’s vision, highlighting the core elements that drive success. From a powerful agenda slide that sets the tone to a detailed team update, this template ensures every aspect of your business is showcased with precision. The design is streamlined yet impactful, perfect for conveying key achievements, current projects, and future goals. Performance metrics, departmental goals, and training & development sections are laid out to emphasize your organization’s strengths and areas of focus. The template also includes slides dedicated to employee recognition, process improvement, and cross-functional collaboration, ensuring all facets of your business are covered. With a clean, modern aesthetic, this template is perfect for executives and team leaders alike, and is compatible with PowerPoint, Keynote, and Google Slides. Get ready to make your strategy presentations unforgettable!


4 slides
Impact of 5G on Business and Innovation Presentation
Illustrate how next-gen connectivity is transforming industries with this sleek 5G innovation infographic. Featuring a 3D smartphone and signal waves, this slide presents four gradient-colored segments ideal for showcasing business use cases, digital transformation, and market impact. Ideal for tech startups, consultants, and enterprise innovation teams. Easily editable in PowerPoint, Keynote, and Google Slides.


24 slides
Wanderra UX Design Presentation
Elevate your user experience strategy with this comprehensive presentation template. Covering key aspects such as personas, wireframes, usability guidelines, and design systems, this template helps you create engaging and intuitive experiences. Fully customizable and compatible with PowerPoint, Keynote, and Google Slides.


6 slides
McKinsey 7S Model Articles Infographics
Explore the seven critical elements that make up the McKinsey 7S Model, including Strategy, Structure, Systems, Shared Values, Skills, Style, and Staff. Each of these components plays a vital role in shaping your company's success. This infographic is compatible with popular presentation tools like PowerPoint, Keynote, and Google Slides, making it effortless to incorporate into your next business presentation. Unlock the secrets of organizational effectiveness with this concise and visually appealing resource. Enhance your understanding of the McKinsey 7S Model and supercharge your company's performance today. Get ready to transform your business strategy with this user-friendly infographic.


6 slides
Business Task and To-Do List Slide
Organize tasks with clarity using this colorful checklist-style layout, perfect for showcasing priorities, timelines, or team responsibilities. With six editable sections and engaging icons, this layout brings structure and visual appeal to business updates or project meetings. Fully customizable in PowerPoint, Keynote, and Google Slides.


6 slides
Annual Budget Forecast Template Presentation
Plan smarter and present your financial goals with precision using this clean, data-driven layout. Designed to visualize yearly spending, savings, and projections, this template helps teams clearly communicate performance and future targets. Perfect for finance reports or business reviews, it’s fully compatible with PowerPoint, Keynote, and Google Slides for effortless customization.


22 slides
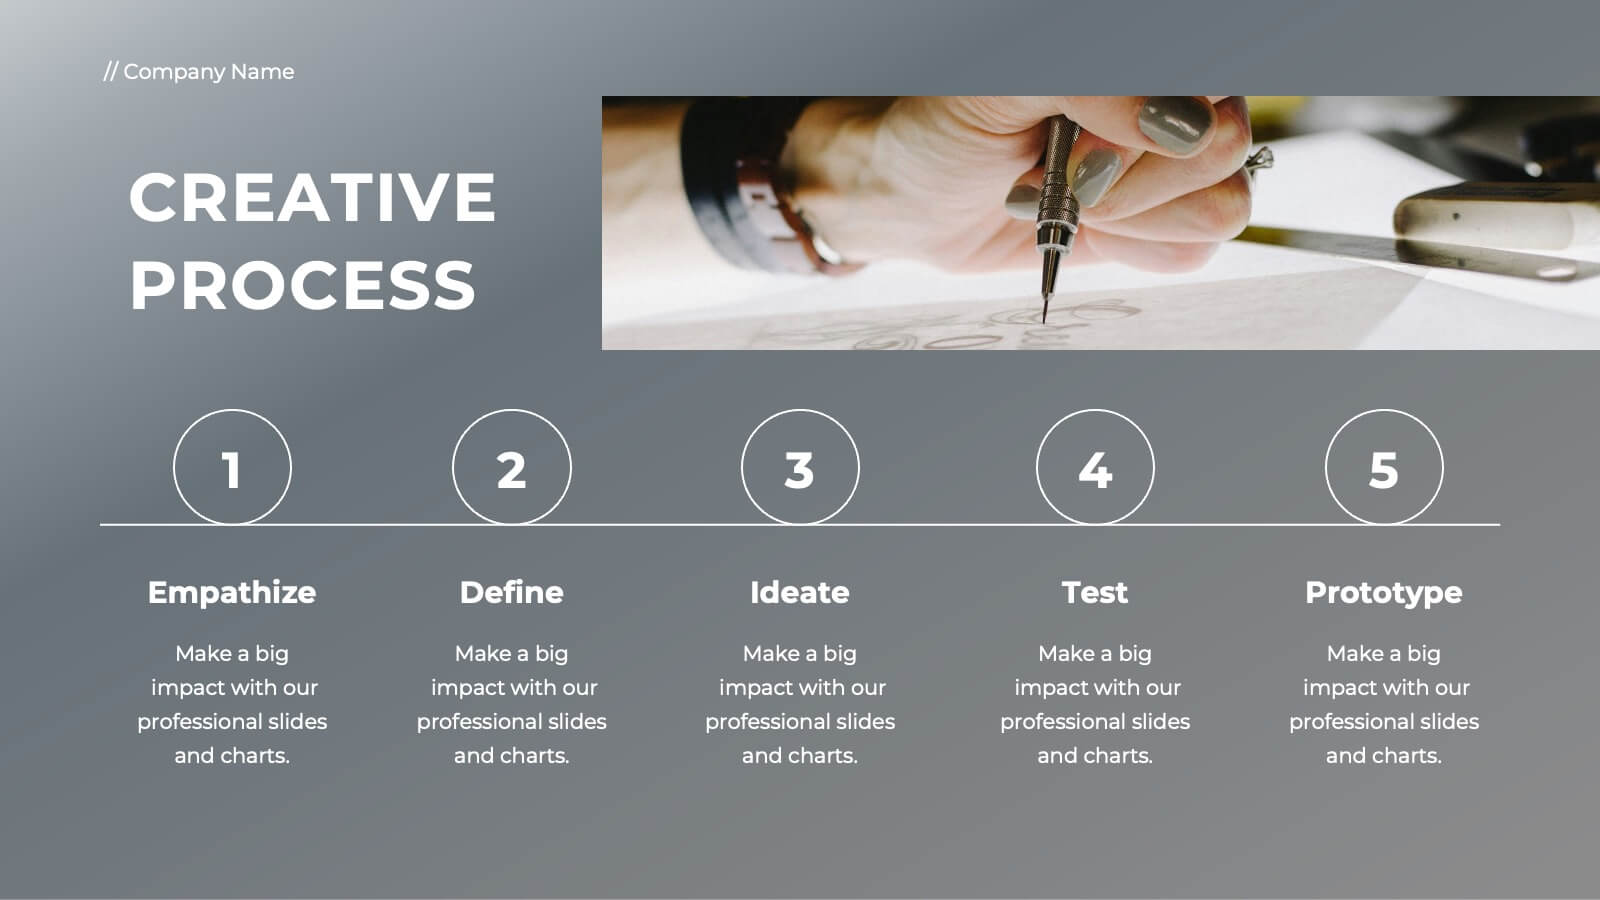
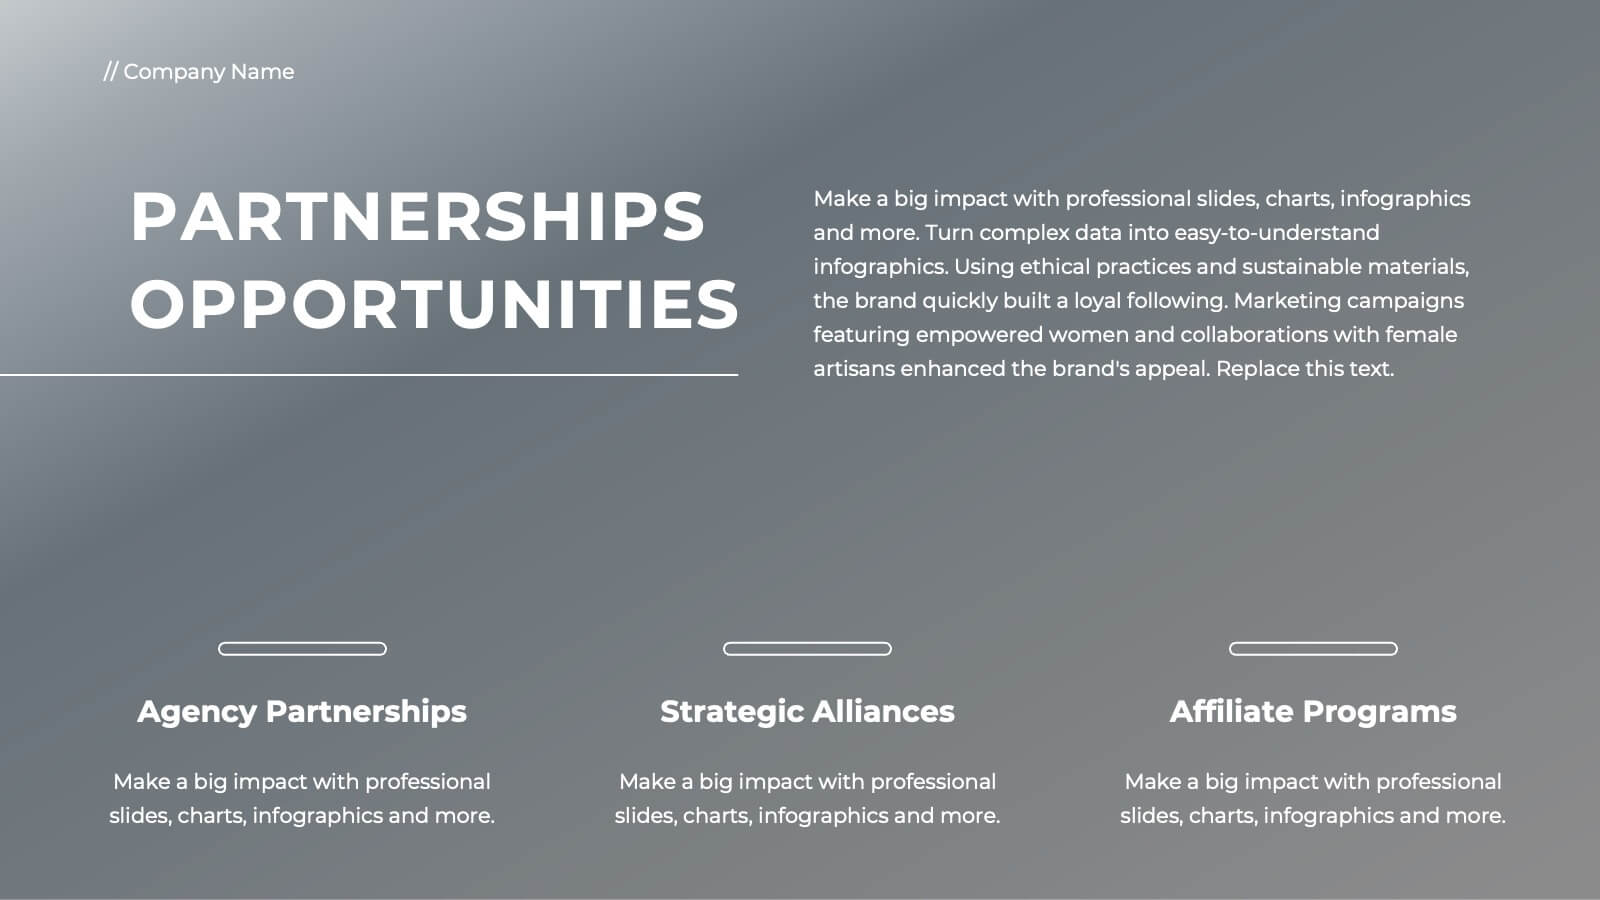
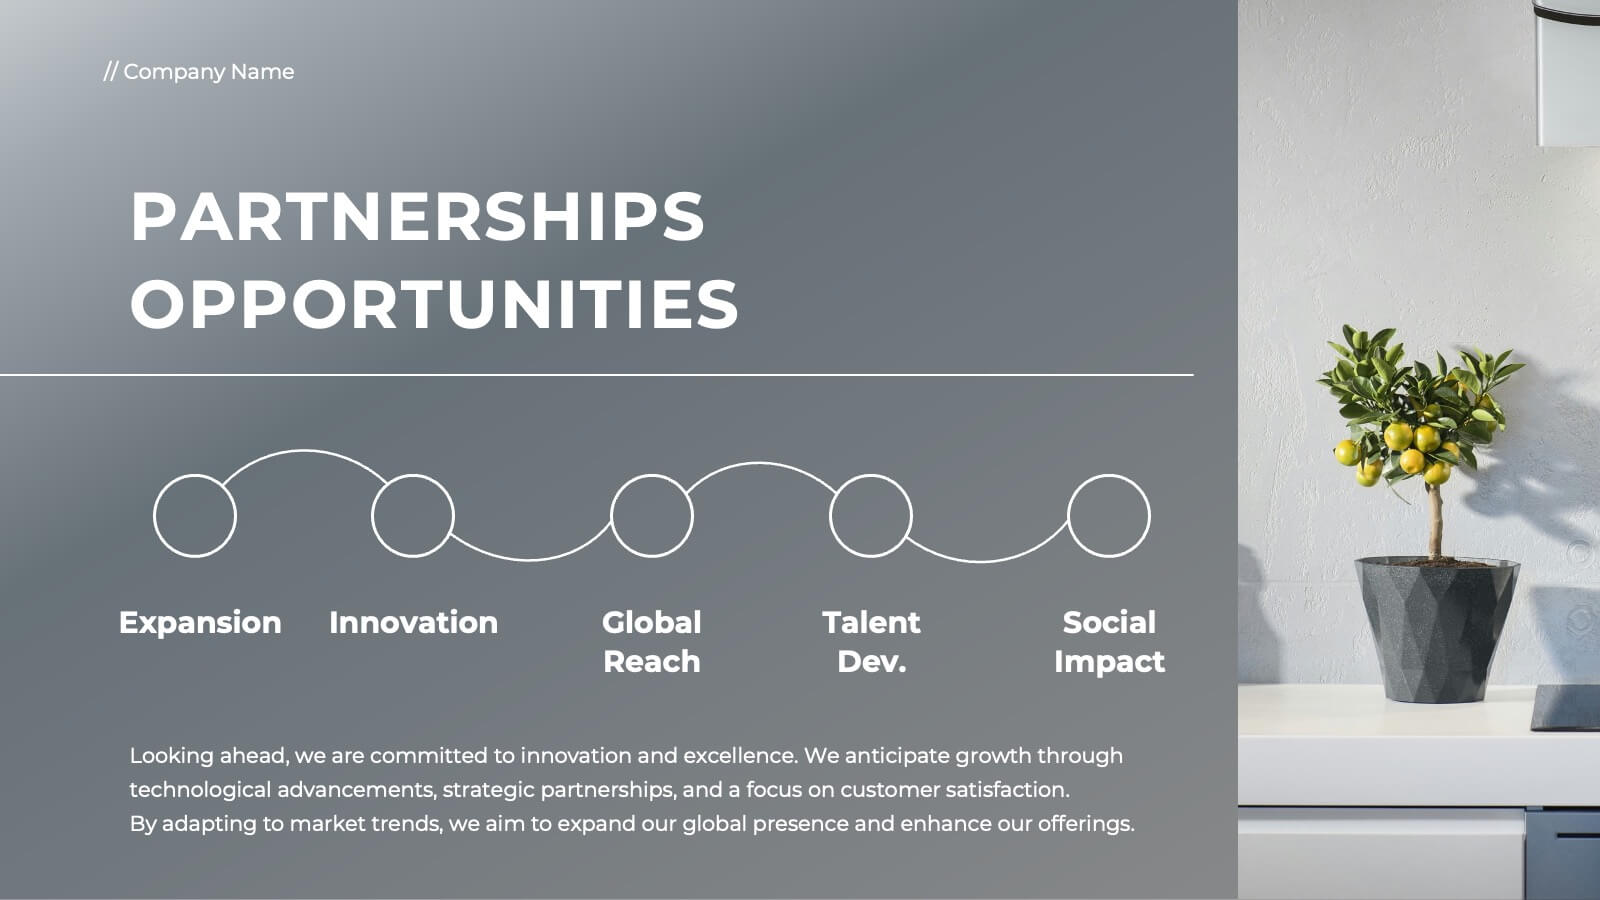
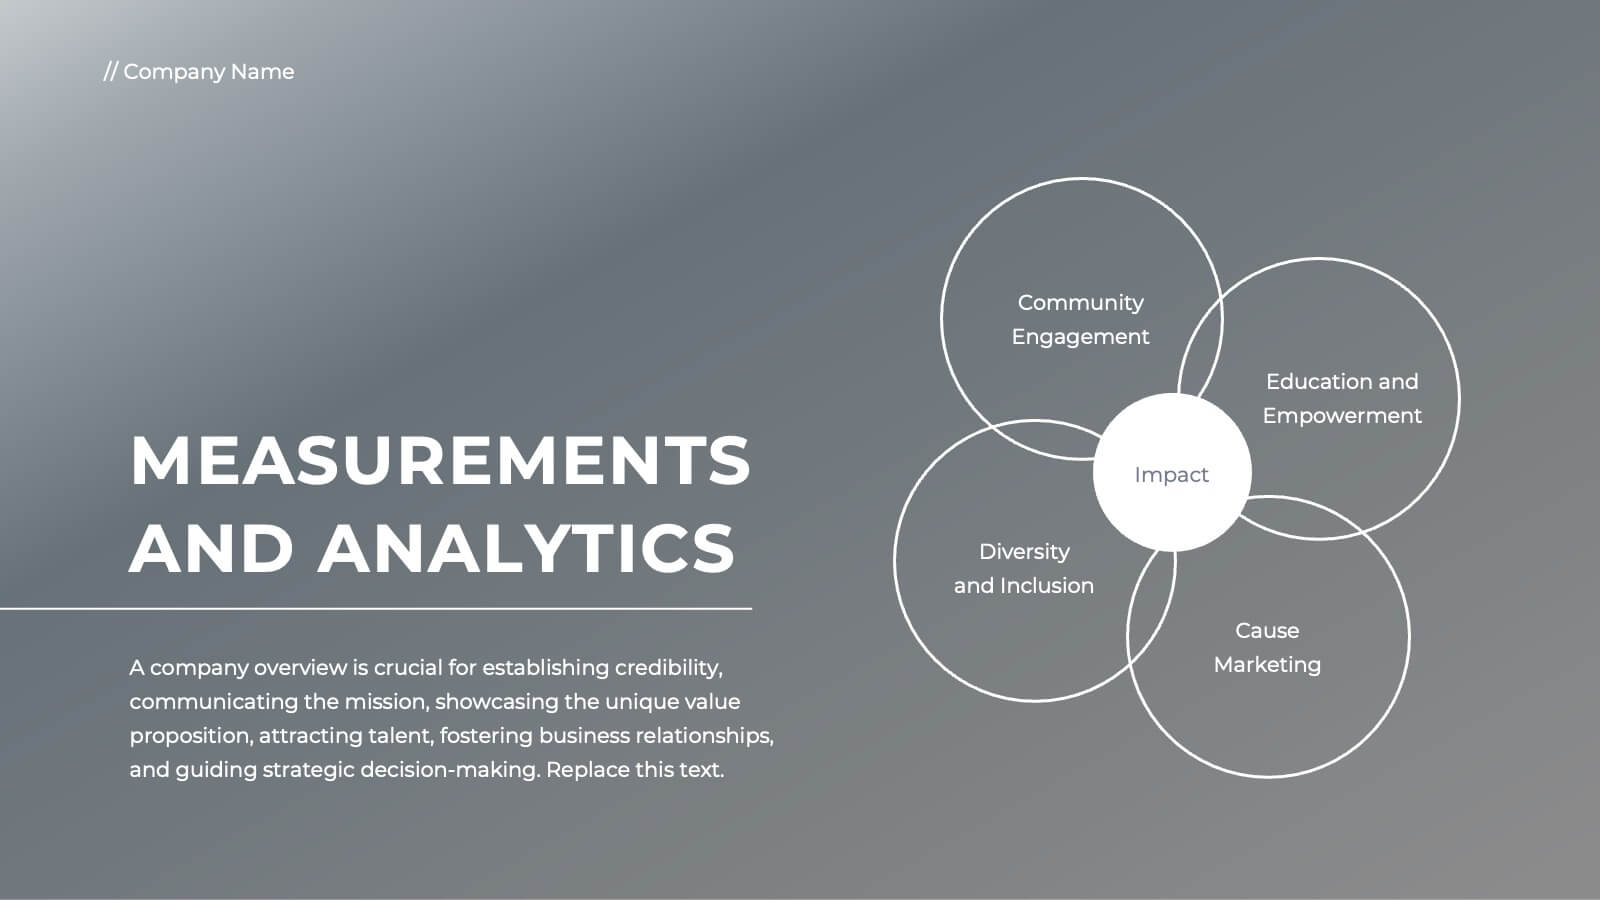
Ember Full-Service Agency Project Plan Presentation
Elevate your agency's presentation with this sleek project plan template! Ideal for showcasing your team's vision, market analysis, and client success stories, it includes slides for strategic development, campaign execution, and partnerships. Impress clients and stakeholders with professional visuals and detailed content. Compatible with PowerPoint, Keynote, and Google Slides for seamless presentations on any platform.


7 slides
KPI Sales Dashboard Infographic
A KPI (Key Performance Indicator) Dashboard is a visual tool or interface that provides a real-time snapshot of an organization's or a specific department's key performance indicators. Empower your sales team with our KPI sales dashboard infographic template. This visually striking and insightful template allows you to present key performance indicators and metrics in an easily understandable and engaging format. Compatible with Powerpoint, Keynote, and Google Slides. This template will transform your sales data into a dynamic, easy-to-understand dashboard, helping your team stay informed, motivated, and focused on achieving sales targets.