


Features
- 6 Unique slides
- Fully editable and easy to edit in Microsoft Powerpoint, Keynote and Google Slides
- 16:9 widescreen layout
- Clean and professional designs
- Export to JPG, PDF or send by email


Do you have any questions?
Recommend


26 slides
Blockchain for Businesses Presentation
Navigate the world of decentralized technology with our Blockchain for Businesses presentation template, compatible with PowerPoint, Keynote, and Google Slides. Tailored for business leaders, tech entrepreneurs, and financial experts, this template is a gateway to understanding blockchain's impact on the corporate landscape. Our template demystifies blockchain, presenting its core concepts and applications in business, from enhancing security to streamlining transactions. It provides a visual narrative to explain how blockchain can be a game-changer in various industries by fostering transparency, efficiency, and trust. With customizable diagrams, charts, and case studies, you can illustrate the practical benefits of blockchain integration in business operations. This template is SEO-optimized to reach audiences interested in leveraging blockchain technology for competitive advantage. Use our template to educate your audience about the strategic implementation of blockchain and position your business at the forefront of technological innovation.


12 slides
Business Strategy with 7S Model Presentation
Streamline your strategic discussions with our Business Strategy with 7S Model presentation template, crafted for professionals who demand precision and clarity. Each slide methodically details the seven interrelated elements—Structure, Strategy, Systems, Skills, Staff, Style, and Shared Values—ensuring a comprehensive analysis of your organization's alignment. This versatile template enhances your presentations in PowerPoint, Keynote, and Google Slides, providing a visually engaging way to explore complex business strategies and foster insightful conversations.


26 slides
Film Industry Vintage Presentation
The film industry, also known as the cinema or movie industry, refers to the collection of companies, professionals, and organizations involved in the production, distribution, and exhibition of films. This presentation template has a nostalgic design tailored for film enthusiasts, filmmakers, historians, or anyone looking to delve into the rich history of cinema. This presentation offers a visually appealing and well-curated journey through the evolution of the film industry, highlighting key milestones, iconic films, and the pioneers who shaped its development. Utilize the vintage illustrations and diagrams to illustrate film advancements.


6 slides
Capability Gap Analysis Infographic
Gap analysis is a strategic management tool used to compare an organization's current performance or situation with its desired or target state. This infographic template is a visual representation of the process of conducting a capability gap analysis, which is a strategic assessment used to identify the gaps between their current capabilities and the capabilities required to achieve their goals or meet specific objectives. The infographic aims to provide a clear and concise overview of the capability gap analysis process and its key components. Compatible with Powerpoint, Keynote, and Google Slides.


6 slides
Governance Structure Overview Presentation
A clear, polished flow of ideas makes this slide instantly engaging, guiding viewers through each essential component with ease. This presentation explains how an organization structures oversight, responsibilities, and decision-making to ensure accountability and performance. Clean icons and balanced spacing keep everything easy to follow. Fully compatible with PowerPoint, Keynote, and Google Slides.


6 slides
Team Vision Infographic
Explore our collection of Slide Templates tailored to showcase your team's vision and future ambitions. These templates offer a blend of modern and professional designs that are perfect for laying out your team's objectives and strategies. Each slide is crafted to facilitate clear communication of your vision, ensuring every team member is aligned and motivated. These visually appealing templates are ideal for team meetings, strategic planning sessions, and leadership presentations. They are fully customizable, allowing you to adapt the colors, text, and graphics to match your team's identity and goals. Optimize your team's presentations with these versatile templates, designed to promote understanding and enthusiasm for your collective vision.


7 slides
Creative Timeline Infographic Presentation Template
A Timeline is an essential tool to illustrate the chronology of events; it also provides a method for organizing and summarizing material. With the timelines provided in this template you will be able to visualize the passage of time, so that you can better understand how influences from the past still impact your life today. This template is designed to assist you with crafting your timeline so that it can be easily understood. The color-coding makes it easy to see daily progress. Use the timelines in this template to create useful visualization, and convey the growth of your business or brand.


8 slides
Professional Title Slide Presentation
Start your presentation with impact using a bold, modern cover design that captures attention instantly. Perfect for introducing reports, creative projects, or business pitches, this layout combines professional typography with clean visuals for a polished first impression. Fully editable in PowerPoint, Keynote, and Google Slides for seamless customization.


20 slides
Astral UX UI Design Pitch Deck Presentation
Present your UX/UI design with flair! This template covers everything from design briefs and process steps to mood boards and final presentations. Perfect for showcasing design elements, wireframes, and project timelines. Ideal for impressing stakeholders and clients. Compatible with PowerPoint, Keynote, and Google Slides. Make your design pitch unforgettable!


3 slides
Stock Market Investment Analysis Presentation
Unlock the secrets of the stock market with our "Stock Market Investment Analysis" presentation templates. Ideal for financial analysts and investors, these templates provide a clear framework for analyzing trends and making informed decisions. With easy-to-edit elements and professional design, they are perfect for delivering compelling investment insights. Compatible with PowerPoint, Keynote, and Google Slides, they ensure your analysis looks sharp and persuasive across all platforms.


8 slides
End of Presentation Thank You Slide
Wrap up your presentation with a bold, memorable finish using a vibrant layout that instantly grabs attention. This slide gives you space to share final notes, highlight next steps, or leave a lasting impression with clean, modern design. Fully editable and compatible with PowerPoint, Keynote, and Google Slides.


12 slides
Effective Decision-Making with RAPID Presentation
Unlock streamlined decision-making with the Effective Decision-Making with RAPID template, a comprehensive guide designed to help organizations enhance and clarify their decision-making processes. Covering the key phases: Recommend, Agree, Perform, Input, and Decide, this template is essential for teams looking to optimize operational efficiency. Ideal for a variety of business environments, it is compatible with PowerPoint, Keynote, and Google Slides, offering versatility and ease of use for professionals.


5 slides
Healthcare Innovations and Medical Trends Presentation
Showcase breakthroughs and progress with the Healthcare Innovations and Medical Trends Presentation. This slide features a stylized heart icon with segmented color highlights tied to four labeled icons—perfect for visualizing trends, solutions, or stages in care. Fully editable in Canva, PowerPoint, Keynote, and Google Slides for easy customization.


8 slides
Effective Leadership Strategy
Visualize leadership pillars with this bold hexagonal layout designed to showcase four key components of effective leadership. Each colored segment allows you to present core strategies like vision, communication, decision-making, and team empowerment. Perfect for business training, organizational development, or executive briefings. Fully customizable in PowerPoint, Keynote, and Google Slides.


6 slides
Business Risk Identification and Management Presentation
Identify, analyze, and mitigate business risks with ease. This Business Risk Identification and Management template helps teams visualize potential risks, assess their impact, and implement mitigation strategies. Perfect for corporate leaders, project managers, and financial analysts. Fully customizable and compatible with PowerPoint, Keynote, and Google Slides for seamless presentation use.


23 slides
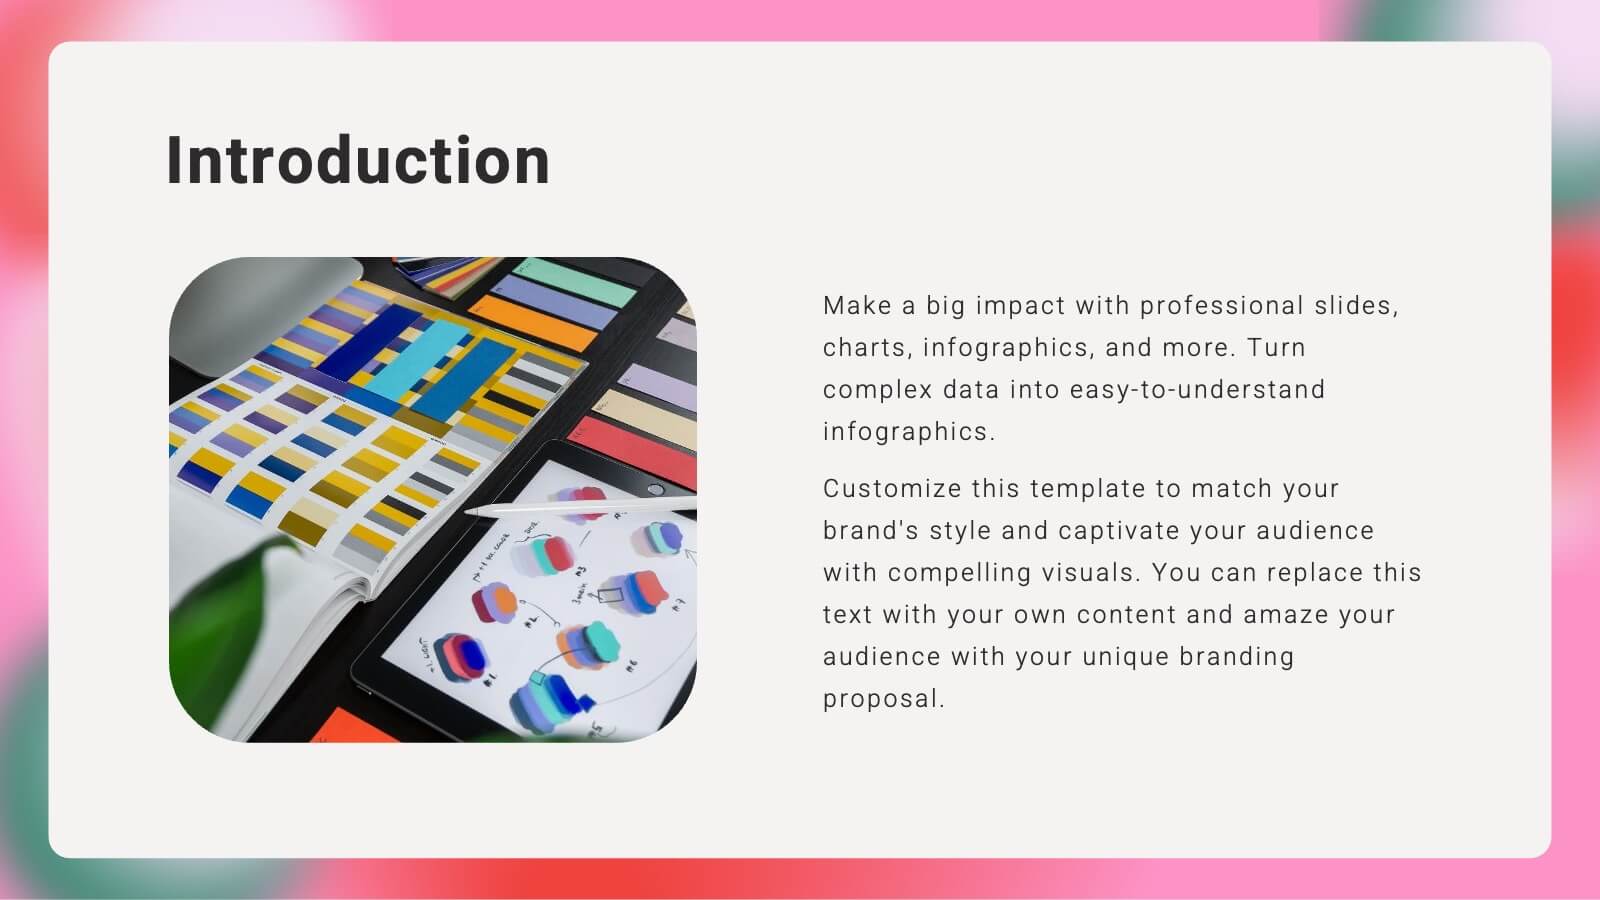
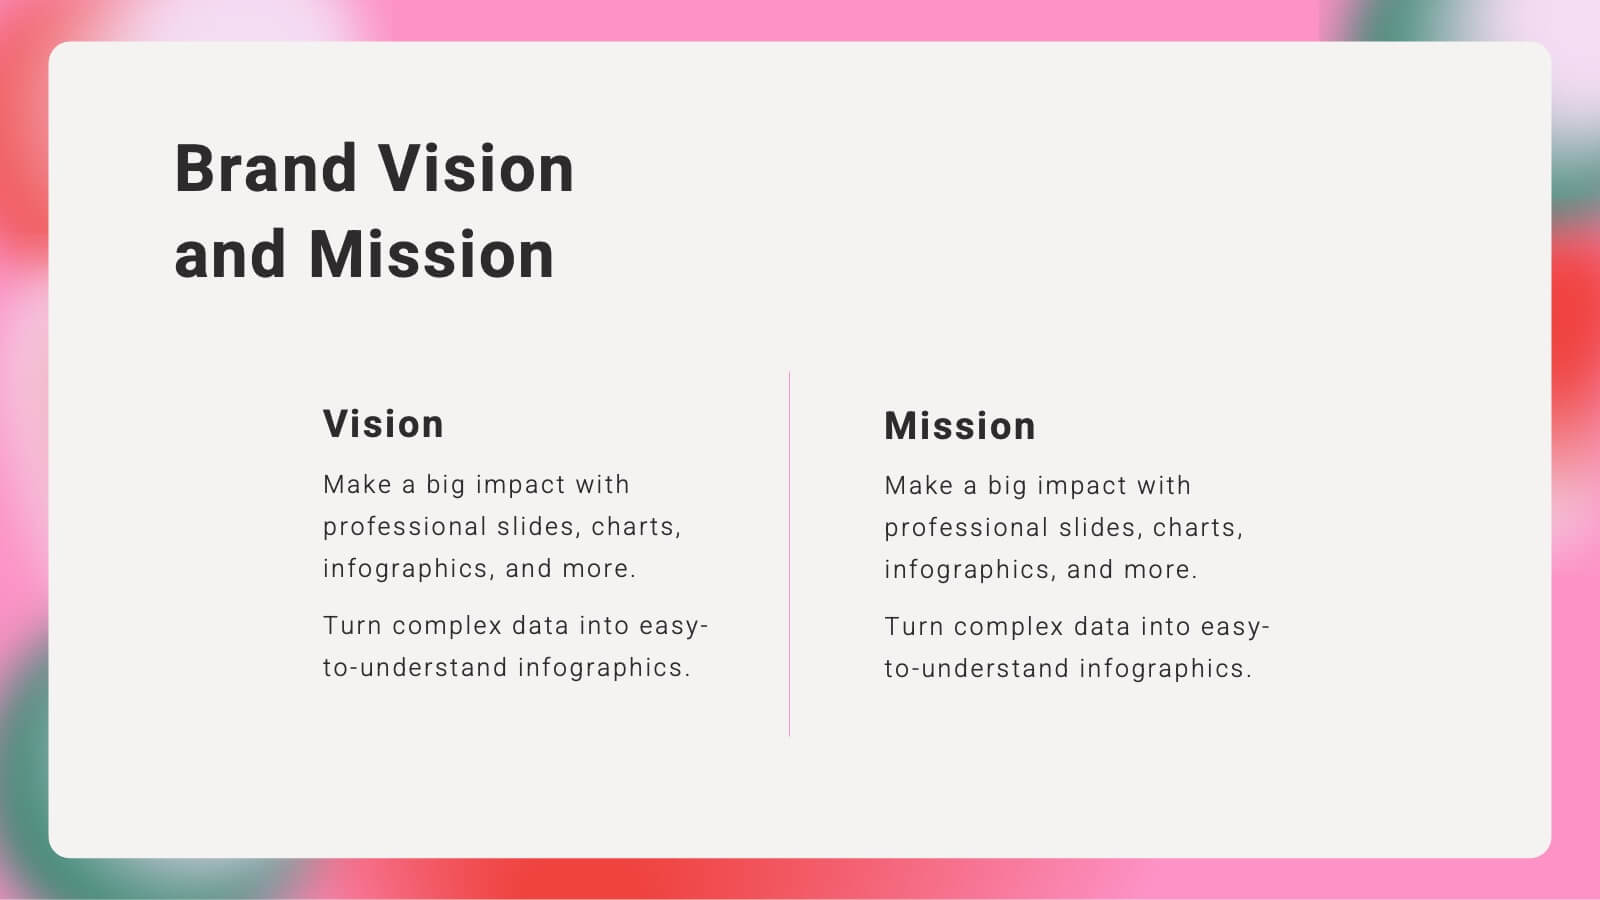
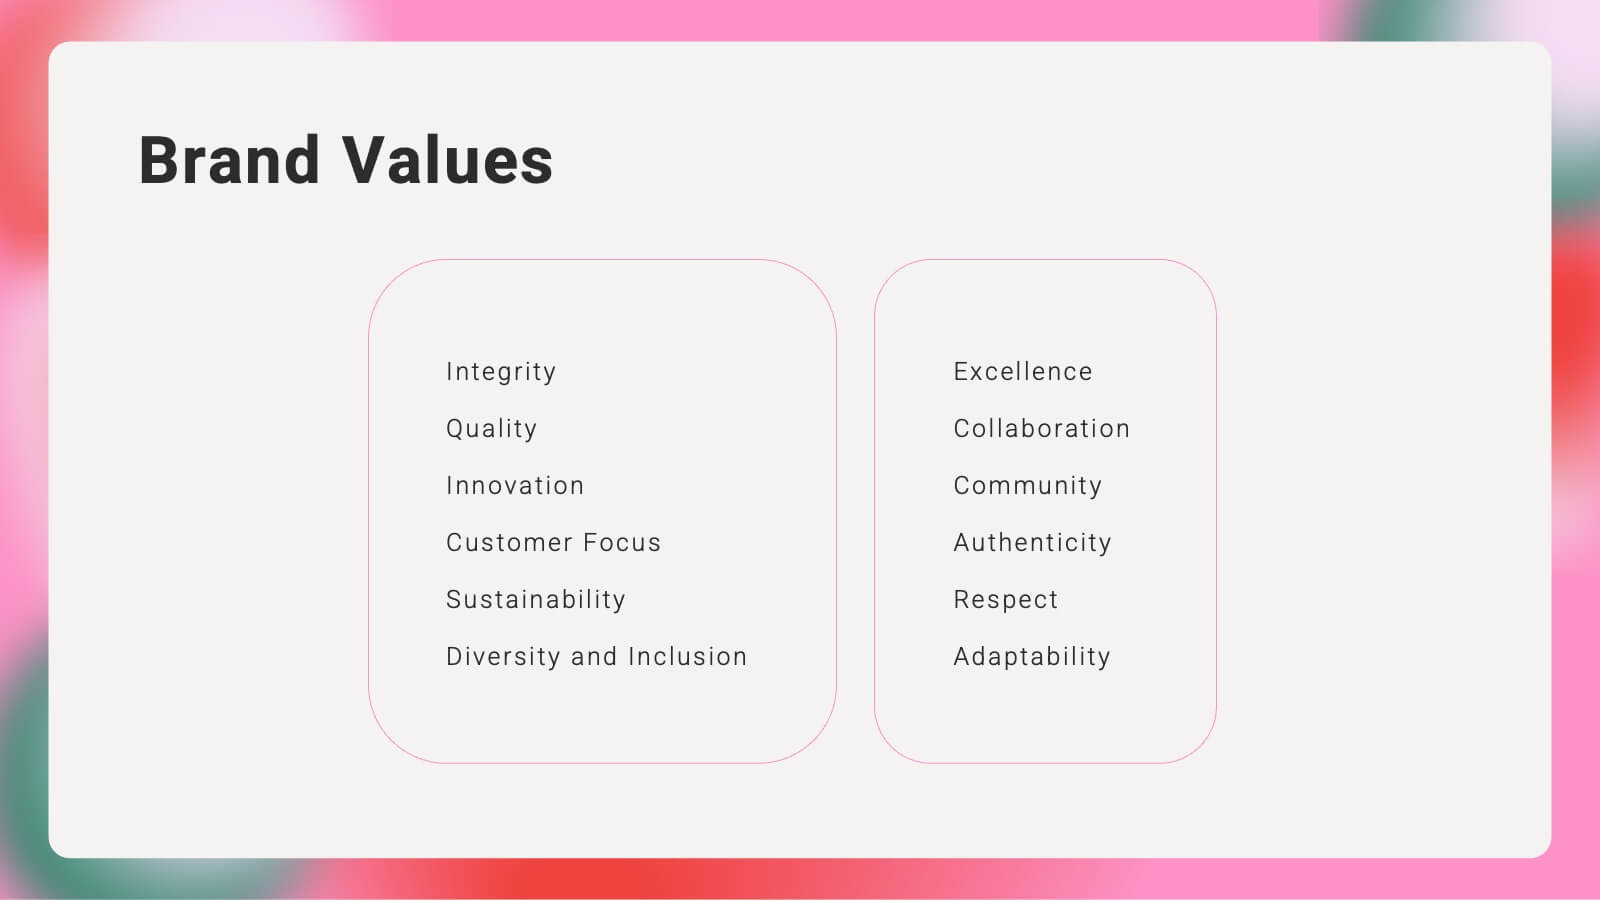
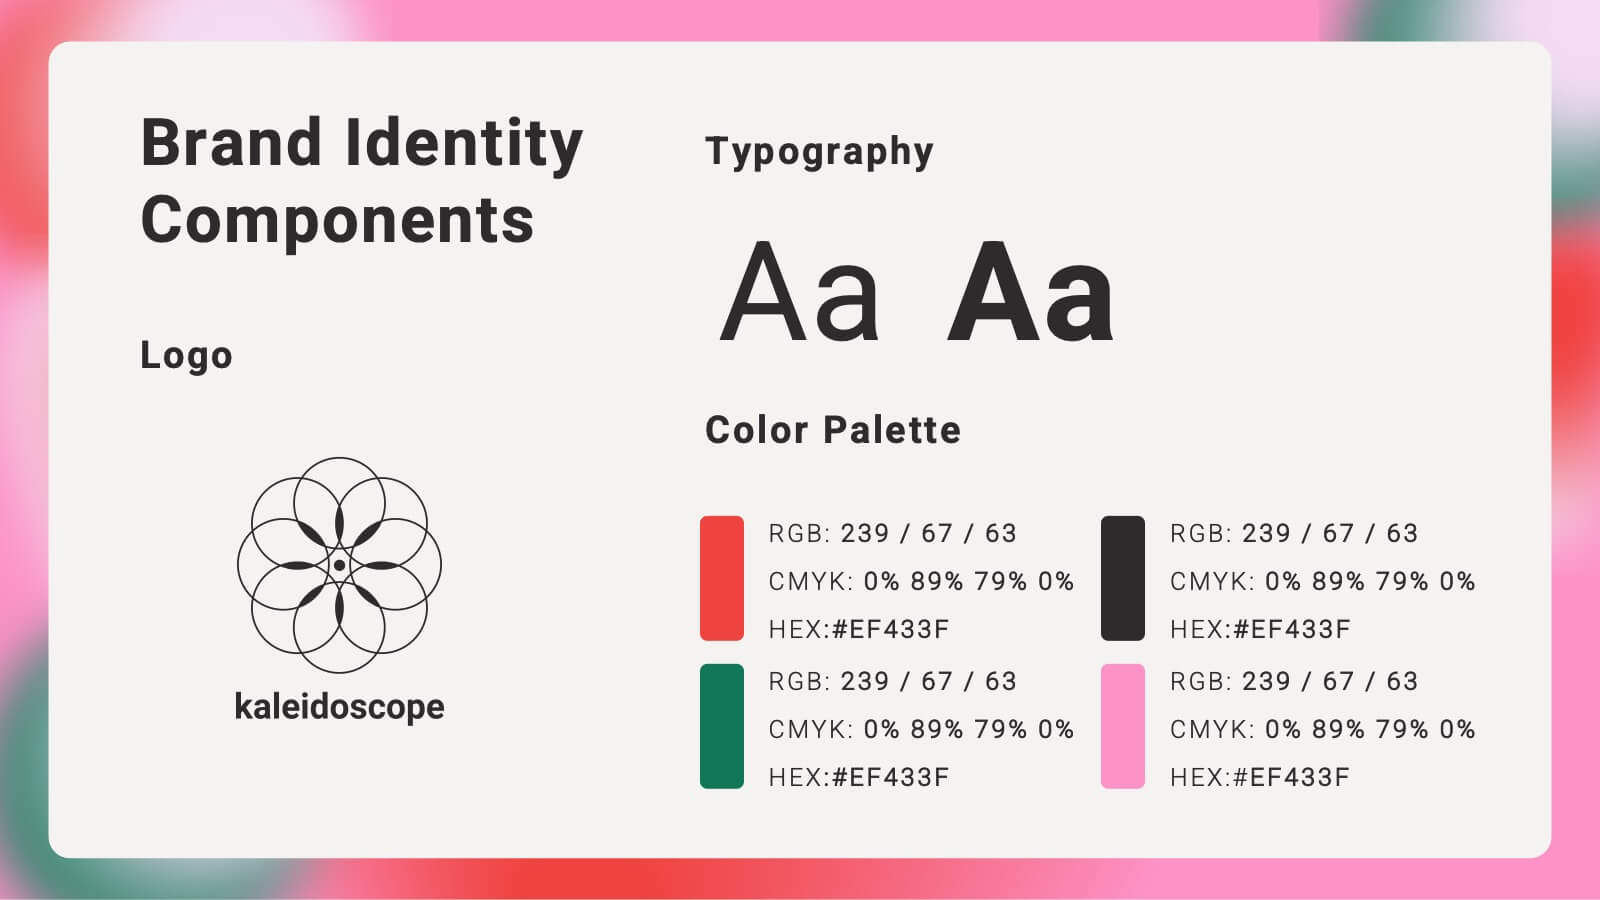
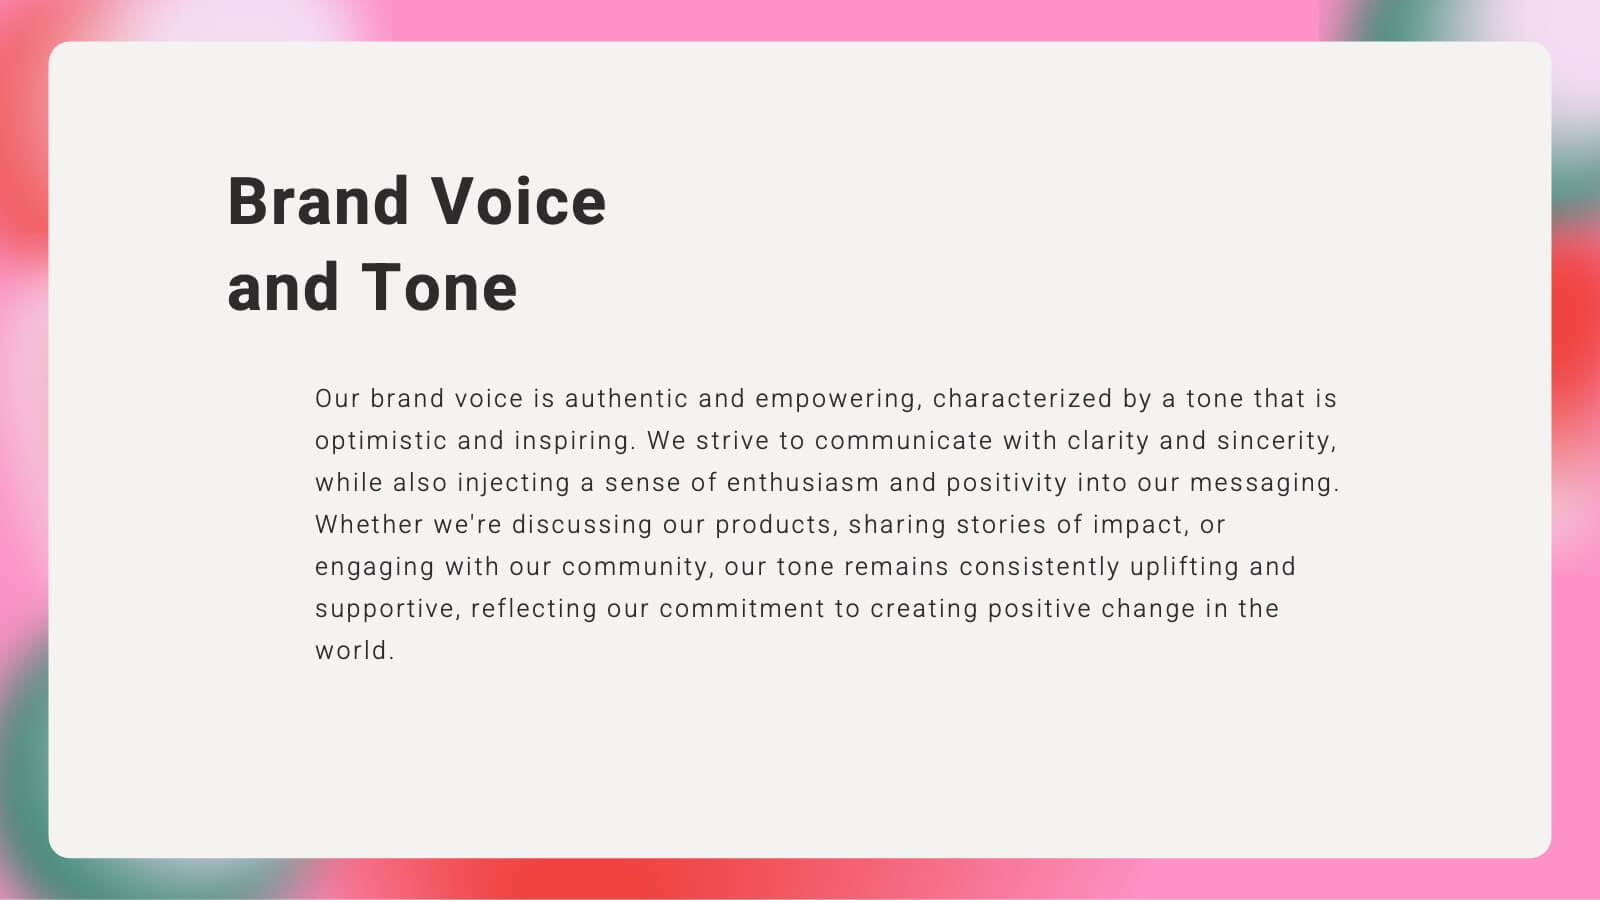
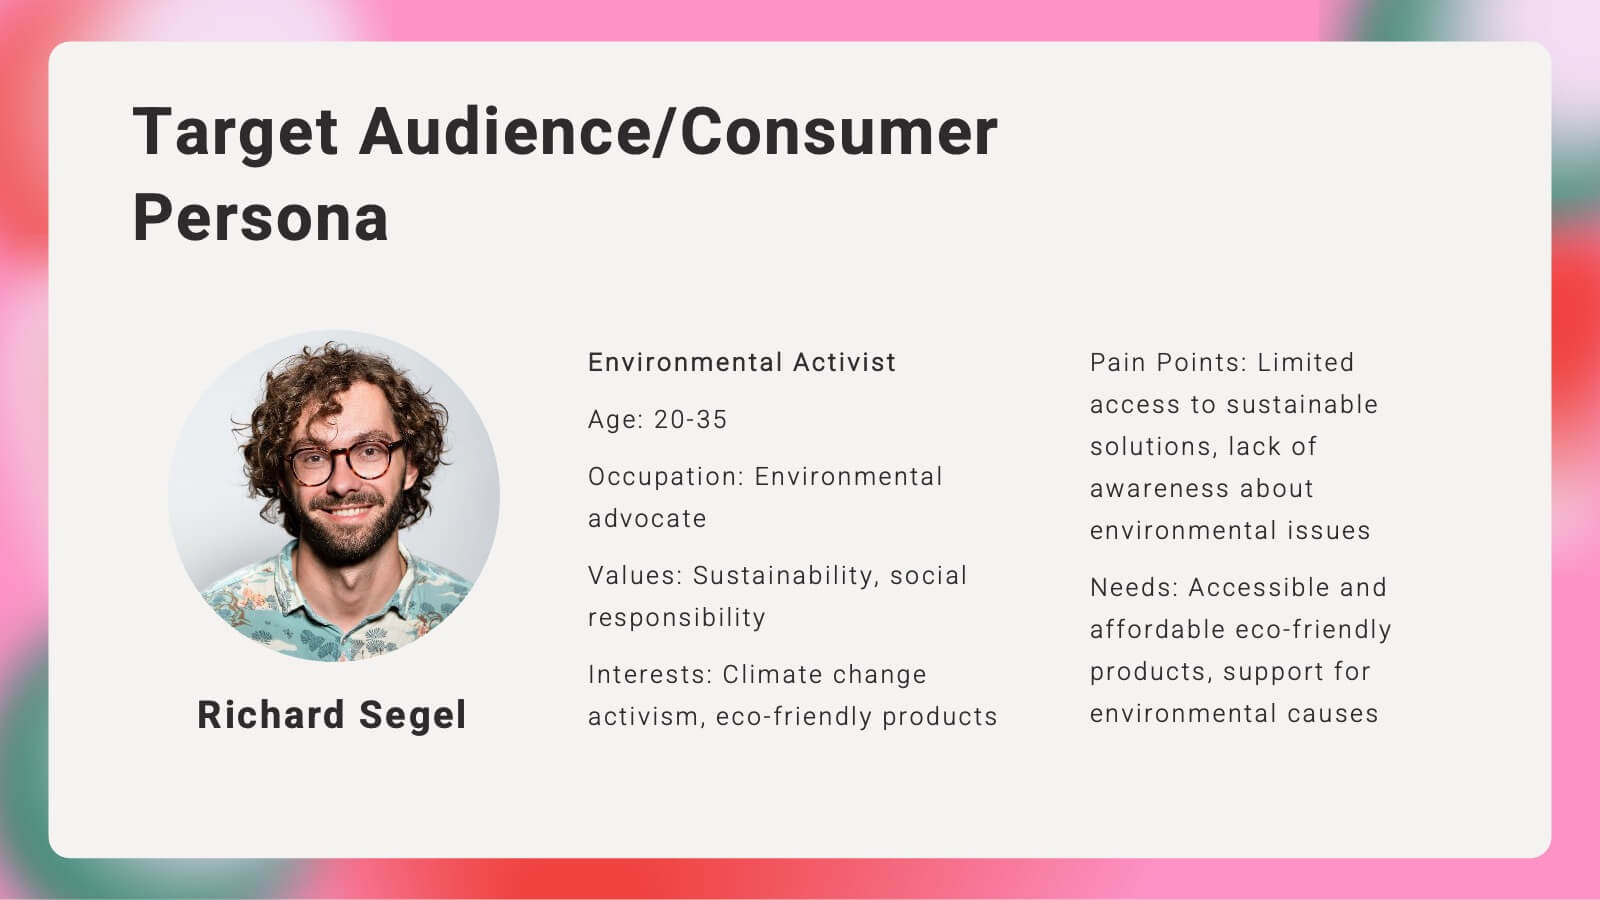
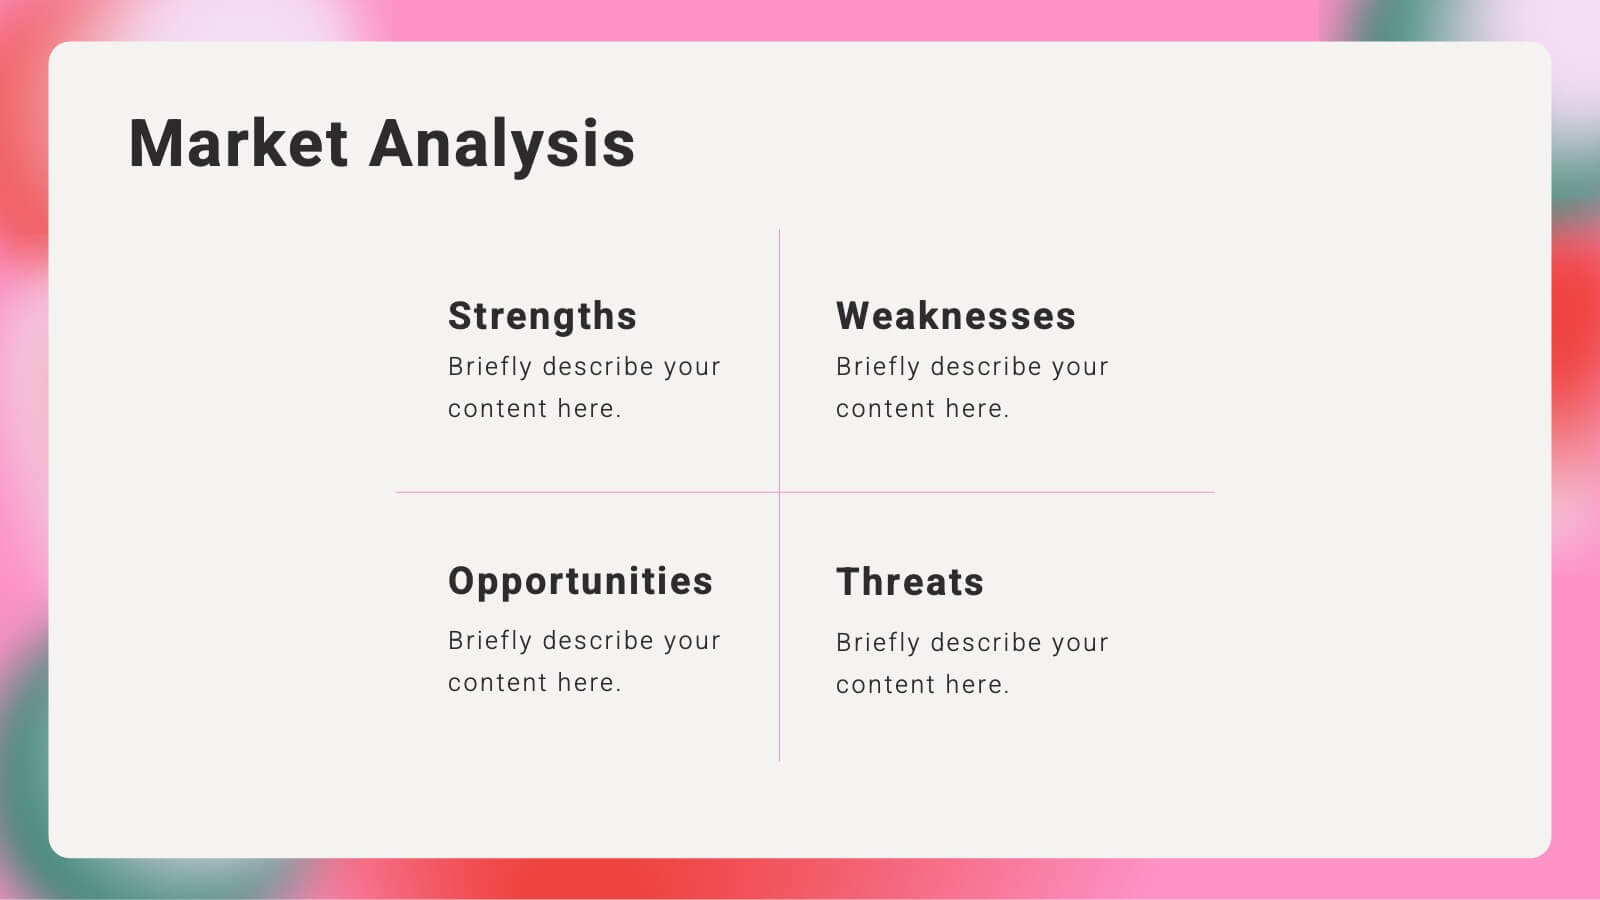
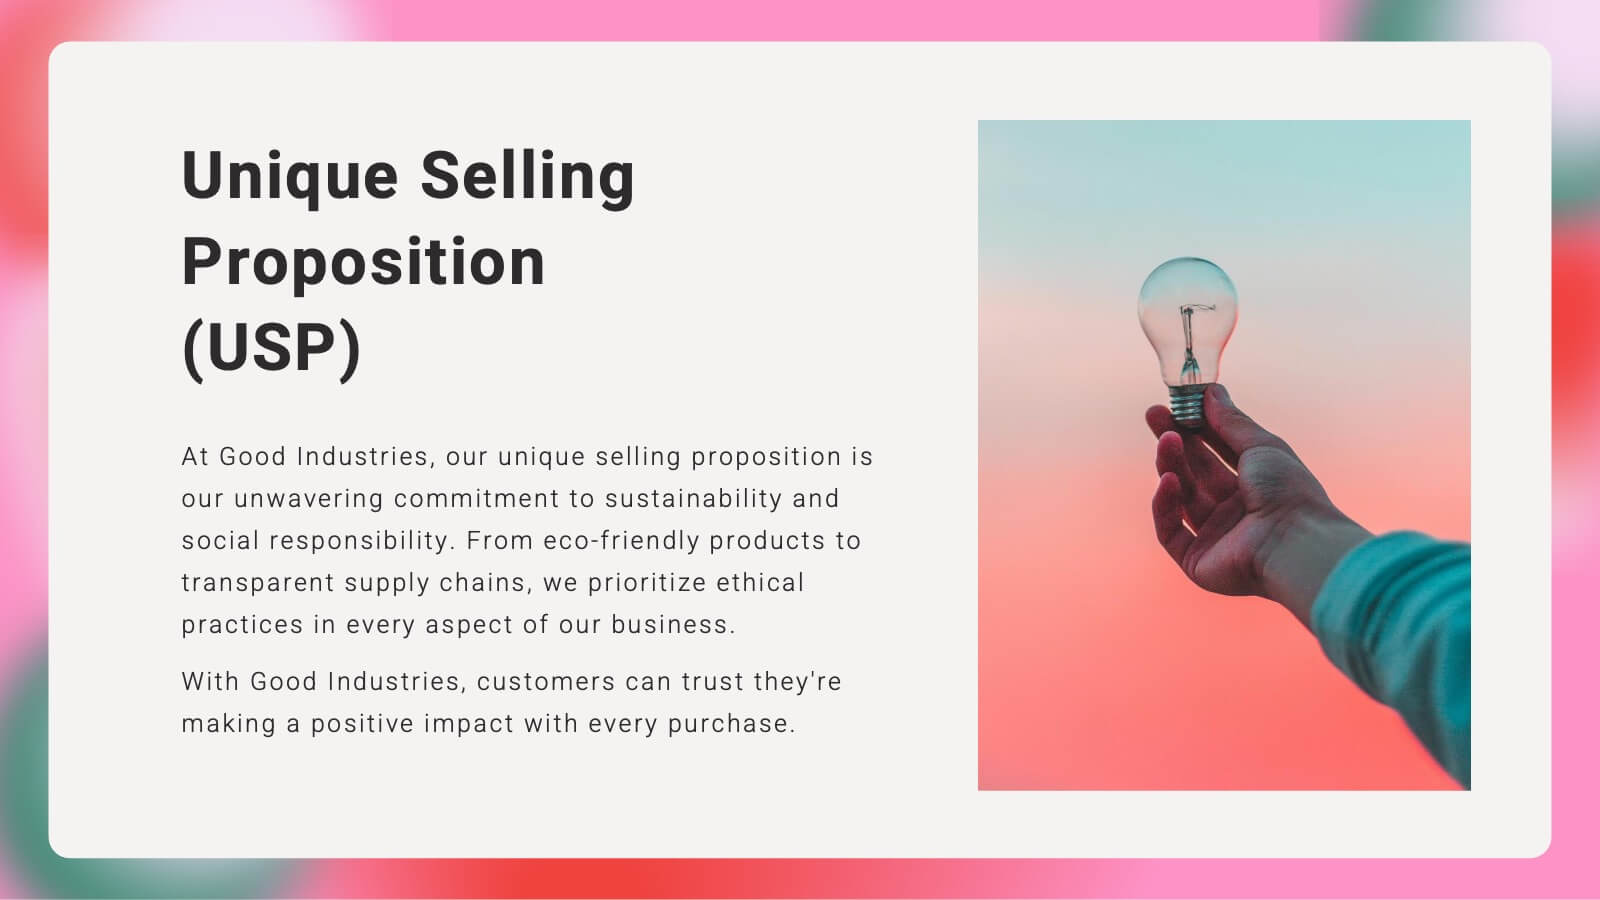
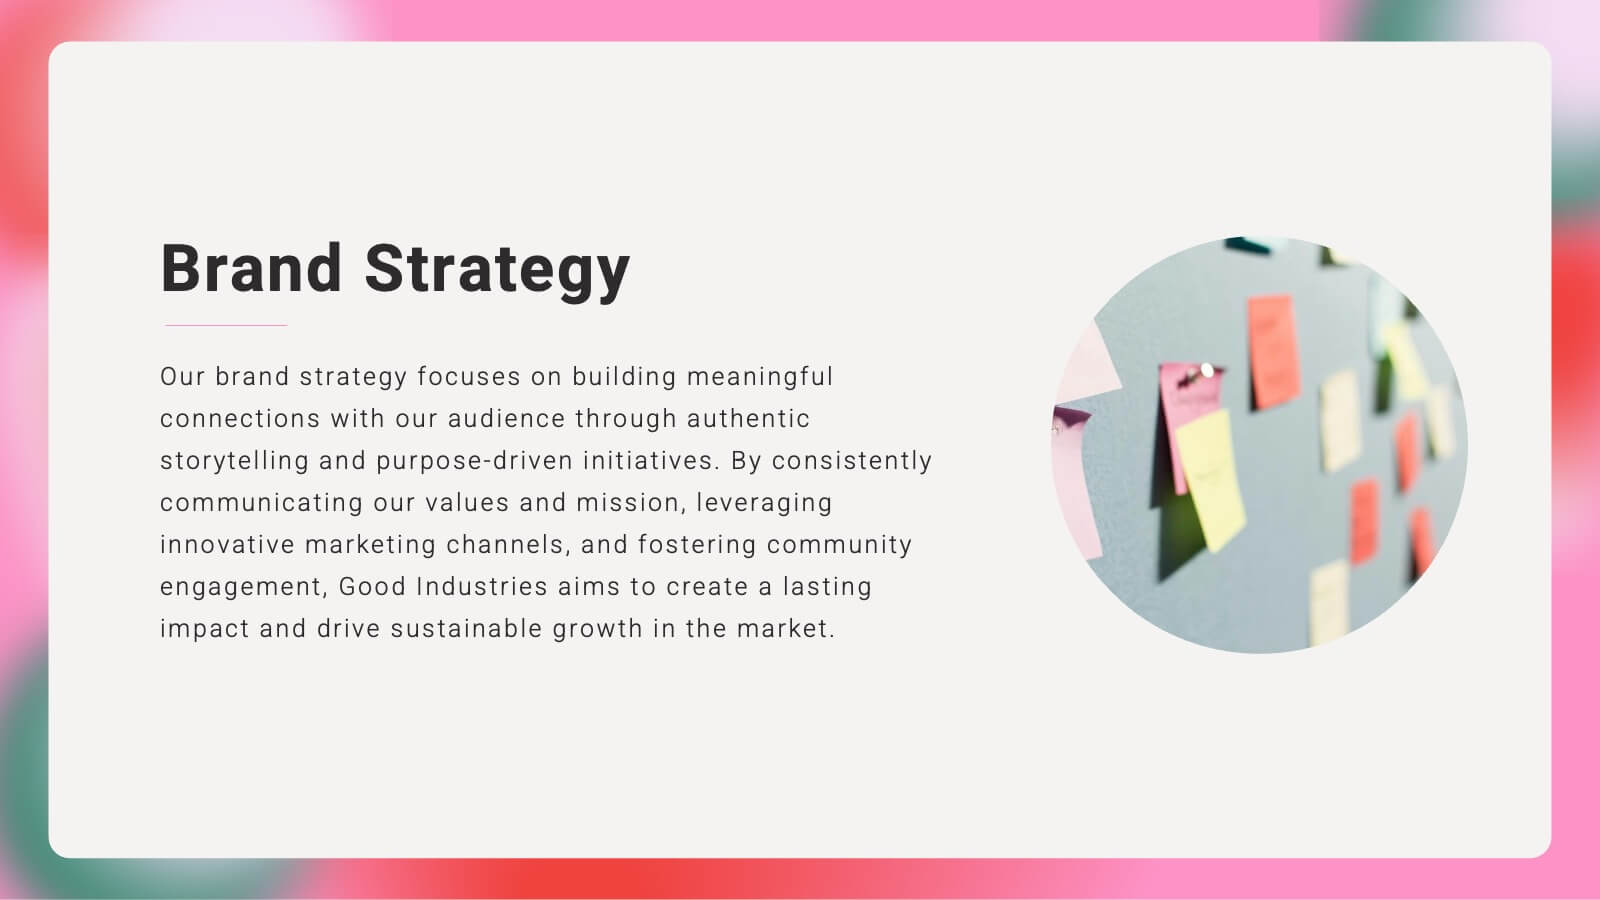
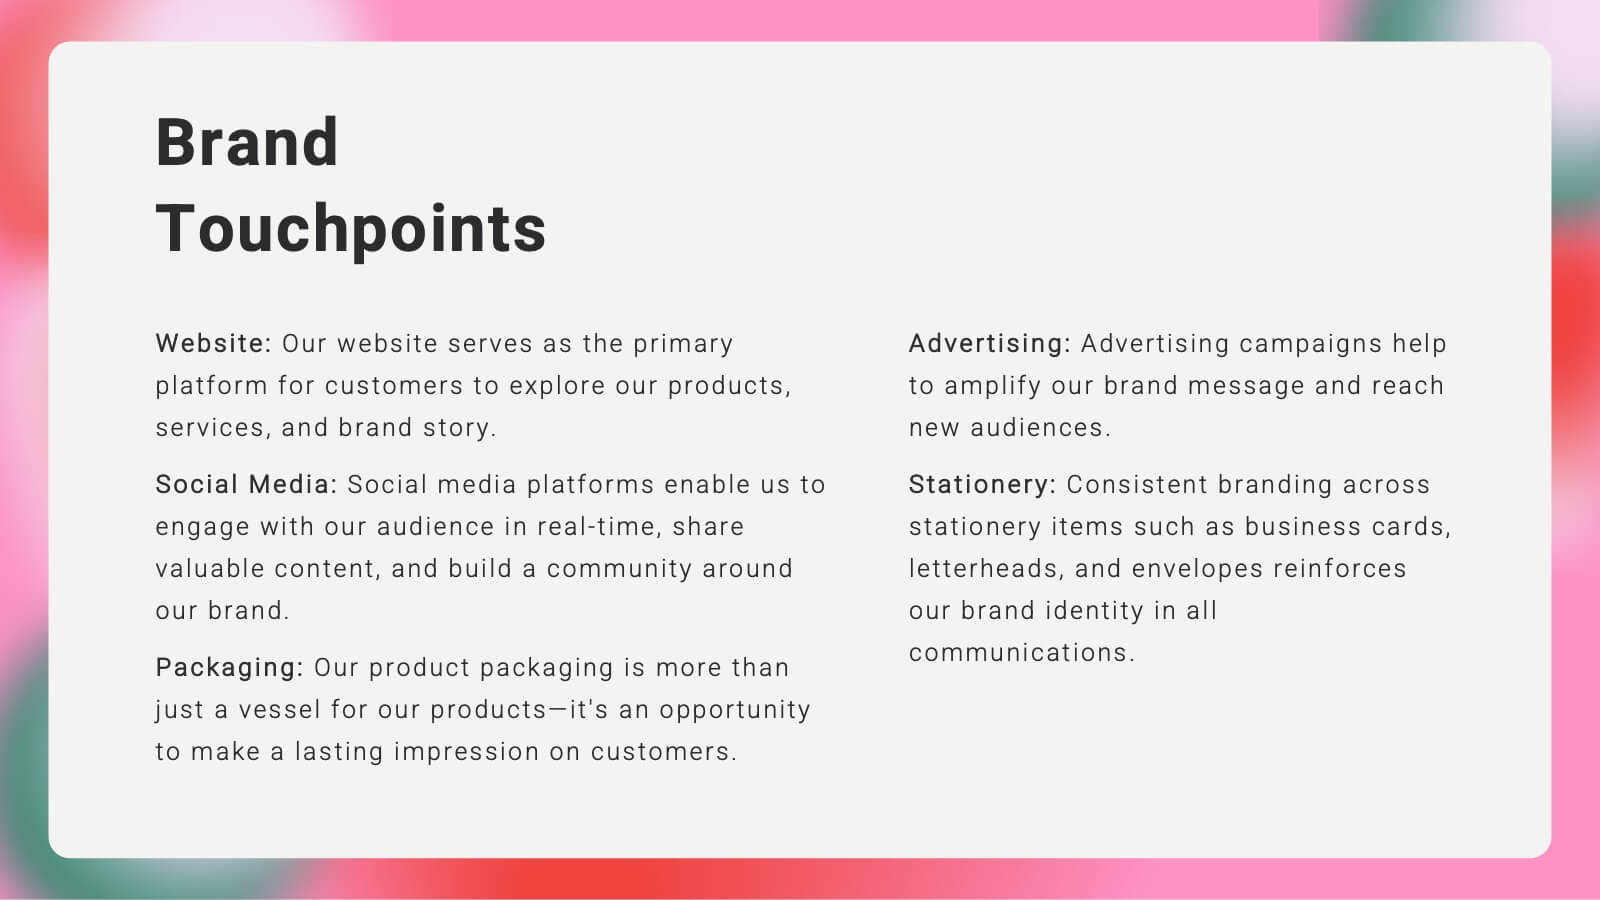
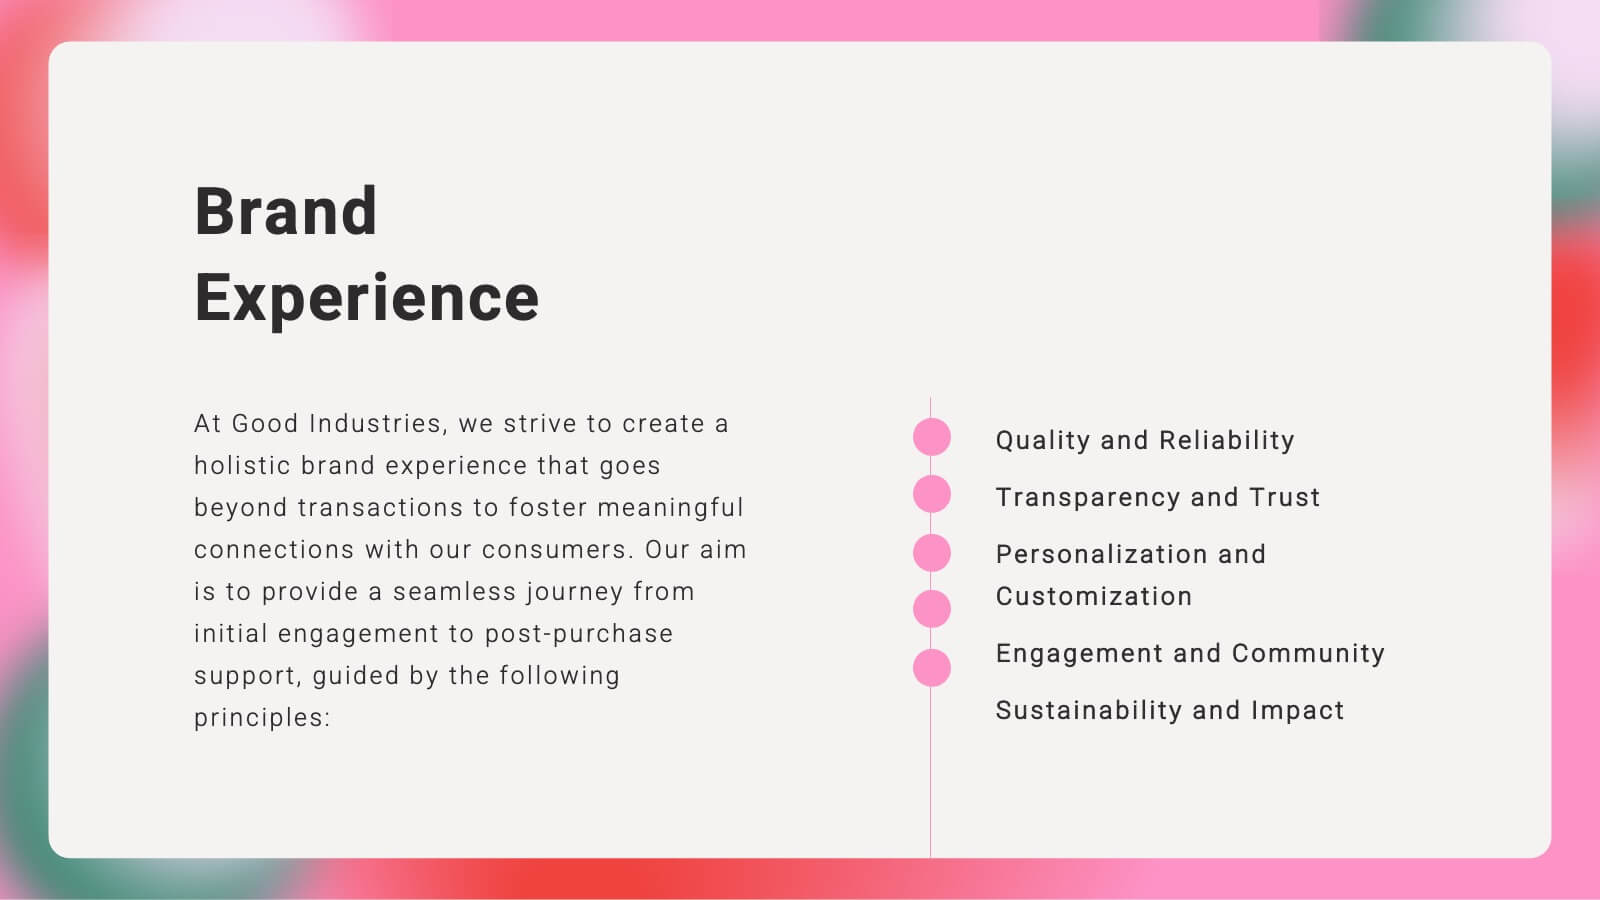
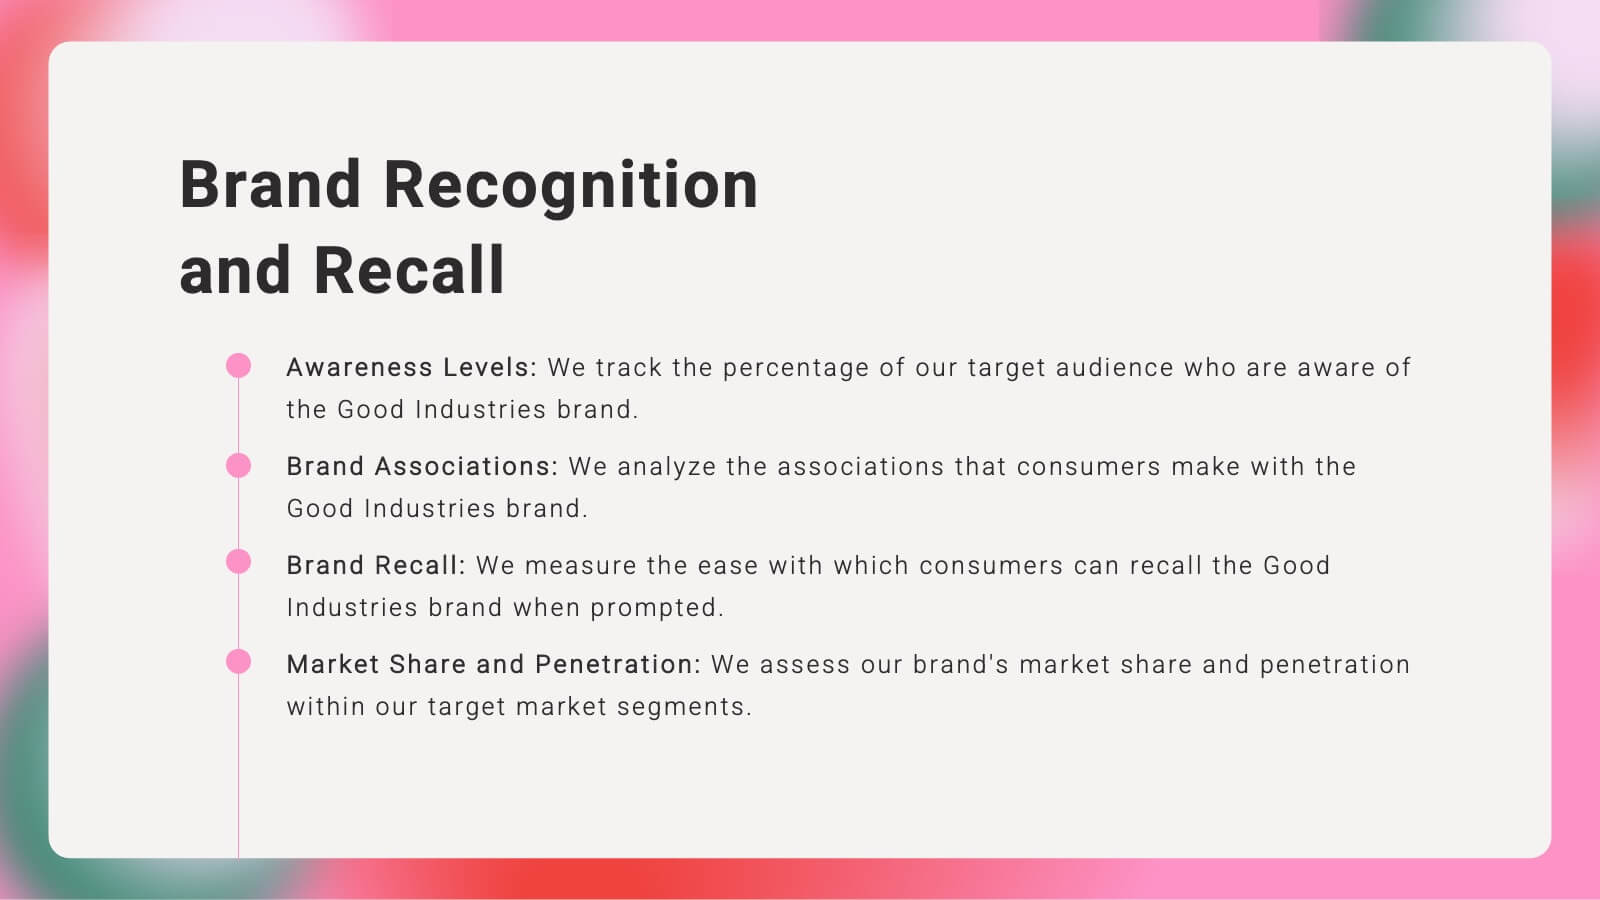
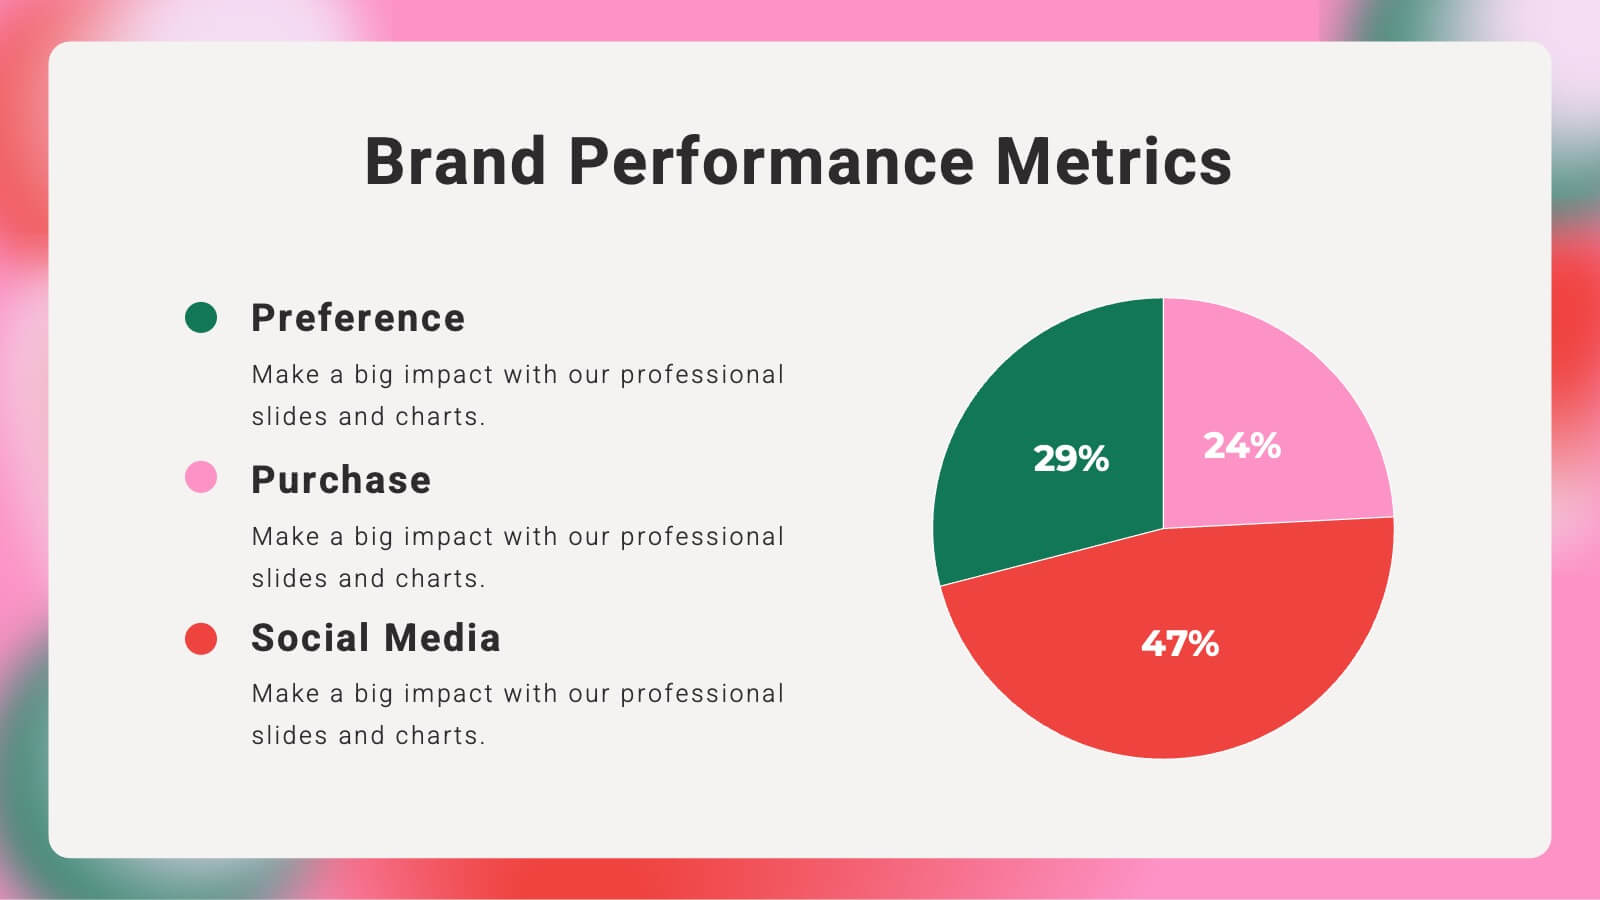
Kaleidoscope Brand Strategy Report Presentation
Craft a compelling narrative for your brand with this vibrant brand strategy presentation template. Designed to cover every facet of brand development, from vision and mission to market analysis and consumer personas, this template is an essential tool for businesses looking to establish a strong brand identity. It incorporates visually engaging slides that outline brand voice, values, and touchpoints, facilitating a thorough understanding of strategic branding. Compatible with platforms like PowerPoint, Google Slides, and Keynote, it is accessible across various devices, making it perfect for collaborative planning and presentations.


6 slides
Travel Insurance Infographics
Our "Travel Insurance" infographic template, compatible with PowerPoint, Keynote, and Google Slides, is crafted for insurance companies, travel agencies, and financial advisors. This template is an excellent tool for explaining the benefits and details of travel insurance to clients and customers. The template comprehensively covers vital elements such as coverage options, emergency assistance services, and claim procedures. Its clear and organized layout makes it easy to convey complex insurance information in a manner that is both accessible and engaging. This is particularly useful for presentations aimed at educating travelers about the importance and benefits of travel insurance. Designed with a bright and inviting travel-themed color scheme, the template incorporates elements that reflect global travel and security. This not only makes the presentation visually appealing but also resonates with the theme of travel and protection. Whether used in client consultations, marketing materials, or informational workshops, this template ensures that the key aspects of travel insurance are presented clearly and attractively.