


Features
- 4 Unique slides
- Fully editable and easy to edit in Microsoft Powerpoint, Keynote and Google Slides
- 16:9 widescreen layout
- Clean and professional designs
- Export to JPG, PDF or send by email


Do you have any questions?
Recommend


10 slides
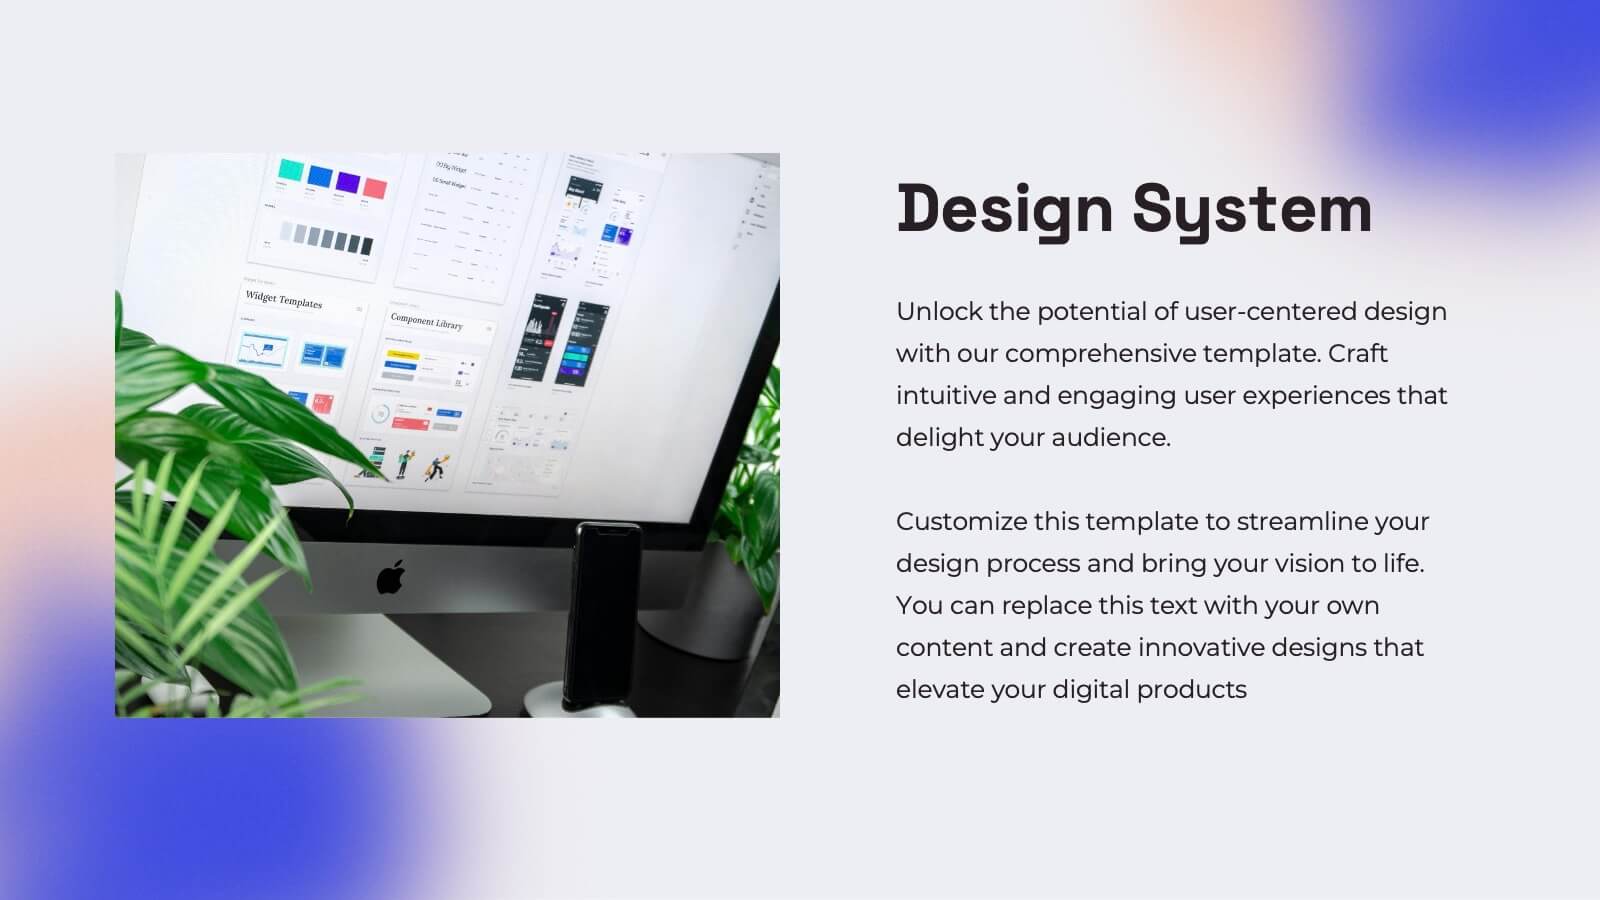
Effective Leadership Strategy Presentation
Unveil the secrets to transformative leadership with our Effective Leadership Strategy Presentation. This template guides you through essential leadership stages with visually engaging graphics, ideal for molding influential leaders. Fully compatible with PowerPoint, Keynote, and Google Slides, it's perfect for enhancing your leadership training sessions.


4 slides
Product Launch Schedule Timeline Presentation
Showcase your product rollout with this vertical rocket-themed timeline. Ideal for startups, marketing teams, or product managers, it highlights four key stages with icons and editable text. The cloud-based design adds visual flair while maintaining clarity. Fully customizable in PowerPoint, Keynote, and Google Slides to suit your launch plan.


4 slides
Meetings Agenda Slide Presentation
Make every meeting feel purposeful with a clean layout that highlights topics, timing, and key discussion points effortlessly. This presentation helps teams stay aligned, organized, and ready to follow the flow of the session. Perfect for planning or reporting. Fully compatible with PowerPoint, Keynote, and Google Slides.


20 slides
Sylph Design Portfolio Presentation
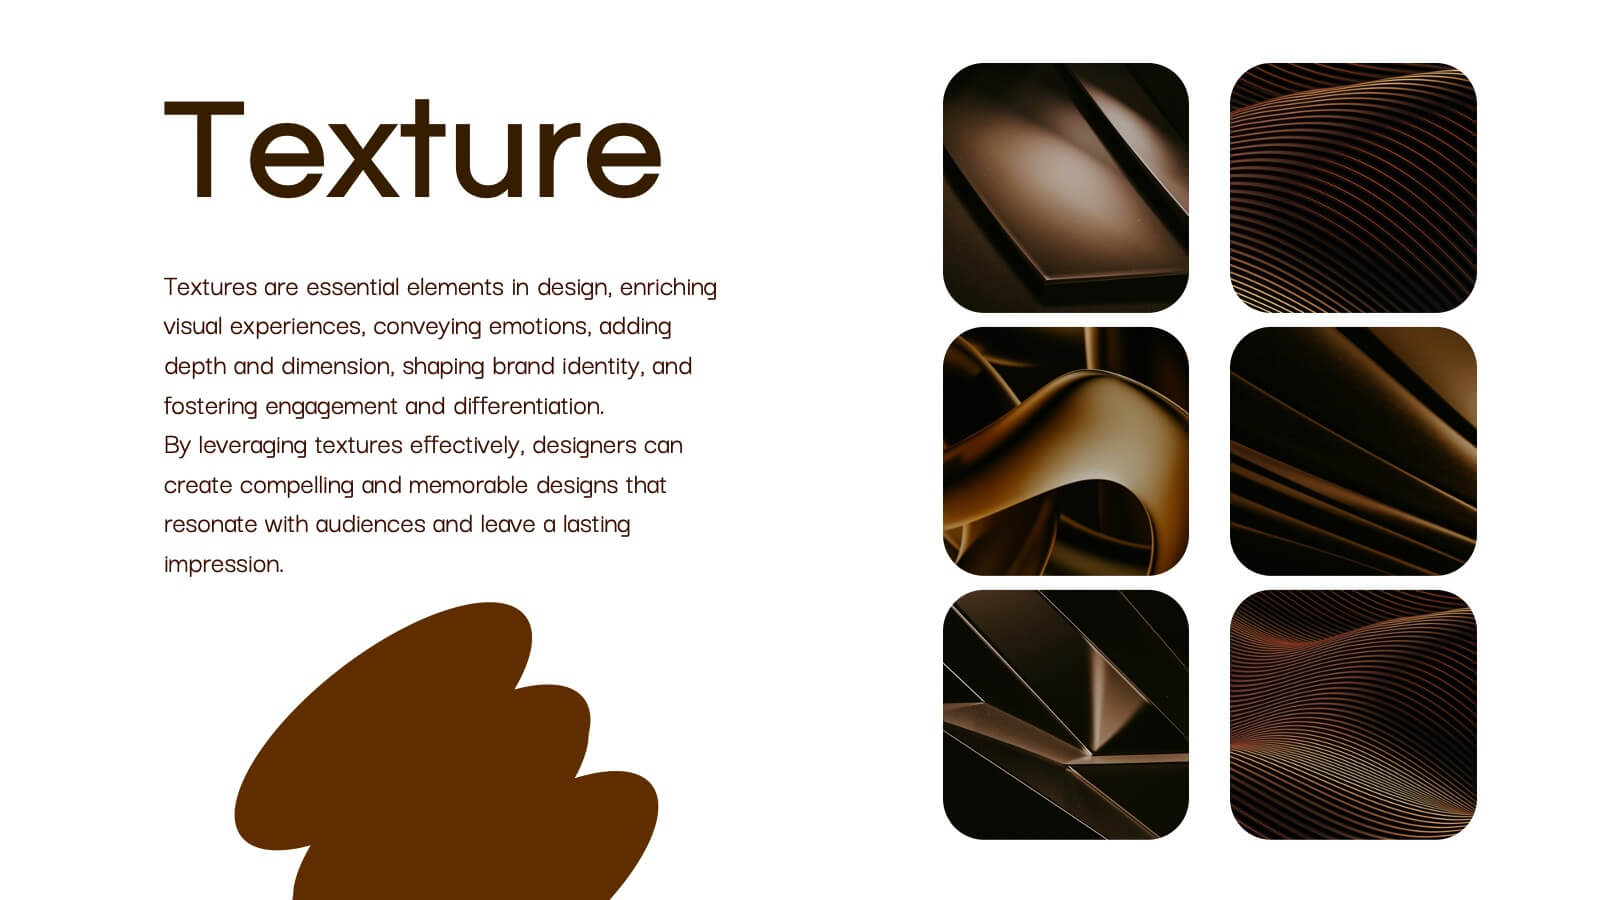
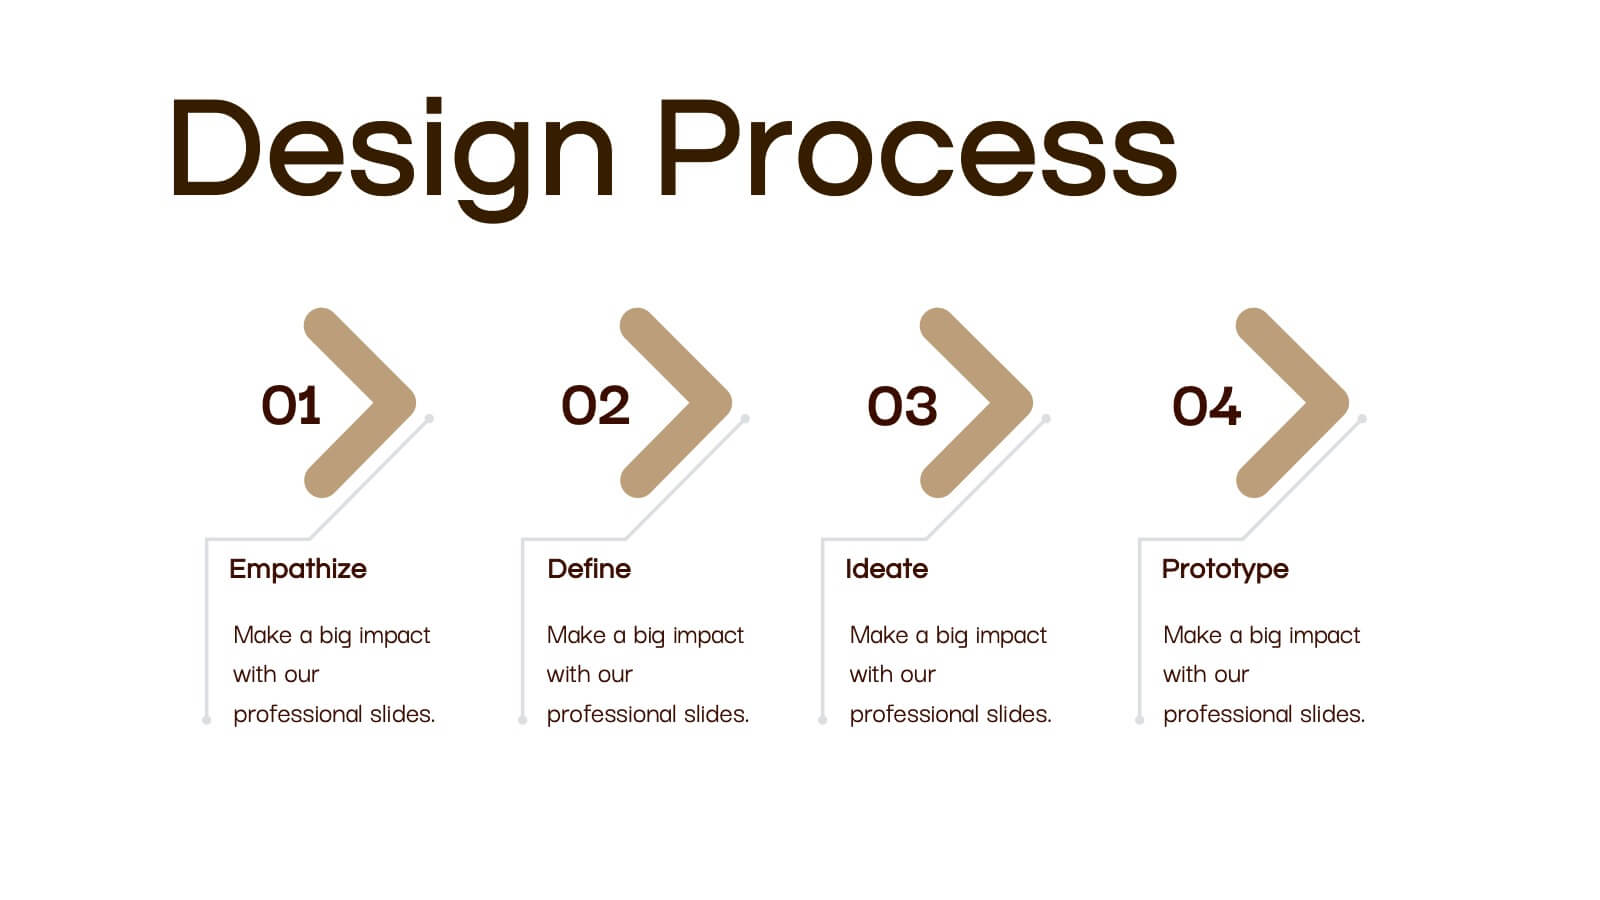
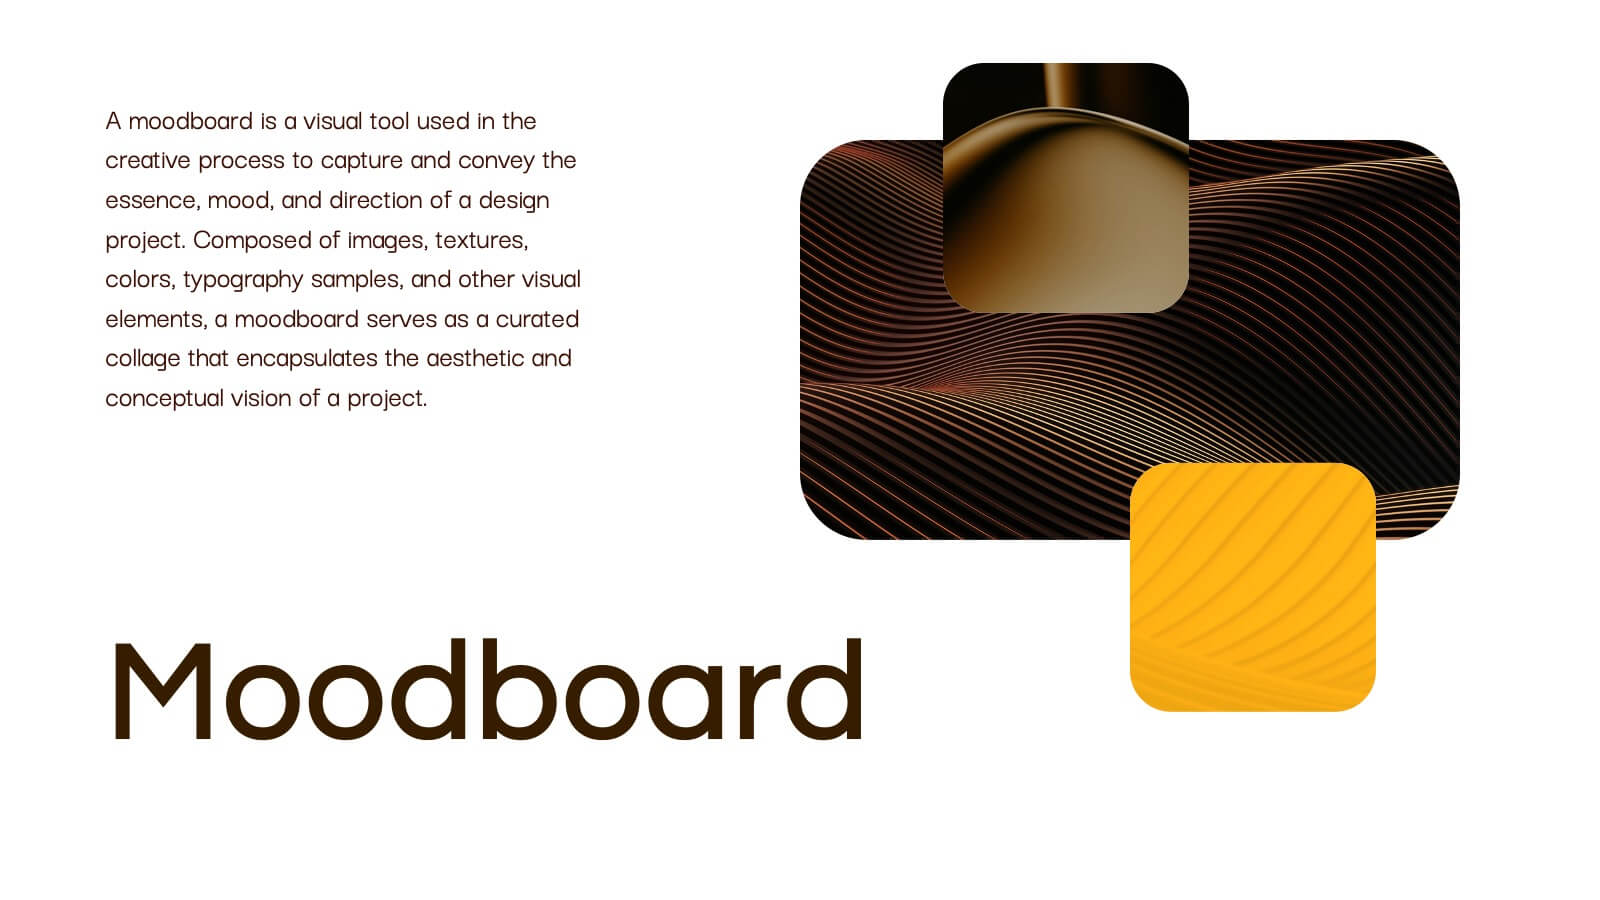
Dive into a creative journey with this visually striking design portfolio presentation template! Ideal for showcasing design processes, mood boards, and final outcomes, it’s perfect for impressing clients or stakeholders. Highlight your design skills and methodology with this modern, sleek format. Compatible with PowerPoint, Keynote, and Google Slides for seamless integration into your workflow.


4 slides
Lead Nurturing Funnel Breakdown Presentation
Guide leads through every stage with the Lead Nurturing Funnel Breakdown Presentation. This slide visualizes the customer journey from awareness to conversion, helping you present marketing automation, CRM strategies, or content funnels. Fully customizable in PowerPoint, Google Slides, and Canva for seamless integration.


21 slides
Literati Research Proposal Presentation
Present your research proposal with confidence using this professionally crafted template, designed to streamline complex ideas into a cohesive, engaging narrative. With a modern design and dynamic visuals, it ensures your research objectives and findings are communicated effectively. The template includes sections for your introduction, background, methodology, data collection, analysis, and key findings, giving your proposal a logical structure. Use the literature review and data visualization slides to back up your arguments with credible sources and compelling graphics. Dedicated slides for conclusions, recommendations, and implications allow you to outline the impact of your research clearly. Fully editable in PowerPoint, Google Slides, and Keynote, this template adapts effortlessly to your needs. Perfect for academic, corporate, or professional research presentations, it combines sleek design with functionality to ensure your proposal resonates with your audience. Take your research to the next level with a template that reflects your dedication to excellence.


5 slides
Strengths, Weaknesses, Opportunities & Threats Presentation
Visualize your SWOT analysis with clarity using the Strengths, Weaknesses, Opportunities & Threats Presentation. This editable puzzle-style slide makes it easy to present key insights and strategic positioning in a visually engaging format. Compatible with PowerPoint, Canva, and Google Slides for seamless customization and professional business planning.


21 slides
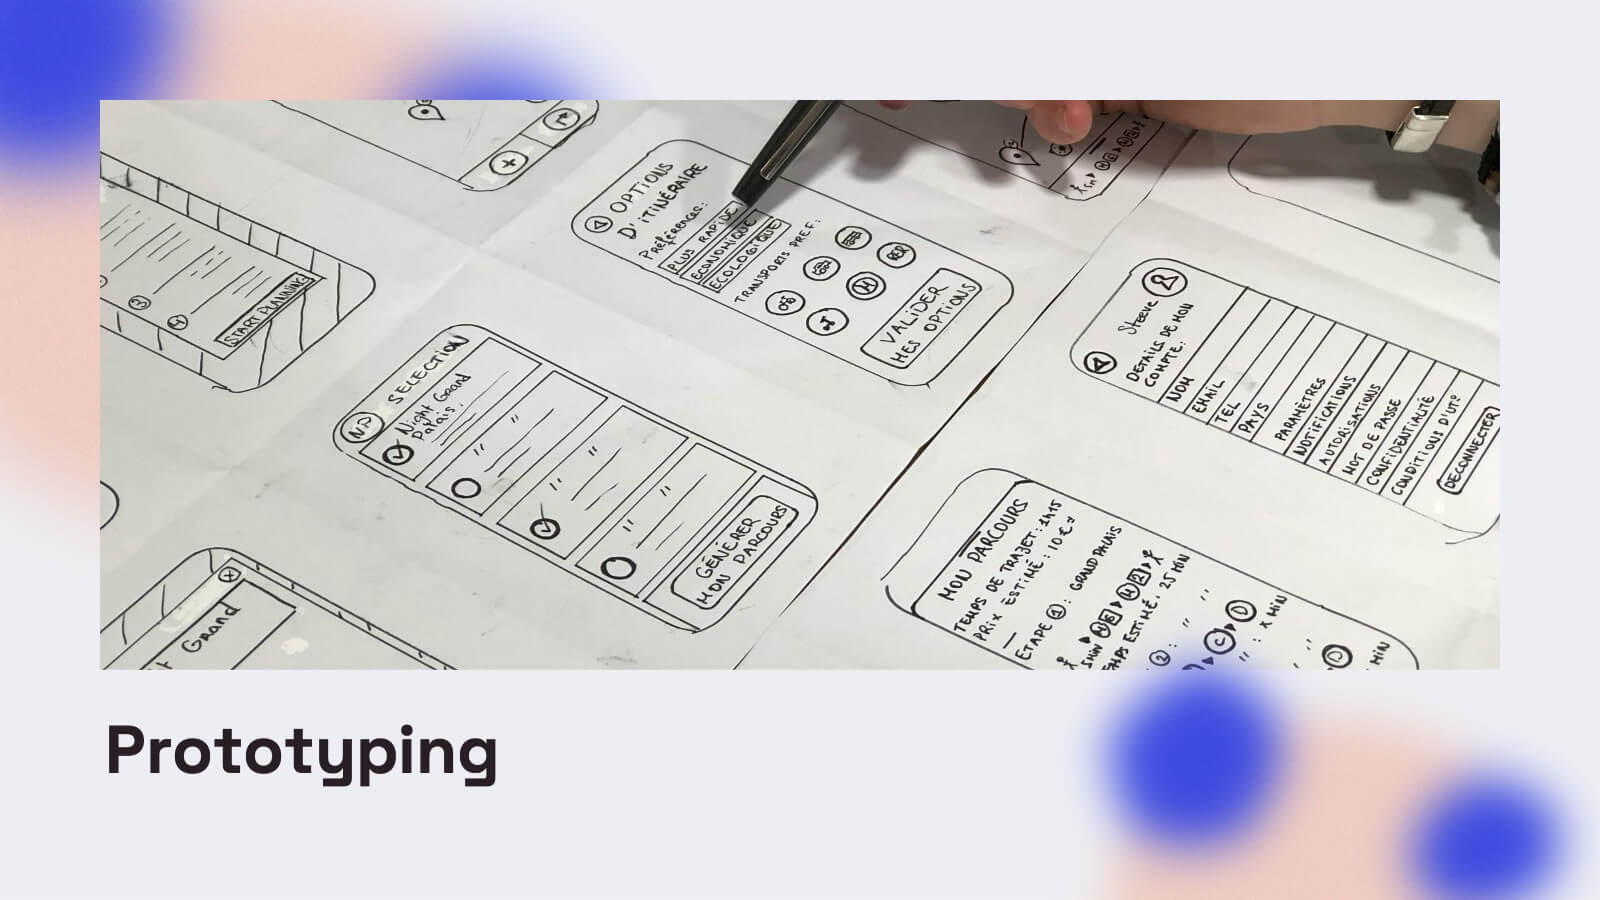
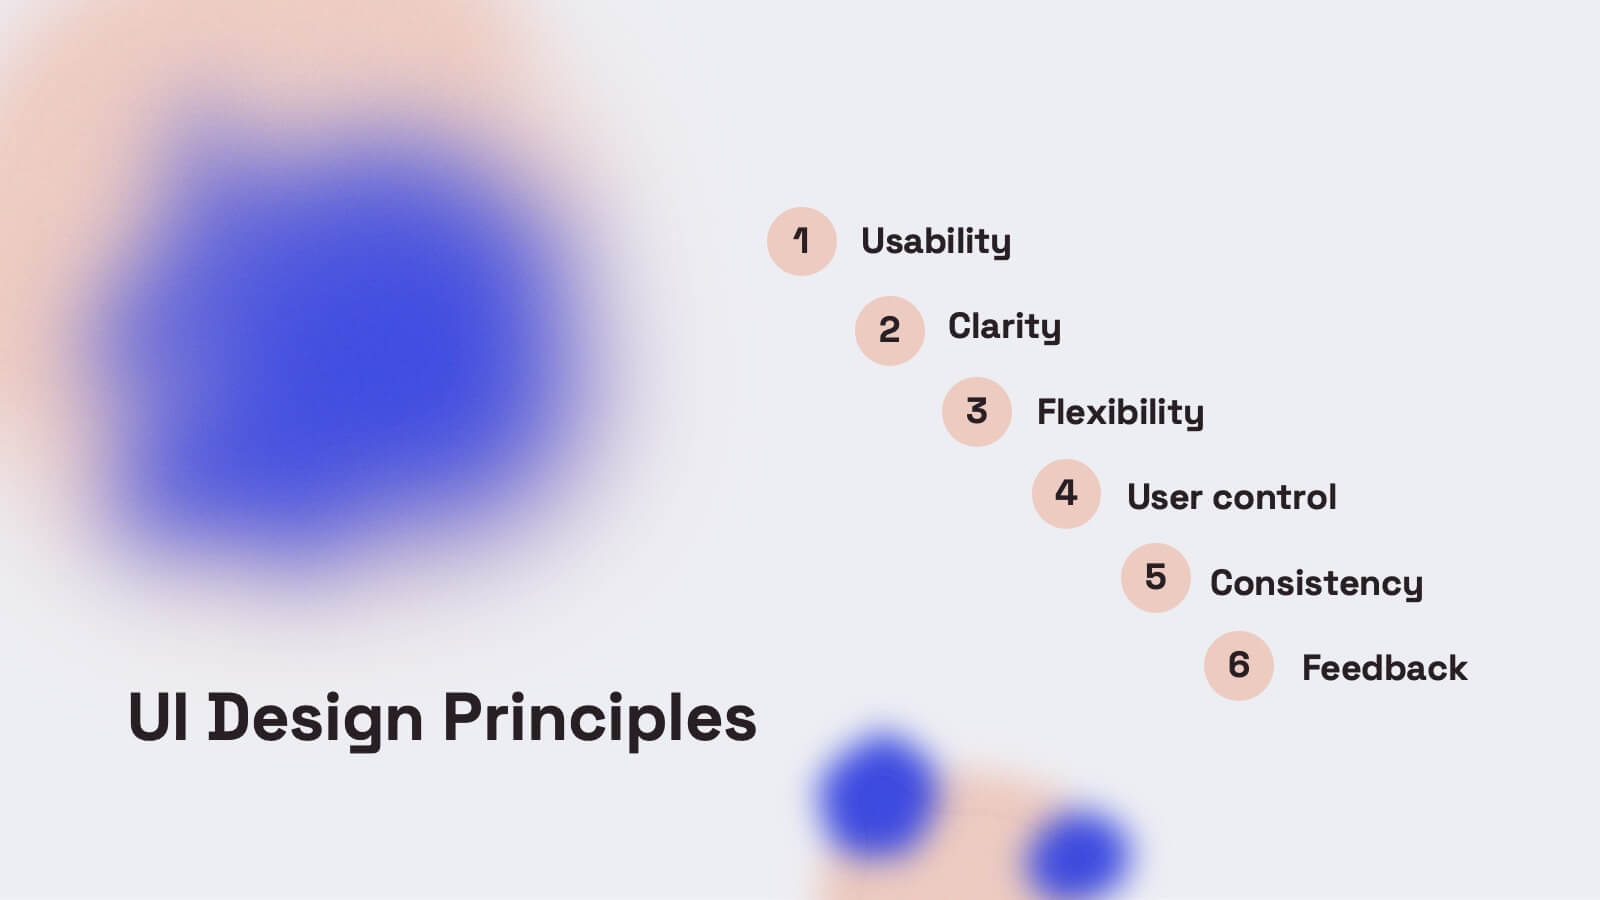
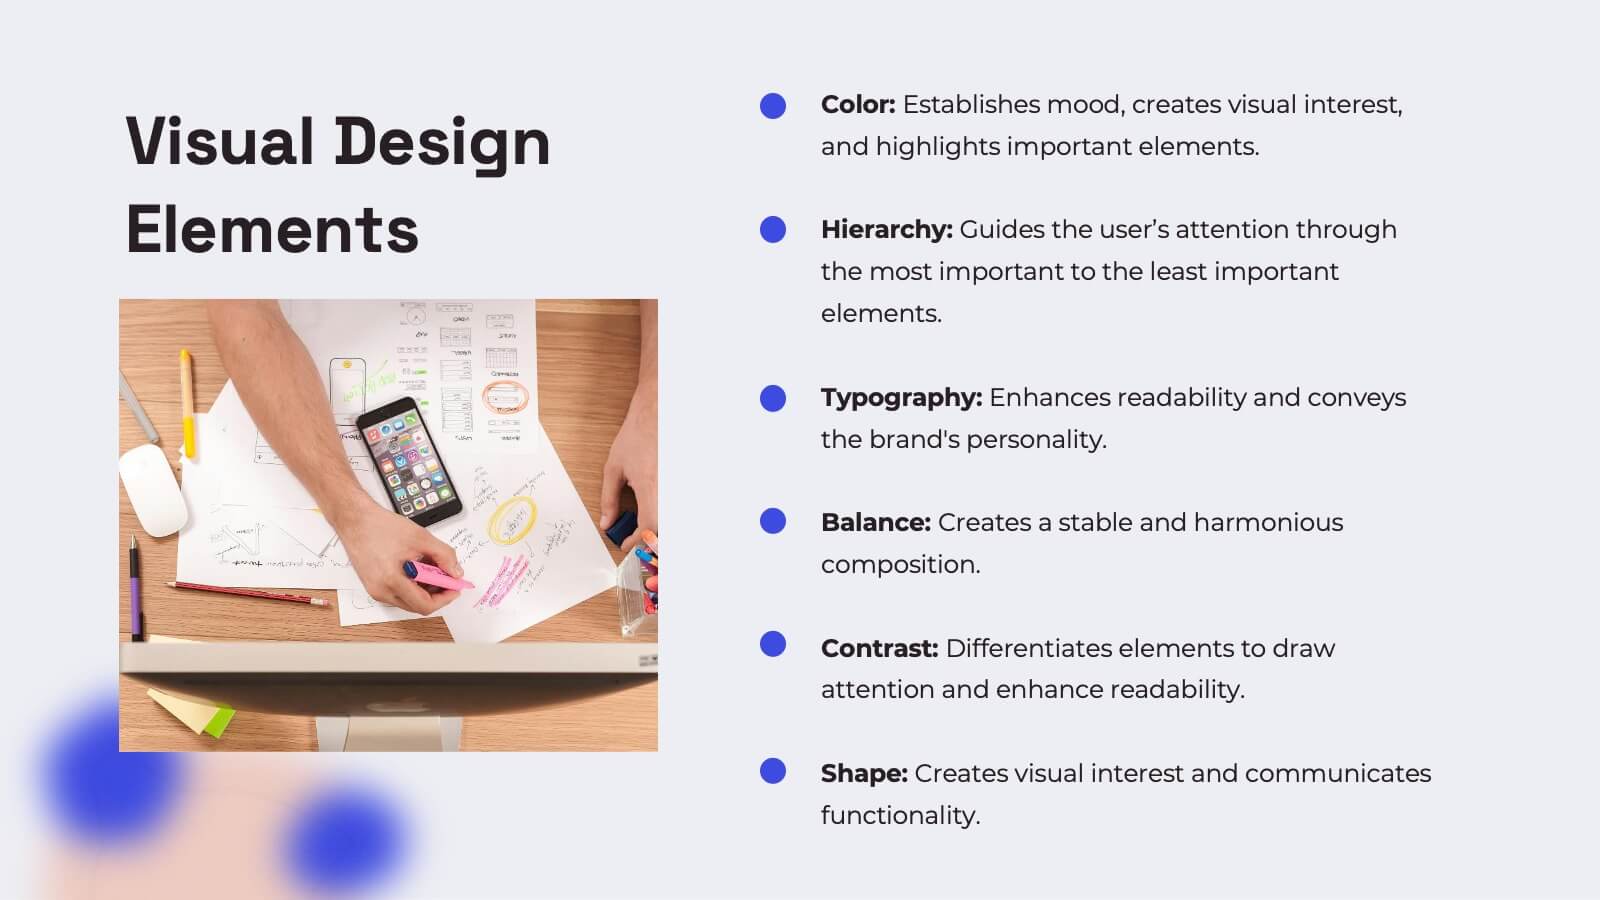
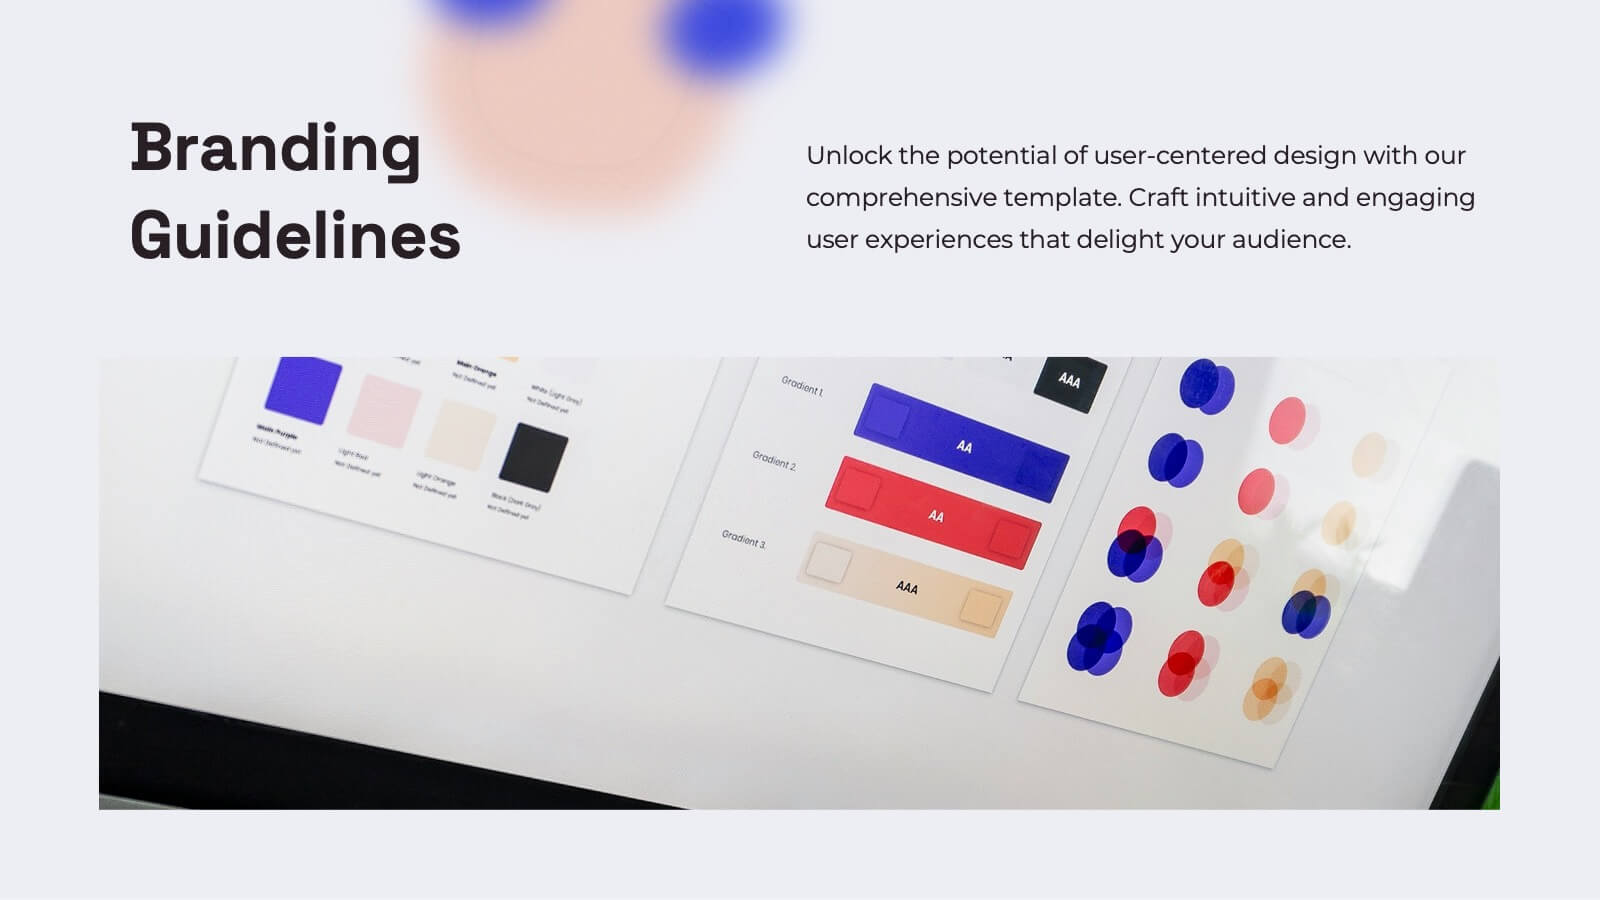
Mystic UX Research Report Presentation
Present your UX research with precision using this sleek and engaging report template! It covers key elements like user research, wireframes, prototyping, testing, and branding guidelines, providing a comprehensive overview of the design process. Ideal for client reviews or team discussions, this template is fully compatible with PowerPoint, Keynote, and Google Slides.


5 slides
Business Revenue and Expense Analysis Presentation
Present your financial growth and cost breakdowns with this 3D bar chart layout. Each bar is paired with clearly labeled sections to explain key revenue sources, expense categories, or profit margins. Ideal for business reviews, financial proposals, or investor reports. Fully editable in PowerPoint, Keynote, and Google Slides.


20 slides
Legendra Artist Portfolio Presentation
Showcase your creative journey with this dynamic artist portfolio presentation template. Highlight your featured projects, creative process, collaborations, and pricing in a visually engaging format. Perfect for artists, designers, and creative professionals looking to impress potential clients. Fully editable in PowerPoint, Keynote, and Google Slides.
20 slides
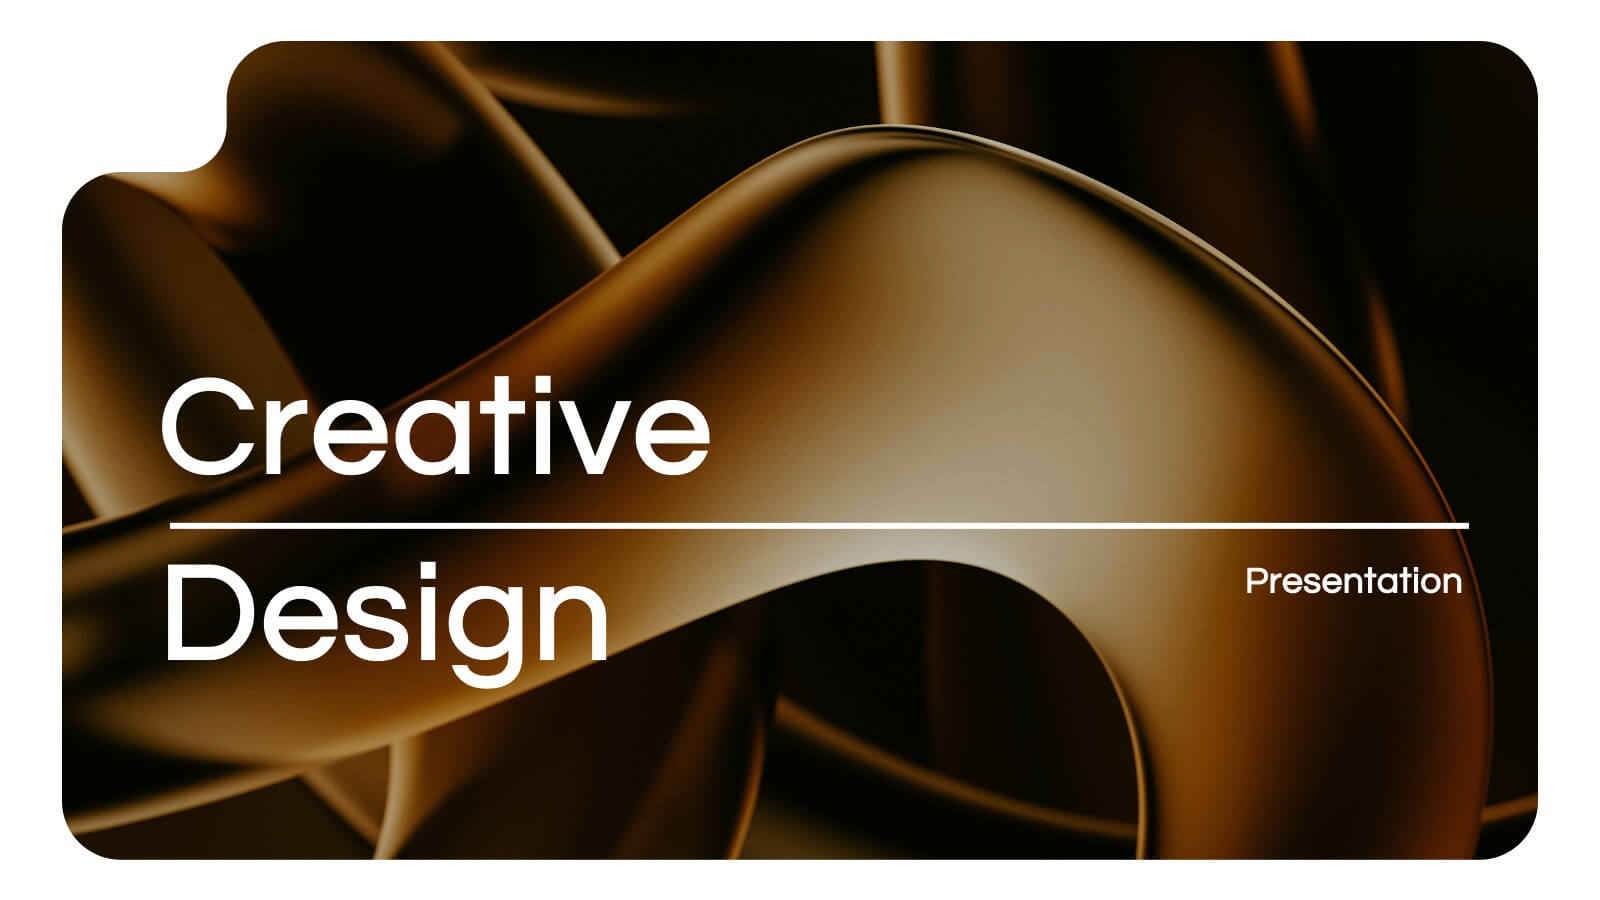
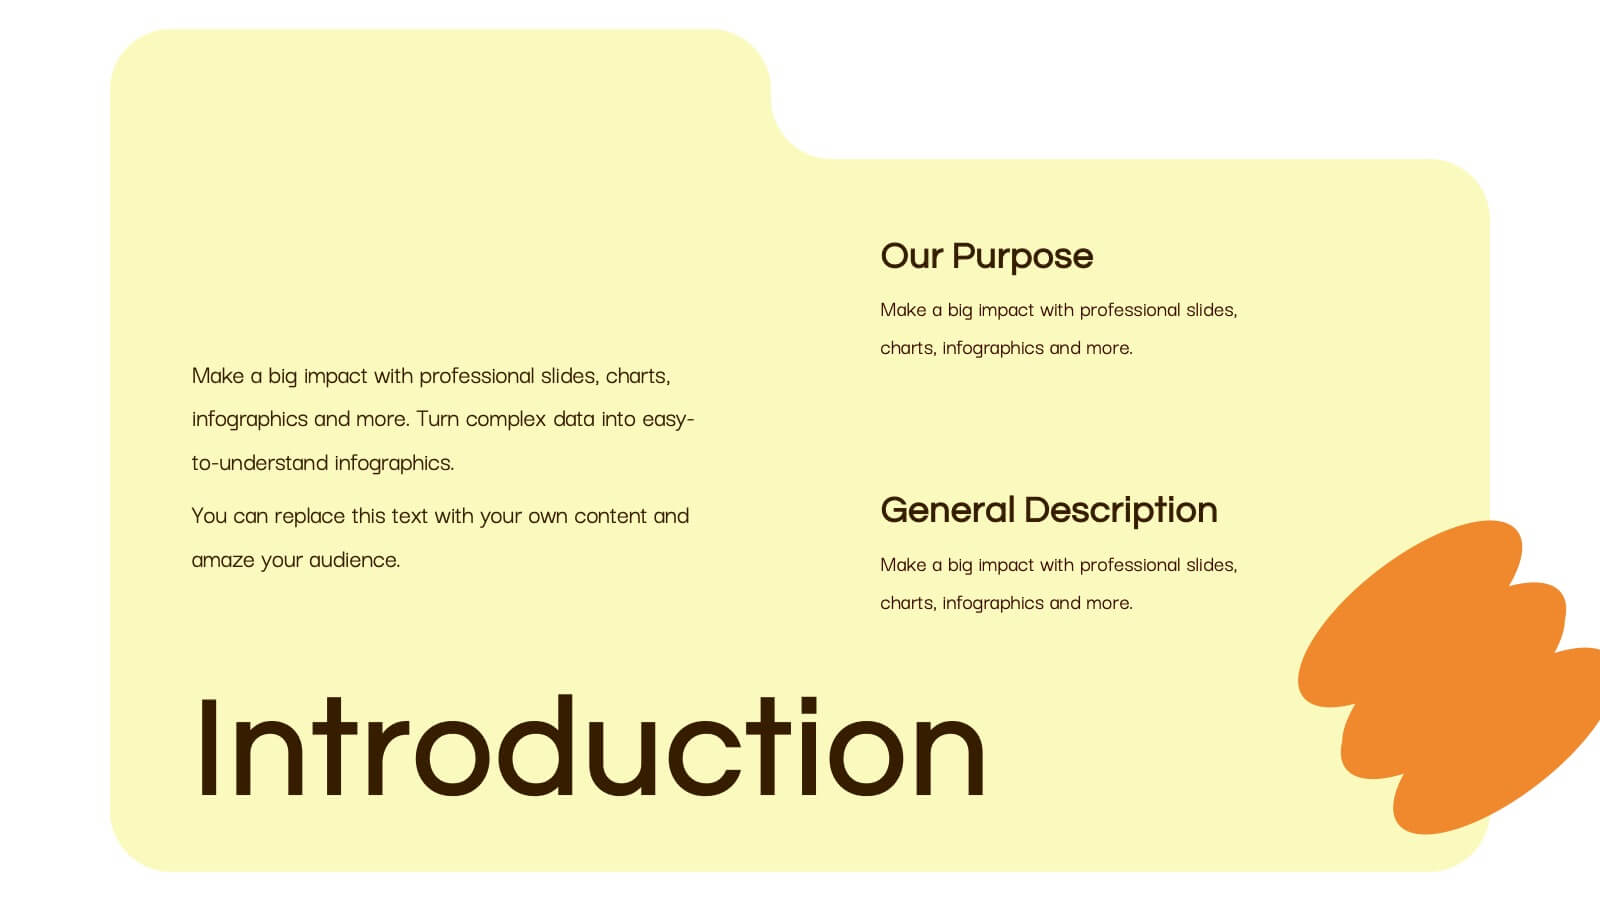
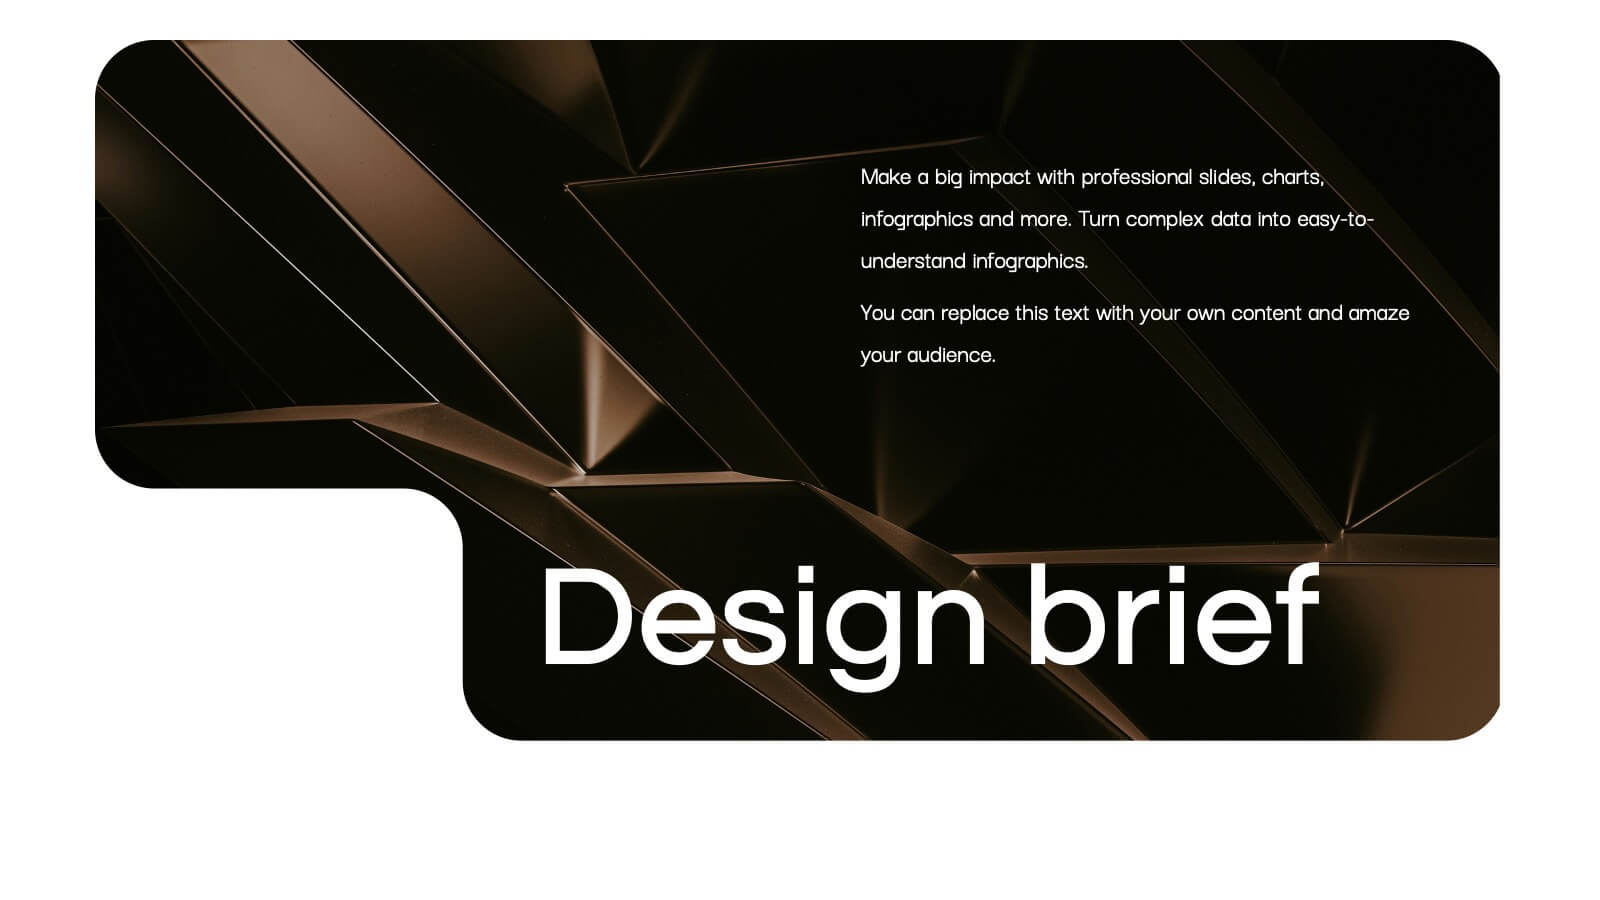
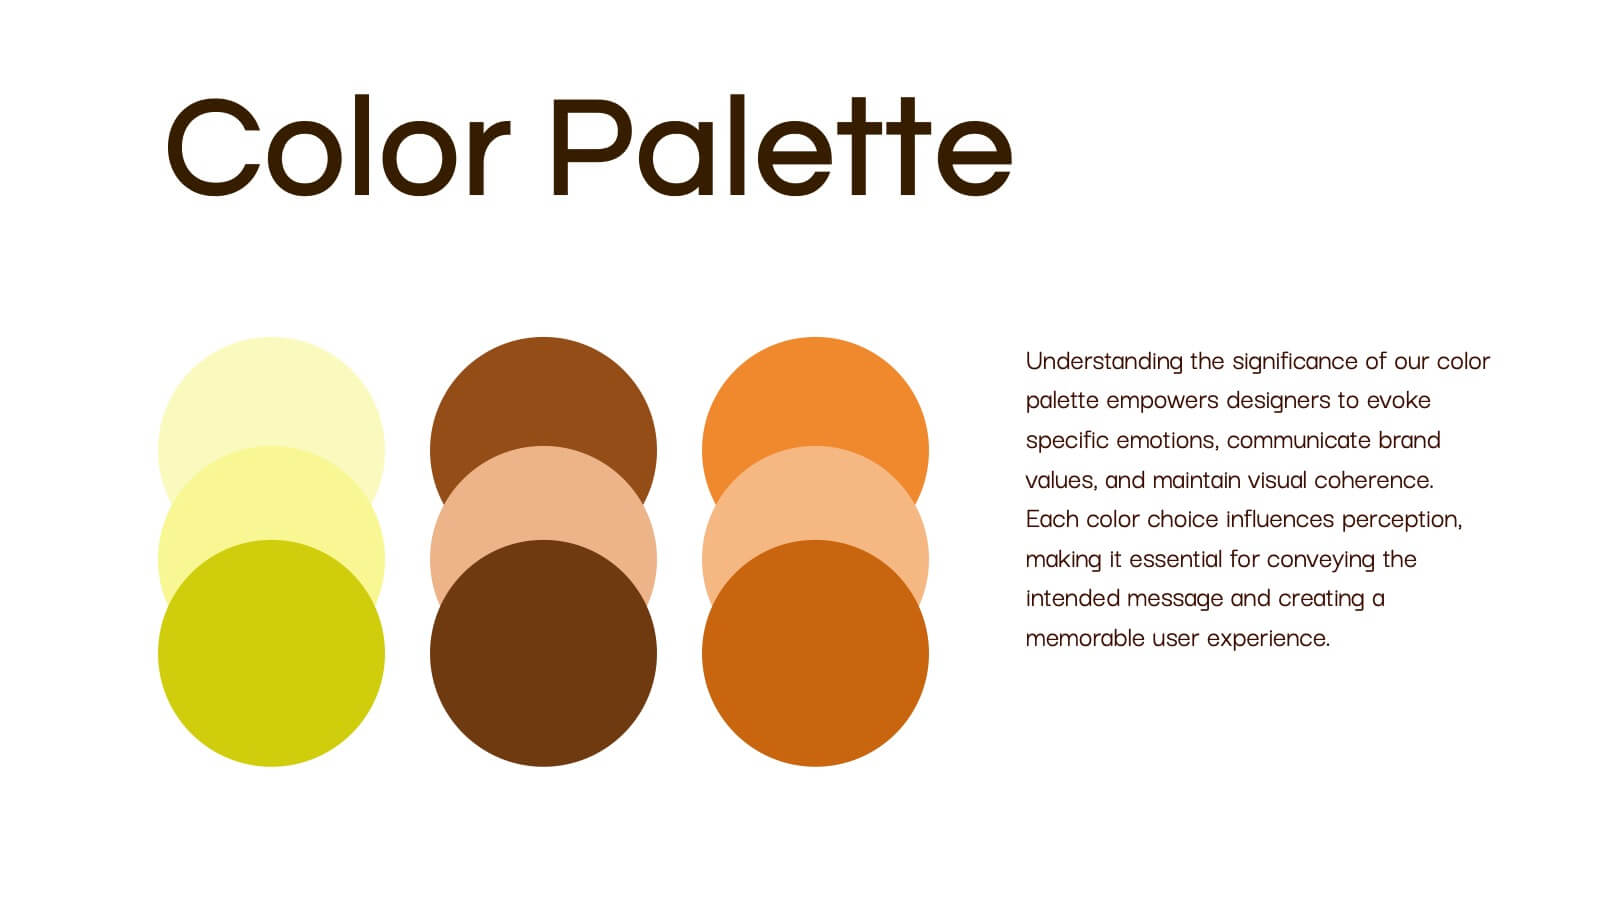
Obsidian Creative Design Report Presentation
Bring your creative vision to life with this stunning design presentation template! Perfect for showcasing your design process, from concept development and mood boards to typography and final assets. Ideal for creative professionals, this template offers clarity and style at every step. Compatible with PowerPoint, Keynote, and Google Slides, it’s your ultimate tool for design presentations.


6 slides
KPI Data Visualization and Metrics Overview Presentation
Get a clear snapshot of your performance with this KPI Data Visualization and Metrics Overview Presentation. Designed with bold triangle charts, percentage rings, and a color-coded value panel, it’s perfect for summarizing five key metrics in a compact, visual format. Easily editable in PowerPoint, Google Slides, Keynote, and Canva.


26 slides
Adlyn Presentation Template
Making low-calorie foods a part of your daily diet protect against the risk of heart disease, diabetes, and cancer. They make you feel full while reducing the daily calorie intake, which can help with weight loss. The Adlyn template is a concise, easy-to-use template that’s designed to help you inform your audience on the importance of low-calorie foods. This template is perfect for site builders, food bloggers, and writers looking to create informative content on food facts and healthy living. Using Adlyn you can add daily tips about nutrition and exercise along with a list of healthy foods.


4 slides
Governance Practices for Risk Mitigation Presentation
Break down your risk strategy with the Governance Practices for Risk Mitigation Presentation. This slide features a step-stair 3D block visual, ideal for illustrating layered compliance initiatives, control measures, and escalation paths. Perfect for corporate governance teams, compliance officers, and strategic risk planners. Fully editable in PowerPoint, Keynote, and Google Slides.


23 slides
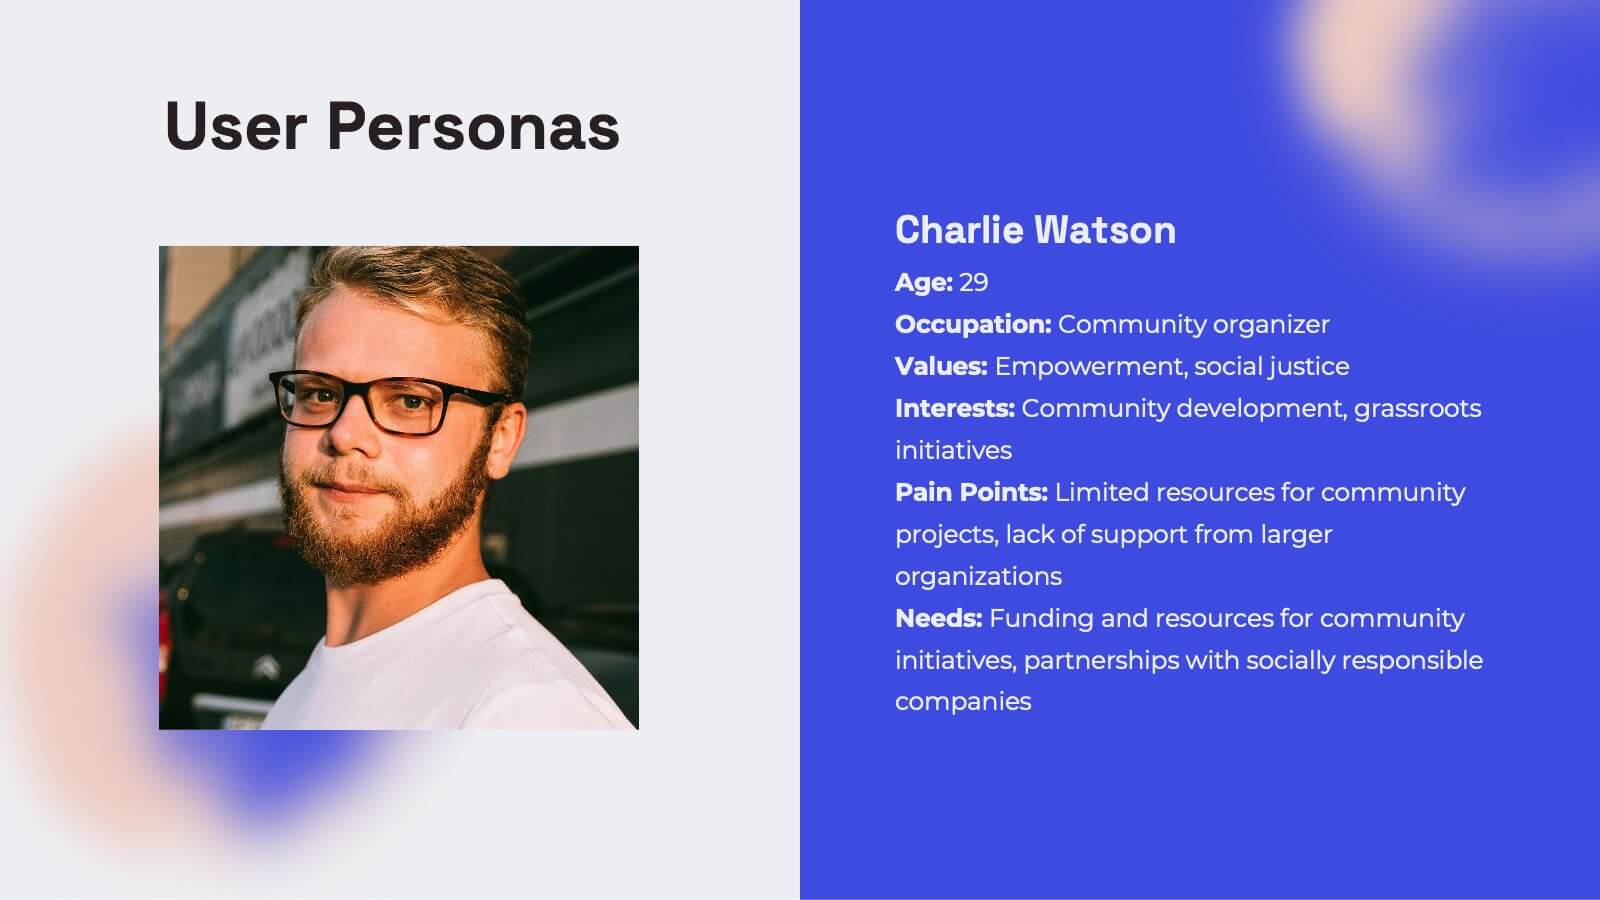
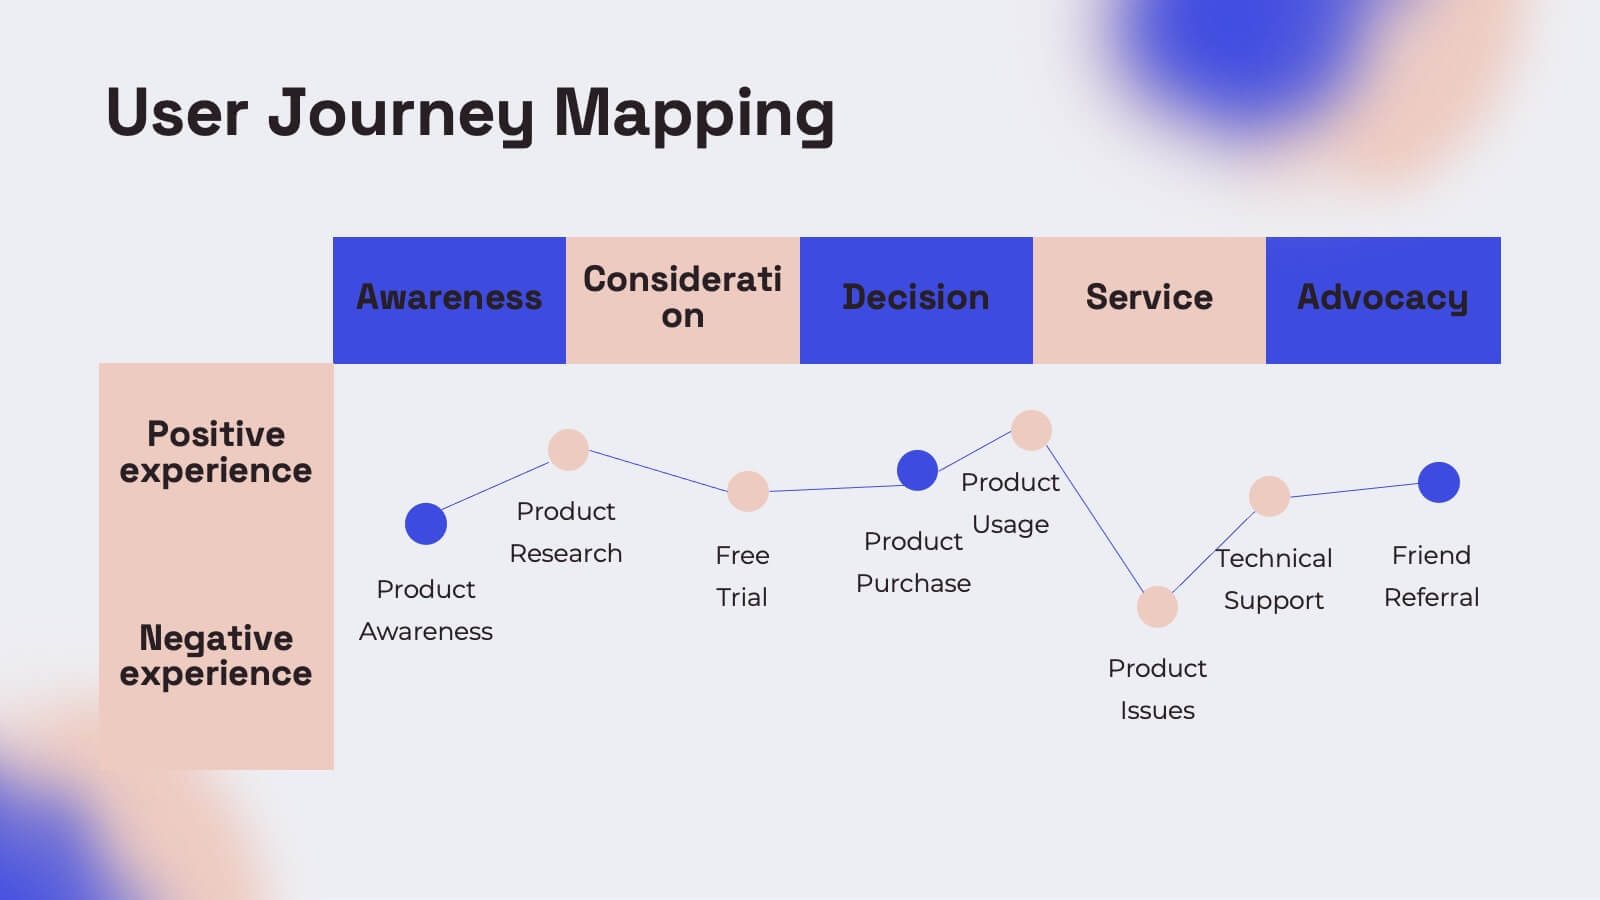
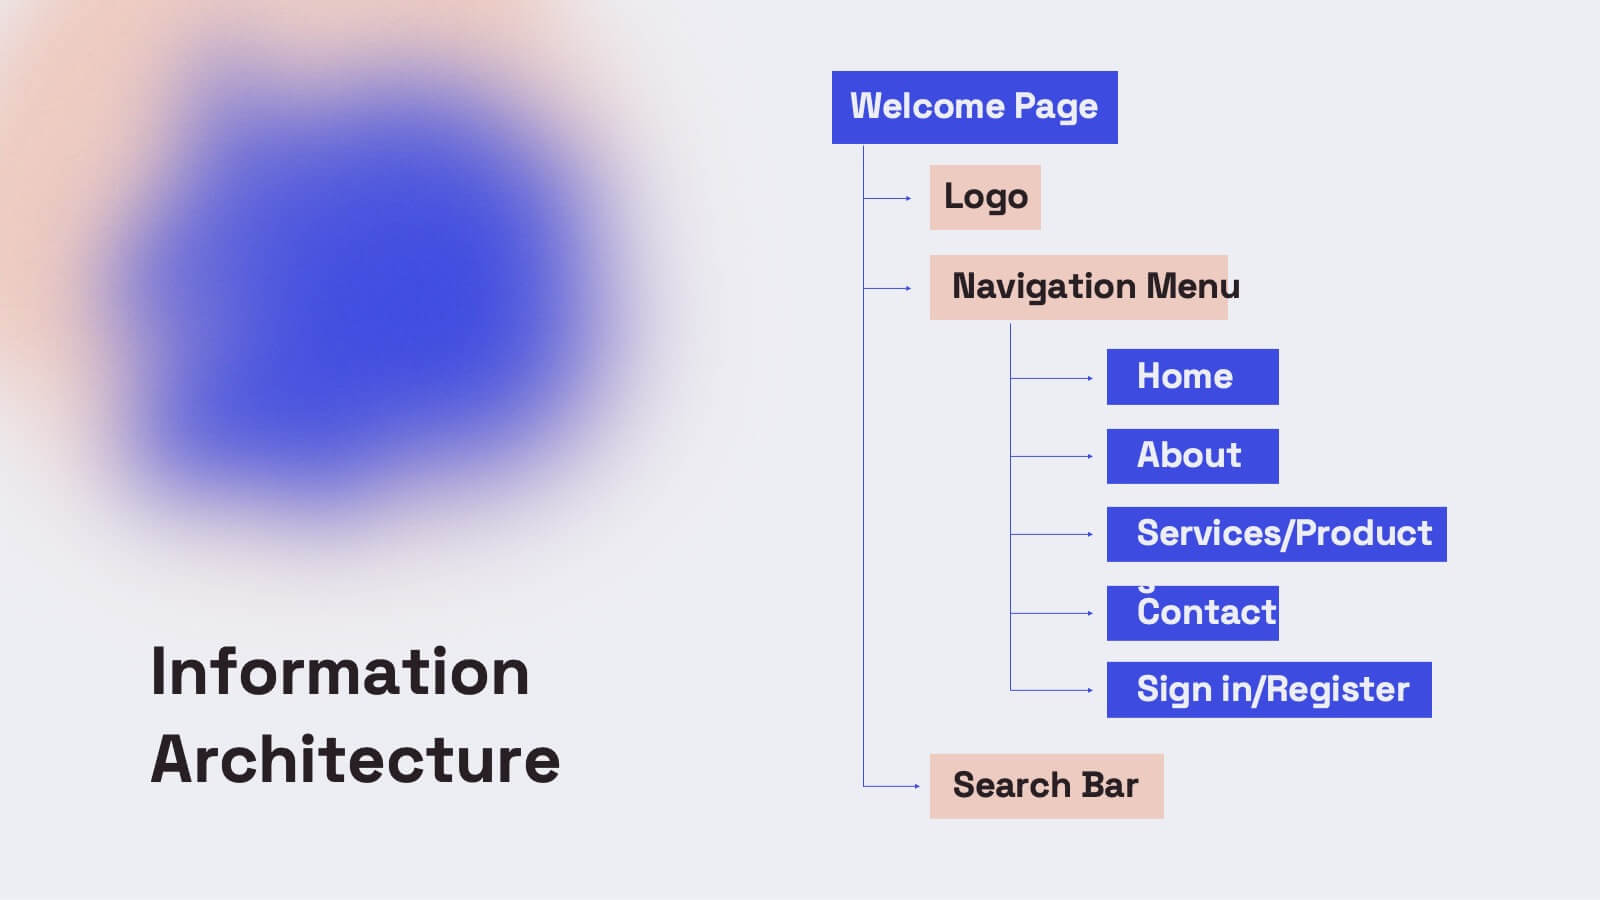
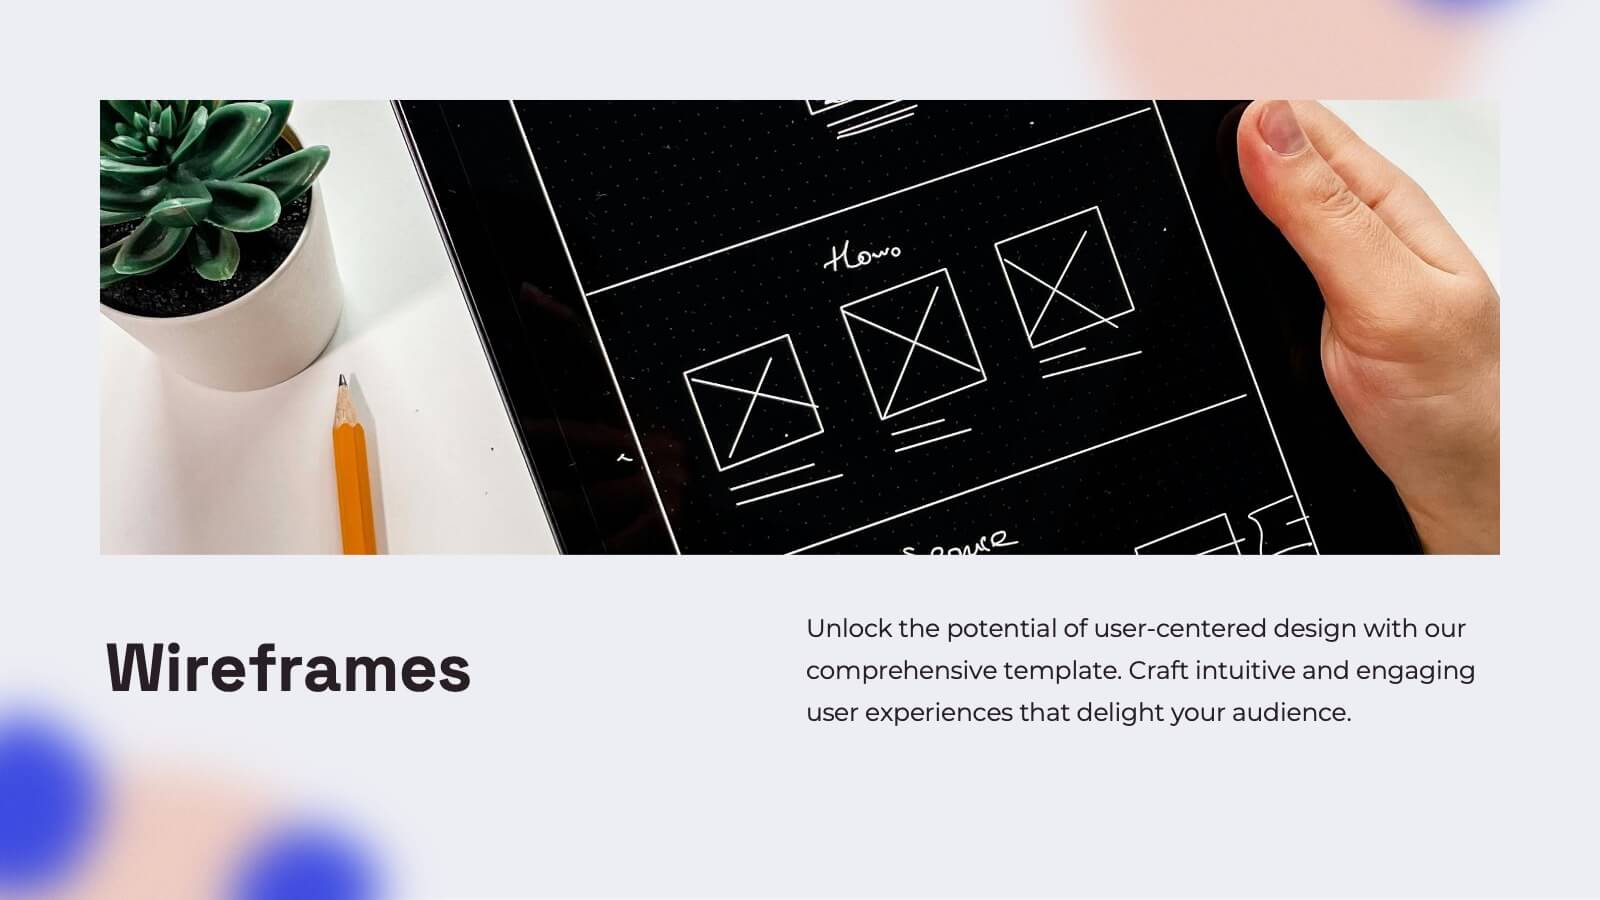
Gemini UX Design Presentation
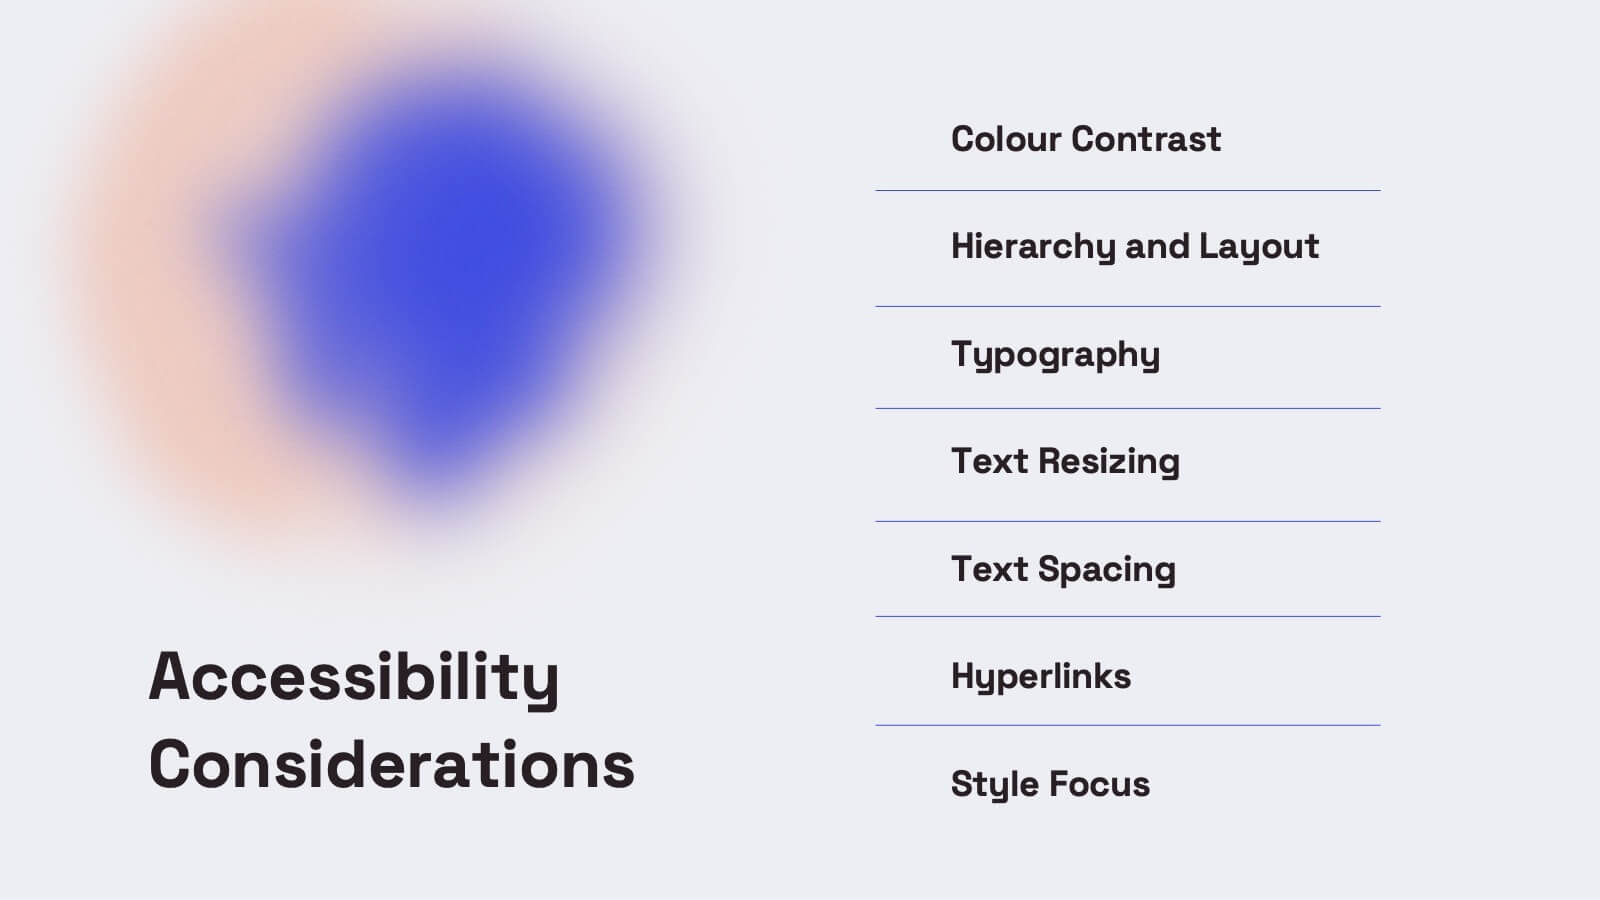
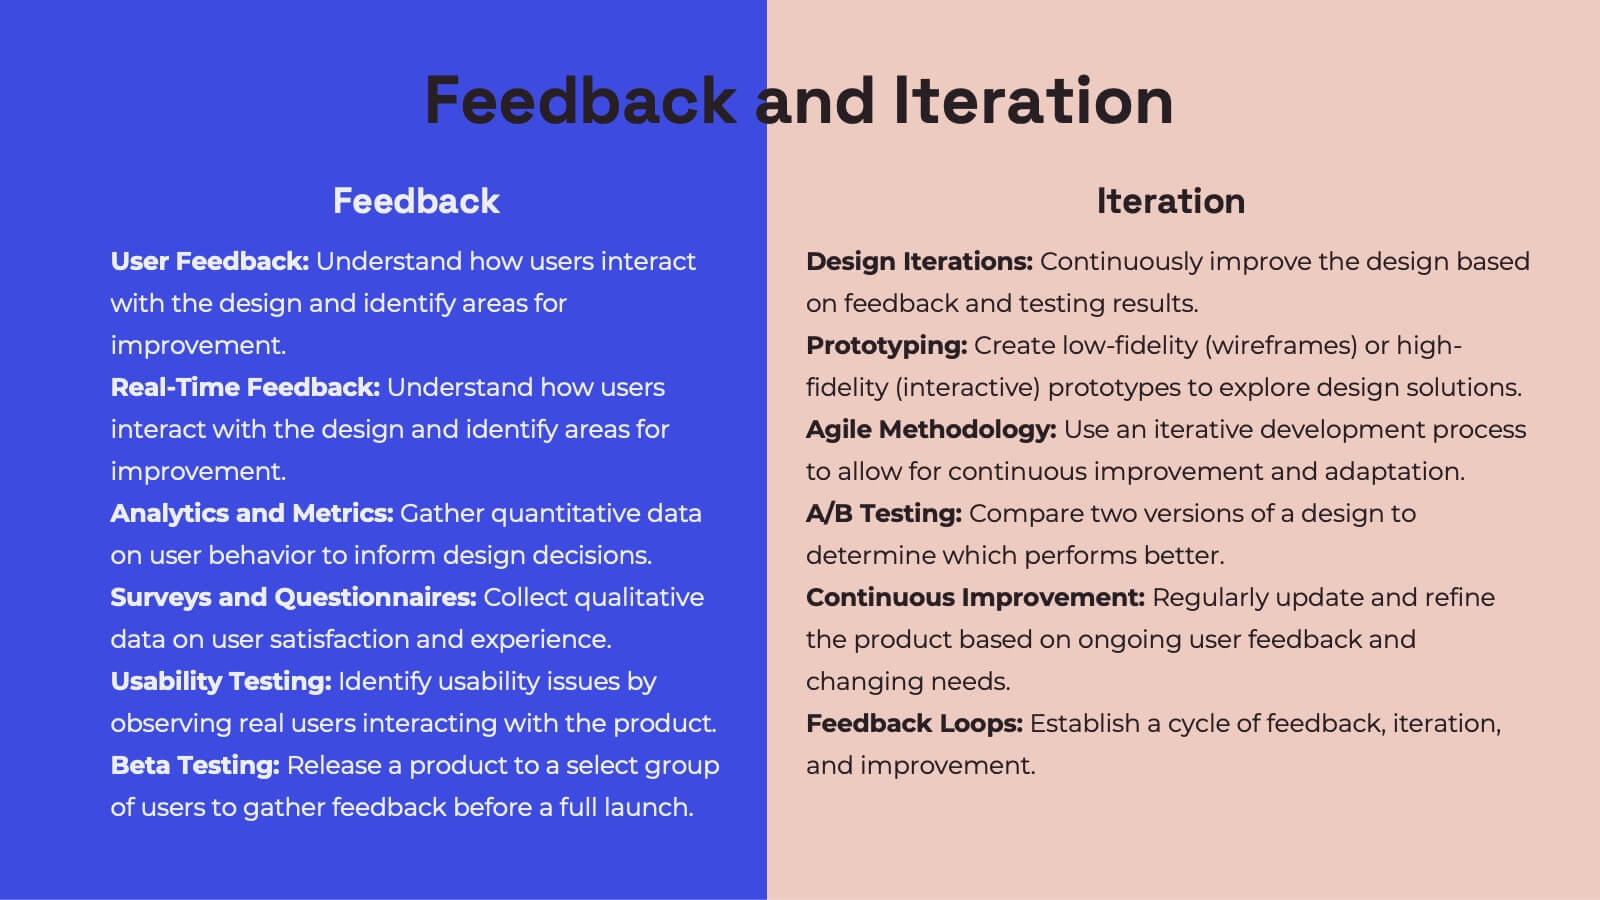
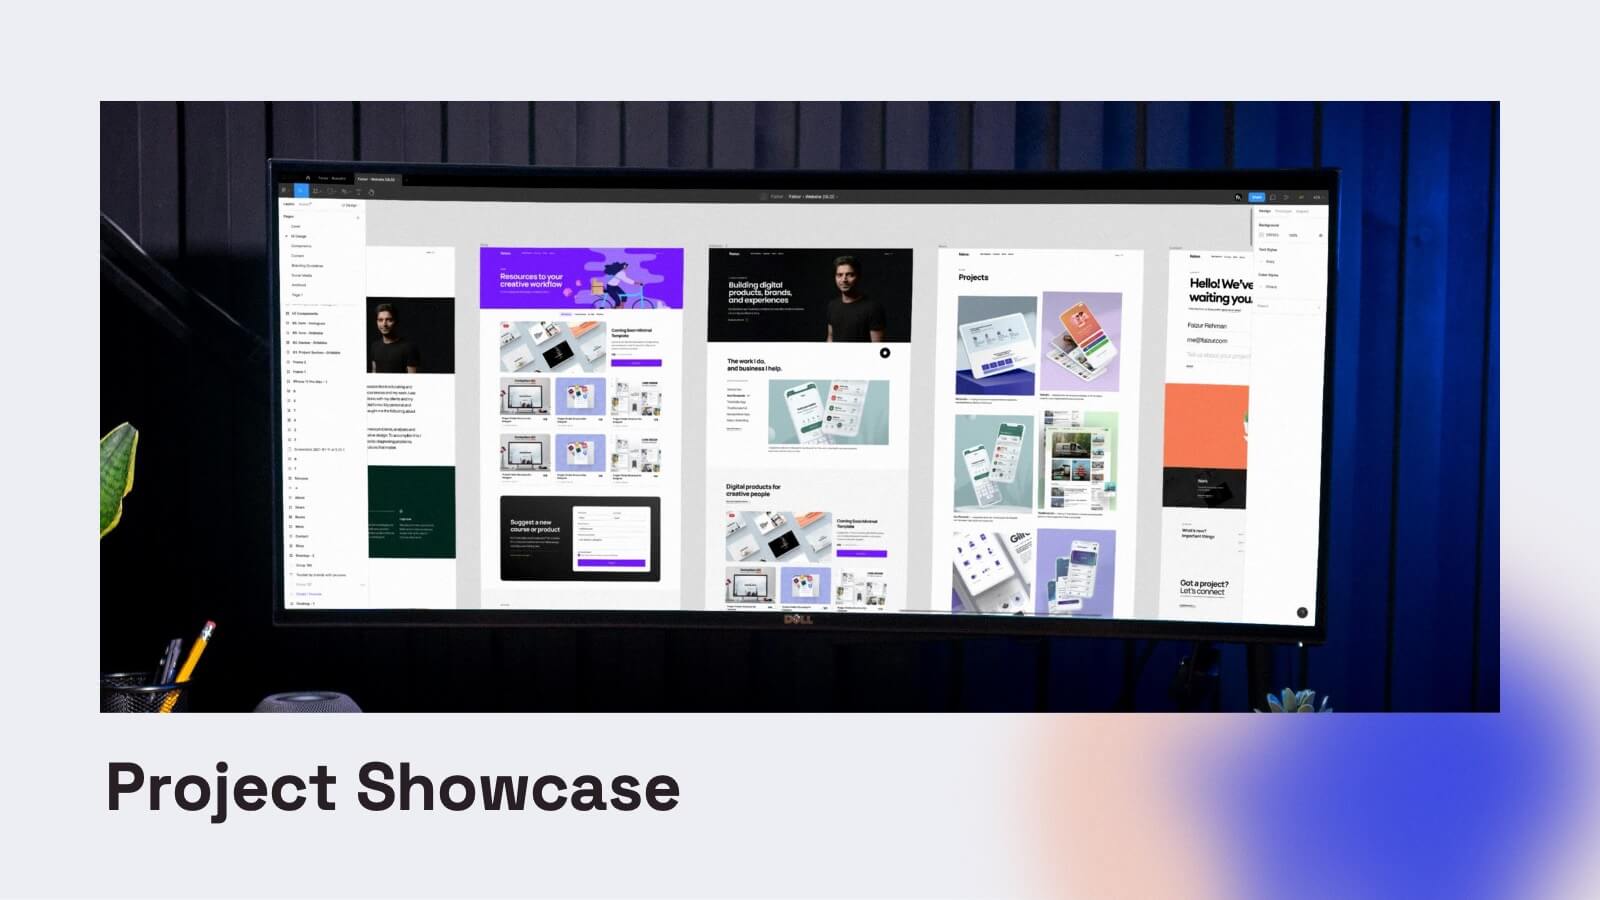
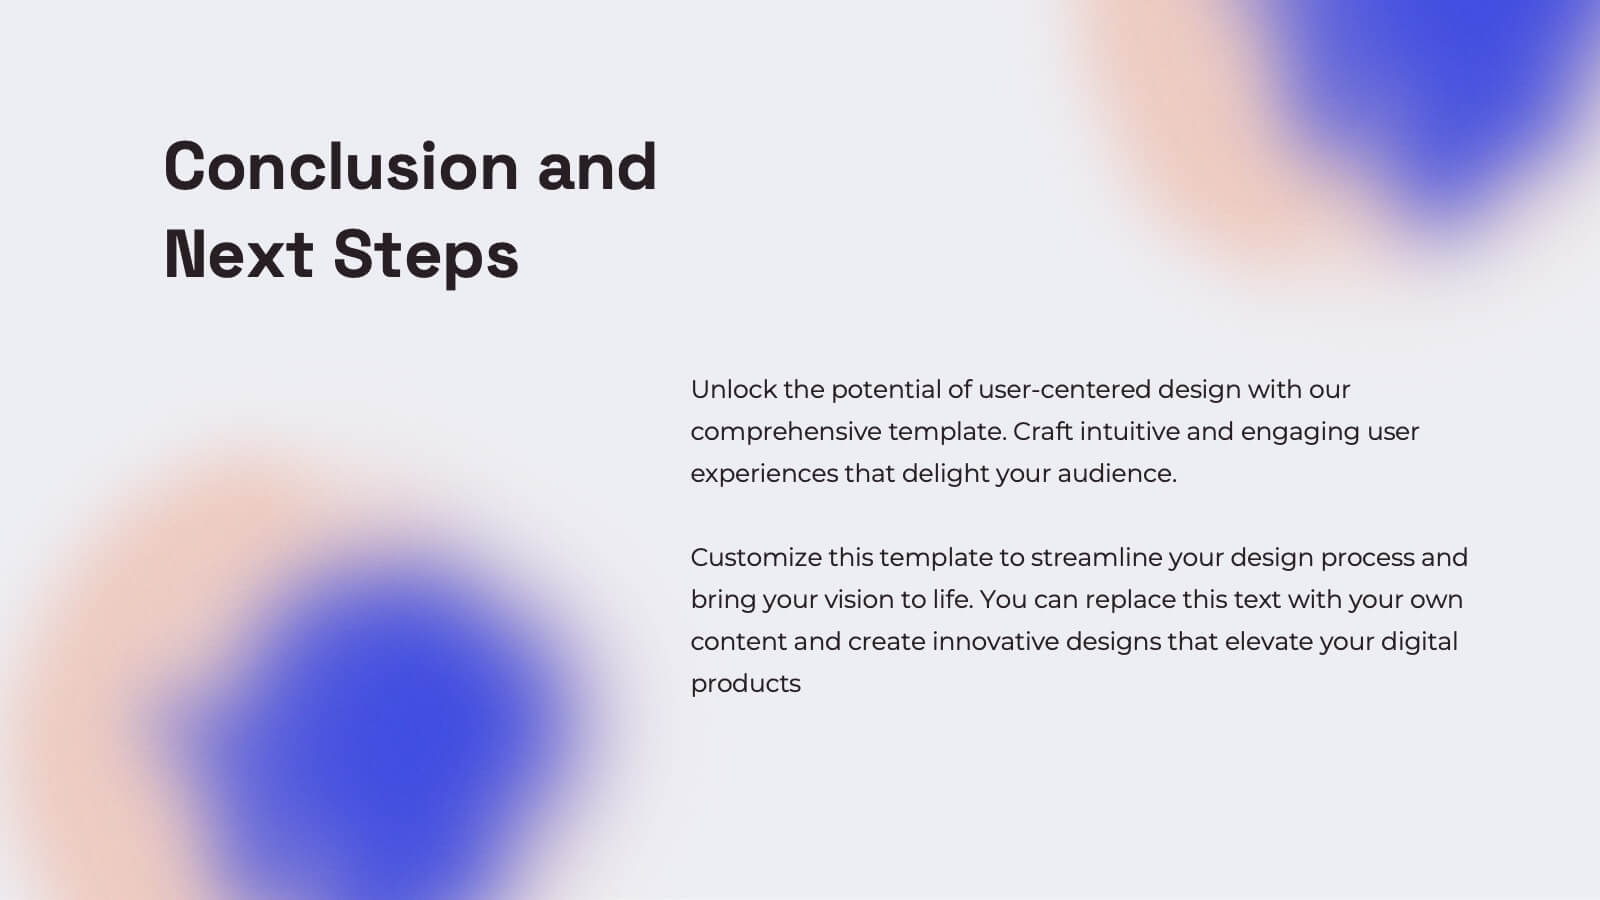
Enhance your UX presentations with this vibrant and user-friendly template. Designed to cover every aspect of UX design, from user research and personas to wireframes and prototyping, this template ensures a comprehensive and engaging delivery. Its modern design and structured layout make your insights clear and impactful. Compatible with PowerPoint, Keynote, and Google Slides, it's perfect for any platform.


8 slides
Virtual Team Collaboration Presentation
The "Virtual Team Collaboration" presentation template is designed to highlight different facets of teamwork in a remote setting. Each slide features a central visual metaphor illustrated by connected circles, symbolizing the interconnected nature of virtual team activities and communication. The layout provides placeholders for titles and descriptive text, making it suitable for detailing various aspects of virtual collaboration such as project management, communication protocols, and role assignments. The design encourages a clear and organized presentation of information, facilitating discussions on best practices and strategies for effective remote teamwork.


4 slides
Veterinary Services and Animal Care Presentation
Deliver professional insights with compassion using the Veterinary Services and Animal Care presentation. This slide features a clean, pet-centered illustration layout ideal for showcasing services such as treatment, grooming, preventive care, and boarding. Each section includes editable icons and placeholder text, making it easy to customize for veterinary clinics, pet hospitals, or animal wellness campaigns. Fully compatible with PowerPoint, Keynote, and Google Slides.