


Features
- 5 Unique slides
- Fully editable and easy to edit in Microsoft Powerpoint, Keynote and Google Slides
- 16:9 widescreen layout
- Clean and professional designs
- Export to JPG, PDF or send by email


Do you have any questions?
Recommend


21 slides
Vulcan New Product Proposal Presentation
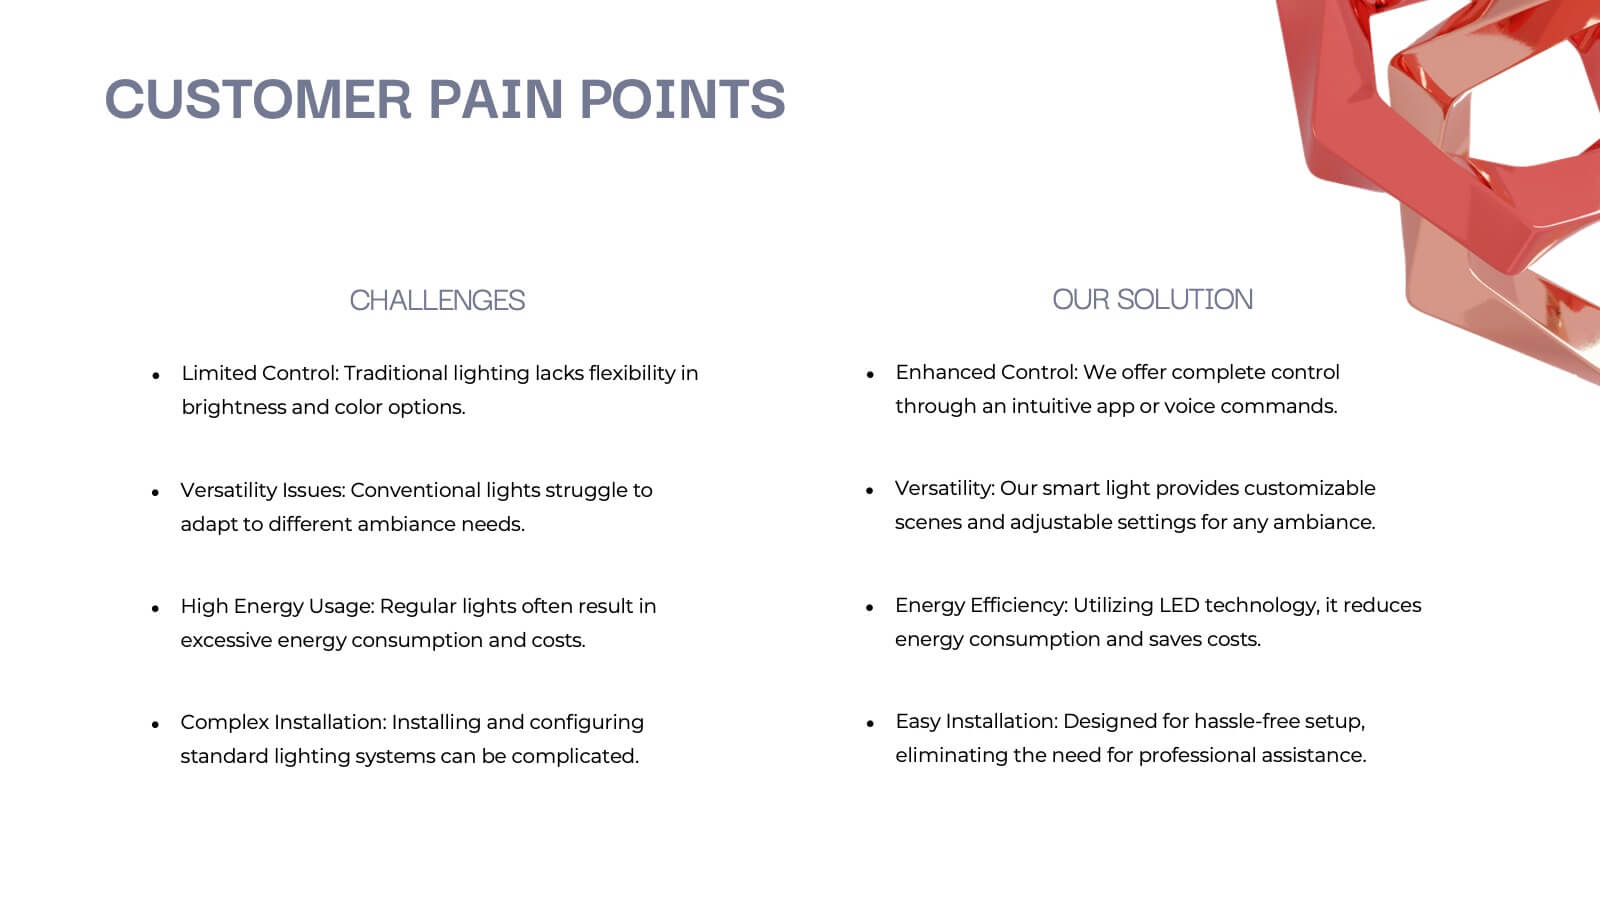
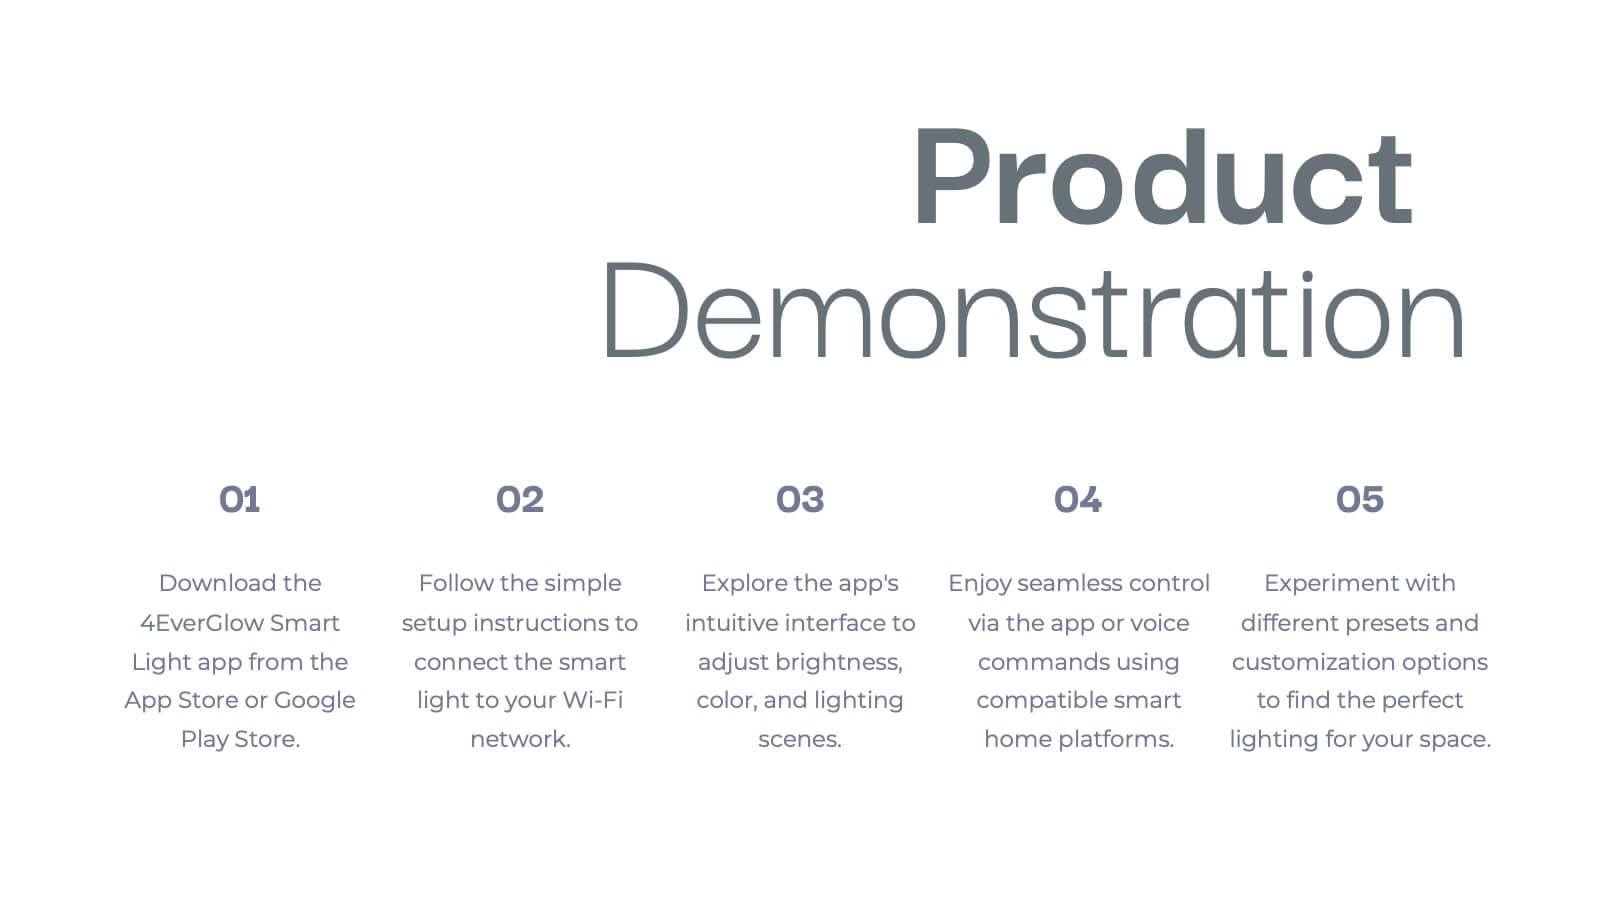
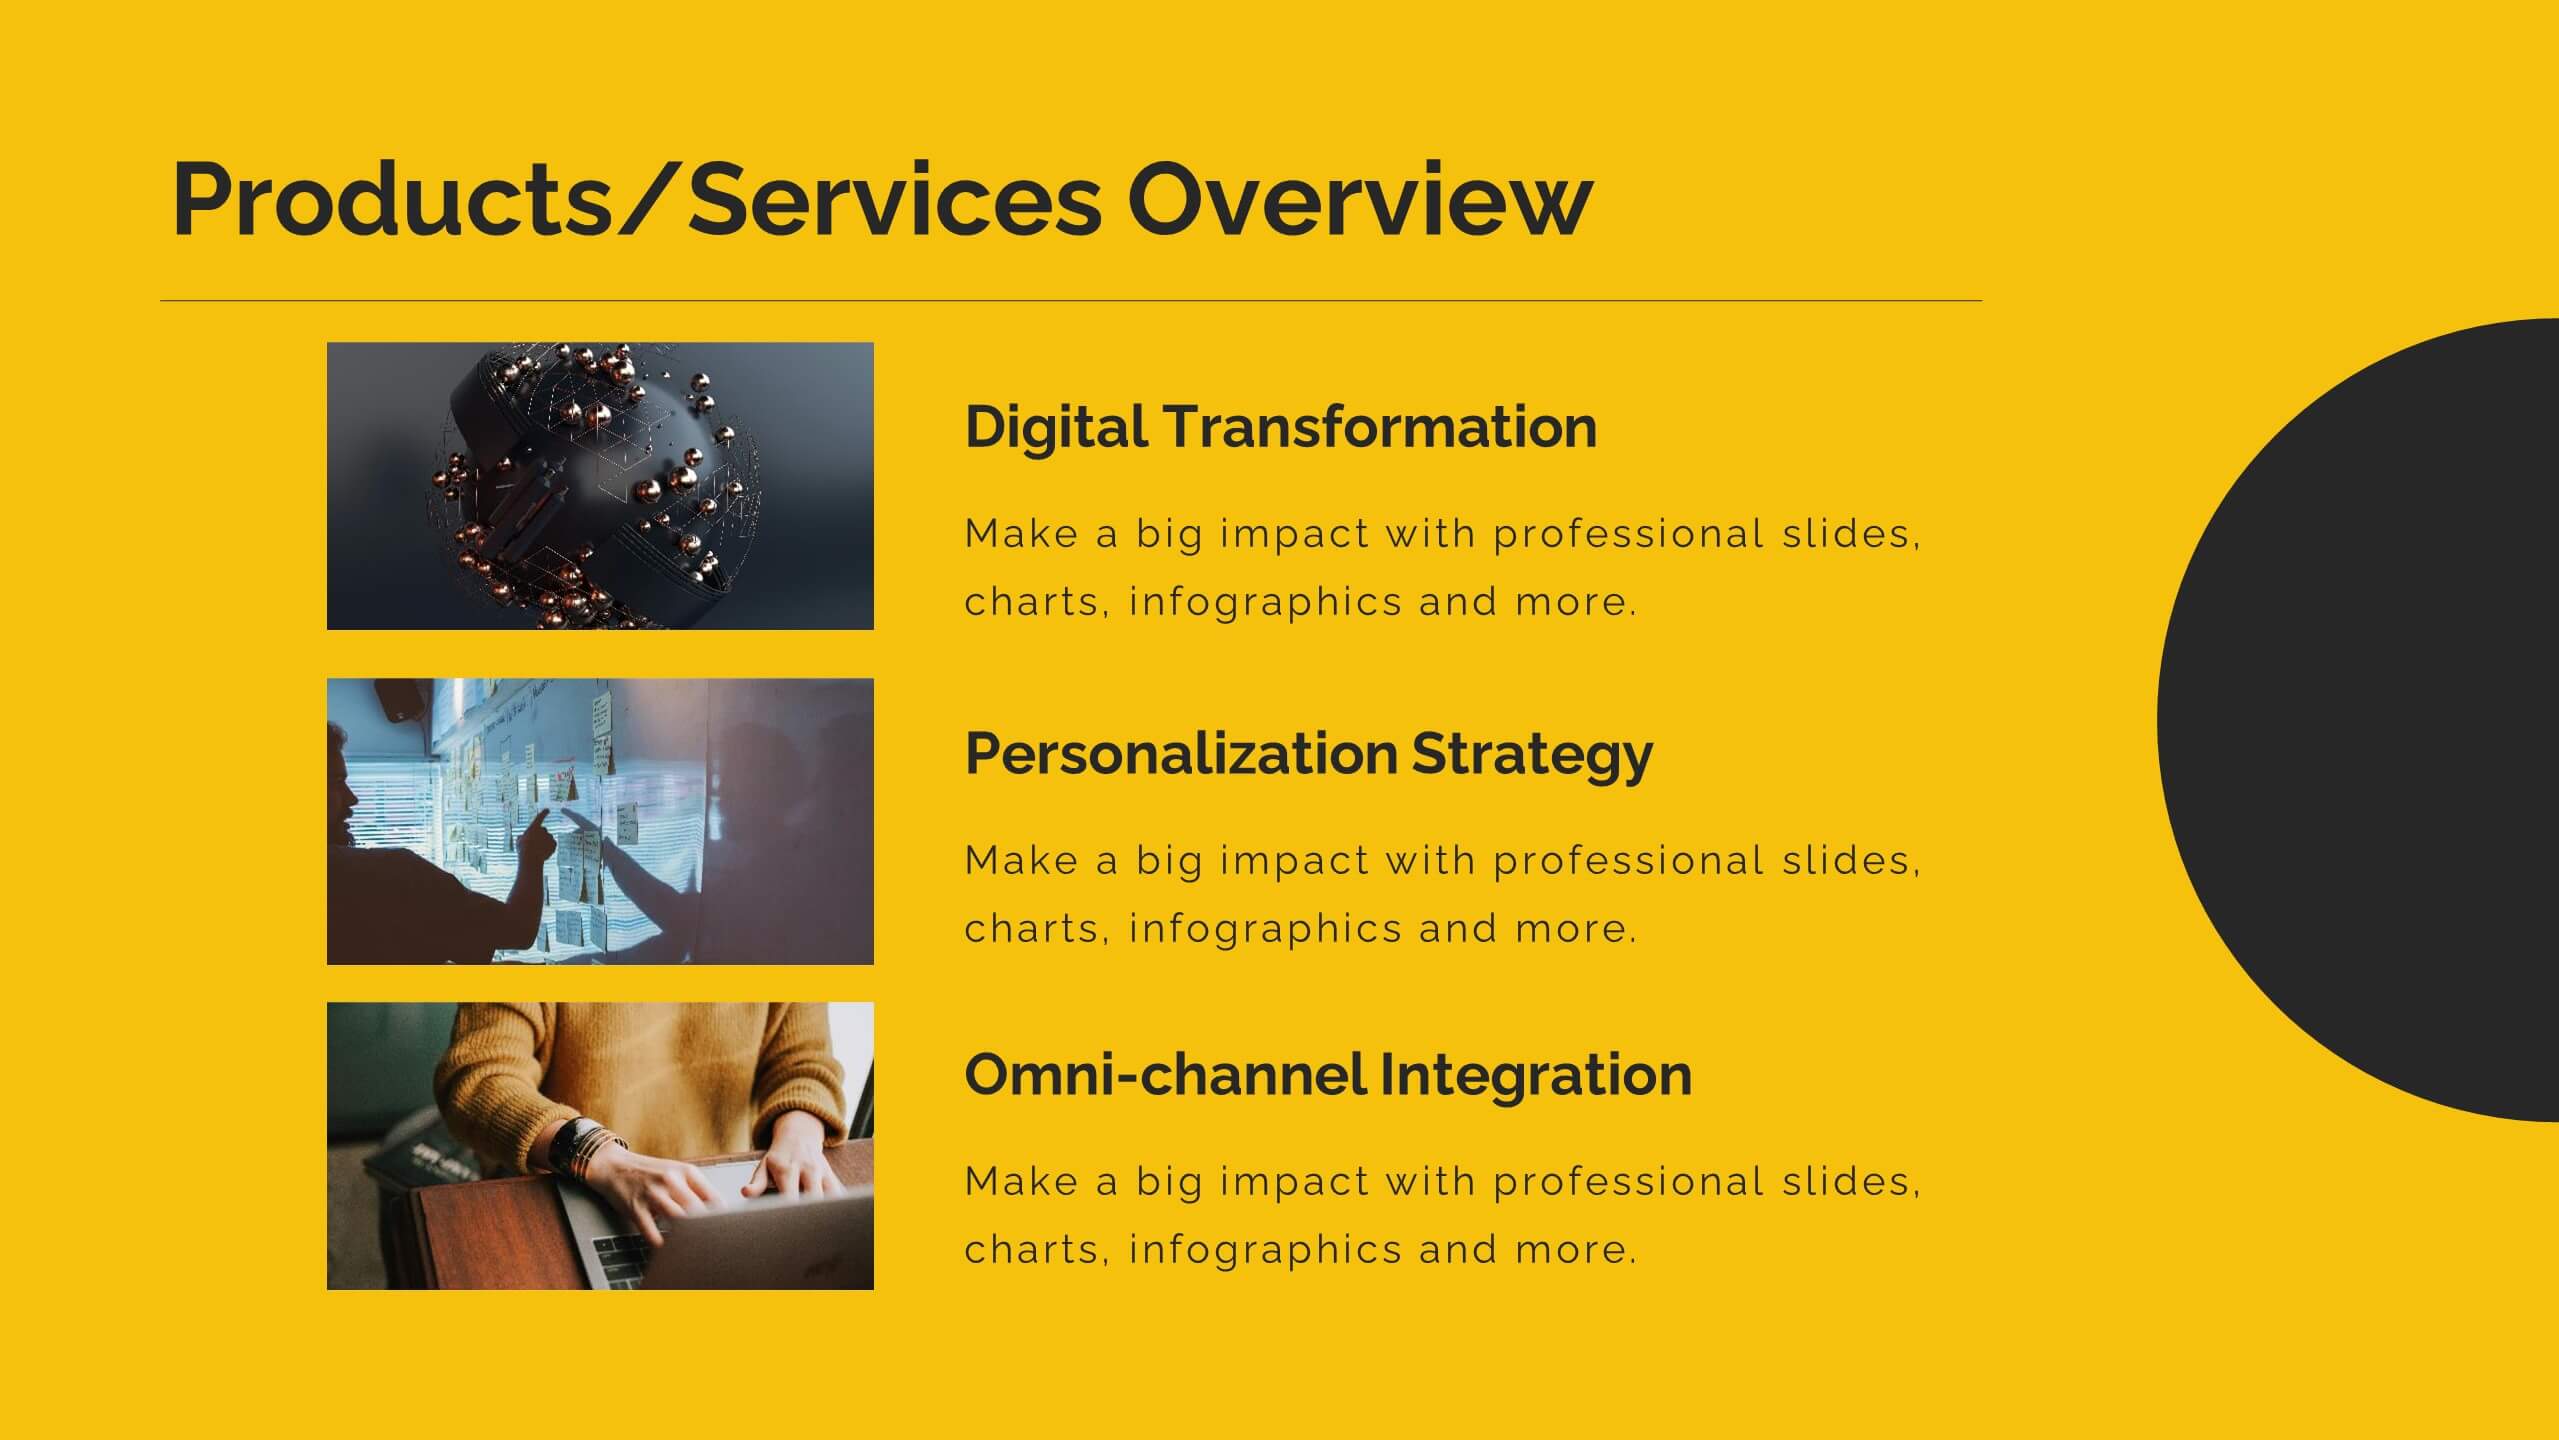
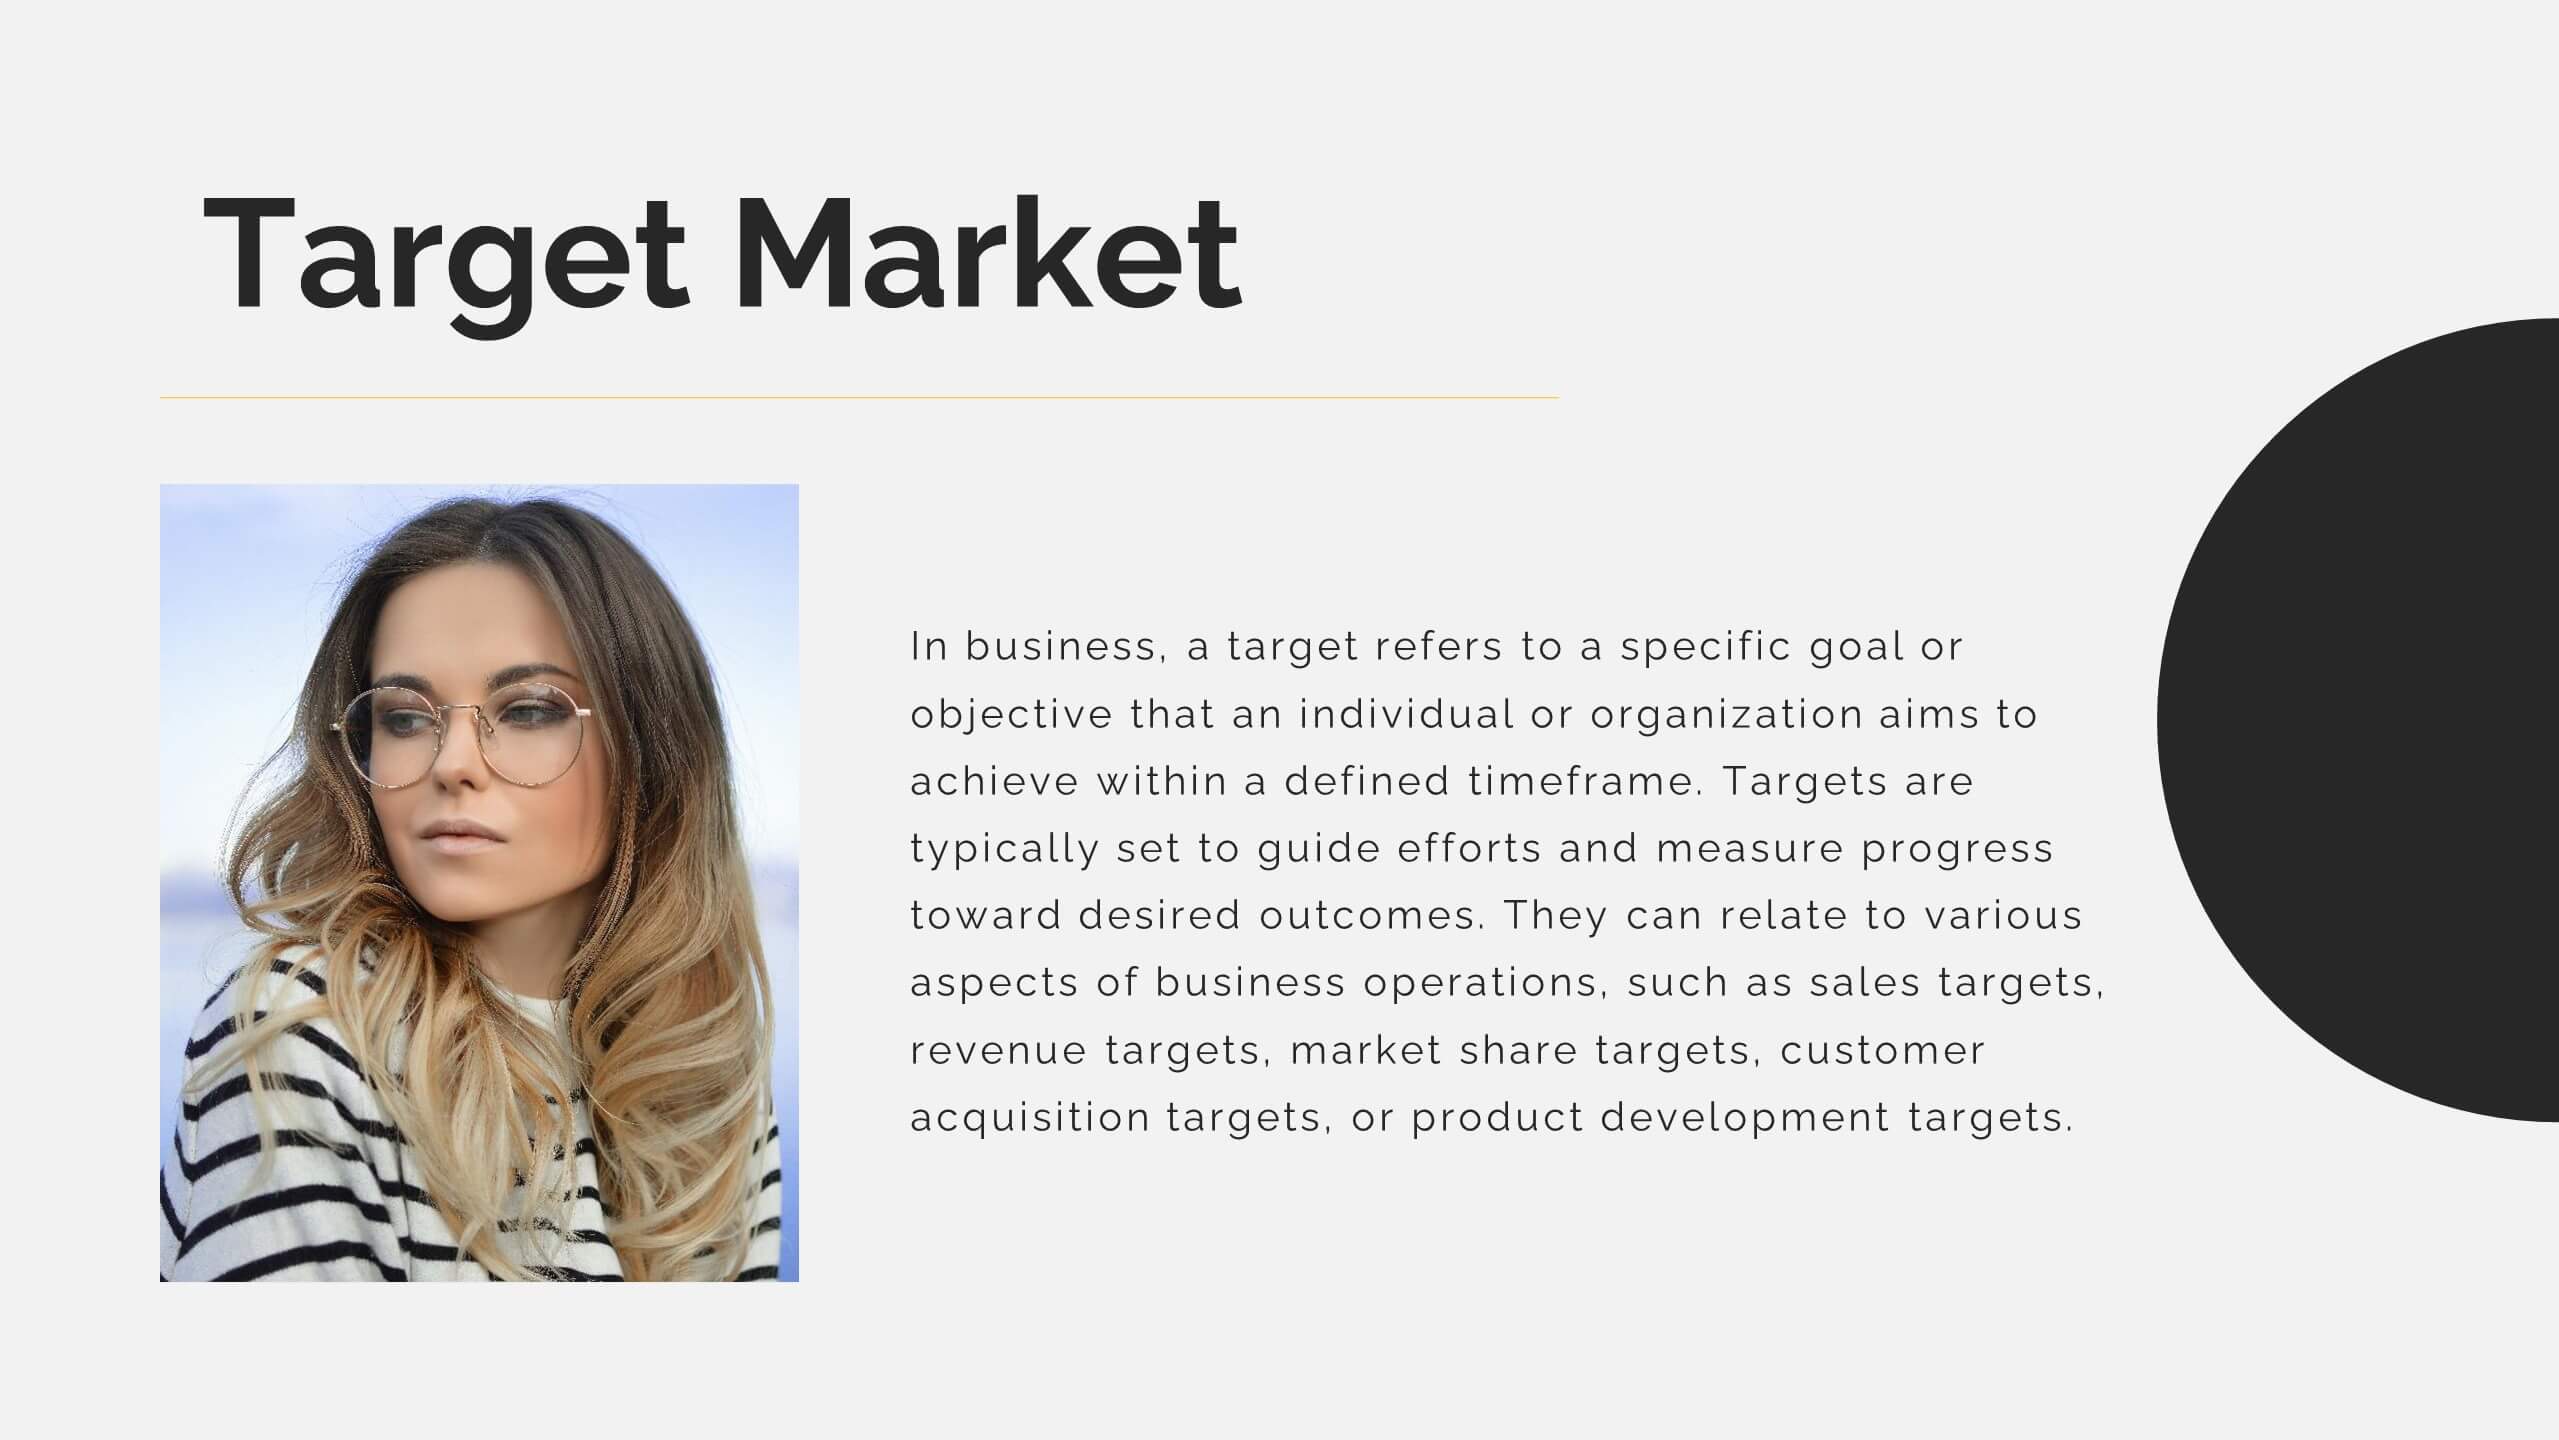
Launch your next product with confidence using this comprehensive presentation template! Covering everything from product features and target market to pricing strategy and customer pain points, this template ensures a smooth and engaging flow for your audience. It’s ideal for product proposals, demonstrations, and marketing strategies. Compatible with PowerPoint, Keynote, and Google Slides for seamless presentations.


22 slides
Mirage Startup Funding Proposal Presentation
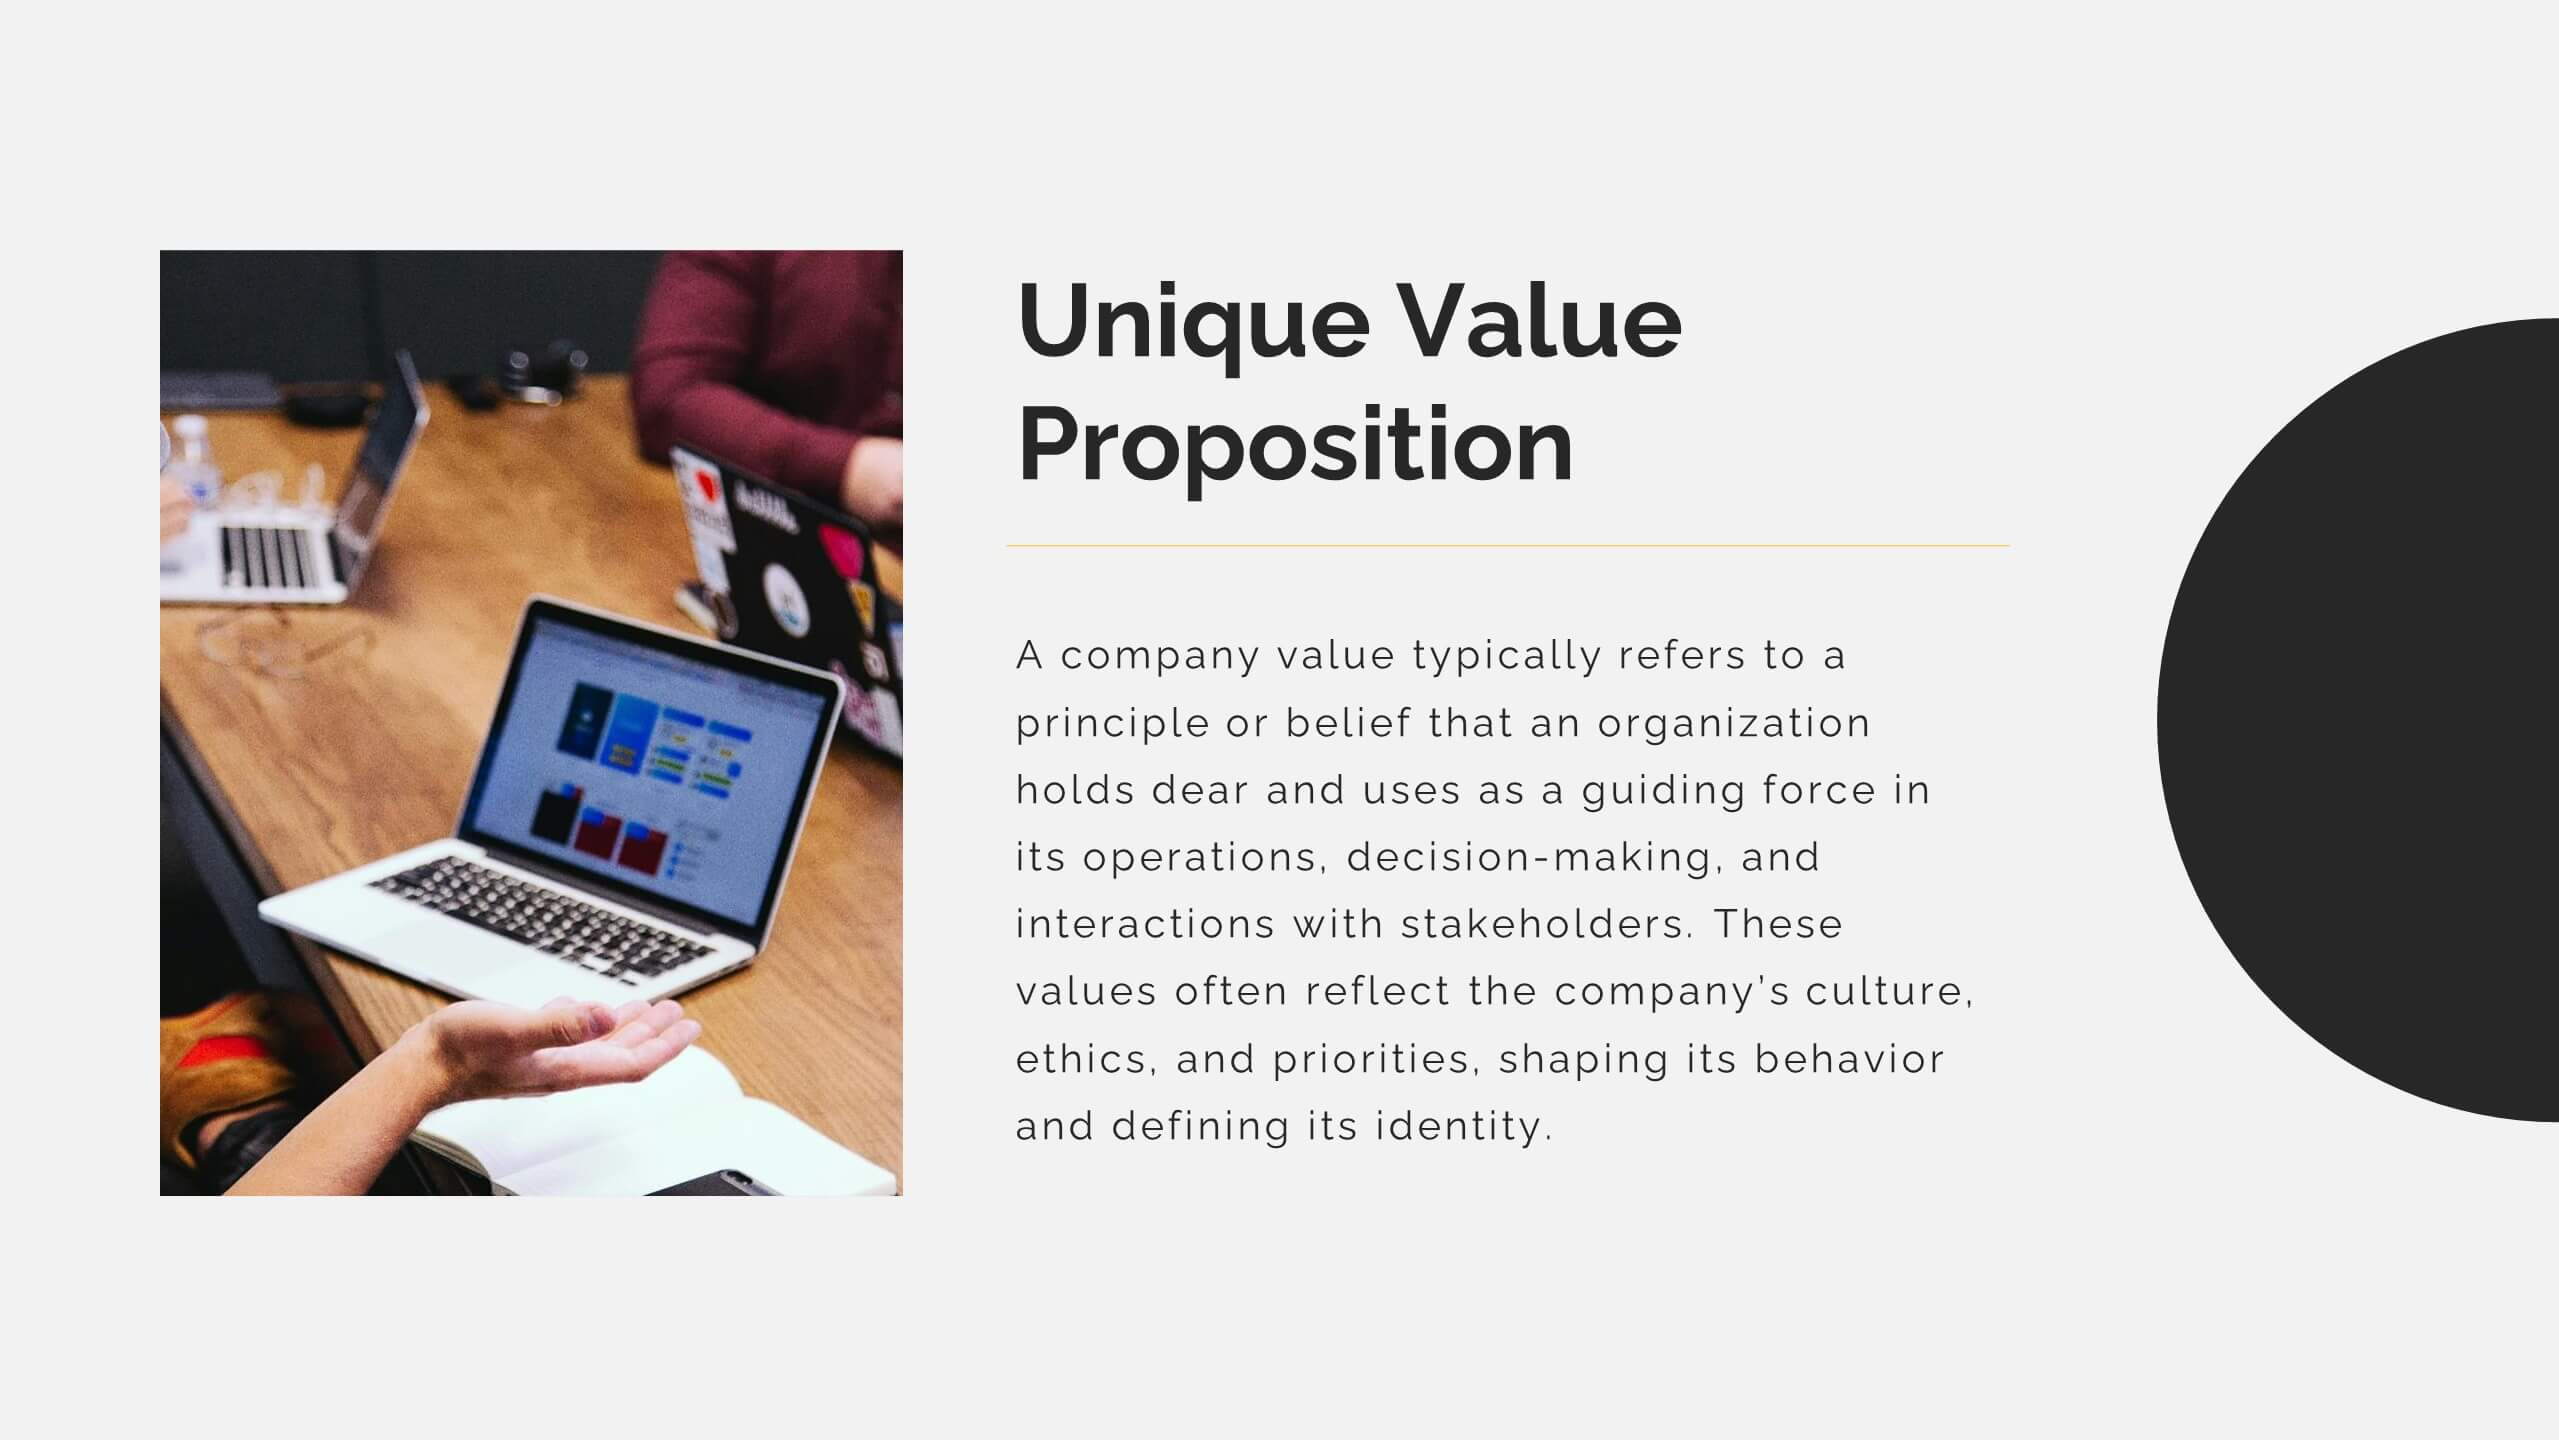
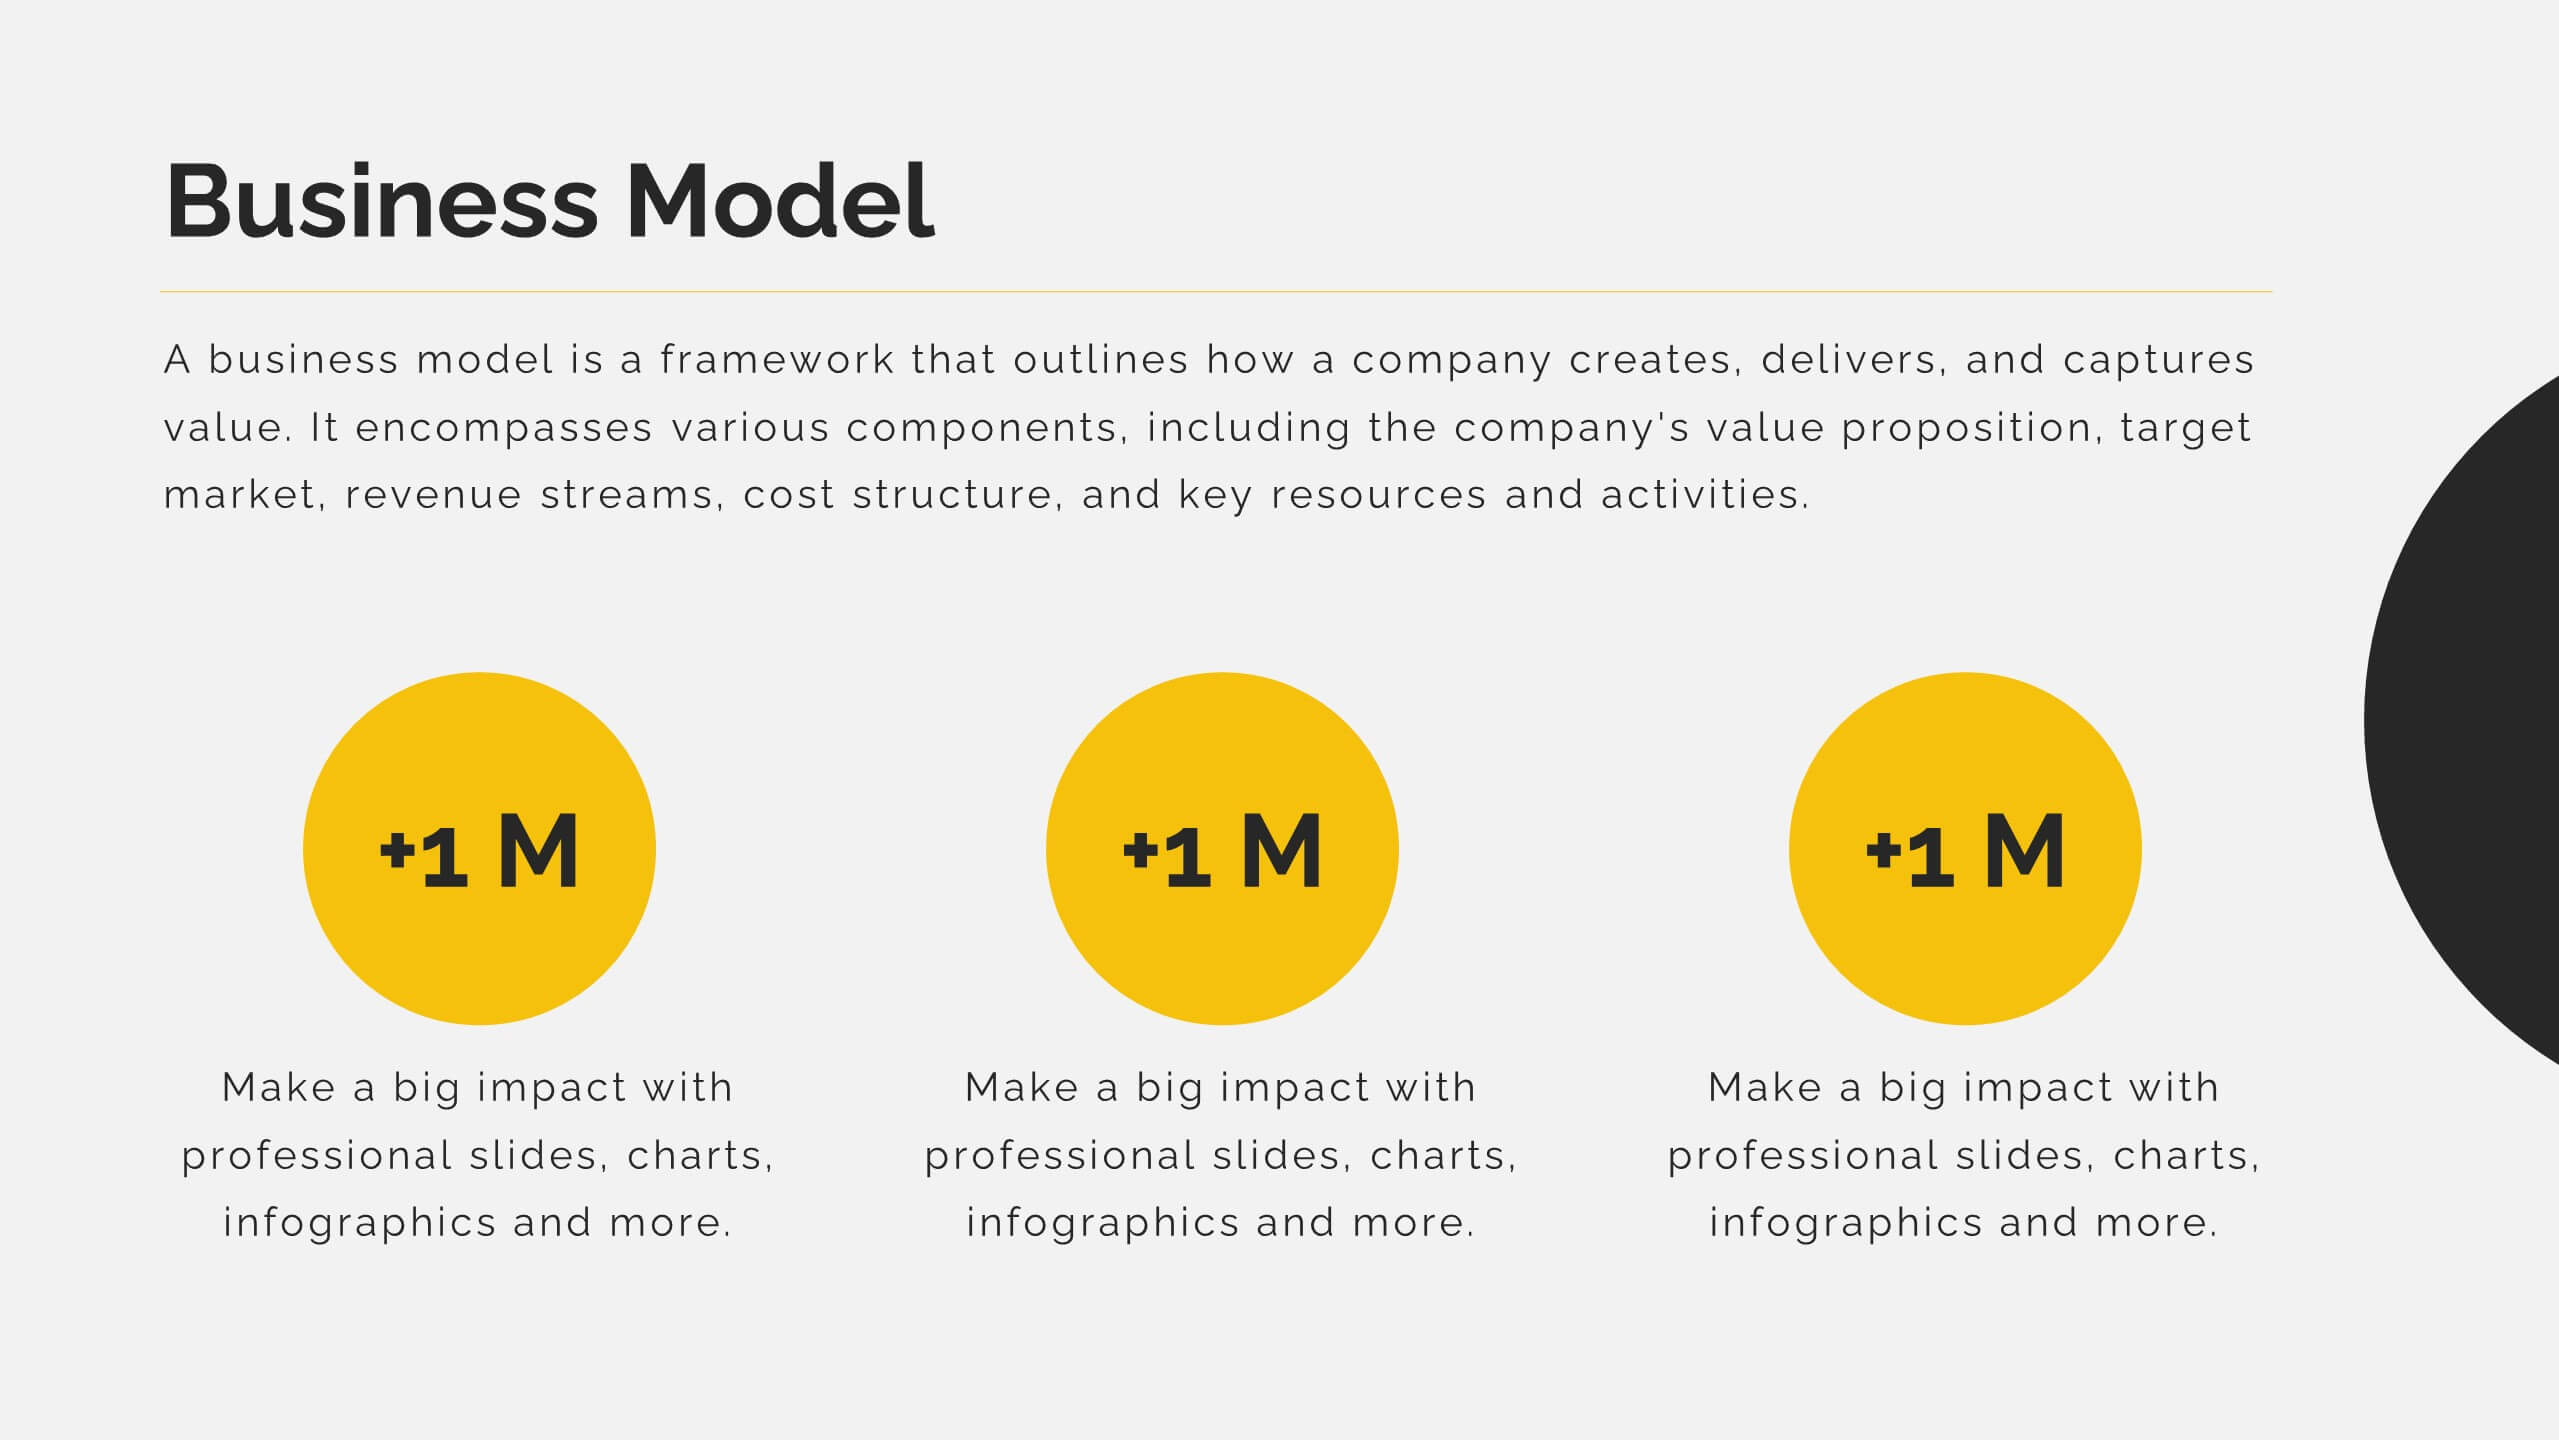
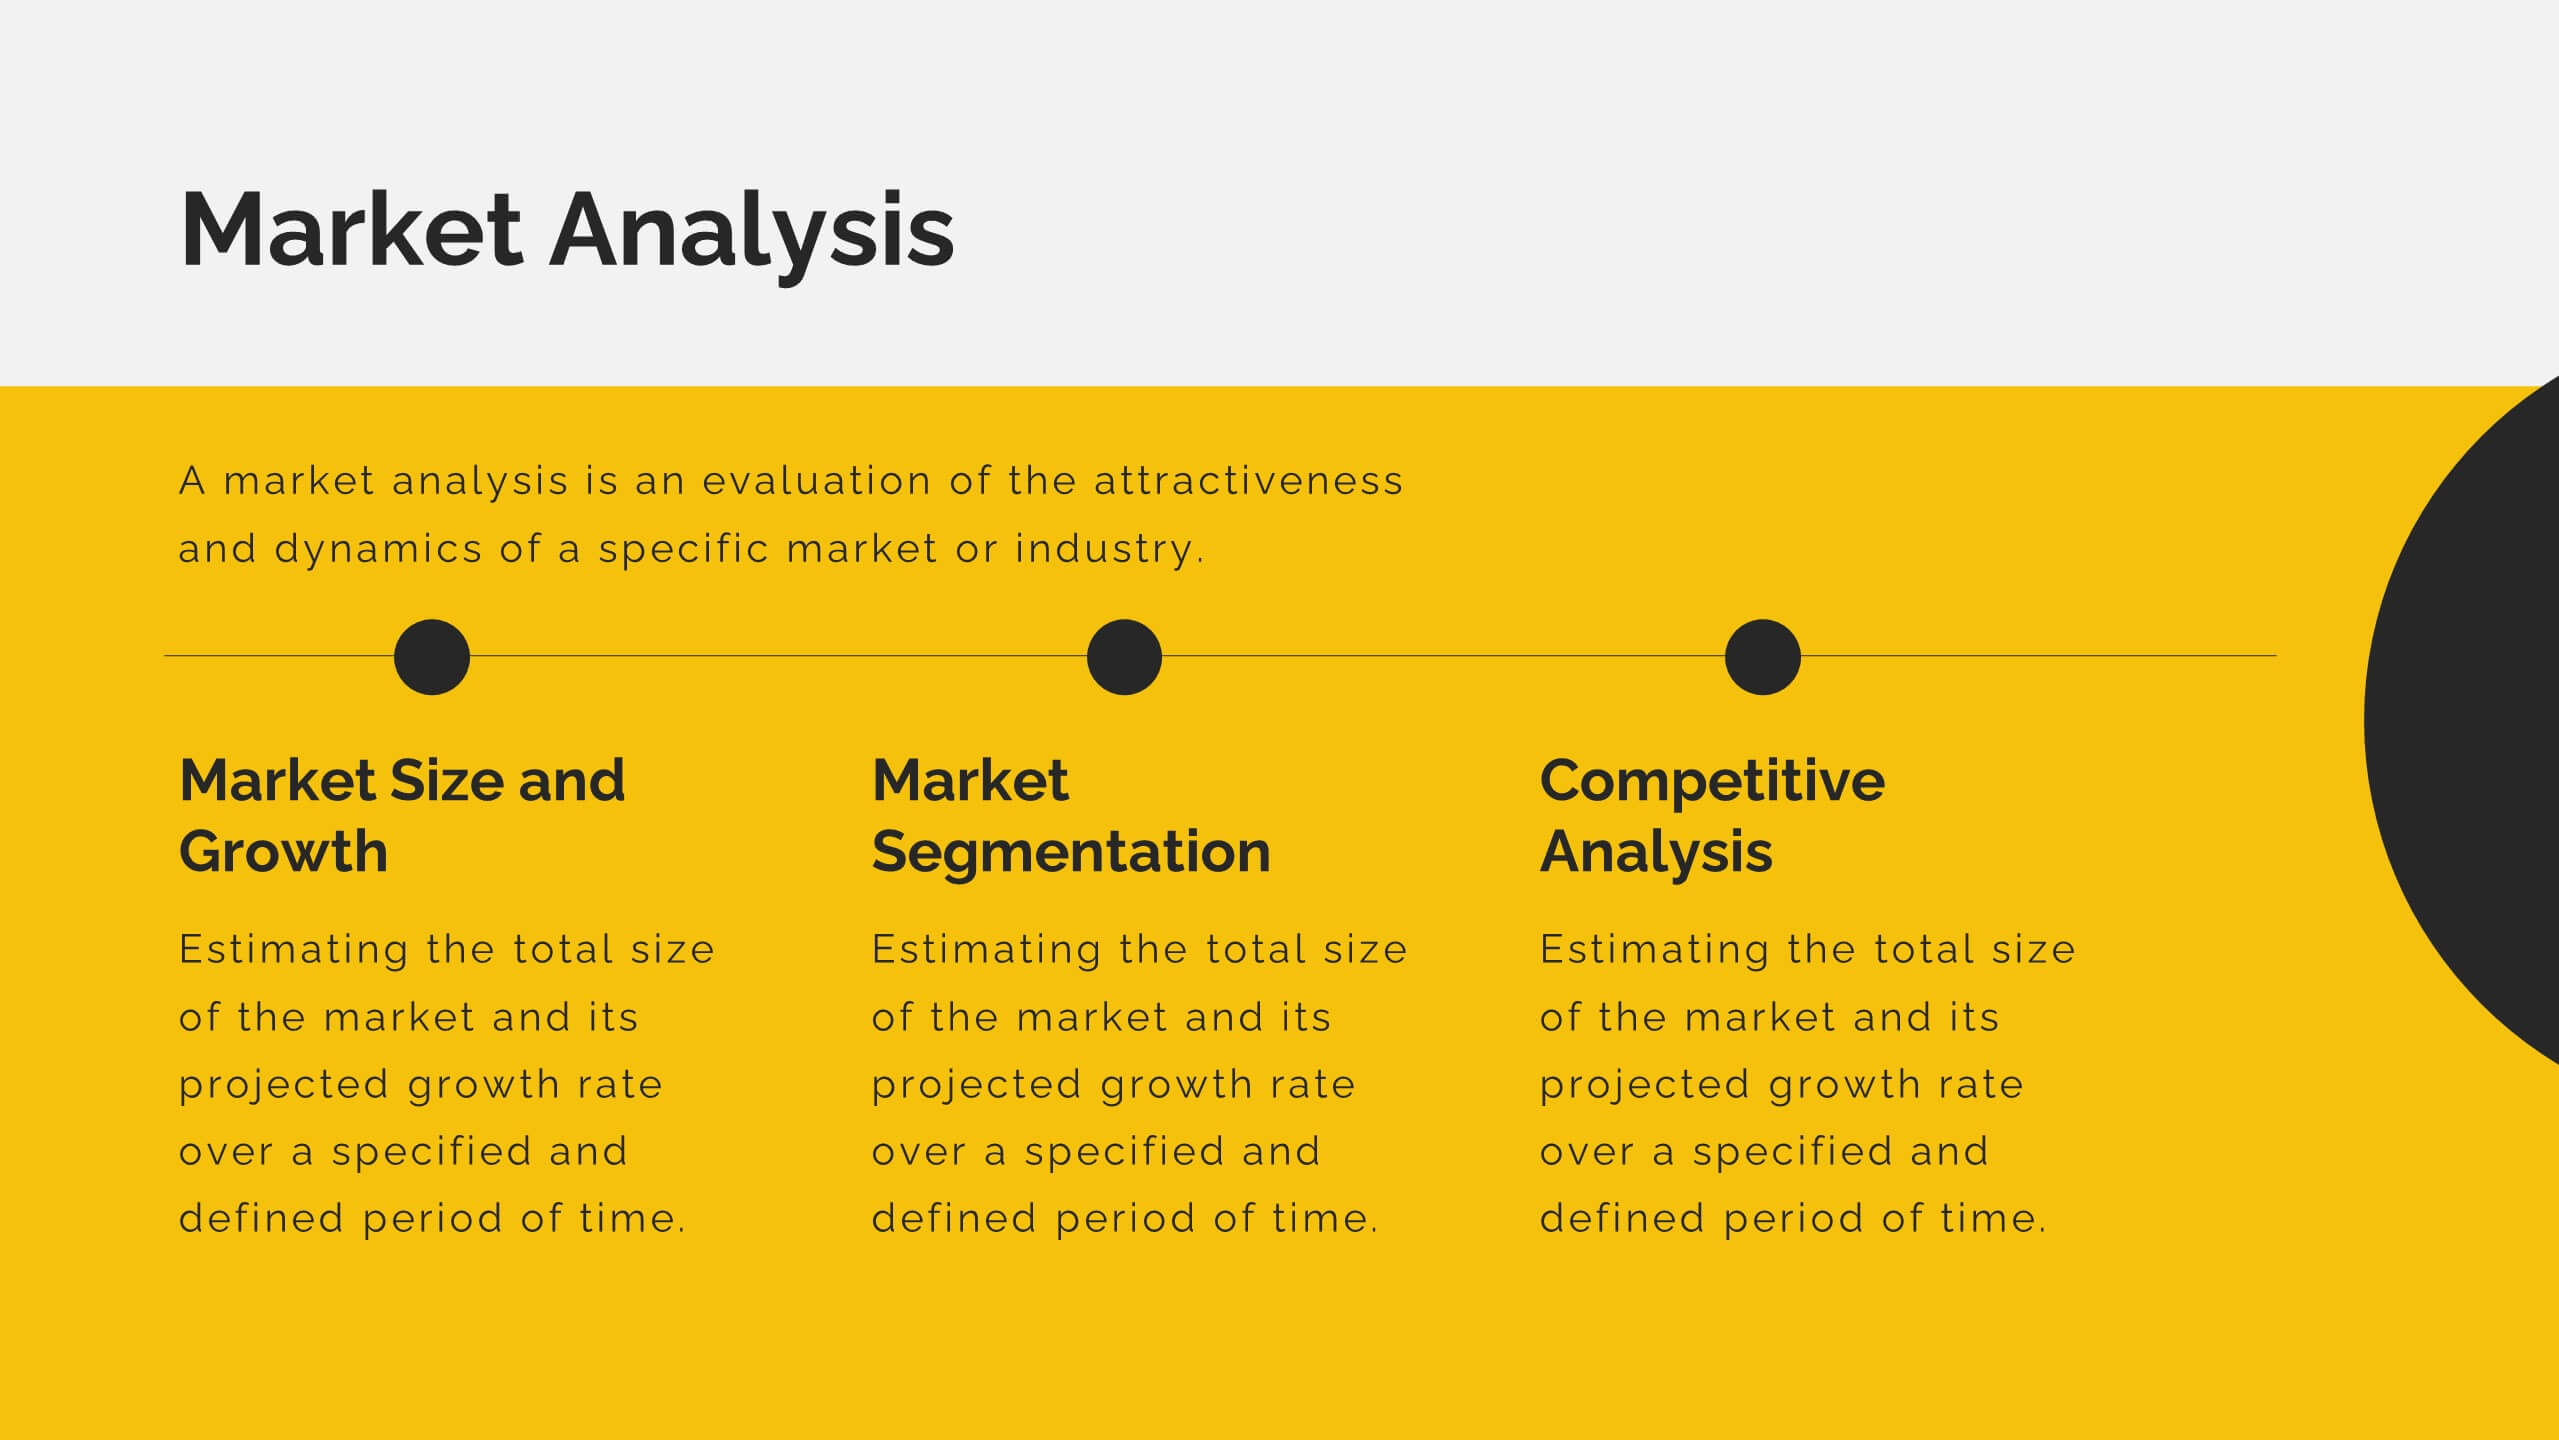
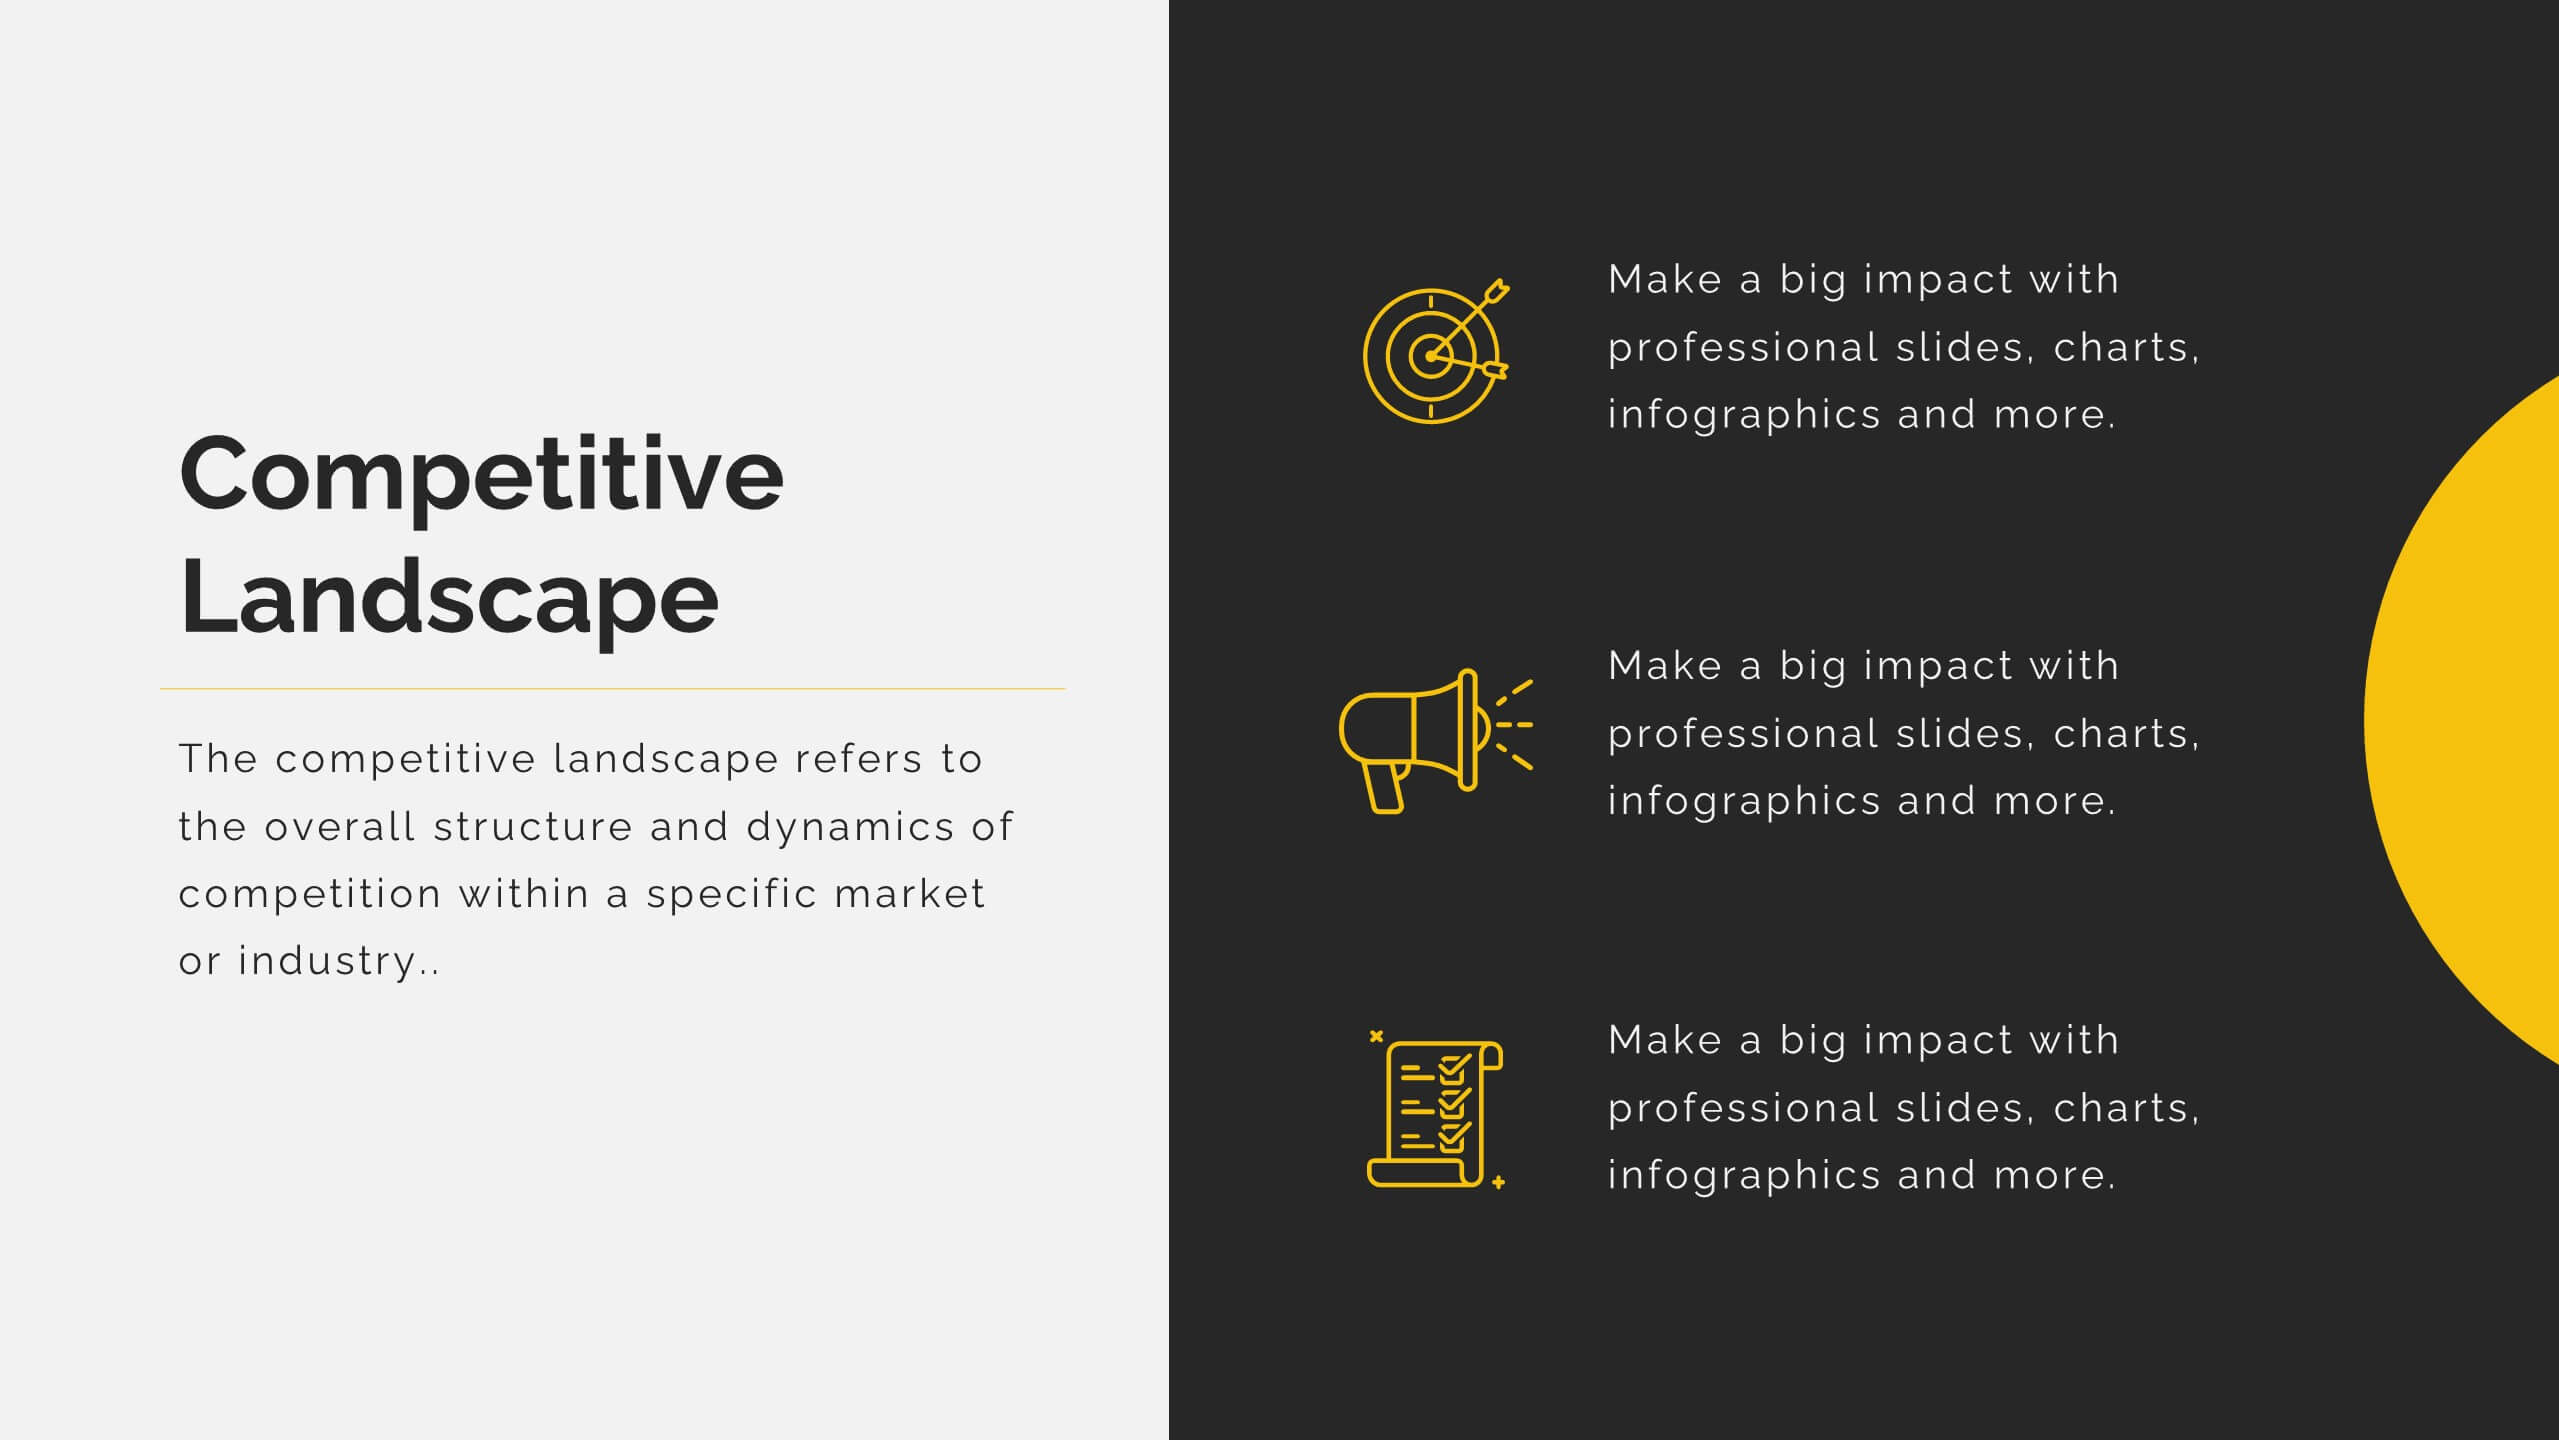
Secure funding with this dynamic startup proposal template! Perfect for presenting your mission, vision, business model, and market analysis. Ideal for entrepreneurs aiming to impress investors and stakeholders. Compatible with PowerPoint, Keynote, and Google Slides, this template ensures your proposal is clear, professional, and compelling. Achieve your startup goals today!


6 slides
6-Stage Business Cycle Presentation
The "6-Stage Business Cycle Presentation" template expertly outlines the progression of business processes through a visually appealing circular diagram, perfect for detailed strategic presentations. This template features six interconnected stages, each distinguished by unique colors and intuitive icons, simplifying complex business concepts into digestible segments. Central placeholders allow for concise titles and brief descriptions, enhancing clarity and comprehension. Ideal for business analysts, strategists, and educators, this tool facilitates the effective communication of developmental cycles, operational processes, and strategic evaluations. Use this template in board meetings, workshops, or educational sessions to convey the cyclical nature of business tasks and strategies efficiently.


10 slides
Hierarchy Tree Structure Slide Presentation
Bring your ideas to life with a dynamic visual flow that connects every stage of your business strategy. Perfect for mapping growth, processes, or team structures, this clean and modern layout keeps your data clear and engaging. Fully compatible with PowerPoint, Keynote, and Google Slides for effortless customization.


7 slides
Training Infographic Presentation Template
Training is the foundation of a successful business. It gives everyone a great understanding of their responsibilities and the knowledge and skills they need to do that job. Training is essential for your new employees. The purpose of this template is to promote effective communication and understanding on the importance of training. Training is an essential part of growing your company. This presentation will allow you to show how training is an opportunity to learn new skills and improve on existing ones. This template provides a fun and professional layout that your employees will love.


6 slides
Logistic Growth Infographics
Explore the concept of Logistic Growth with our customizable infographic template. This template is fully compatible with popular presentation software like PowerPoint, Keynote, and Google Slides, allowing you to easily customize it to illustrate and communicate the key principles of logistic growth. The Logistic Growth infographic template offers a visually engaging platform to explain the concept of population growth, including the phases of exponential growth and leveling off. Whether you're a student, educator, or researcher, this template provides a user-friendly canvas to create informative presentations and educational materials on logistic growth. Deepen your understanding of Logistic Growth with this SEO-optimized infographic template, thoughtfully designed for clarity and ease of use. Customize it to showcase the growth curve, carrying capacity, and factors affecting population dynamics, ensuring that your audience gains a comprehensive grasp of this important ecological concept. Start crafting your personalized infographic today to explore the dynamics of Logistic Growth.


12 slides
Business Event Planning Schedule Presentation
Optimize your event planning with the Business Event Planning Schedule template, which streamlines your organization efforts by providing a clear timeline from January to June. It's perfect for entering key business insights or data at various stages. Designed for adaptability, this template ensures your planning remains concise and relevant. Compatible with PowerPoint, Keynote, and Google Slides, it integrates effortlessly into your workflow.


7 slides
Budget Forecasting Spreadsheet Infographic
Step into the strategic realm of budget forecasting with our detailed infographic. Cast in the reliability of blue, the vibrancy of orange, and the optimism of yellow, our template is a beacon of financial foresight. Equipped with precise infographics, intuitive icons, and adaptable image placeholders, it transforms financial data into a predictive narrative. Flawlessly tailored for Powerpoint, Keynote, or Google Slides. An essential tool for financial analysts, business strategists, accountants, or any professional navigating the future financial terrains of their organization. Forecast with confidence; let every slide be a roadmap to financial prudence.


26 slides
Spellis Rebranding Project Plan Presentation
Revamp your brand’s identity with this sleek and strategic presentation template. Covering key aspects such as brand values, audience personas, strategy, positioning, and future development, this template ensures a comprehensive rebranding approach. Fully customizable and compatible with PowerPoint, Keynote, and Google Slides for seamless use.


5 slides
Data Analytics Heat Map
Visualize data intensity and trends effortlessly using this heat map-style layout. Ideal for performance tracking, comparative analysis, and decision-making frameworks, this slide organizes information by low, medium, and high value ranges. Fully customizable in PowerPoint, Keynote, and Google Slides.


6 slides
Demographic Data Analysis
Visualize key population insights with this Demographic Data Analysis slide, designed as a segmented pie chart with icon-based representation. Perfect for showcasing audience breakdowns, customer profiles, or survey results across five demographic categories. Fully editable in PowerPoint, Keynote, and Google Slides.


5 slides
Multi-Level Concentric Circles Framework Presentation
Visualize relationships and layered strategies with the Multi-Level Concentric Circles Framework Presentation. This template uses interlinked circular nodes to represent multi-tier systems, process flows, or strategic components in an intuitive layout. Easily editable in PowerPoint, Keynote, and Google Slides for seamless integration into your presentations.


20 slides
Whisper Creative Portfolio Presentation
The Creative Portfolio Presentation Template is a visually striking 20-slide design, ideal for showcasing your professional work or services. It features slides for introductions, about us, portfolio overviews, and individual project highlights. Key sections include philosophy, style, creative process, client testimonials, awards, and pricing structures. The vibrant yellow and pink gradient elements provide a modern, creative flair that grabs attention. Fully customizable and compatible with PowerPoint, Keynote, and Google Slides, this template is perfect for designers, agencies, and freelancers aiming to present their work professionally and uniquely.


14 slides
Business Model Canvas Presentation
Our Business Model Canvas presentation template is an invaluable tool for entrepreneurs and business strategists to map out their business model in a clear and structured way. It begins with an engaging title slide that announces the topic, leading to an explanatory slide on what a business model entails. The template includes dedicated slides for each segment of the business model canvas, allowing for a detailed analysis of your value proposition, customer segments, key partnerships, channels, customer relationships, key activities, key resources, and your cost structure. Each slide is designed for clarity, ensuring that the audience can easily follow the intricacies of your business model. The final sections provide space for outlining your revenue streams, highlighting the importance of diversification and sustainability. The presentation wraps up with a concise conclusion and credits slide for sourcing acknowledgments. This template is perfect for PowerPoint, Keynote, and Google Slides, designed to facilitate a comprehensive understanding of your business model for both internal and external stakeholders.


7 slides
TAM SAM SOM Infographic Presentation Template
TAM, SAM and SOM are acronyms that represents different subsets of a market. Which stand for (TAM) Total Addressable Market, (SAM) Serviceable Addressable Market, and (SOM) Serviceable Obtainable Market. Understanding these acronyms can help you better target your marketing efforts to potential customers. This presentation template is a great tool to organize and plan any of your important business projects. Using this template can become critically important to the very foundation of your business model, and TAM, SAM, SOM should be key components to craft the details of your business plan.


6 slides
Strategy Wheel Infographic Slide
Present key strategies, priorities, or action items in a visually engaging circular format. This infographic template is ideal for showcasing 5 interconnected components in business plans, marketing strategies, or process flows. Fully editable in PowerPoint, Keynote, and Google Slides for seamless customization.


7 slides
Inversion Table Infographic
A table infographic is a visual representation of data or information presented in a tabular format, using a combination of text, numbers, and visual elements to make the information more engaging and easily understandable. This infographic template is great for comparing two or more variables and is a powerful way to convey your data. This infographic is designed to show your audience the key points of your data in a visually appealing way. This template is a good option if you want to present your information as an easy-to-read table with labels and numbers. The bright colors and fun design make it easy to see at a glance.