


Features
- 5 Unique slides
- Fully editable and easy to edit in Microsoft Powerpoint, Keynote and Google Slides
- 16:9 widescreen layout
- Clean and professional designs
- Export to JPG, PDF or send by email


Do you have any questions?
Recommend


7 slides
Project Proposal Structure Infographic
Optimize your project planning and presentation with this professional set of project proposal structure templates. Each slide is designed to systematically display project details, from the introduction and objectives to the detailed work plan and budget. These templates are essential tools for project managers, strategists, and business analysts aiming to convey comprehensive project proposals. Structured to support clear communication, the templates feature a logical flow that guides viewers through each critical component of the proposal. The use of a consistent blue color palette and clean typography helps maintain focus on the content, while graphical elements like charts and timelines visually break down complex information, making it easily digestible for stakeholders. Fully customizable, these templates allow for easy adaptations to specific project needs, enabling precise tailoring of text, color, and design elements. Whether for internal project approval or external client pitches, these slides will help you present a clear, structured, and persuasive project proposal.


20 slides
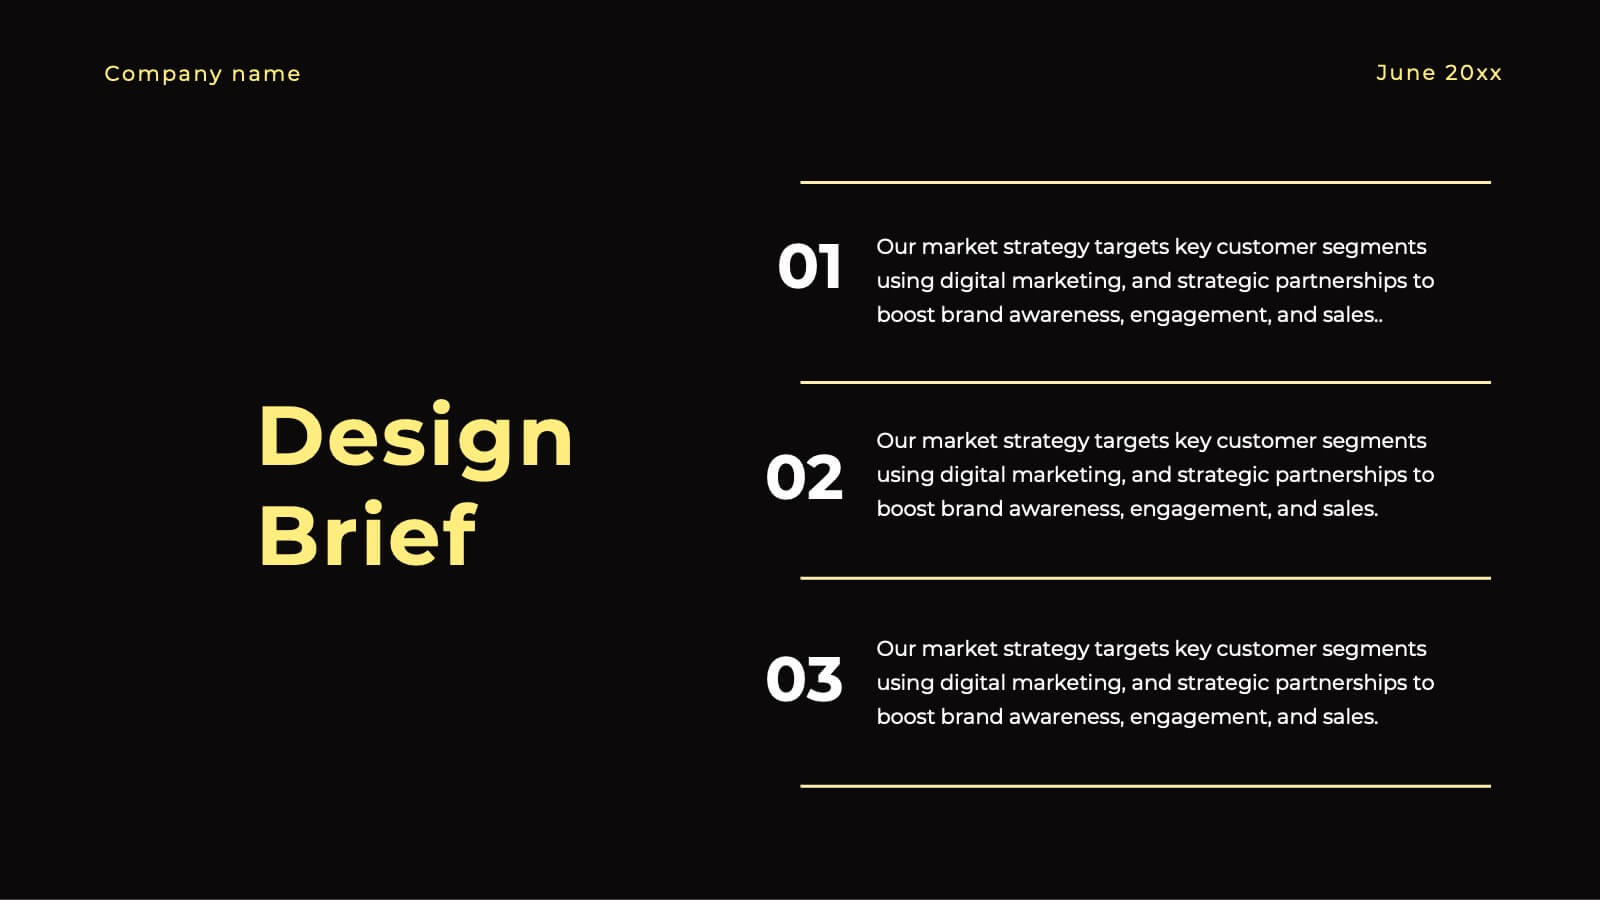
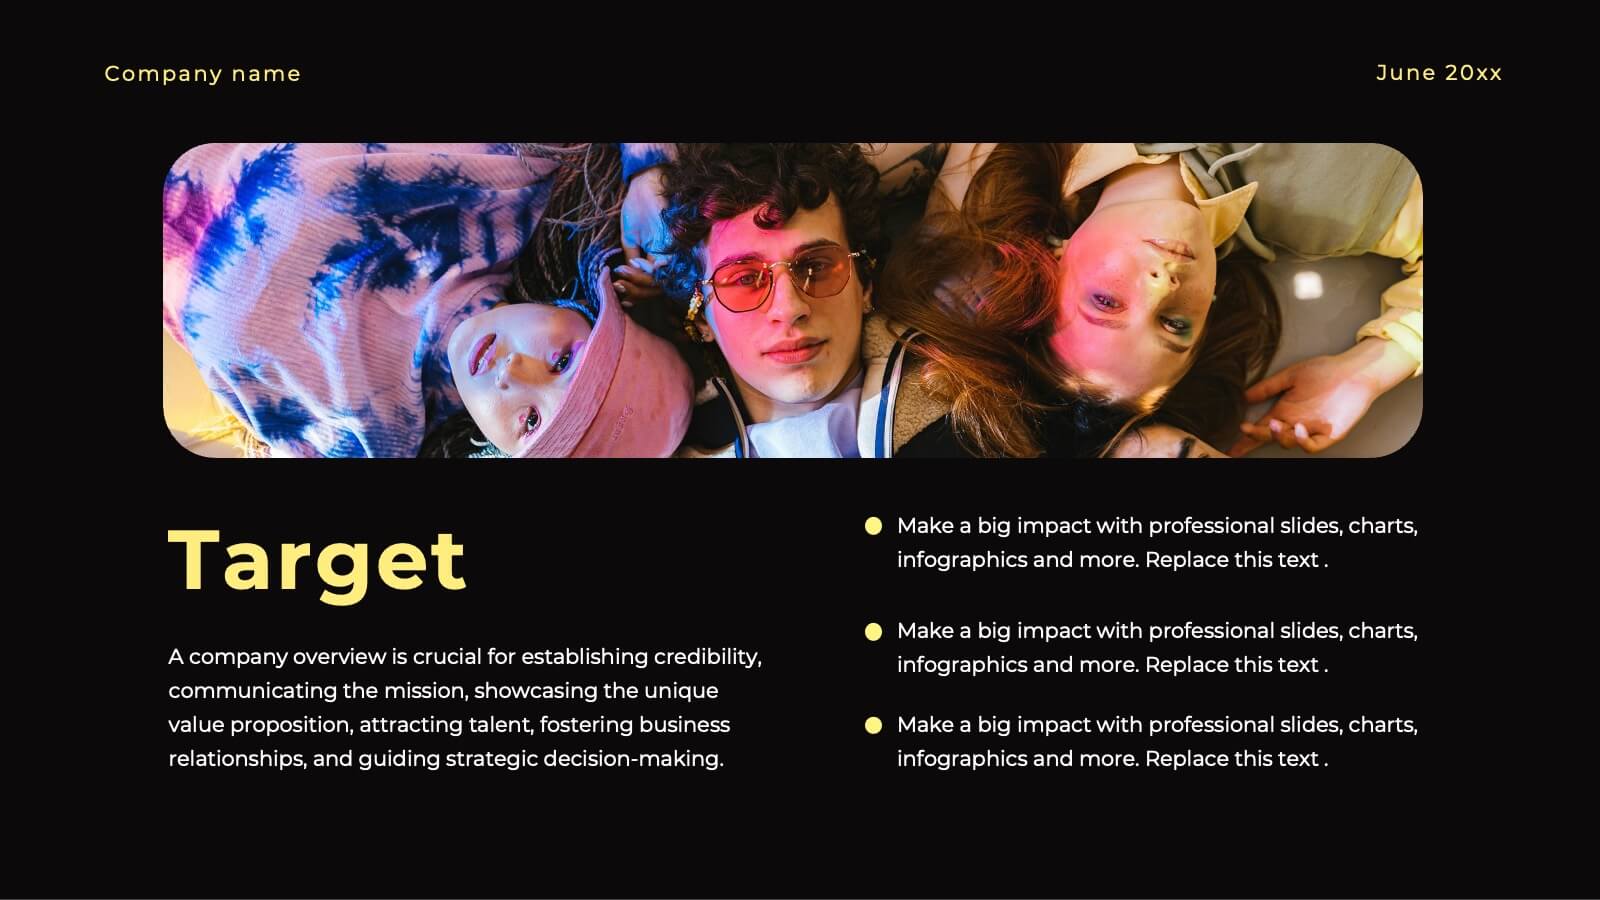
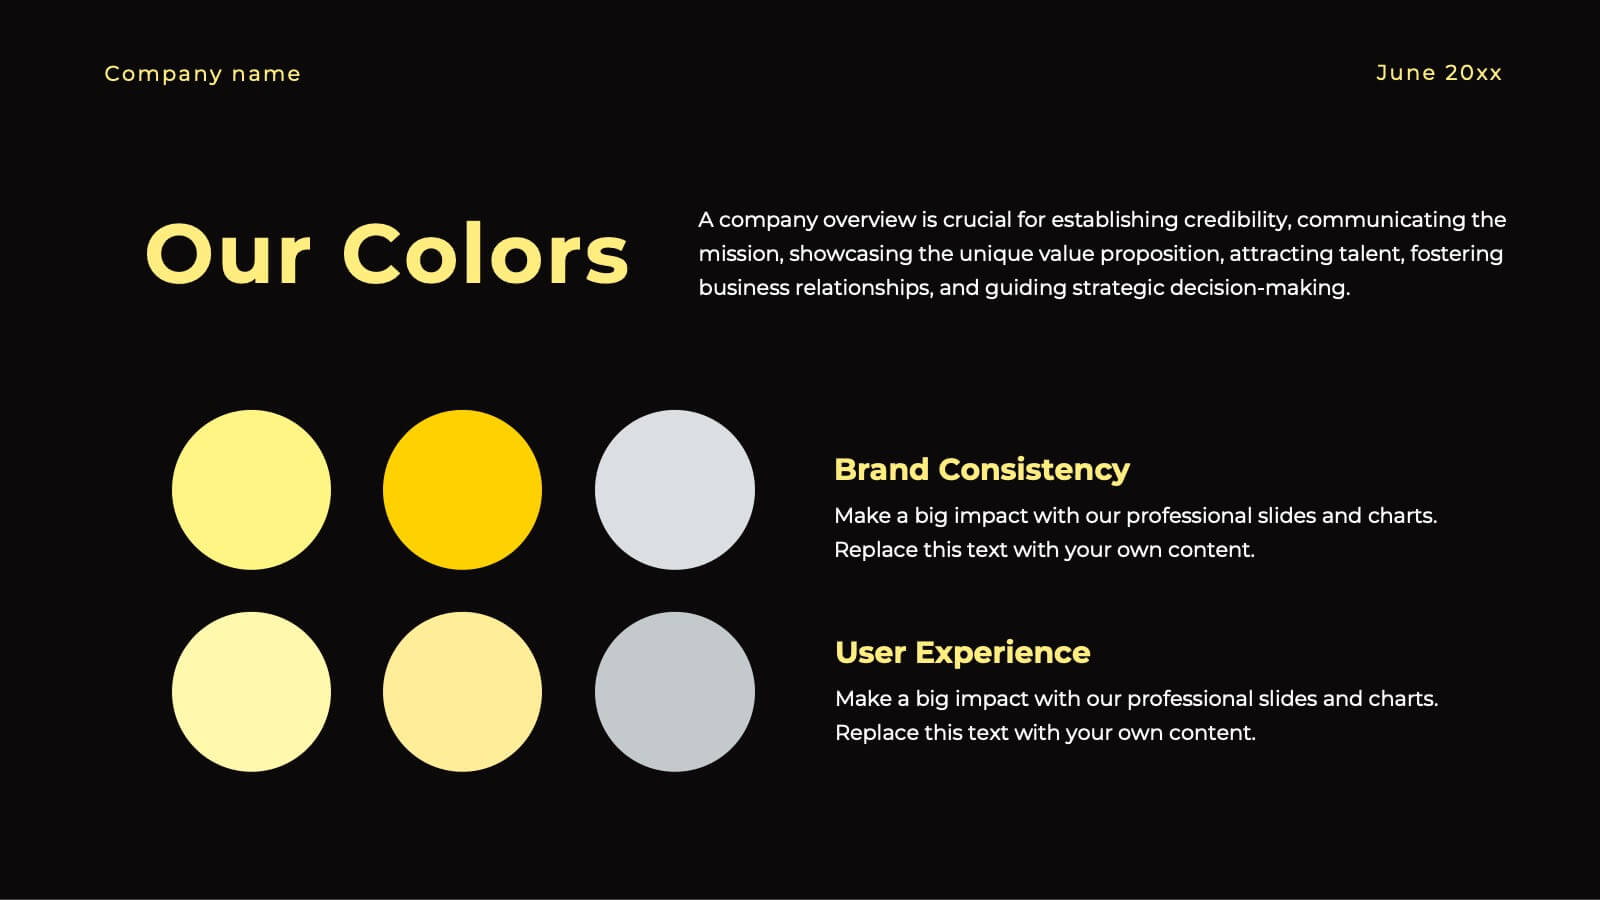
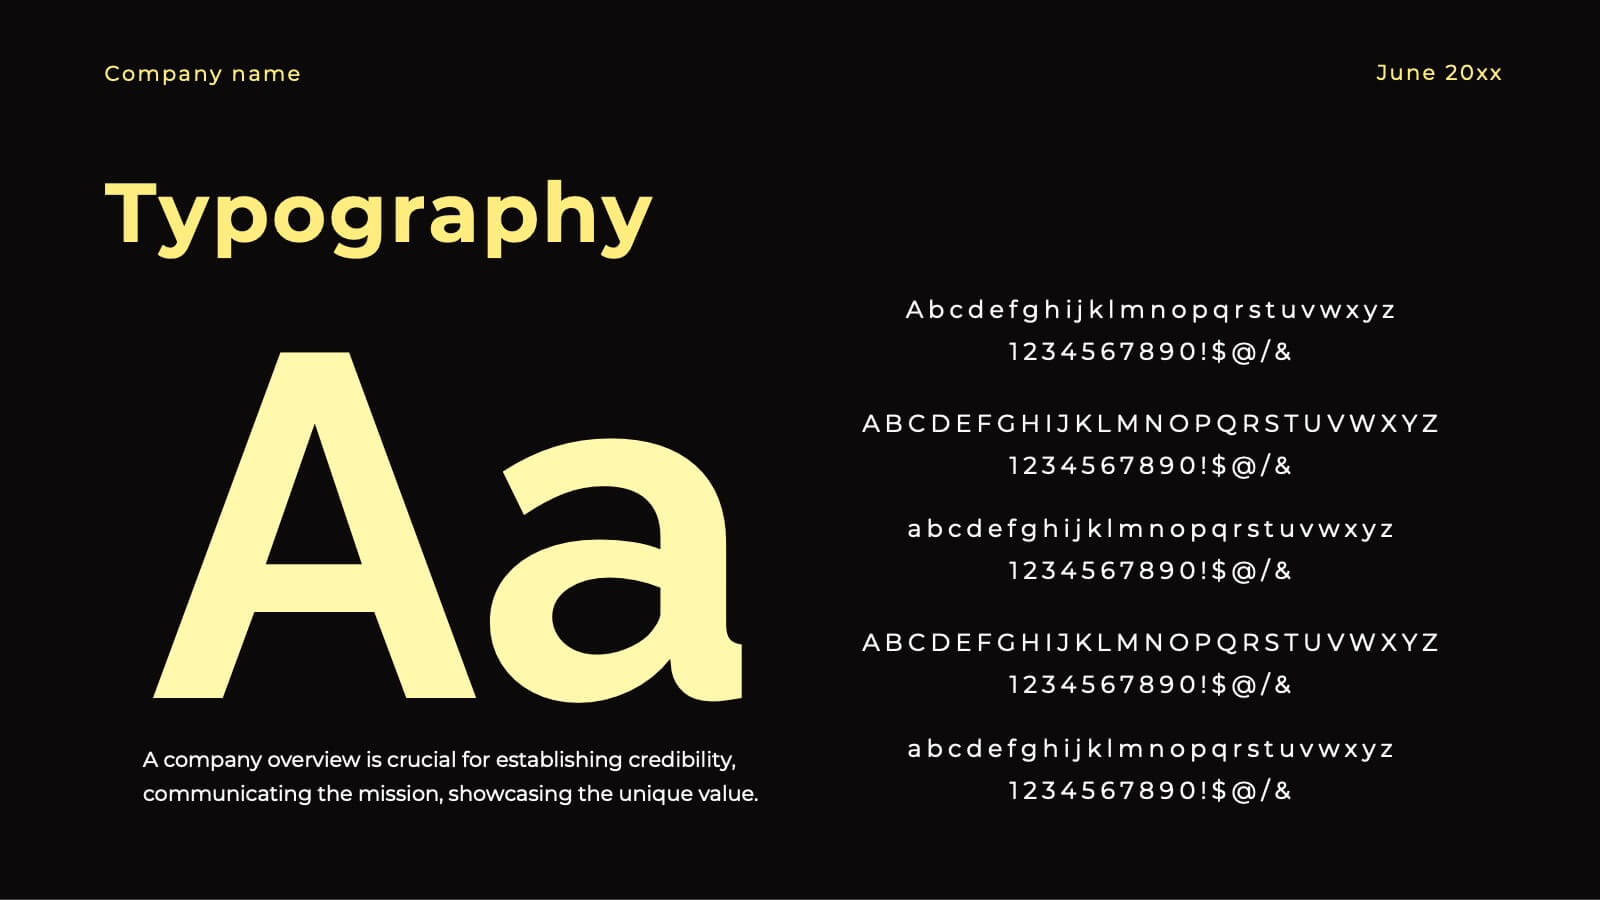
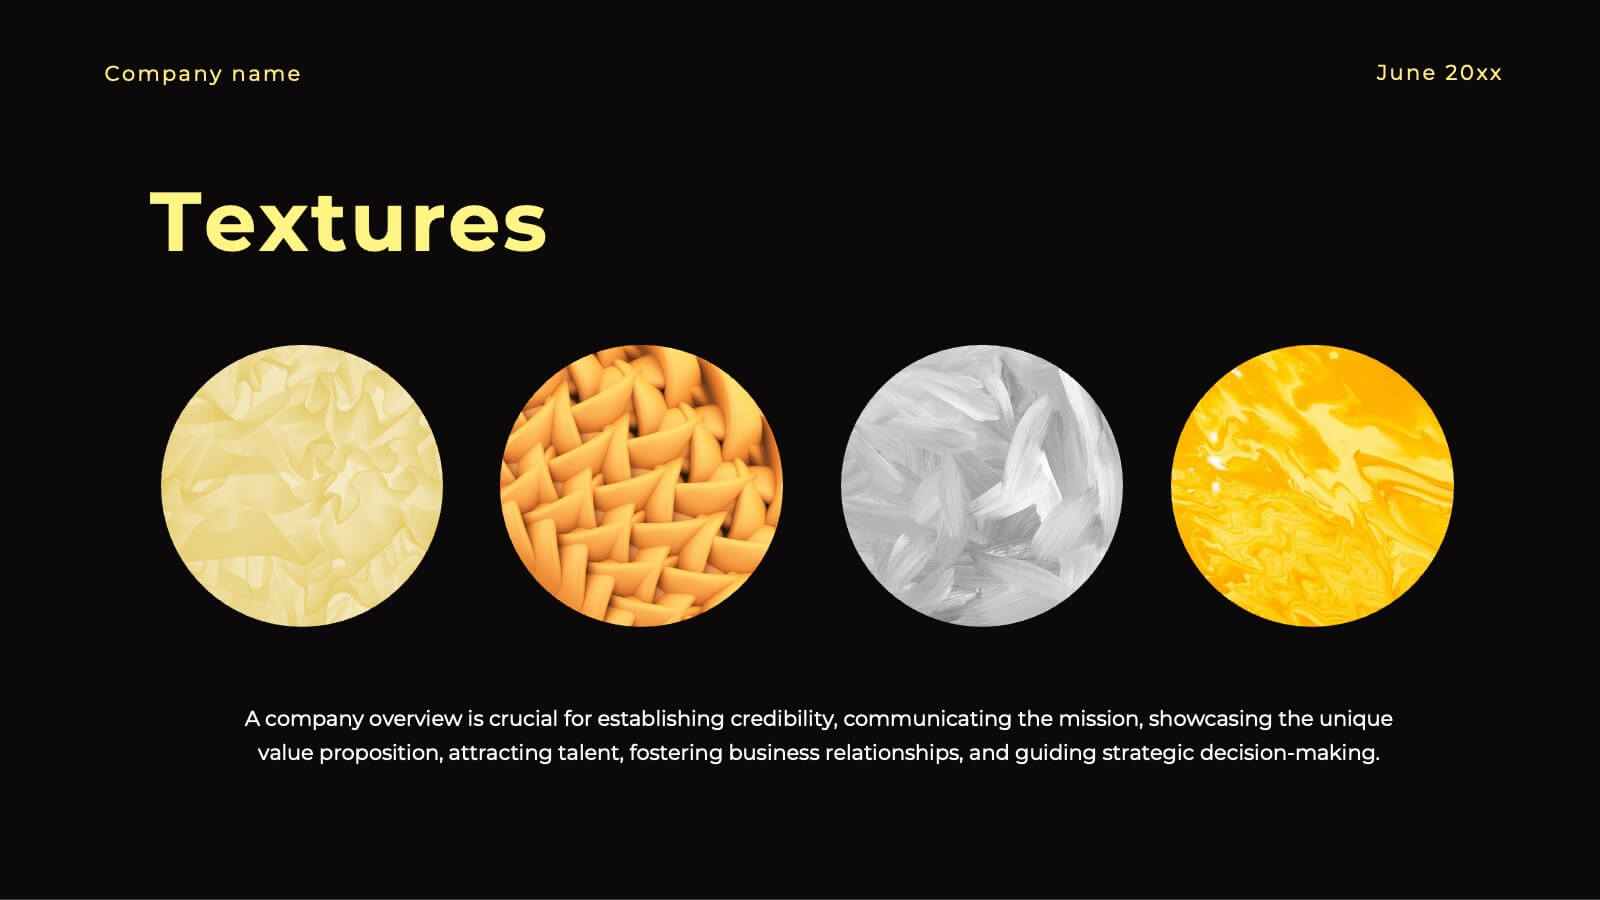
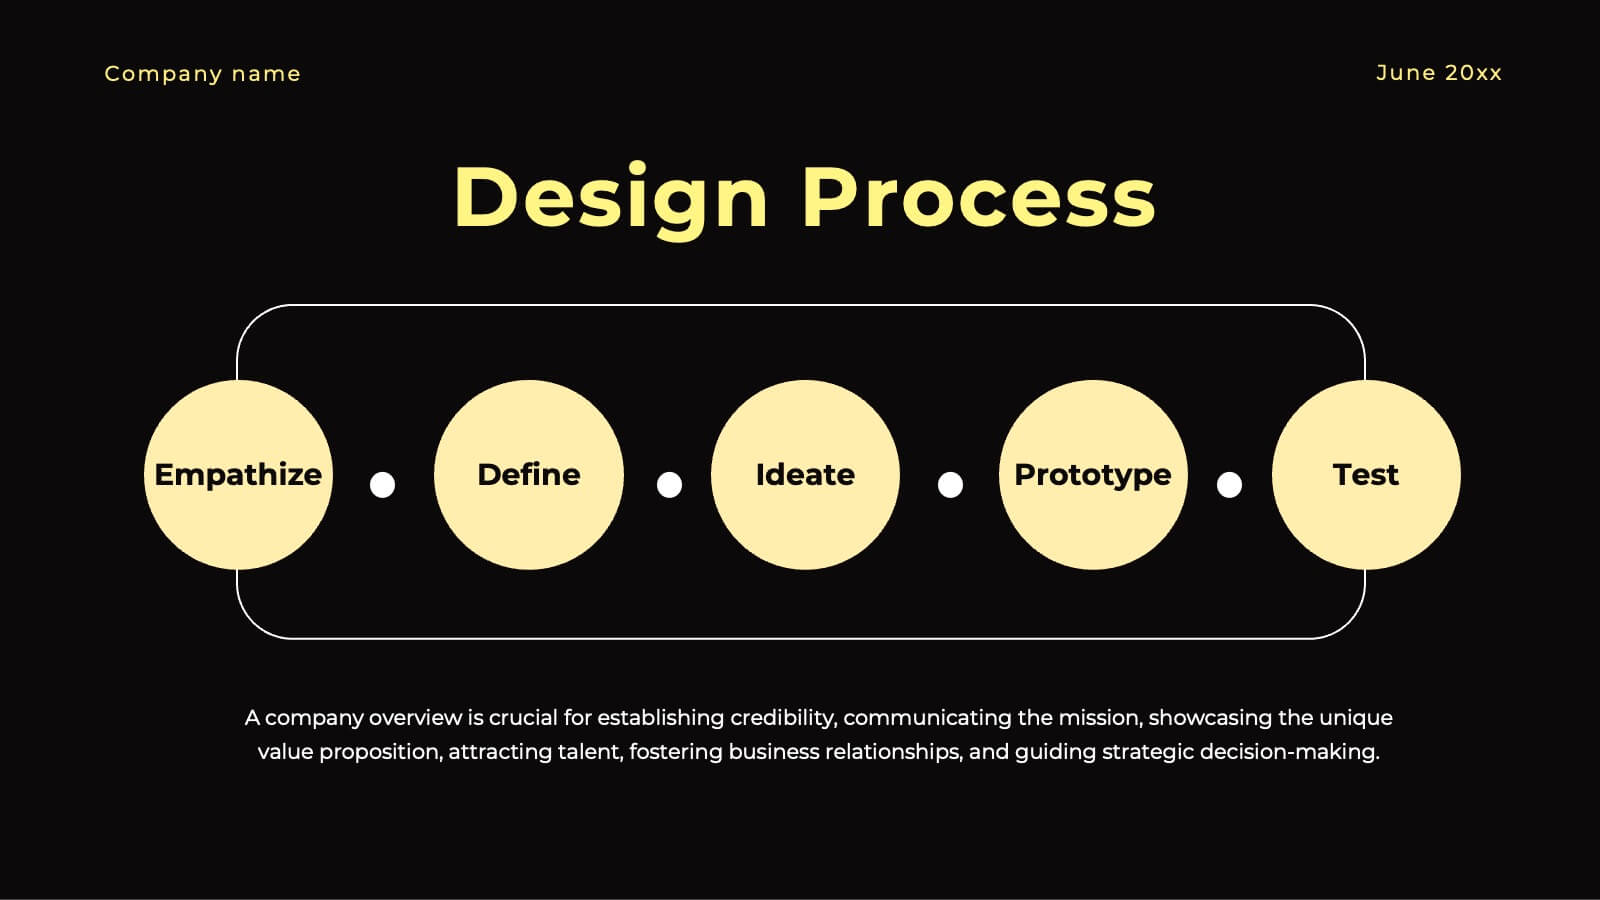
Ignite Creative Design Report Presentation
Unleash your creativity with this stunning design presentation template! Perfect for showcasing concept development, design processes, and final prototypes, it includes slides for typography, color palettes, and project timelines. Captivate your audience with sleek visuals and detailed content. Compatible with PowerPoint, Keynote, and Google Slides for seamless presentations on any platform.


5 slides
Editable RACI Chart Presentation
Streamline your team’s responsibilities with this clean and easy-to-use RACI chart template! Perfect for project managers, this presentation helps define who is Responsible, Accountable, Consulted, and Informed for each task. Simplify workflows, boost collaboration, and keep everyone aligned. Fully editable and compatible with PowerPoint, Keynote, and Google Slides for seamless customization.


5 slides
Market Segmentation by Demographics Presentation
The "Market Segmentation by Demographics" presentation template showcases a circular infographic that effectively visualizes market segments as distinct demographic groups. Each colored section of the circle corresponds to a different demographic characteristic, such as age, income, or location, and is accompanied by key insights or data points in adjacent text placeholders. This format allows for an intuitive comparison of how each segment contributes to the market, facilitating a clear understanding of the audience composition. This visual arrangement is especially useful for presentations that need to highlight demographic data succinctly to support market analysis or strategic marketing decisions.


3 slides
Hierarchy of Needs Pyramid Visual Presentation
Simplify complex priorities with this Hierarchy of Needs Pyramid Visual presentation. Designed to illustrate layered structures or business priorities, this editable 3D-style pyramid highlights three distinct tiers with customizable text and bold letter labels. Perfect for strategy slides or organizational models in Canva, PowerPoint, or Google Slides.


8 slides
Identifying and Addressing Business Problems Presentation
Break down challenges with clarity using this structured 4-step business problem-solving slide. Highlight each issue with its own icon, number, and explanation, making it easy to communicate obstacles and outline solutions. Ideal for team strategy meetings, leadership briefings, or client reports. Fully customizable in PowerPoint, Keynote, and Google Slides.


4 slides
Audience Demographic Profile Overview
Present audience composition with clarity using the Audience Demographic Profile Overview Presentation. This slide is designed to showcase gender-based or group-specific data through visual figures, percentage markers, and supporting bar charts. Ideal for marketers, analysts, and researchers who need to communicate user distribution and behavior insights. Fully editable in PowerPoint, Keynote, and Google Slides.


6 slides
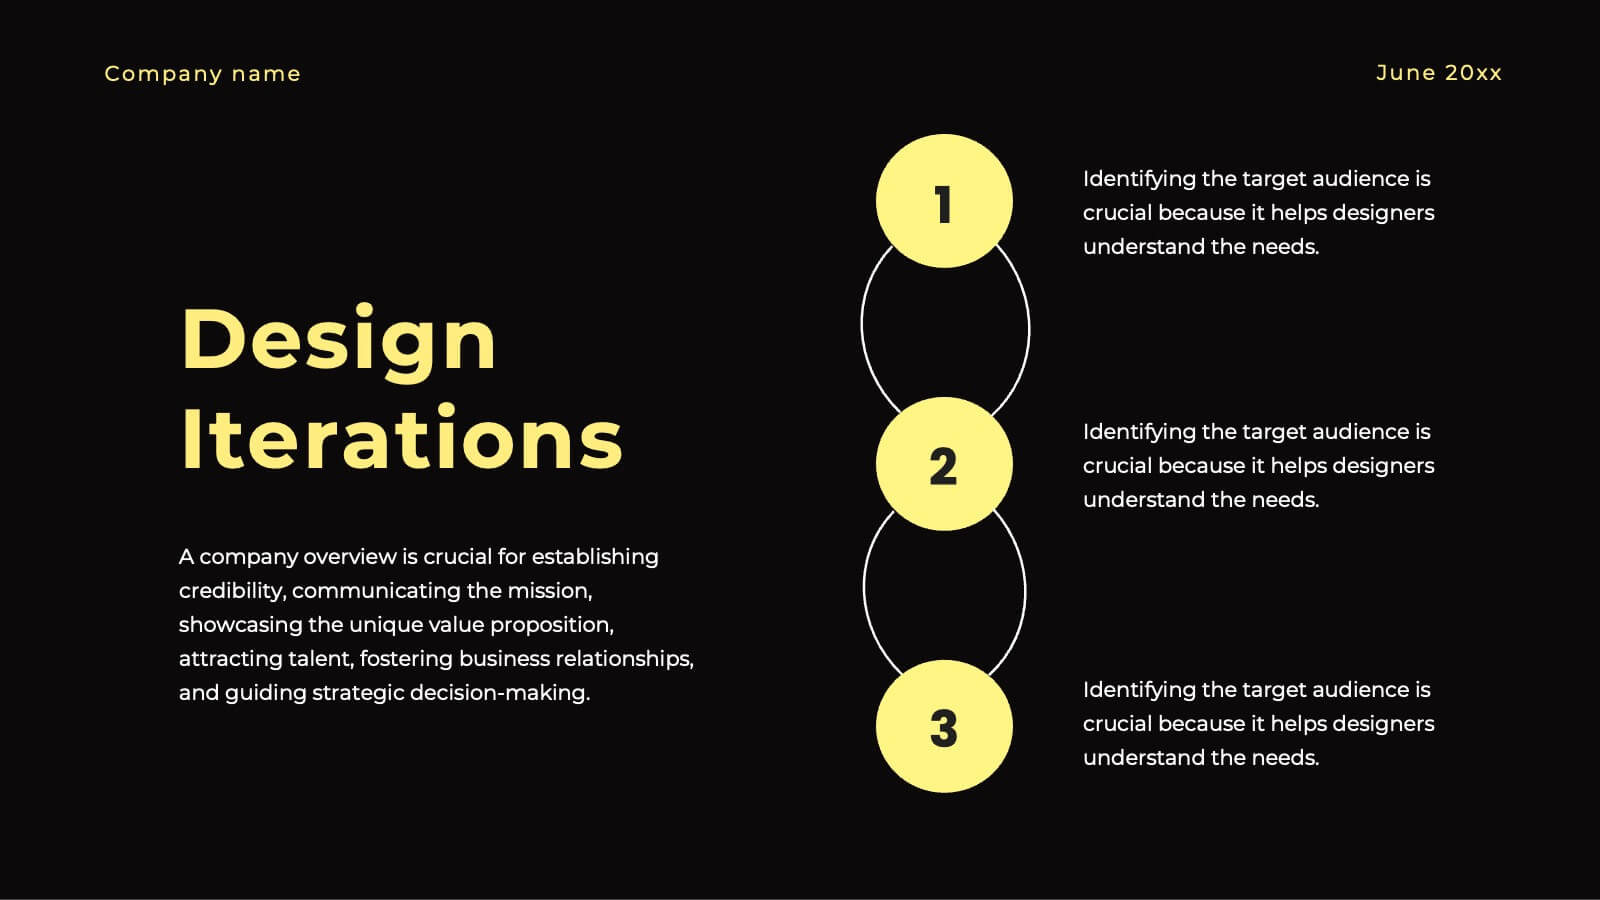
Modern Circle Infographic
Our Modern Circle infographic is a contemporary visual tool designed for seamless integration with Powerpoint, Keynote, and Google Slides. This infographic is particularly useful for professionals and educators looking to present information in a cyclical process or to illustrate a concept that involves interconnected elements. The design of the Modern Circle infographic is intuitive and engaging, facilitating the representation of processes, relationships, or statistics in a clear, circular format. The sleek and modern aesthetic ensures that your information is conveyed in a visually appealing manner, keeping your audience engaged and focused on the content. By utilizing this infographic, you have the ability to present complex data or concepts in a simplified form, making it accessible for all audience types. Whether you’re detailing a business cycle, demonstrating a feedback loop, or presenting a series of steps in a continuous process, the Modern Circle infographic is your go-to for adding a touch of sophistication to your presentations. Its adaptability and stylish design will enhance your ability to communicate effectively with any audience.


6 slides
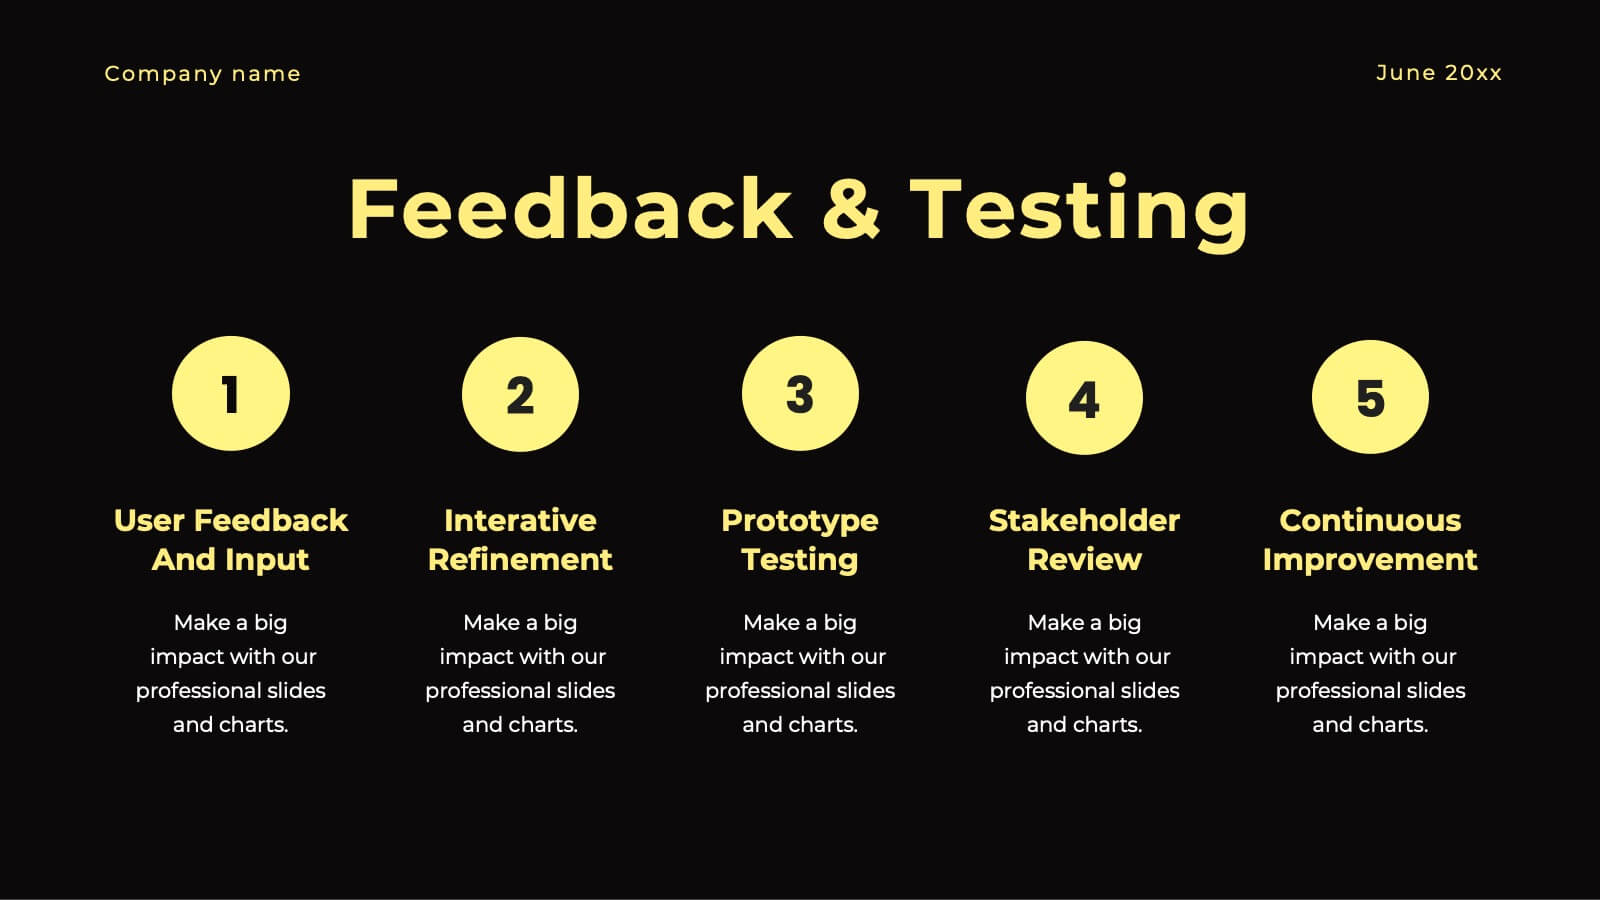
Presentation Roadmap Agenda Outline
Plan your sessions with clarity using the Presentation Roadmap Agenda Outline Presentation. This sleek visual tracks five key points along a timeline, using numbered markers and matching text areas—perfect for agendas, project stages, or presentation flows. Fully customizable in PowerPoint, Keynote, and Google Slides.


7 slides
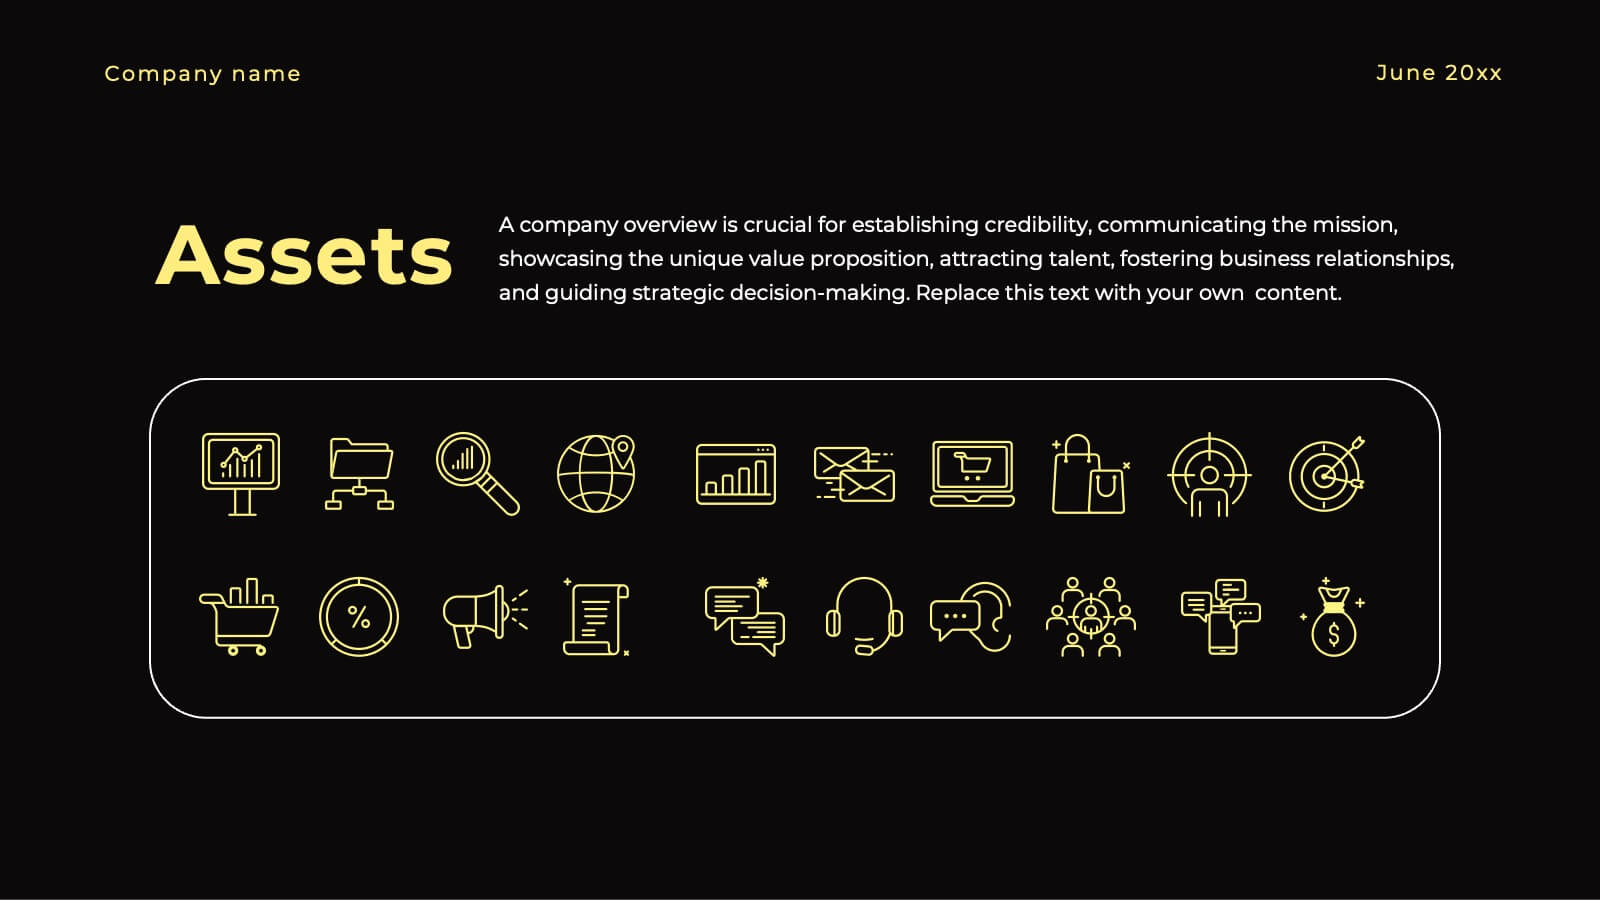
Big Data Infographic Presentation Template
This Big Data Infographic template is the perfect tool for any business presentation. This template has been designed to help you create truly engaging data-driven visuals, with powerful typography and interesting details that help draw in your audience. Introduce your business to the world with this big data infographic template. It's just what you need to describe the role of big data in the evolution of modern businesses. Our Big Data Infographic Presentation features all the tools for you to create wonderful charts, graphs, transitions and striking shapes both for your text and images.


4 slides
Regional Analytics for North America Map Presentation
Visualize key performance metrics by region with the Regional Analytics for North America Map Presentation. This slide layout combines stacked bar visuals with a detailed map, allowing you to compare data points across multiple regions. Ideal for reporting trends, KPIs, or market analysis. Fully editable in Canva, PowerPoint, and Google Slides.


5 slides
Pet Care Infographics
Pet care refers to the practices and actions taken to ensure the well-being, health, and happiness of pets. These vertical infographic templates are perfect for providing essential information and tips for pet owners to ensure the well-being and proper care of their furry companions. This infographic is designed to present key aspects of pet care in a concise and engaging manner, making it a valuable resource for pet owners, veterinarians, pet stores, or any organization related to pet care. Compatible with Powerpoint, Keynote, and Google Slides. Use the text boxes and graphs to promote responsible pet ownership and provide valuable information about pet care.


5 slides
Responsibility Assignment Matrix Slide
Make project accountability crystal clear with this smart and structured matrix designed for assigning responsibilities across roles. Ideal for outlining who's doing what in multi-team environments, this slide keeps everyone on the same page using the classic RACI method. Fully compatible with PowerPoint, Keynote, and Google Slides.


6 slides
Iceberg Business Infographic
Delve beneath the surface with our Iceberg Business Infographic, perfect for Powerpoint, Google Slides, and Keynote. This infographic is designed to illustrate the underlying factors that impact an organization's success. The iceberg metaphor visually represents the concept that only a small part of a company's situation is visible above the surface, while much more is hidden below. The customizable segments can be used to detail various aspects of business operations, risks, and opportunities that are not immediately apparent. By employing this Iceberg Business infographic, you can effectively communicate the complexities of business strategies.


5 slides
Food Waste in School Infographics
Food Waste in schools is a significant issue that can have economic, environmental, and social impacts. These vertical infographics aim to raise awareness about the magnitude of the problem and provide actionable steps to reduce food waste in schools. These can be used as valuable tools to highlight the issue of food waste in school environments. The visually appealing illustrations, informative content, and color schemes make it effective for raising awareness and promoting sustainable practices in school environments. Compatible with Powerpoint, Keynote, and Google Slides.


4 slides
Healthcare Procedure and Diagnosis Presentation
Simplify medical communication with the Healthcare Procedure and Diagnosis Presentation. Featuring clean visuals like syringes, hearts, and med kits, this layout is ideal for outlining treatment stages, clinical processes, or patient care steps. Perfect for hospitals, clinics, or healthcare startups. Fully editable in PowerPoint, Keynote, Google Slides, and Canva.


6 slides
Project Management Responsibility Assignment Matrix Infographics
Effectively assign responsibilities in your projects with our Project Management Responsibility Assignment Matrix (RAM) infographic template. This template is fully compatible with popular presentation software like PowerPoint, Keynote, and Google Slides, allowing you to easily customize it to illustrate and communicate the roles and responsibilities of team members in your project. The Project Management RAM infographic template offers a visually engaging platform to outline the key tasks, deliverables, and responsibilities of project team members. Whether you're a project manager, team leader, or involved in project planning, this template provides a user-friendly canvas to create informative presentations and project management materials. Optimize your project management processes with this SEO-optimized Project Management RAM infographic template, thoughtfully designed for clarity and ease of use. Customize it to showcase the matrix structure, define roles (RACI), and ensure that everyone on the team understands their responsibilities, ensuring efficient project execution. Start crafting your personalized infographic today to excel in project management responsibility assignment.