


Features
- 7 Unique slides
- Fully editable and easy to edit in Microsoft Powerpoint, Keynote and Google Slides
- 16:9 widescreen layout
- Clean and professional designs
- Export to JPG, PDF or send by email


Do you have any questions?
Recommend


5 slides
Effective Time Management Strategies Presentation
Master productivity with structured time management strategies using this Effective Time Management Strategies template. Featuring a dynamic stopwatch visual, this slide is perfect for presenting key productivity techniques, time-blocking methods, and efficiency-boosting strategies. Ideal for business professionals, project managers, and personal development trainers, this template is fully customizable and compatible with PowerPoint, Keynote, and Google Slides.


5 slides
Ecological Impact Reduction Strategies Presentation
Present your sustainability efforts with the Ecological Impact Reduction Strategies Presentation. This tree-inspired layout is perfect for outlining key eco-friendly initiatives, from waste management to energy efficiency. Clean visuals and editable elements make it easy to adapt for environmental proposals, reports, or team planning. Fully customizable in Canva, PowerPoint, or Google Slides.


7 slides
Innovation Technology Infographics
Innovation technology refers to the application of technology or the use of innovative approaches to create new products, services, processes, or business models. This infographic template is designed to showcase the cutting-edge technologies shaping our future. Let the vibrant visuals and insightful content guide you through the exciting realm of innovation and technology. Compatible with Powerpoint, Keynote, and Google Slides. Fully customizable, explore this infographic and step into the future. The visuals are designed to ignite your imagination and enlighten your audience about the limitless potential of innovation and technology.


7 slides
Risk Management Plan Infographics
This Risk Management Plan infographic template is a comprehensive tool for identifying and assessing potential risks in projects or business operations. Compatible with PowerPoint, Google Slides, and Keynote, it features a range of visual aids including risk matrices, probability scales, and impact graphs. Each slide is tailored to categorize risks by severity, from low to high, and includes customizable fields for detailed risk descriptions and mitigation strategies. The color-coding aids in quick recognition of risk levels, and the straightforward design ensures clarity in communication. Ideal for project managers and business strategists, this template streamlines the process of risk analysis and planning in any professional presentation.


7 slides
Business People Infographic Presentation Template
This Business People infographic template is perfect for a business handbook, corporate presentation and briefing. This template is designed with subtle colors and textures, the clean layout makes it easy to highlight important data and the many components that can be used for different purposes. This is a great, clean and simple way for you to display all the information about your business. This infographic can effectively communicate complex information in a simple and easy-to-understand format, making it an ideal medium for exploring the topic of business people and the business world.


11 slides
Company Team Meeting Presentation
Bring your team together with our dynamic Company Team Meeting presentation template. Designed for clarity and engagement, this template sets the stage for productive discussions, from weekly roundups to strategic planning sessions. It begins with a vibrant cover slide that sets an upbeat tone for the meeting, followed by a clear agenda to keep your discussion on track. With slides tailored for talking points, updates, upcoming events, and deadlines, it helps you streamline the flow of information. The template includes sections for announcements and feedback, encouraging open dialogue. Ground rules are laid out to foster a respectful and collaborative environment, while the progress and challenges slides are perfect for a transparent review of the company's status and addressing any hurdles head-on with practical solutions. This template, adaptable to PowerPoint, Keynote, and Google Slides, not only captures attention with its colorful design but also reinforces team cohesion and focus on common goals. Use it to energize your team meetings and ensure everyone leaves aligned and motivated.


26 slides
Treye Presentation Template
Are you looking for your next template? Treye is a fun professional presentation that includes a lot of patterns and fun shapes. This template is perfect for marketing, social media managers and content creators. It has charts, profit slides and venn diagrams, thus providing you with all the slides needed for an awesome presentation. This templates features a high-impact color scheme that will grab the attention of your audience. Its simple yet fun design makes this template stand out and at the same time keep your audience engaged. Get started creating your next report today with Treye!


5 slides
Construction Processes Infographics
Dive into the construction industry with this detailed infographic template that provides a comprehensive overview of construction processes, careers, and competitive strategies. Ideal for professionals, educators, and students involved in construction, this resource offers a clear and structured presentation of various aspects of the field. The infographic is divided into sections detailing key areas such as industry sectors, job roles, and strategic approaches for sustainable competitiveness. It highlights important segments like planning, finance, legal aspects, and on-site construction activities, all designed to give a well-rounded view of the construction process. Additionally, it includes data on job growth, employment statistics, and future projections, which are crucial for understanding labor market trends within the construction sector. Vibrant colors and easy-to-understand layouts make this template not only informative but also visually appealing. Whether used in training sessions, academic courses, or professional presentations, this infographic is a valuable tool for conveying the dynamic and multifaceted nature of the construction industry.


23 slides
Naiad Qualitative Research Findings Presentation
Dive into your data with this refreshing, Naiad-inspired presentation template, perfect for sharing qualitative research findings! Designed to showcase insights, trends, and key conclusions with clarity, this visually appealing layout ensures your research captivates and informs. Make your data flow effortlessly. Compatible with PowerPoint, Keynote, and Google Slides for easy customization.


6 slides
Personal Productivity Time Management Techniques Presentation
Streamline your workflow with the Personal Productivity Time Management Techniques presentation slide. Featuring a step-by-step staircase layout, this template visually maps out five core techniques or habits leading to improved efficiency and goal achievement. Each step includes an icon and placeholder text for easy customization. Ideal for productivity coaches, corporate trainers, or time management workshops. Fully editable in PowerPoint, Keynote, and Google Slides.


4 slides
Cost Breakdown Table Presentation
Make your numbers speak with style using a clean, structured layout that simplifies pricing and cost analysis. This presentation is perfect for comparing plans, budgets, or expenses in a clear and visually engaging way. Fully editable and compatible with PowerPoint, Keynote, and Google Slides.


26 slides
Digital Agency Pink Themed Company Profile
A fashion digital agency is a specialized agency that provides a range of digital marketing, advertising, and branding services tailored to the fashion industry. This template focuses on helping you leverage your digital platforms and technologies to enhance brand visibility, engage target audiences, drive sales, and create a strong online presence for your fashion brand. Fully customizable and compatible with Powerpoint, Keynote, and Google Slides. The elegant shades of pink reflect the fashion-forward and creative nature of your agency. Use this presentation template to showcase your best work, fashion trends, and styles.


8 slides
Restaurant Menu Design Presentation
Showcase your menu items with style using this bold, modern restaurant menu infographic. Designed to highlight pricing, meal categories, and featured items, this layout is perfect for restaurant presentations, promotions, or digital signage. Includes editable text areas and food-themed icons. Works seamlessly in PowerPoint, Keynote, and Google Slides.


22 slides
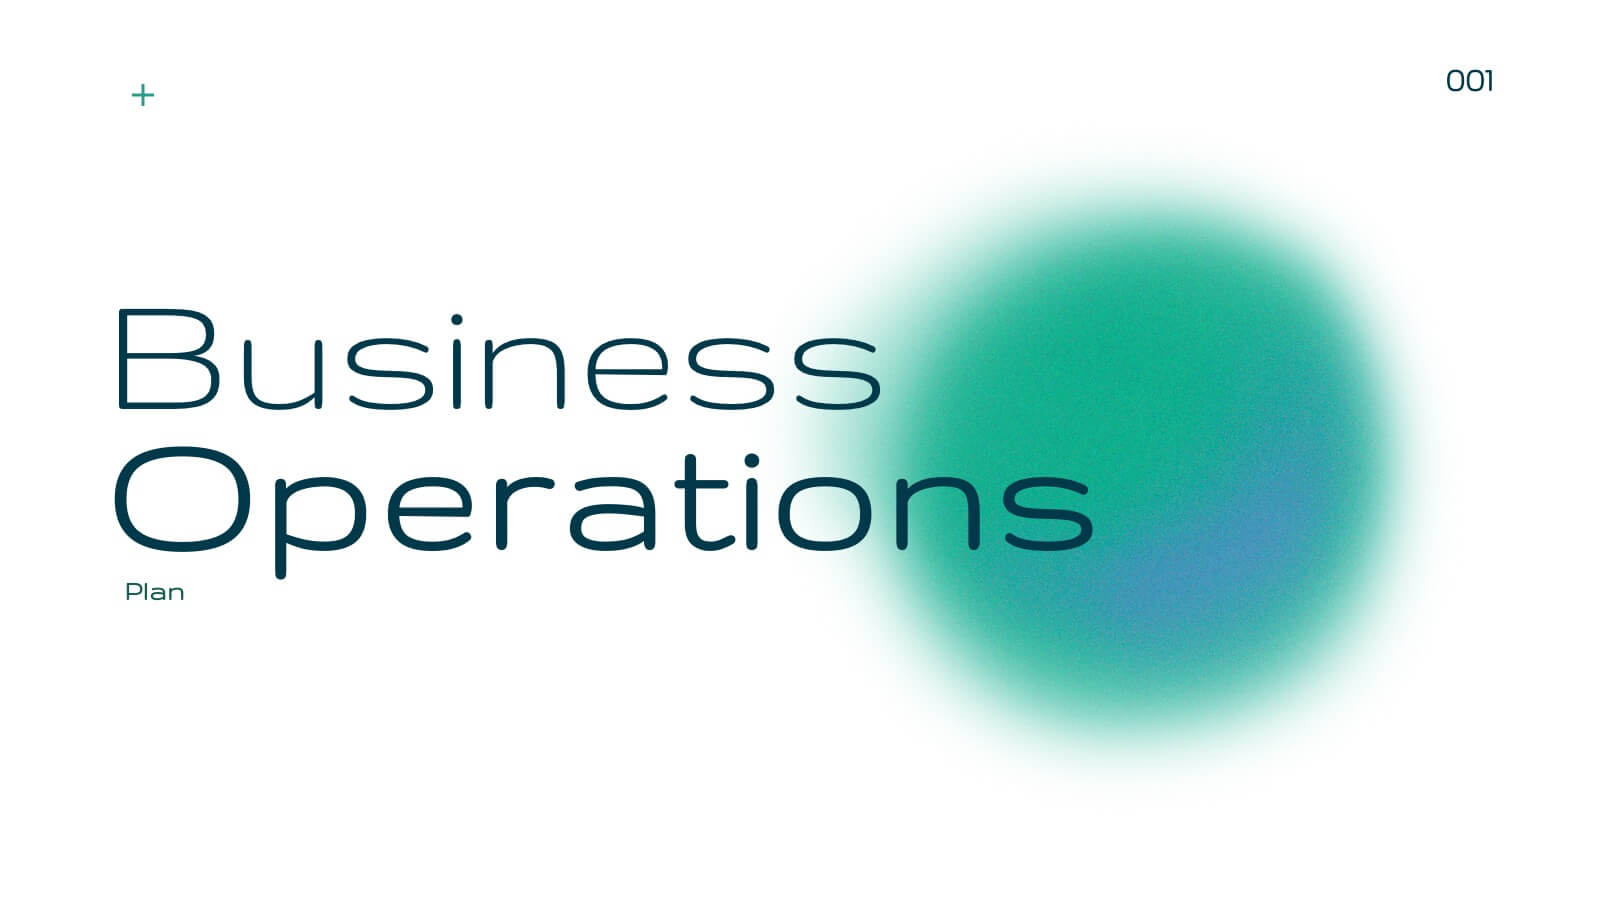
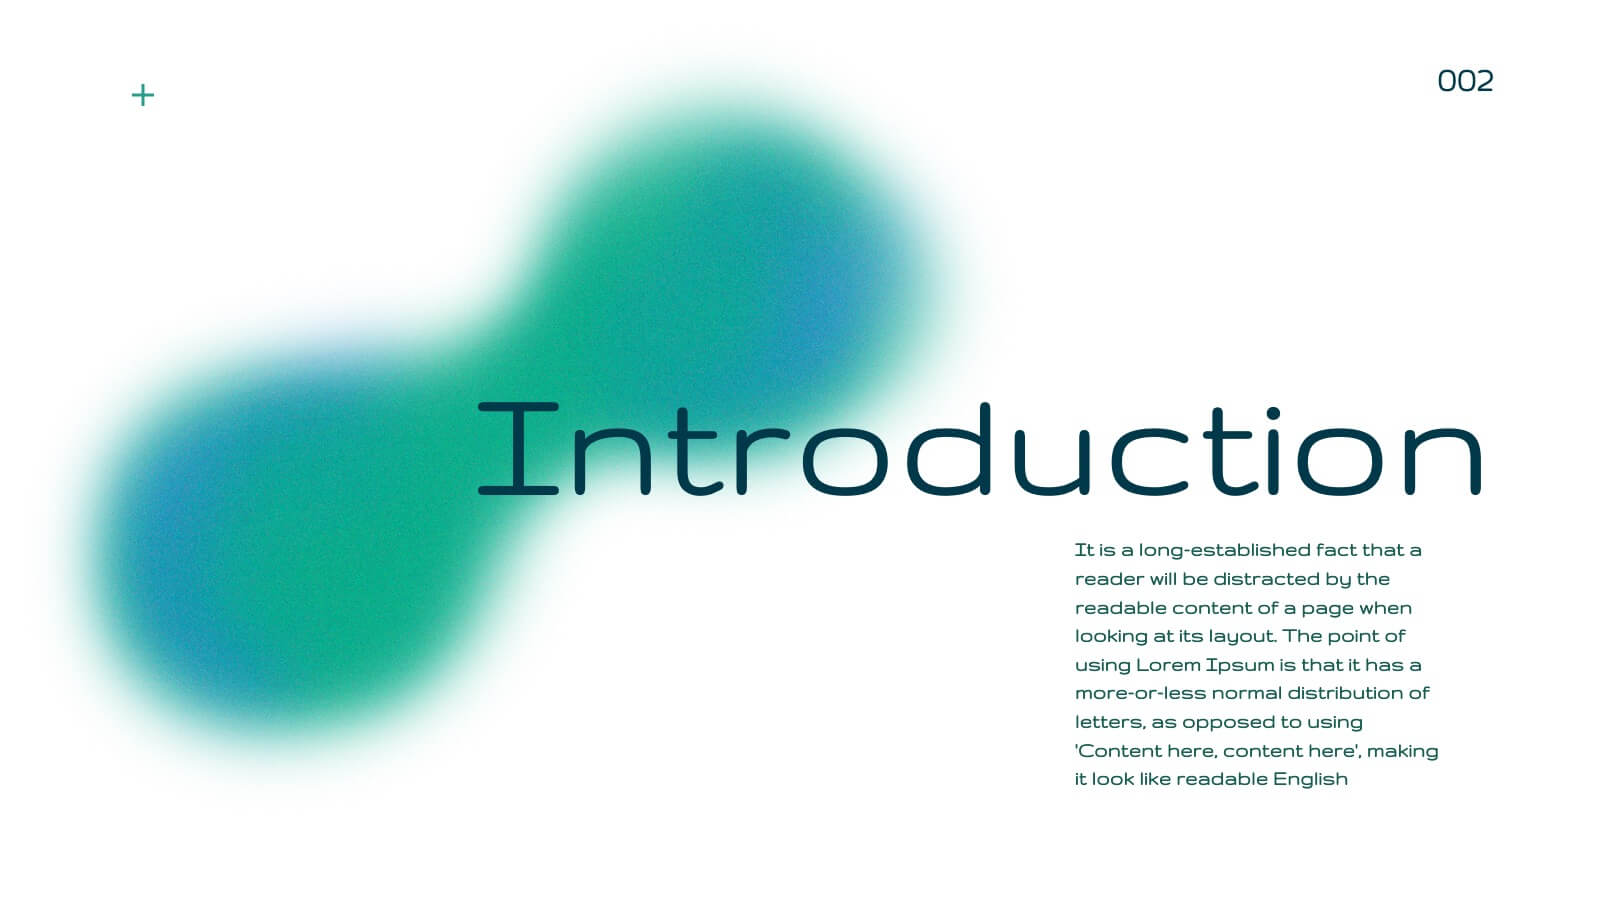
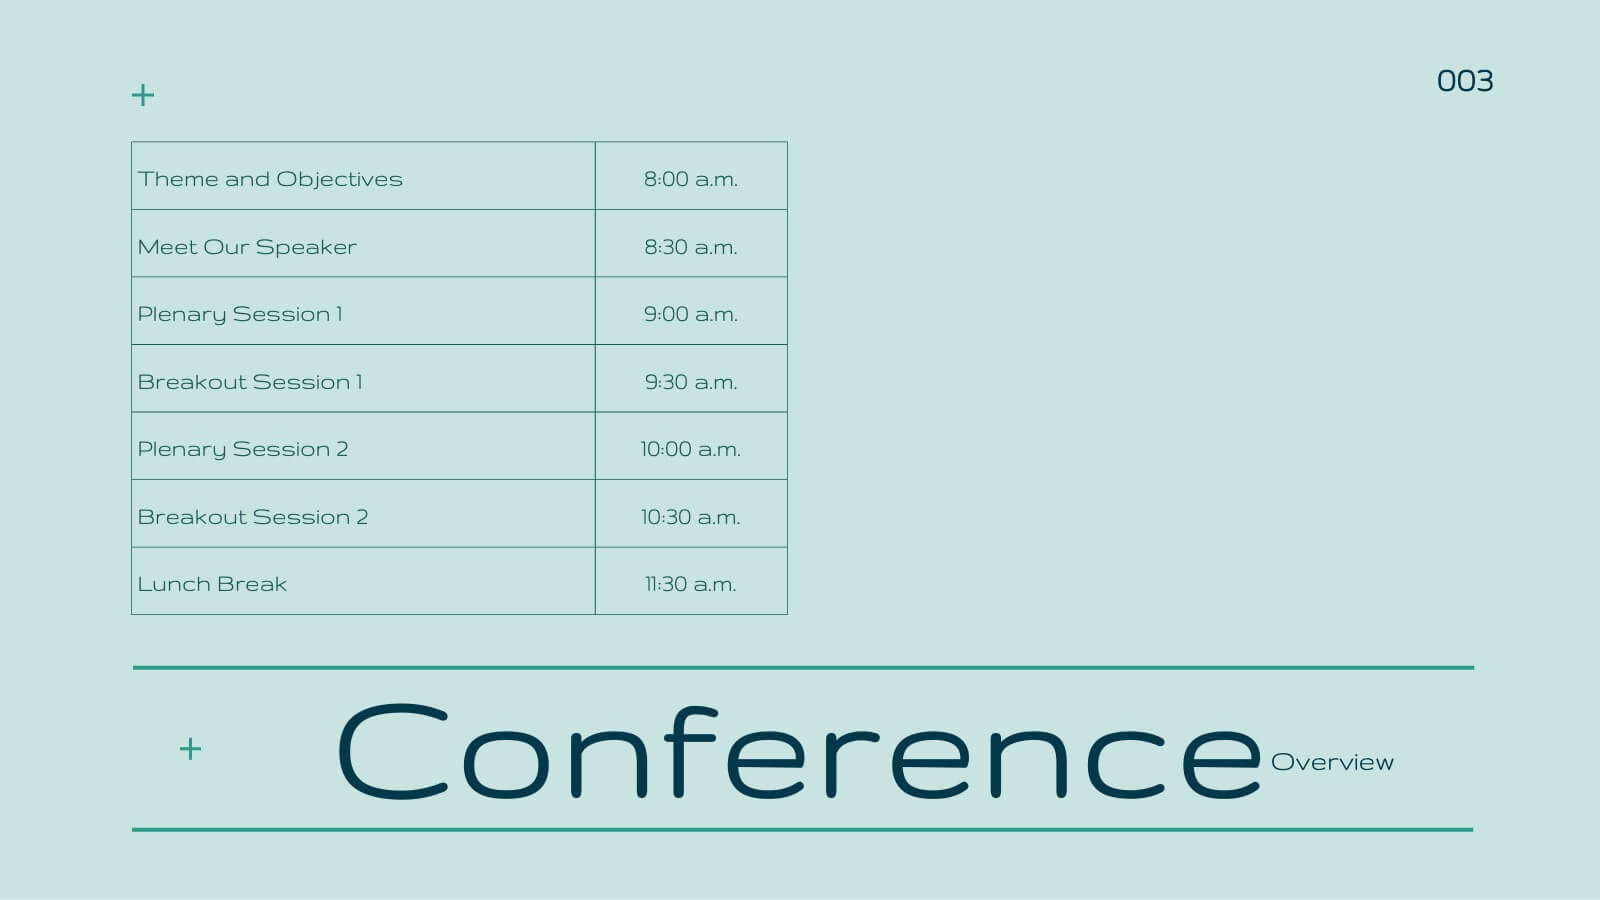
Blaze Business Operations Plan Presentation
Elevate your business presentations with this elegant, modern template designed for comprehensive business operations. Perfect for covering themes, objectives, workshops, and panel discussions, it ensures a professional and engaging delivery. The clean design and structured layout enhance clarity and impact. Compatible with PowerPoint, Keynote, and Google Slides, it’s versatile for any platform.


5 slides
Organizational Decision Support System Presentation
Visually showcase team alignment and consensus using the Organizational Decision Support System slide. This layout features a row of team icons paired with "Yes"/"No" speech bubbles, making it perfect for illustrating decision outcomes, vote breakdowns, or approval processes. Easily editable in PowerPoint, Keynote, and Google Slides.


6 slides
Business Logic Flow Chart
Streamline complex processes with the Business Logic Flow Chart Presentation. This modern, curved connector design helps you visually outline up to five sequential steps or logic paths, using colorful icons and editable text fields. Ideal for business workflows, strategic plans, or data flow maps. Fully compatible with PowerPoint, Keynote, and Google Slides.


5 slides
Process Improvement Infographics
Introducing our Process Improvement Infographics, these are visual representations of the steps involved in enhancing the efficiency of a process. This template is designed to help businesses identify bottlenecks and areas of improvement in their operations. These infographics consist of vertically arranged sections or columns that outline the different stages of the process improvement journey. Each section provides a brief explanation of the stage along with relevant icons, illustrations, or diagrams to enhance understanding. The layout is designed to showcase the sequential flow of activities involved in the improvement process.