


Features
- 26 Unique slides
- Fully editable and easy to edit in Microsoft Powerpoint, Keynote and Google Slides
- 16:9 widescreen layout
- Clean and professional designs
- Export to JPG, PDF or send by email.


Do you have any questions?
Recommend


8 slides
End-to-End Project Lifecycle Management Presentation
Visualize each phase of your project lifecycle with this clean, circular flow layout. Ideal for showcasing planning, execution, and delivery stages in a structured loop. Each segment is fully editable to match your content. Compatible with PowerPoint, Google Slides, and Keynote for effortless customization and professional results.


23 slides
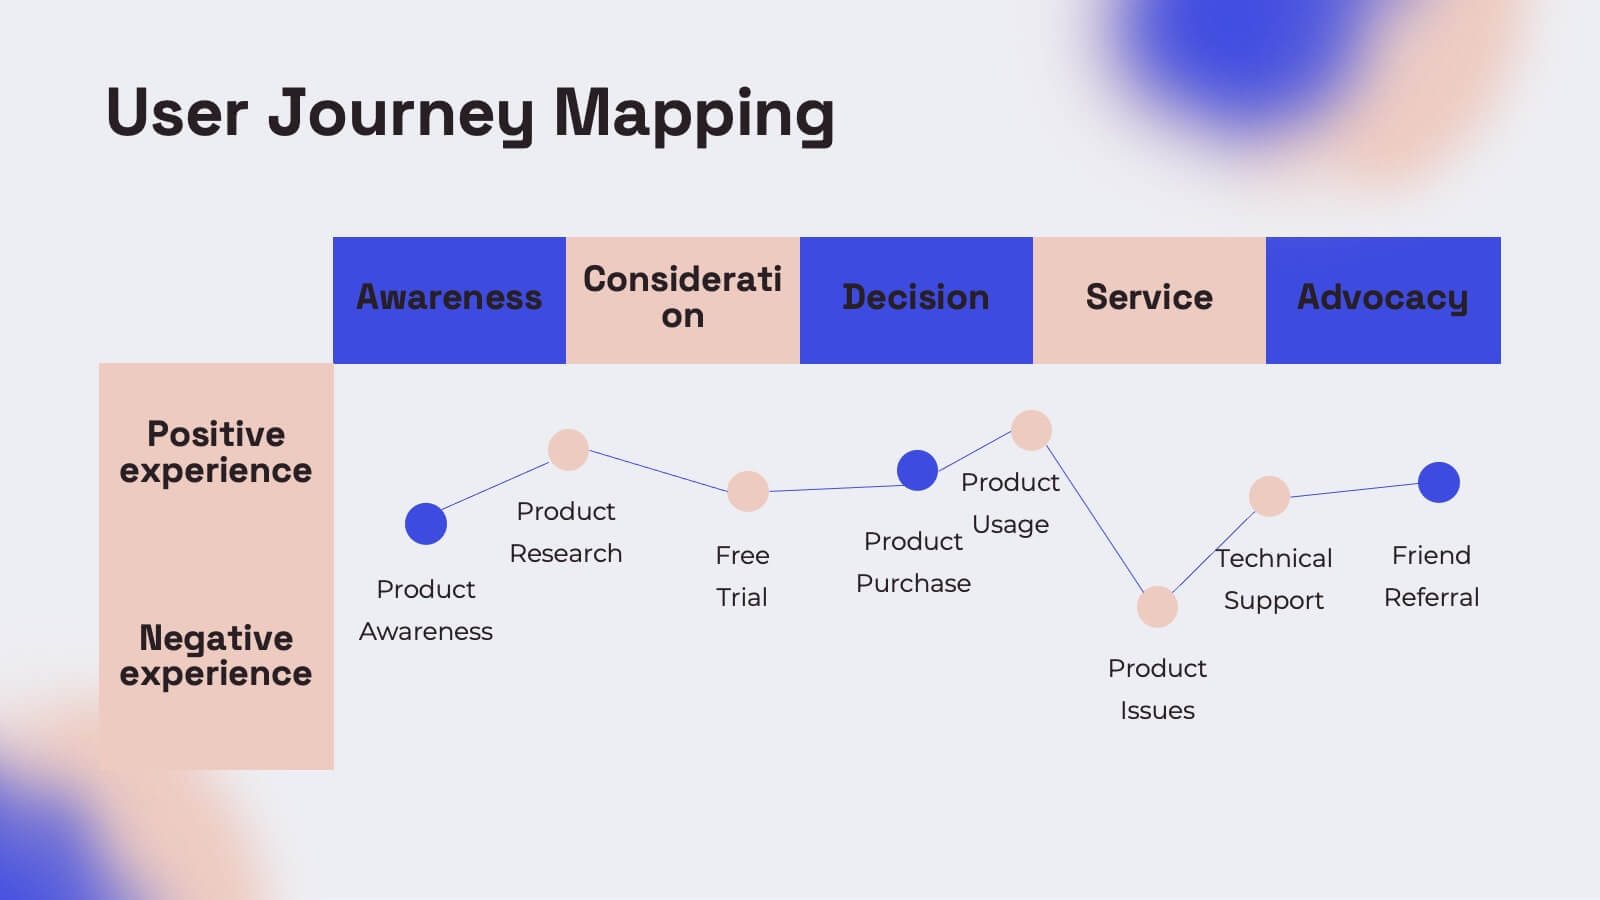
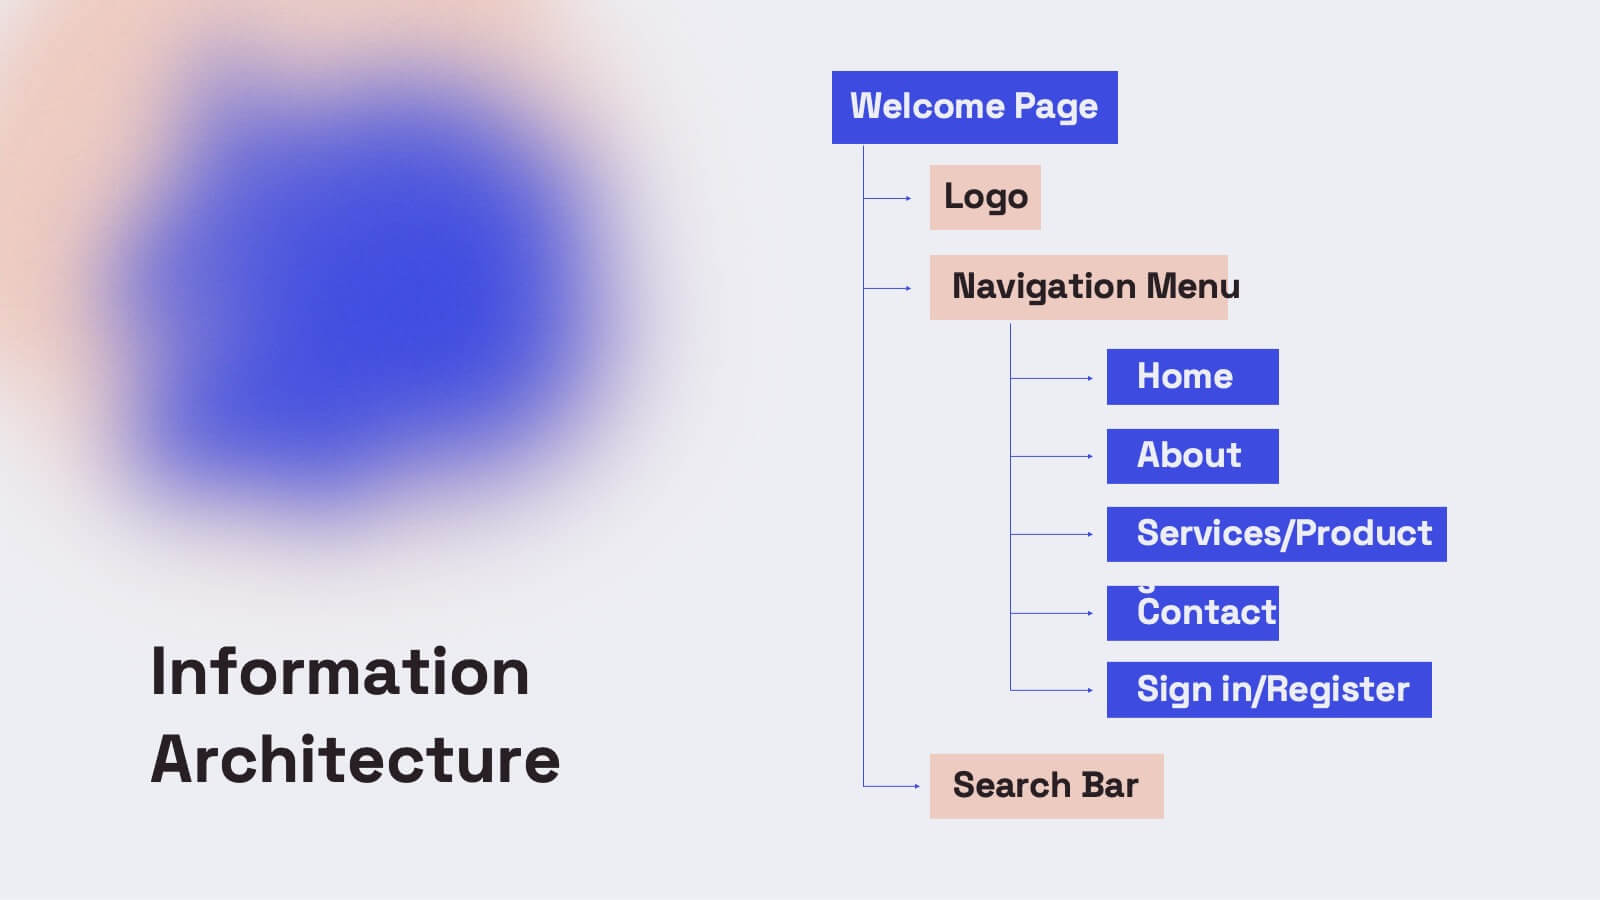
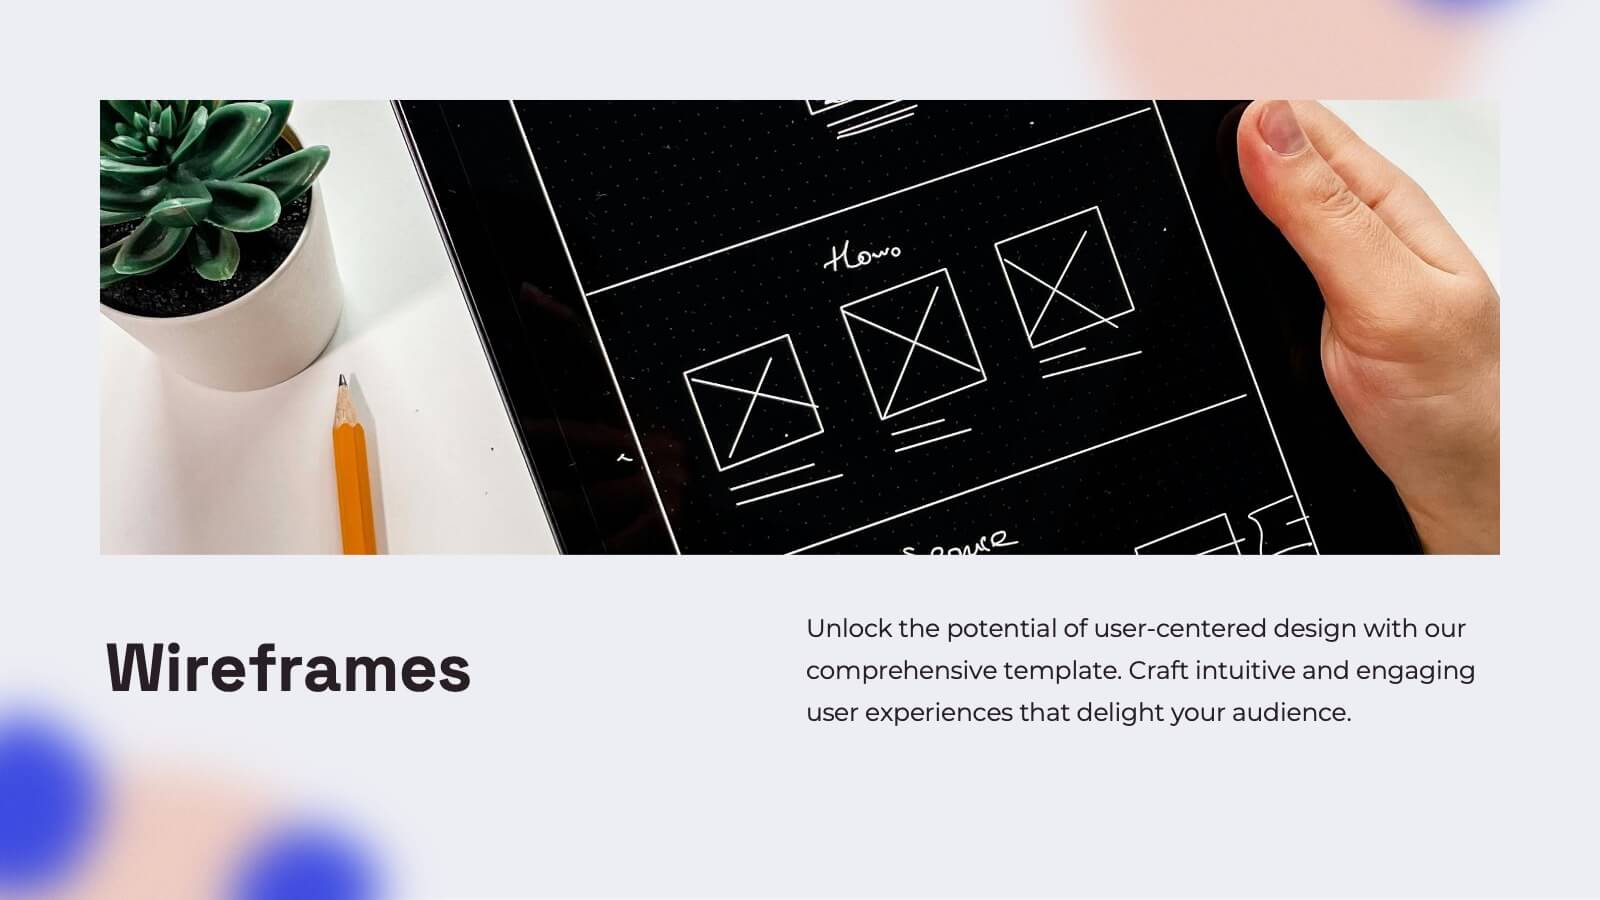
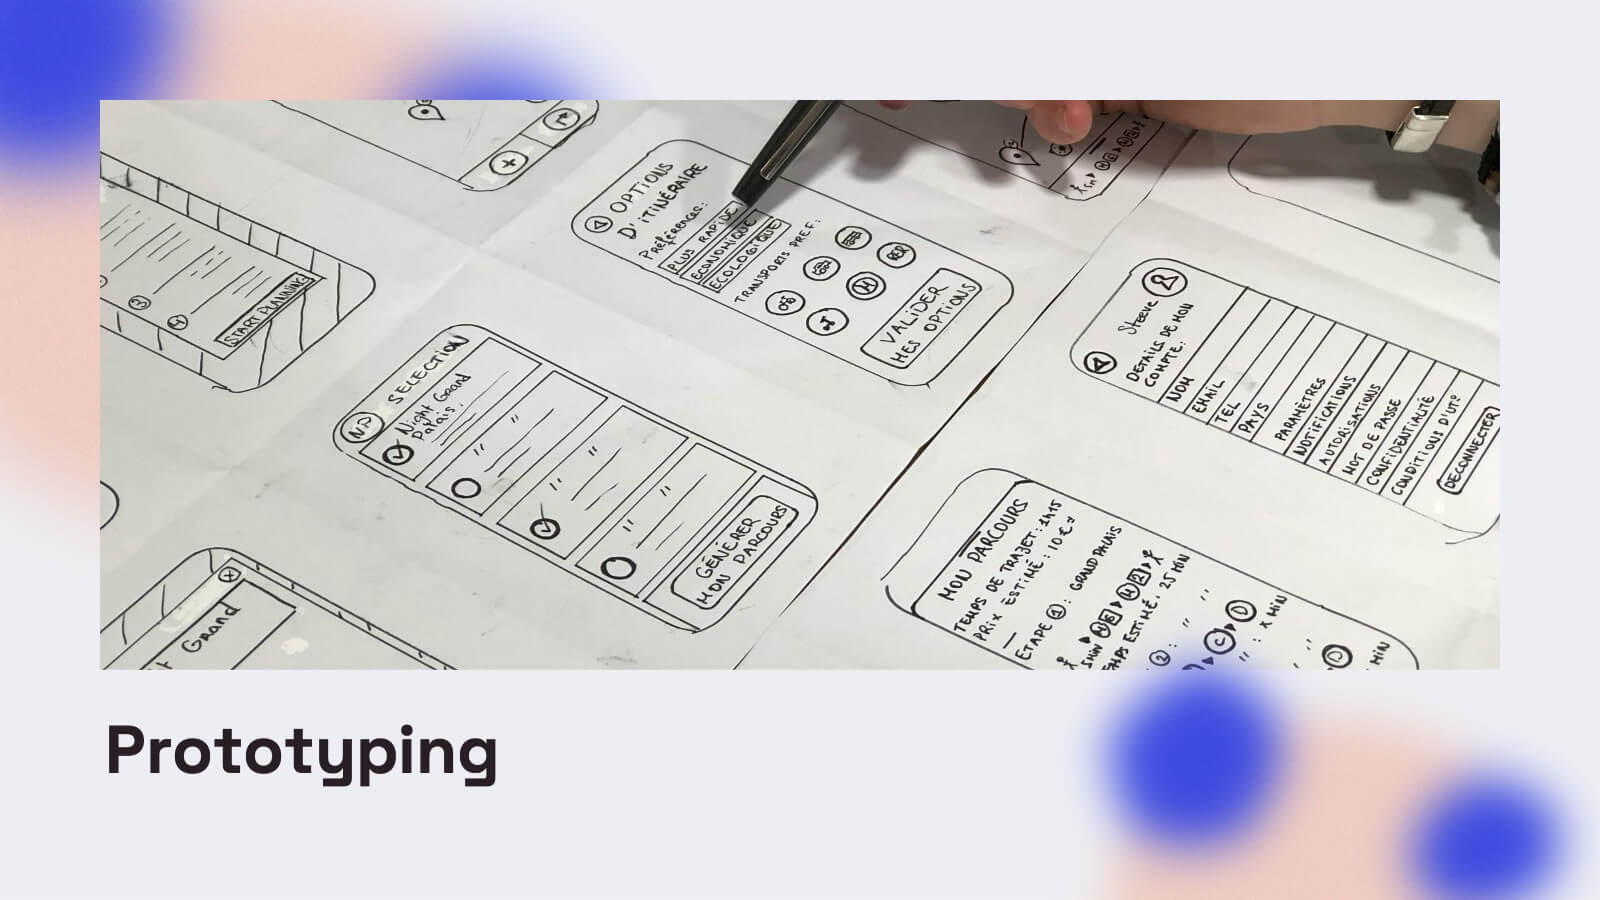
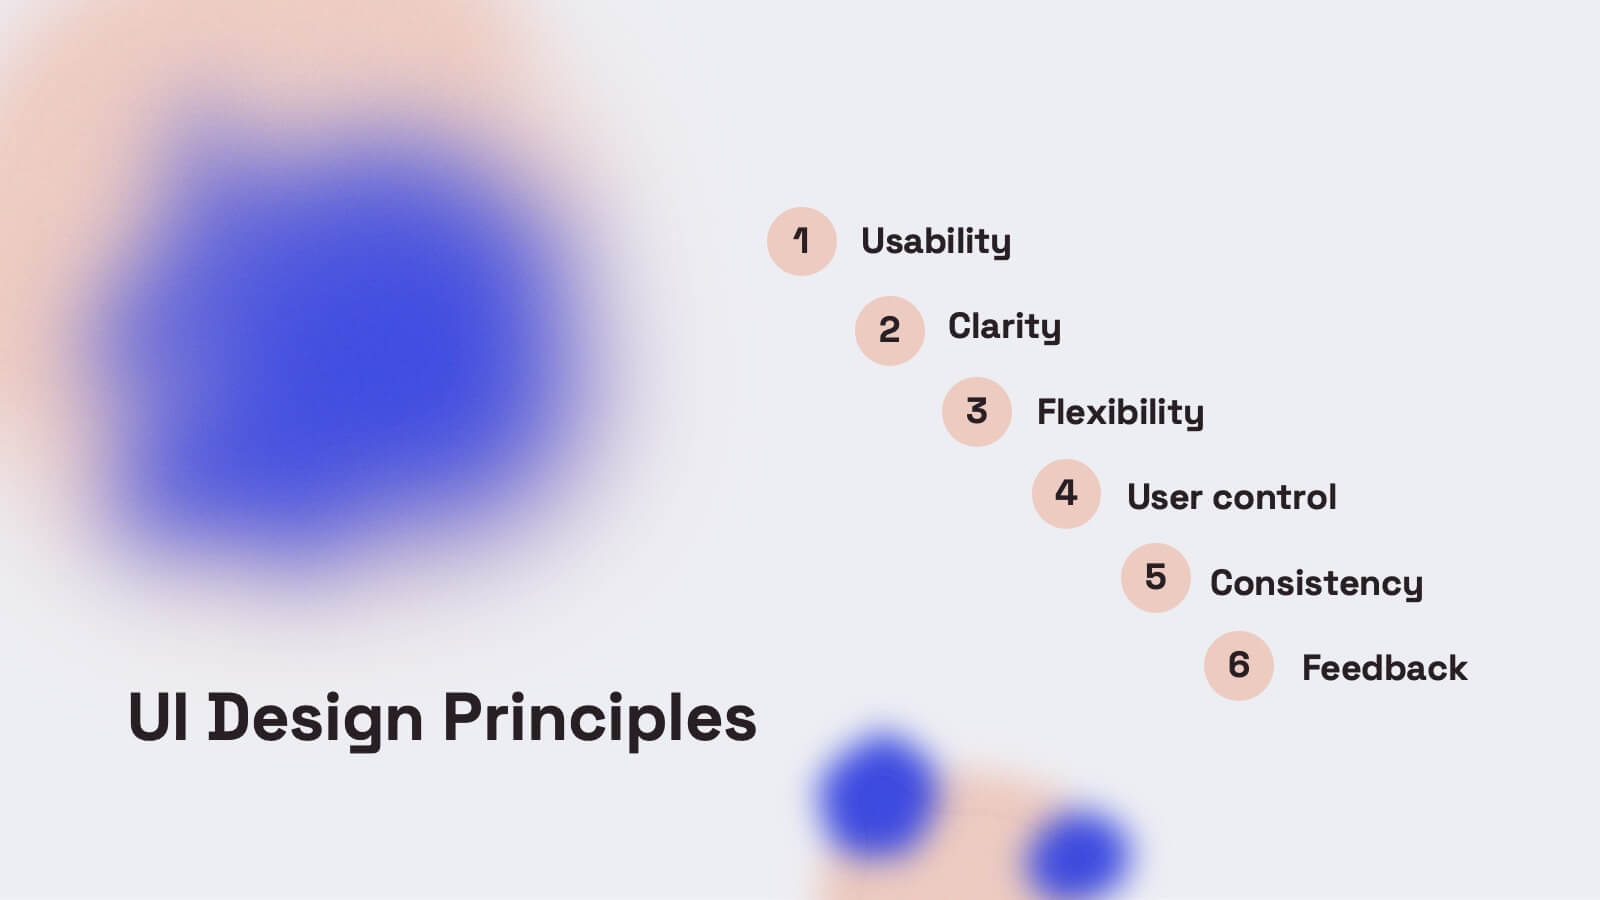
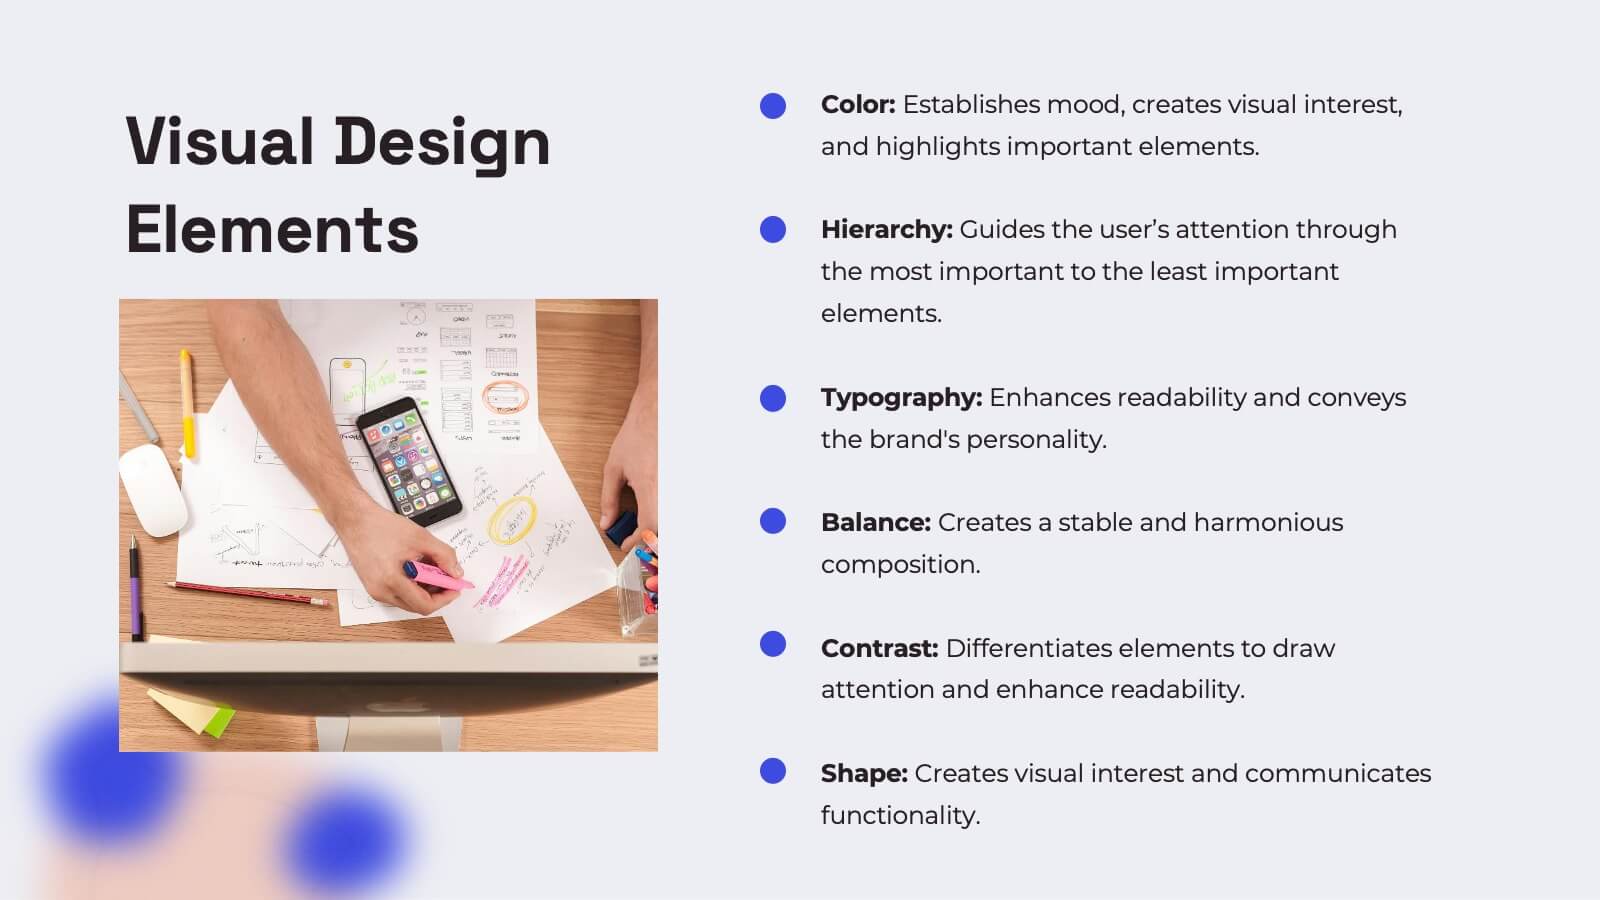
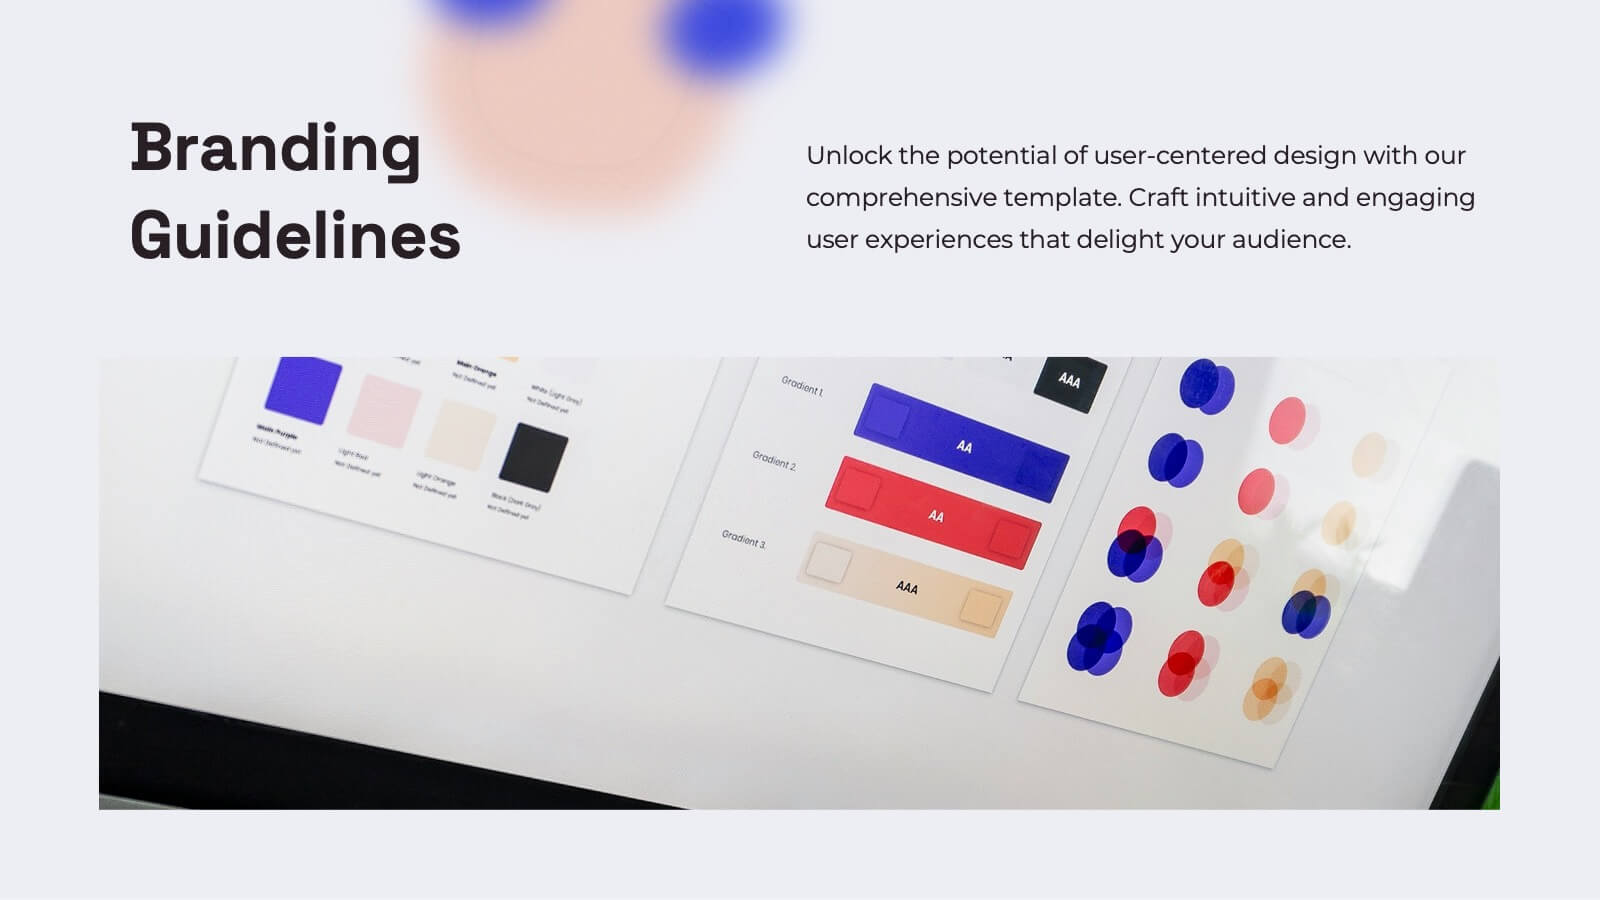
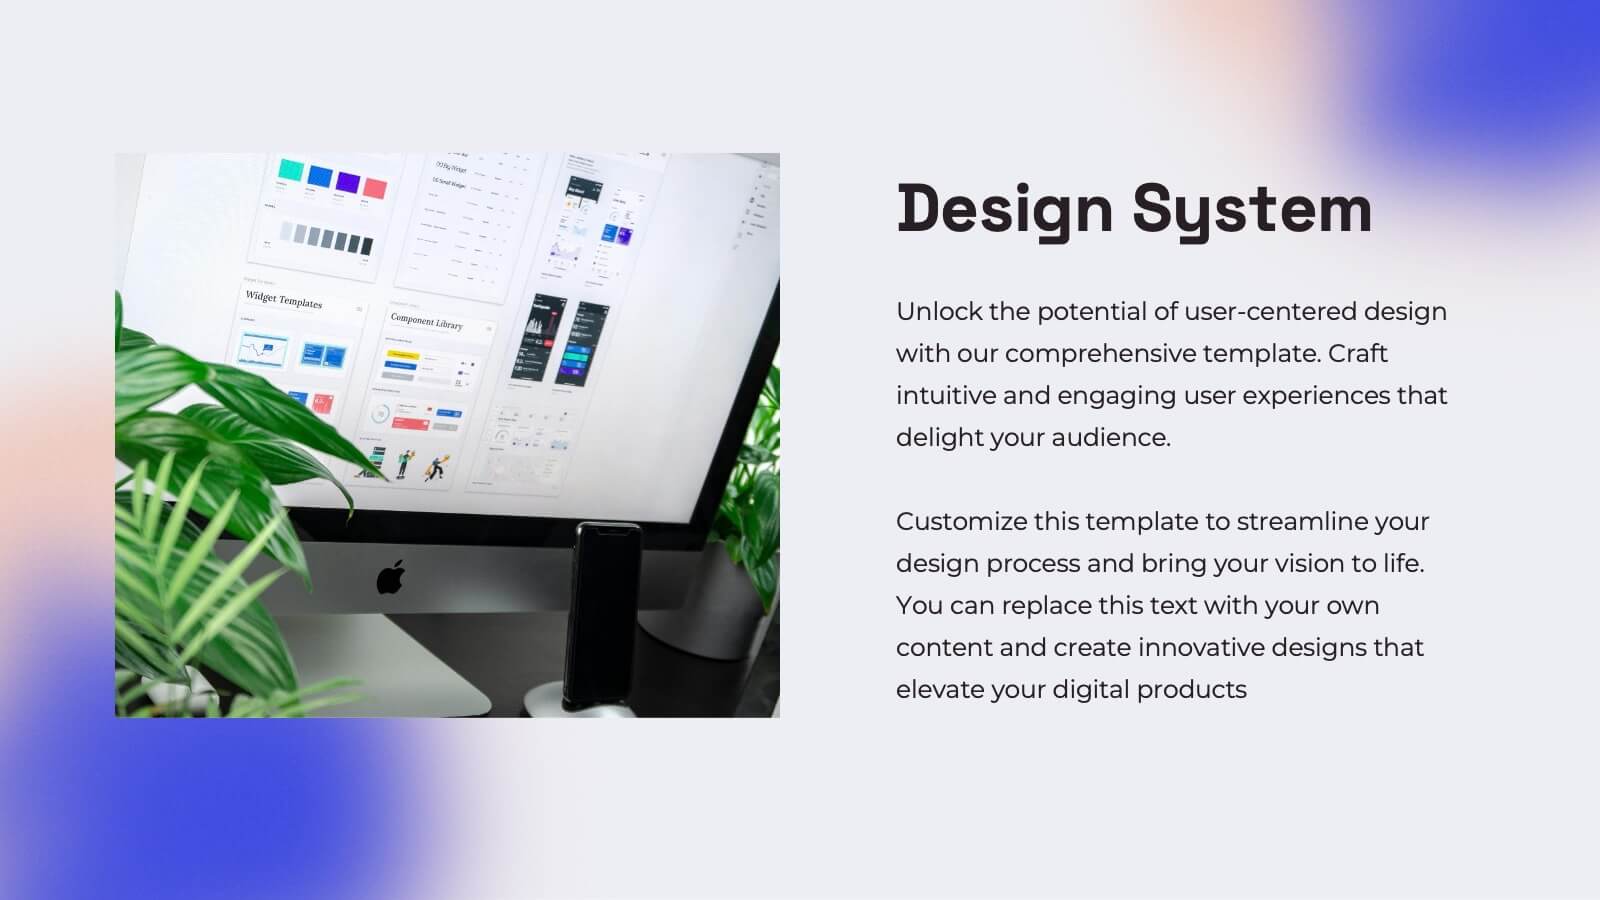
Gemini UX Design Presentation
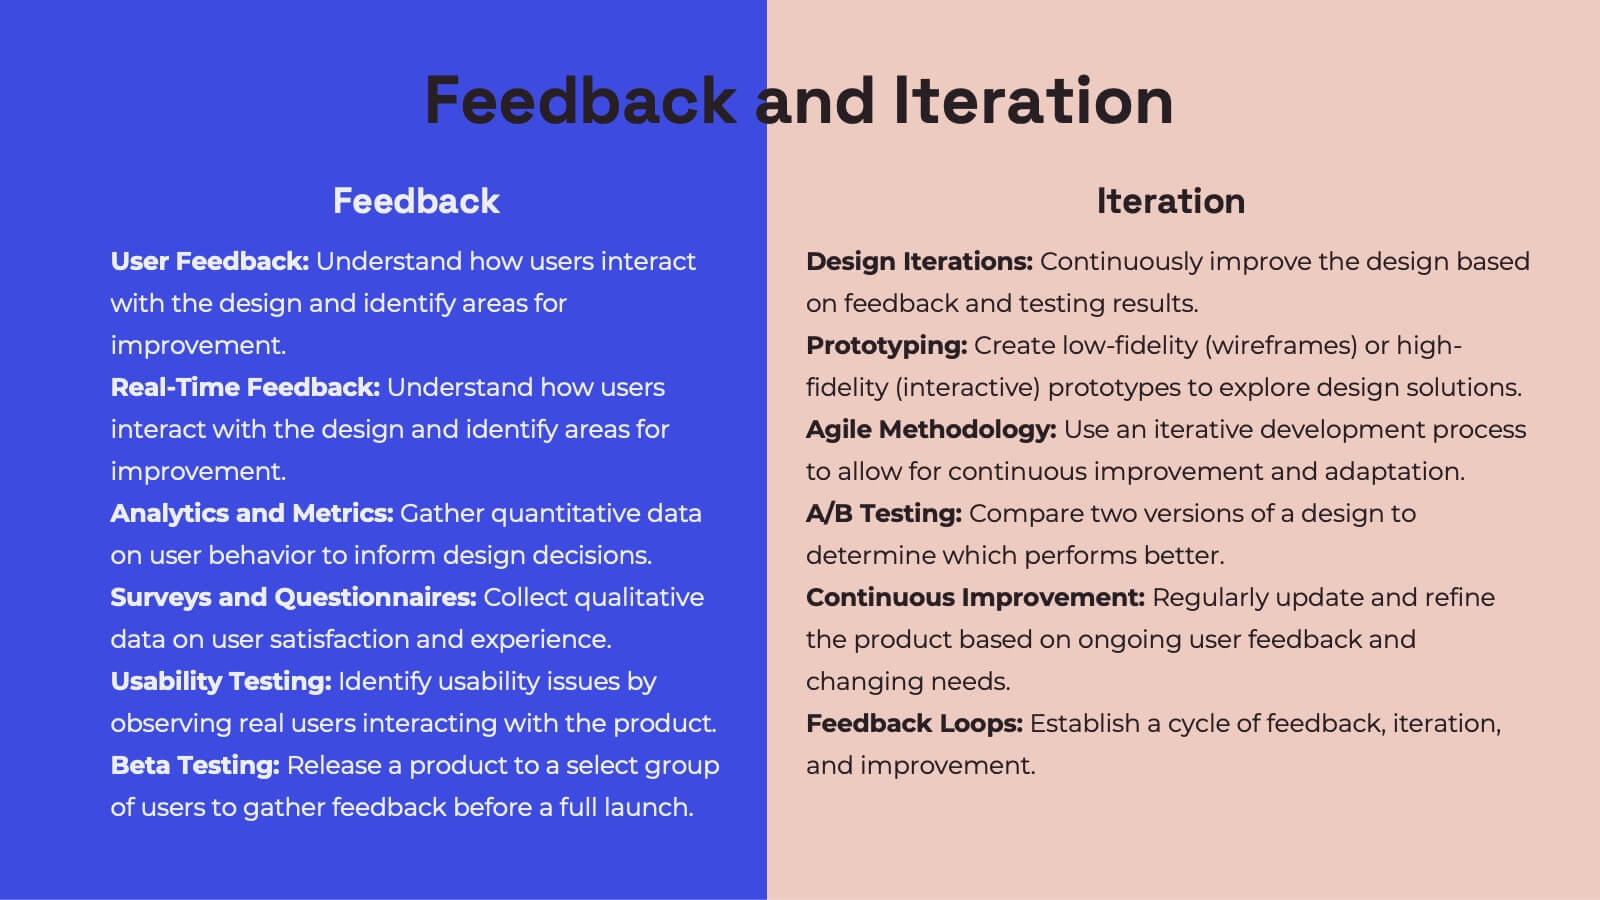
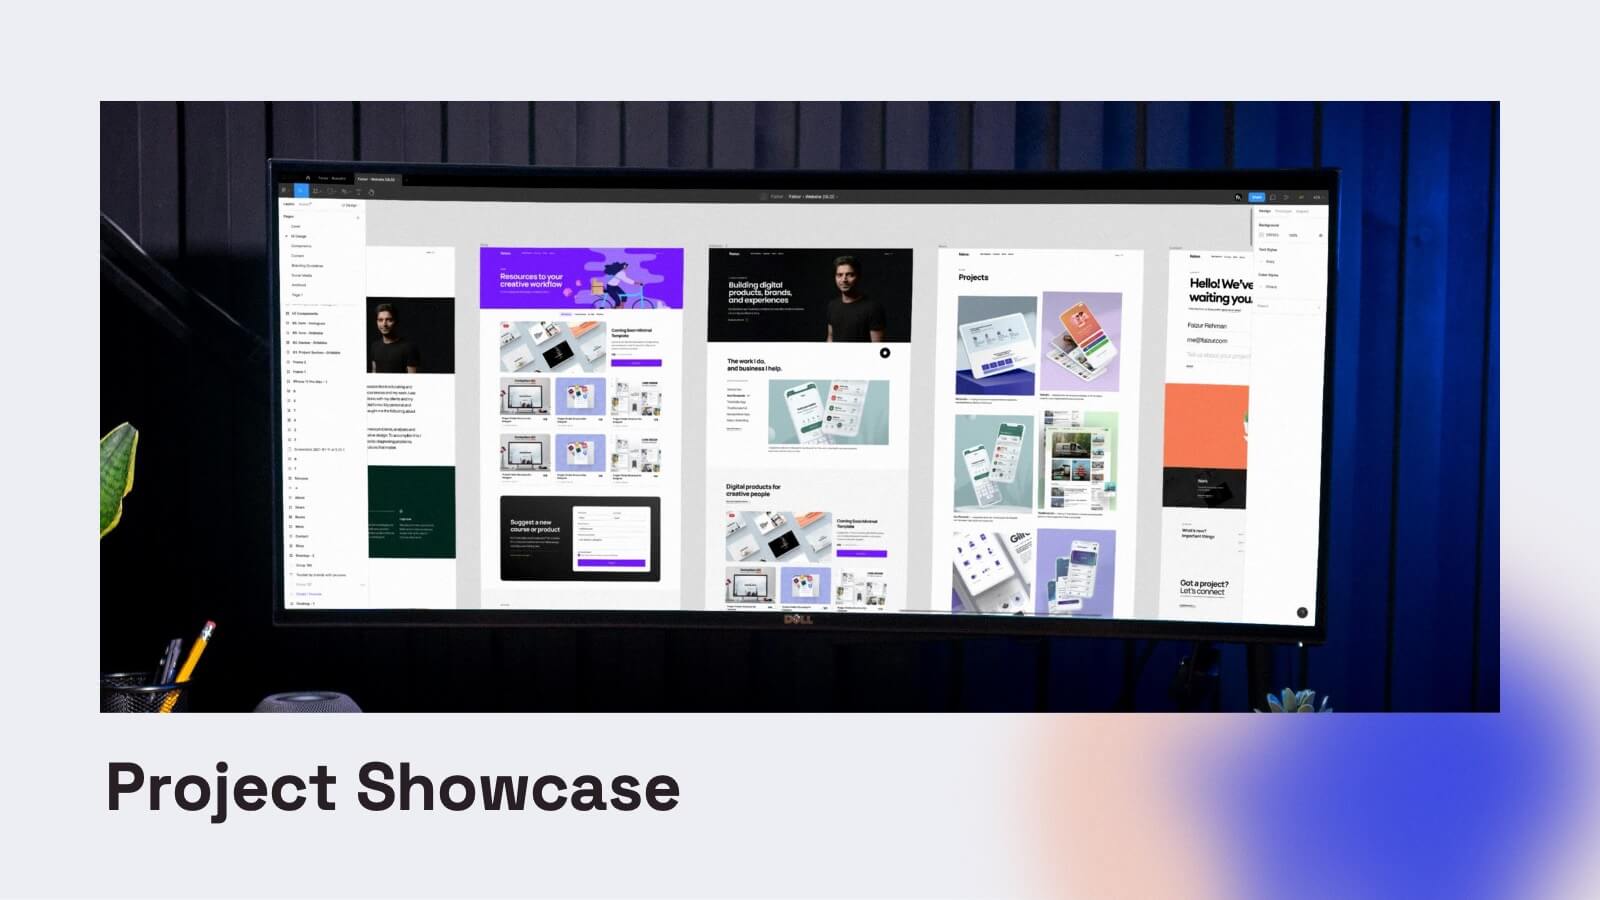
Enhance your UX presentations with this vibrant and user-friendly template. Designed to cover every aspect of UX design, from user research and personas to wireframes and prototyping, this template ensures a comprehensive and engaging delivery. Its modern design and structured layout make your insights clear and impactful. Compatible with PowerPoint, Keynote, and Google Slides, it's perfect for any platform.


4 slides
Creative Title Layout Presentation
Give your presentation a fresh, artistic flair with a bold and playful cover design that instantly grabs attention. Ideal for creative portfolios, branding pitches, or modern business decks, this layout blends minimalism with fluid shapes for a dynamic look. Fully customizable in PowerPoint, Keynote, and Google Slides.


26 slides
Emery Presentation Template
Ready to make an impression? Style and professionalism are all wrapped up in Emery. New businesses and startups will find it useful - from real estate to travel agencies and everything in-between. Emery is a bold, colorful minimalistic aesthetic template. It's easy to customize, clean and bold template for you to use for your company website. It's flexible and makes an easy quick start. Fill in your details with our easy to edit text, pictures, timelines, charts and we'll set you up for success. Use this fantastic template to promote your business or project and create the perfect document.


5 slides
Procurement Strategy Presentation
ChatGPT PlusBring clarity and structure to your business process with this modern, visually engaging presentation. Perfect for outlining purchasing plans, supplier relationships, and cost-saving strategies, it helps convey information with precision and flow. Fully customizable and compatible with PowerPoint, Keynote, and Google Slides for seamless editing and professional results.


21 slides
Graphium Market Analysis Report Presentation
Deliver actionable insights with this sleek market analysis report presentation template. Highlight key areas such as performance metrics, market trends, competitor insights, and strategic initiatives to inform stakeholders and drive decisions. Perfect for analysts and business teams, this template is fully compatible with PowerPoint, Keynote, and Google Slides.


21 slides
Inventra Creative Portfolio Presentation
Make a lasting impression with this sleek and modern creative portfolio presentation template. Perfect for showcasing your artistic journey, featured projects, unique style, and client testimonials. Highlight your creative process, pricing, and services with a bold and professional layout. Fully customizable in PowerPoint, Keynote, and Google Slides.


8 slides
Business Framework Strategy
Simplify your strategy breakdown with this layered, step-by-step infographic. Ideal for presenting three core pillars or stages of a business model, this layout highlights each section with a bold letter identifier (A, B, C), vivid icons, and space for supporting content. Fully editable in PowerPoint, Keynote, and Google Slides.


23 slides
Soundburst Business Idea Pitch Deck Presentation
The Pitch Deck Presentation Template delivers a professional, modern design with 23 slides tailored for startups and businesses. Covering company overview, solutions, market opportunities, and financials, it's fully customizable for your unique vision. Compatible with PowerPoint, Keynote, and Google Slides, this template ensures impactful, investor-ready presentations.


23 slides
Supernova Business Plan Presentation
The Supernova Business Presentation template is a sleek, professional tool designed to elevate your corporate presentations. With a dark-themed aesthetic, it exudes sophistication and modernity, making it perfect for business meetings, project updates, and strategy sessions. The template covers essential aspects like team updates, key achievements, collaboration opportunities, performance metrics, and more, allowing you to deliver a comprehensive overview of your business operations. It's also ideal for discussing upcoming events, departmental goals, and company policies, providing a structured and impactful way to communicate with your team or stakeholders. The template is fully compatible with PowerPoint, Keynote, and Google Slides, ensuring easy customization and a seamless presentation experience across different platforms. Use the Supernova Business Presentation template to make a powerful impression with your next business presentation.


5 slides
Body System Overview Presentation
Visually explain key human body systems with this clean and modern slide. Each section highlights a different organ with labeled points (A–D) for easy reference. Ideal for health education, medical briefings, or anatomy lessons. Fully editable in PowerPoint, Keynote, or Google Slides to suit any professional or academic need.


4 slides
EU Business Coverage Map Presentation
Highlight your European business presence with the EU Business Coverage Map Presentation. This slide layout uses pinpoint markers and color-coded regions to showcase operations, regional offices, or market coverage across Europe. Ideal for quarterly reports, sales updates, or investor briefings. Fully editable in PowerPoint, Keynote, Google Slides, and Canva.


4 slides
Task and Role Allocation Matrix
Clarify team responsibilities with this modern Task and Role Allocation Matrix. Easily visualize who is Responsible, Accountable, Contributing, and Informed for each task. Ideal for team leaders, HR planners, and project coordinators. Fully customizable in PowerPoint, Keynote, and Google Slides.


5 slides
Yearly Employee Performance Review Presentation
Celebrate your team’s progress with a modern, data-rich design that’s clear, visual, and professional. This template makes it easy to present yearly performance metrics, individual achievements, and growth comparisons through engaging charts and infographics. Perfect for annual reports and reviews. Compatible with PowerPoint, Keynote, and Google Slides for effortless editing.


5 slides
Building Strong Business Relationships
Create lasting partnerships with this structured business relationship infographic. Ideal for outlining trust-building strategies, collaboration frameworks, and stakeholder engagement plans. Fully editable in PowerPoint, Keynote, and Google Slides, making it simple to align the design with your company’s branding and professional goals.


21 slides
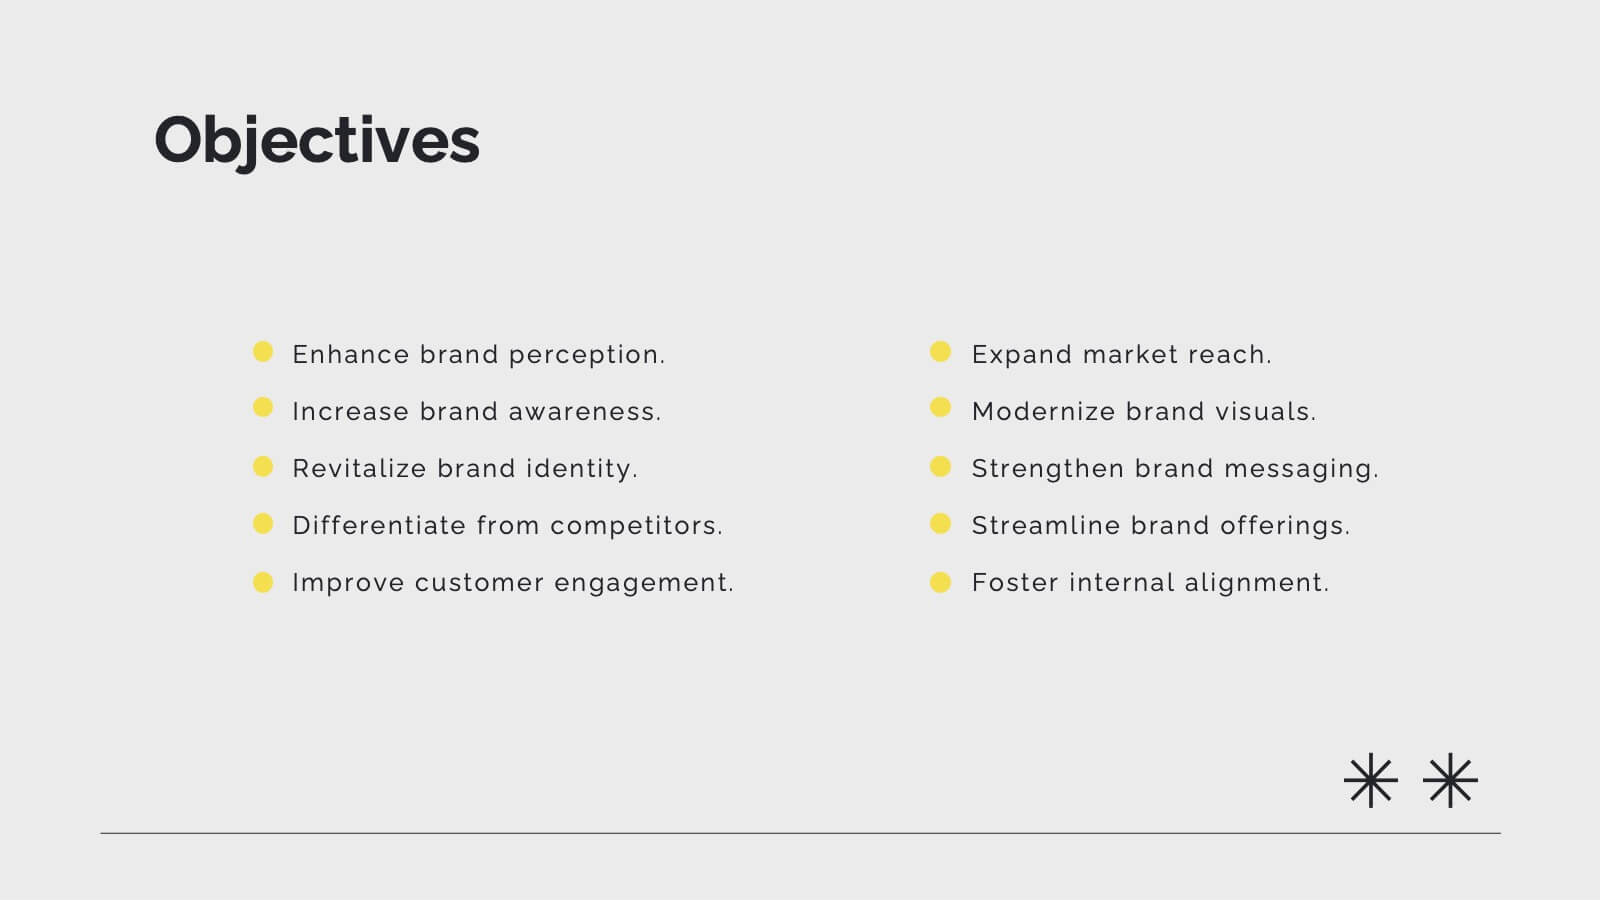
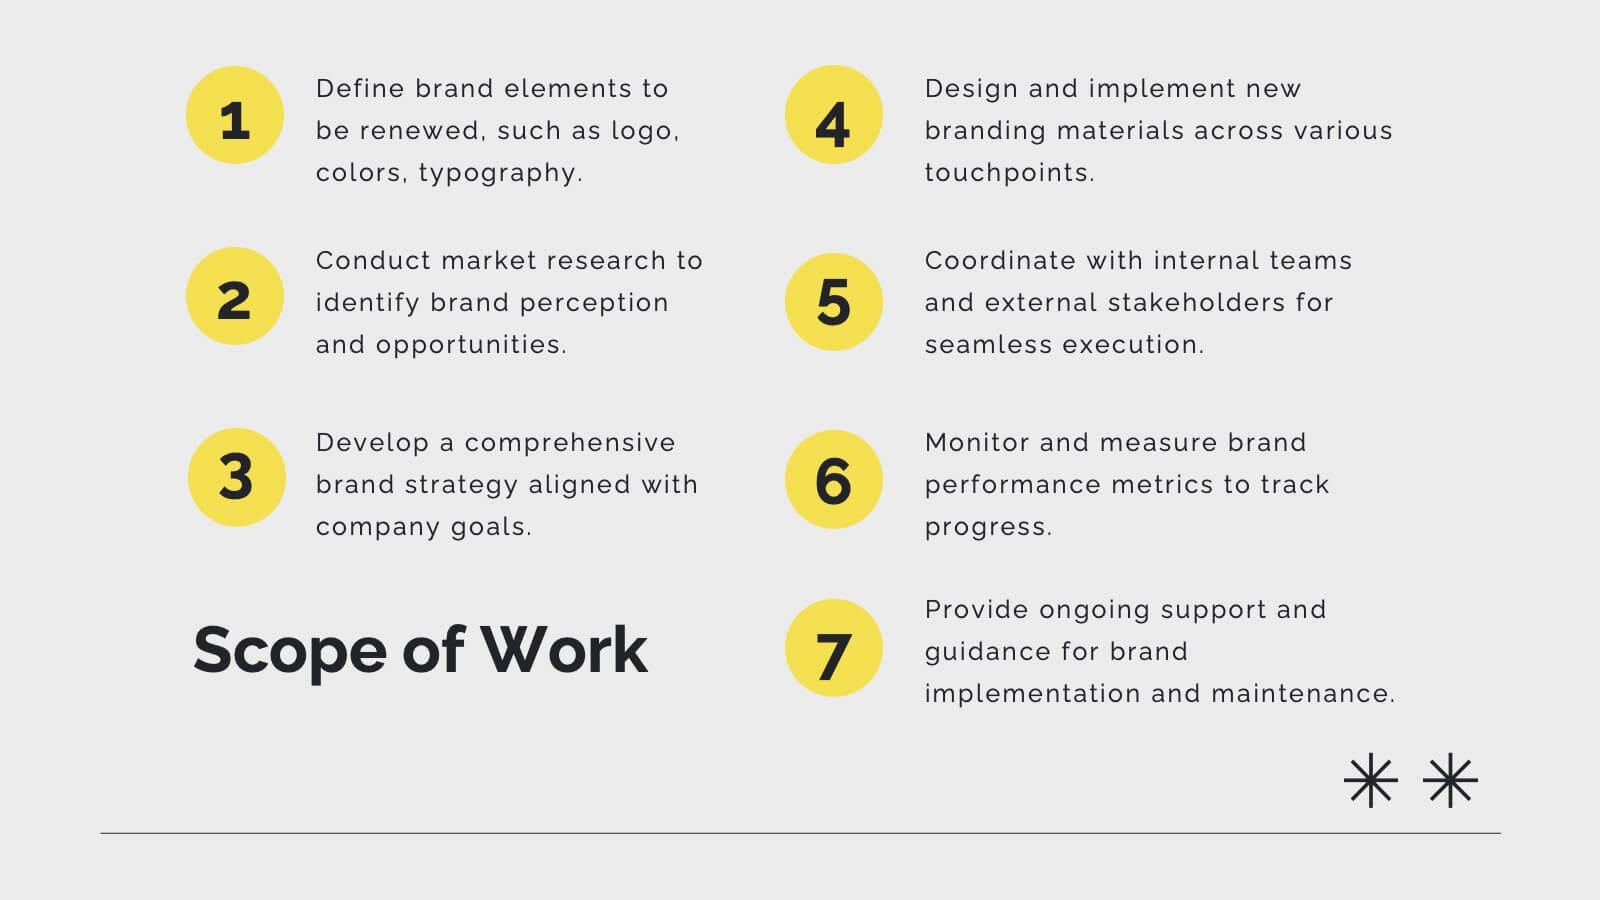
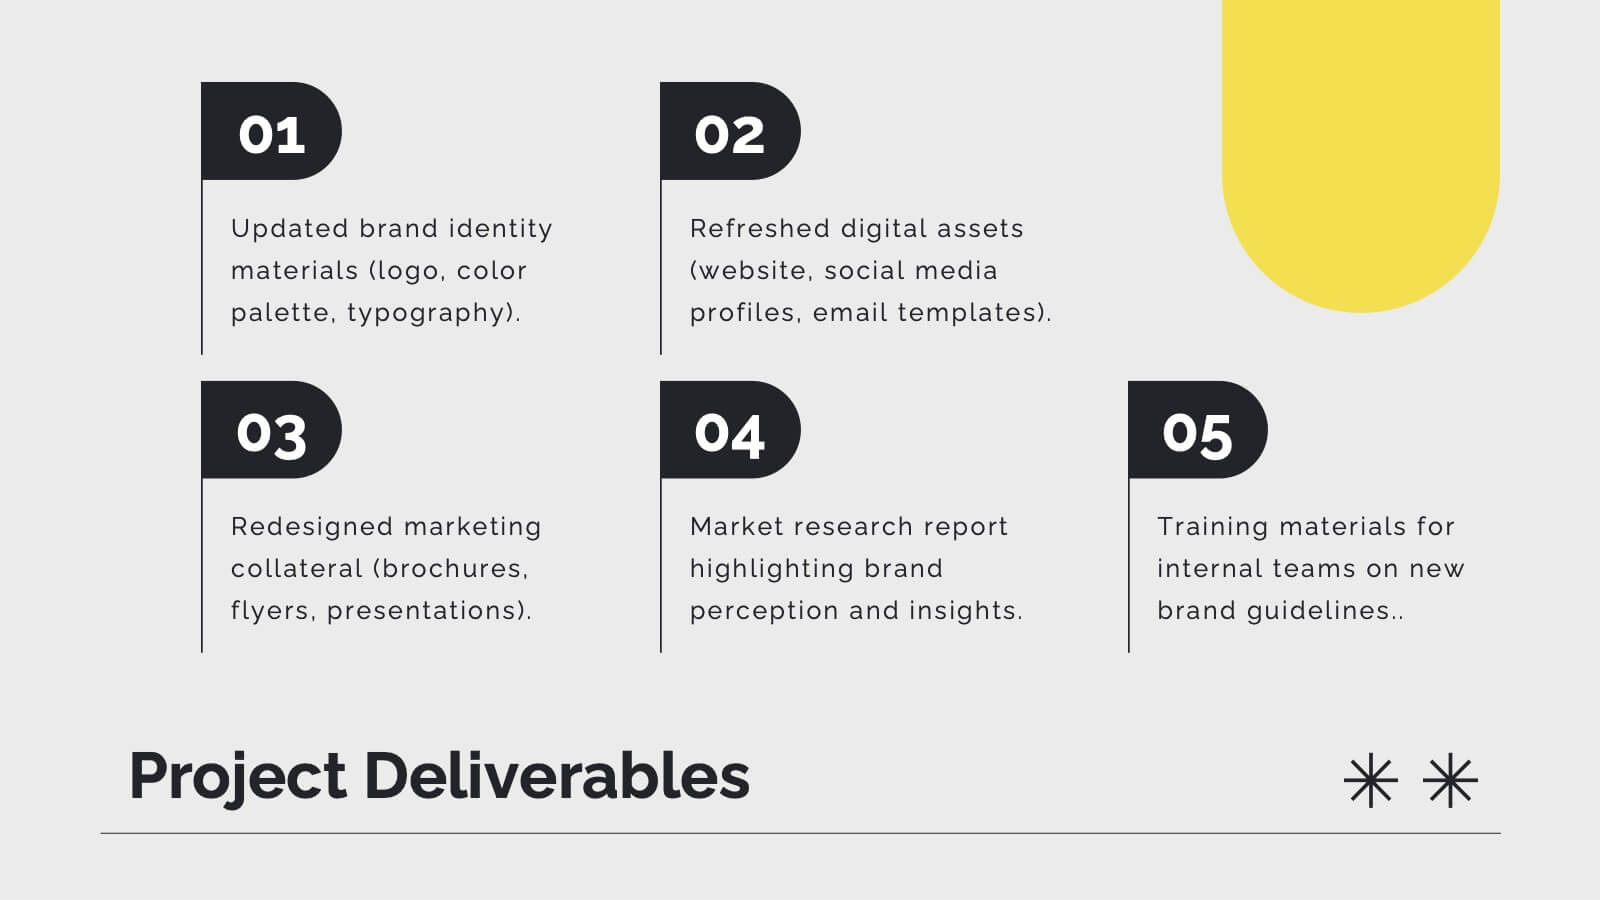
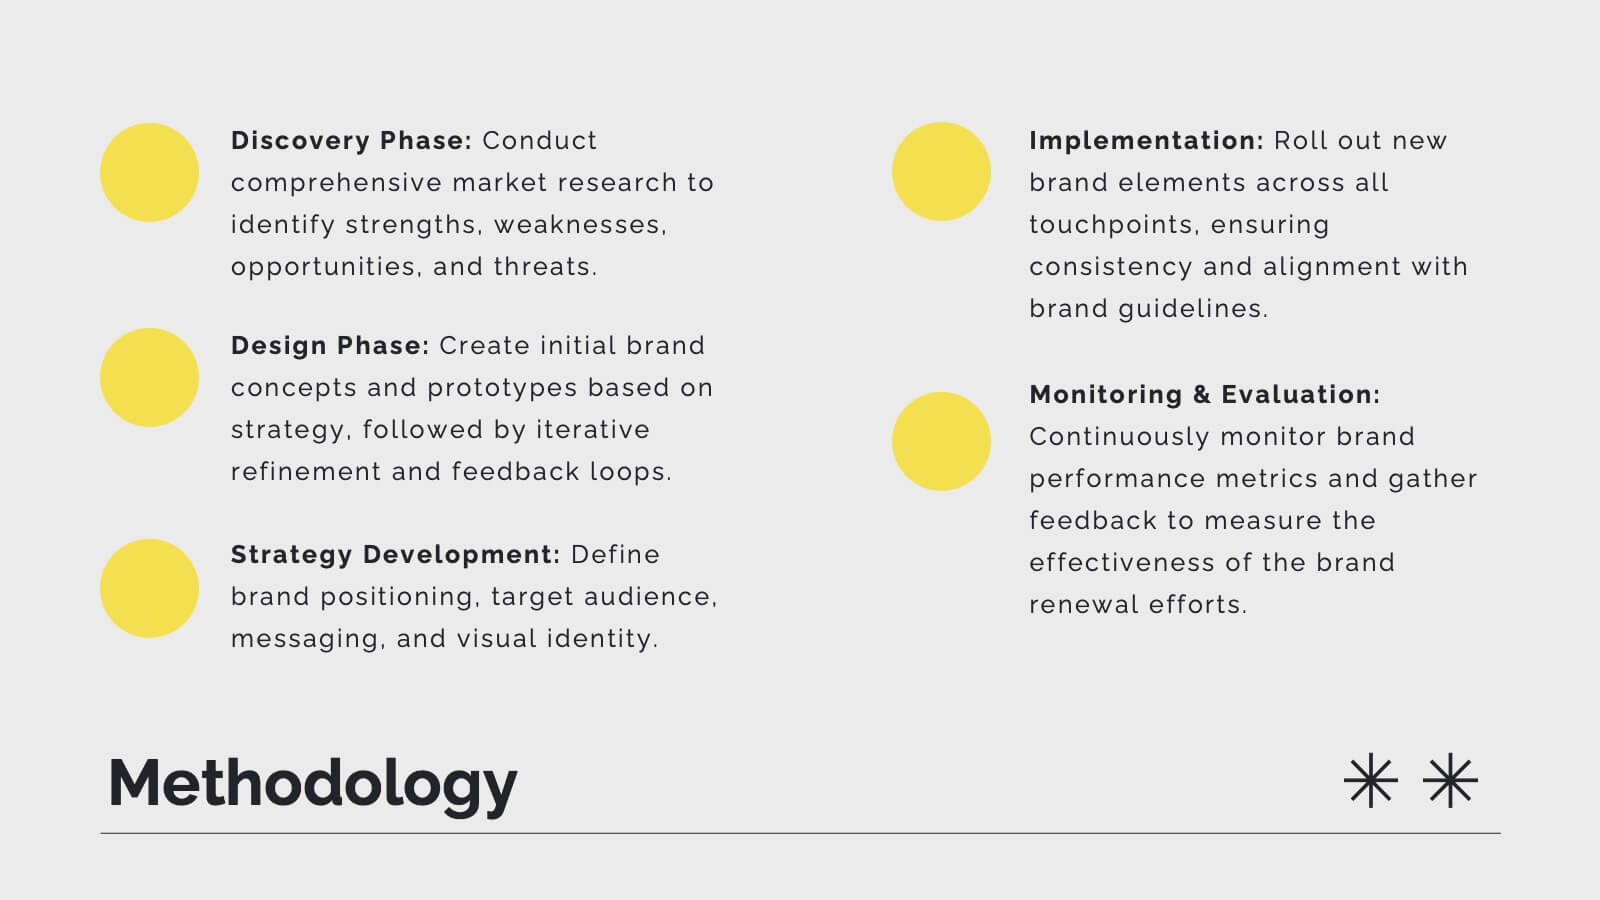
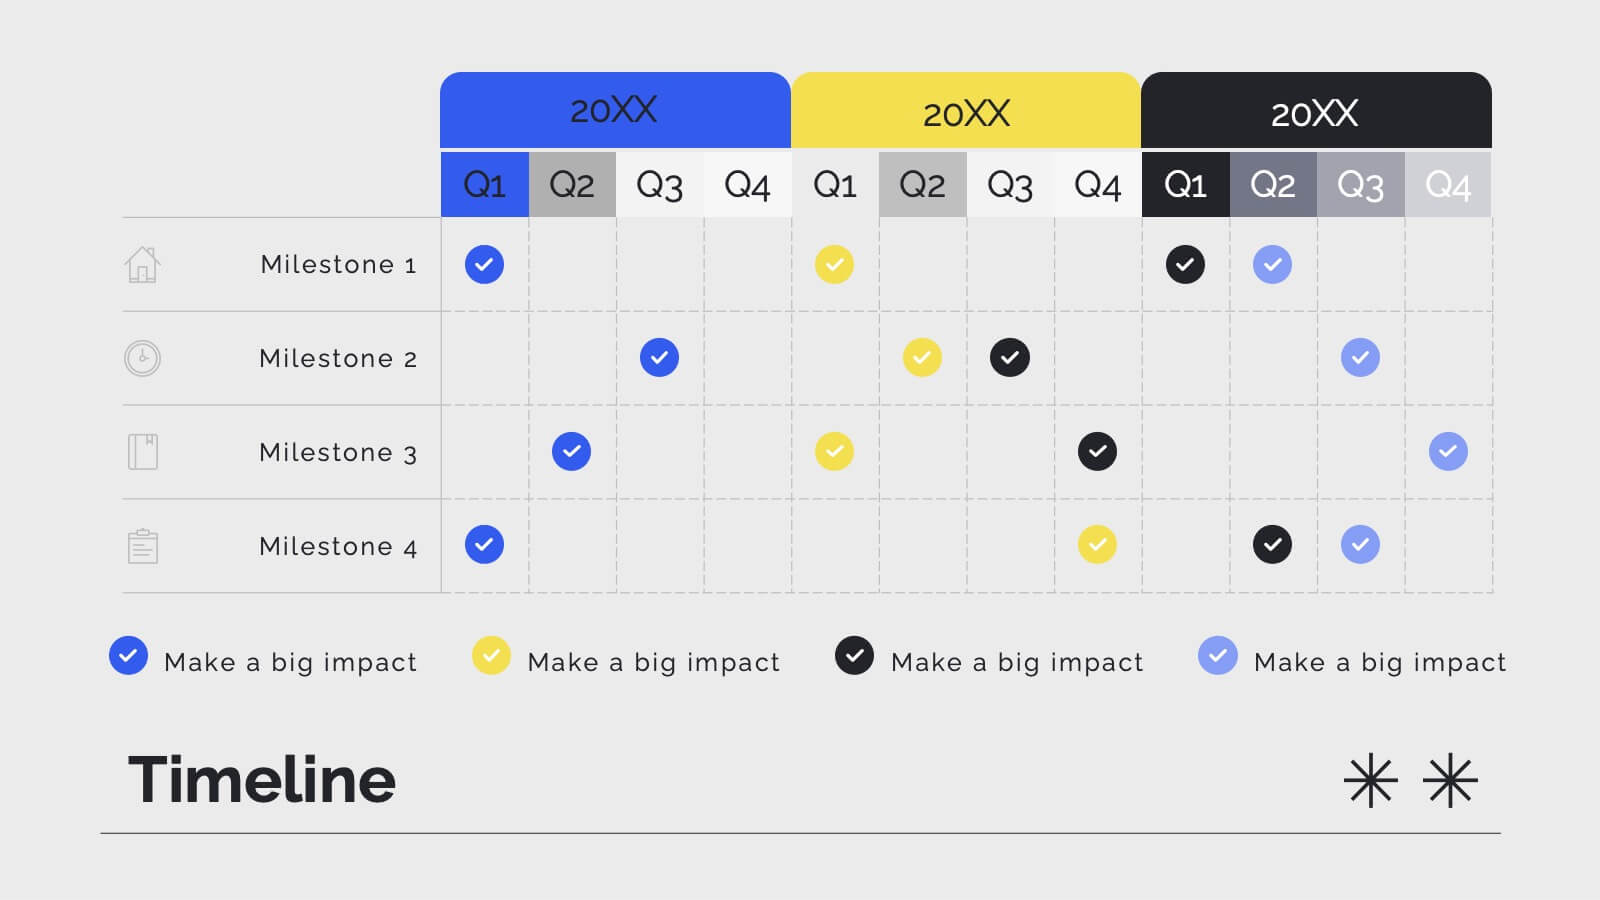
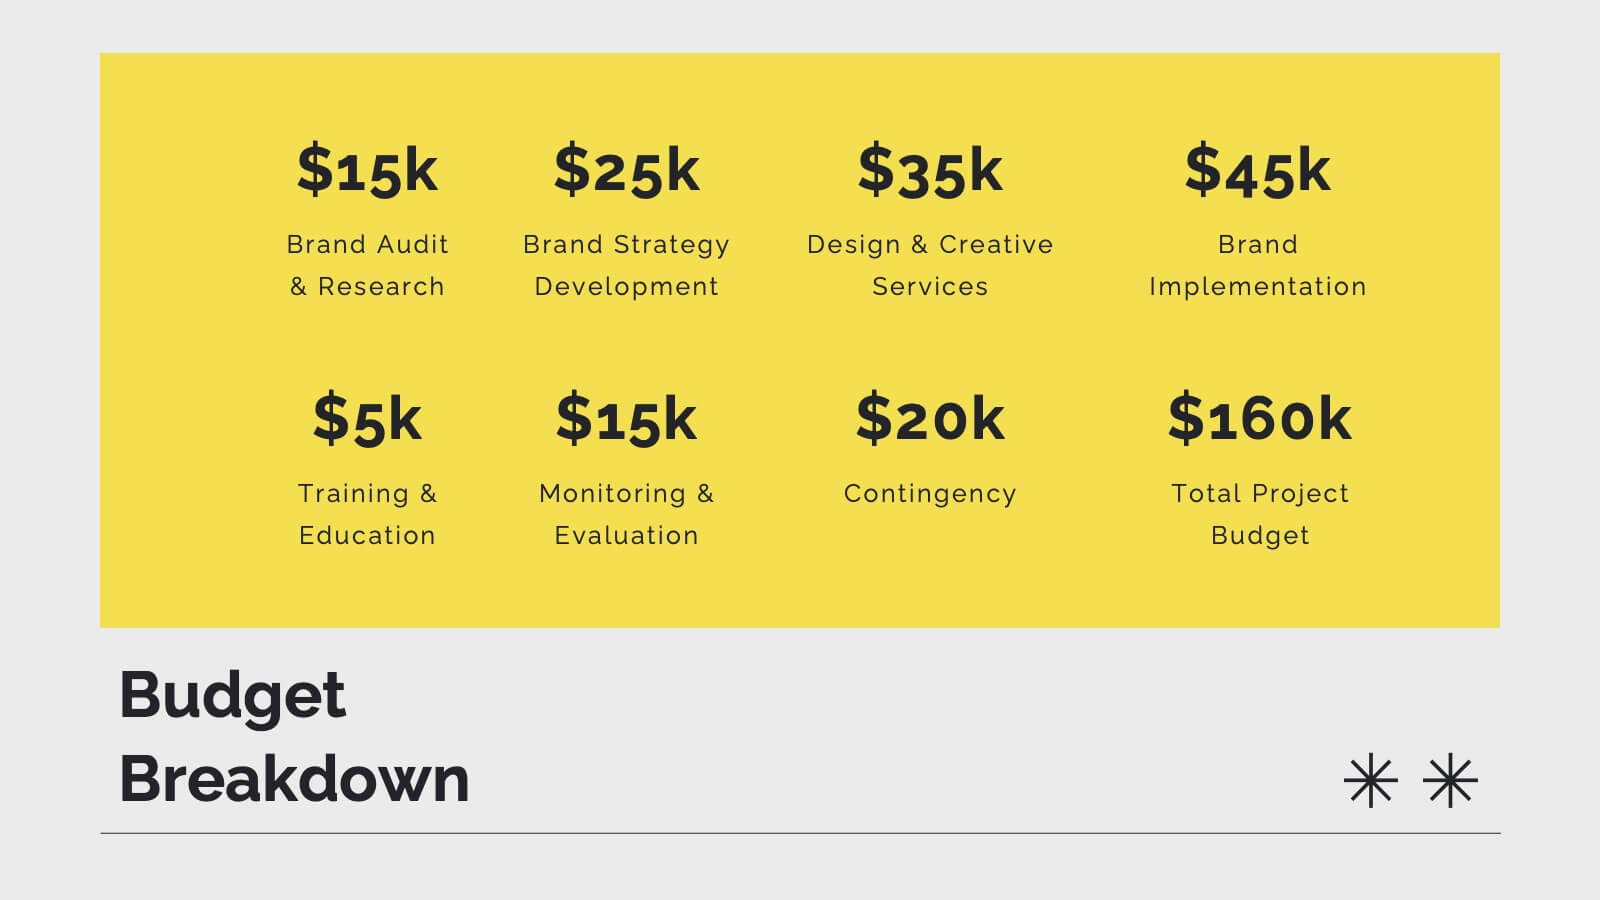
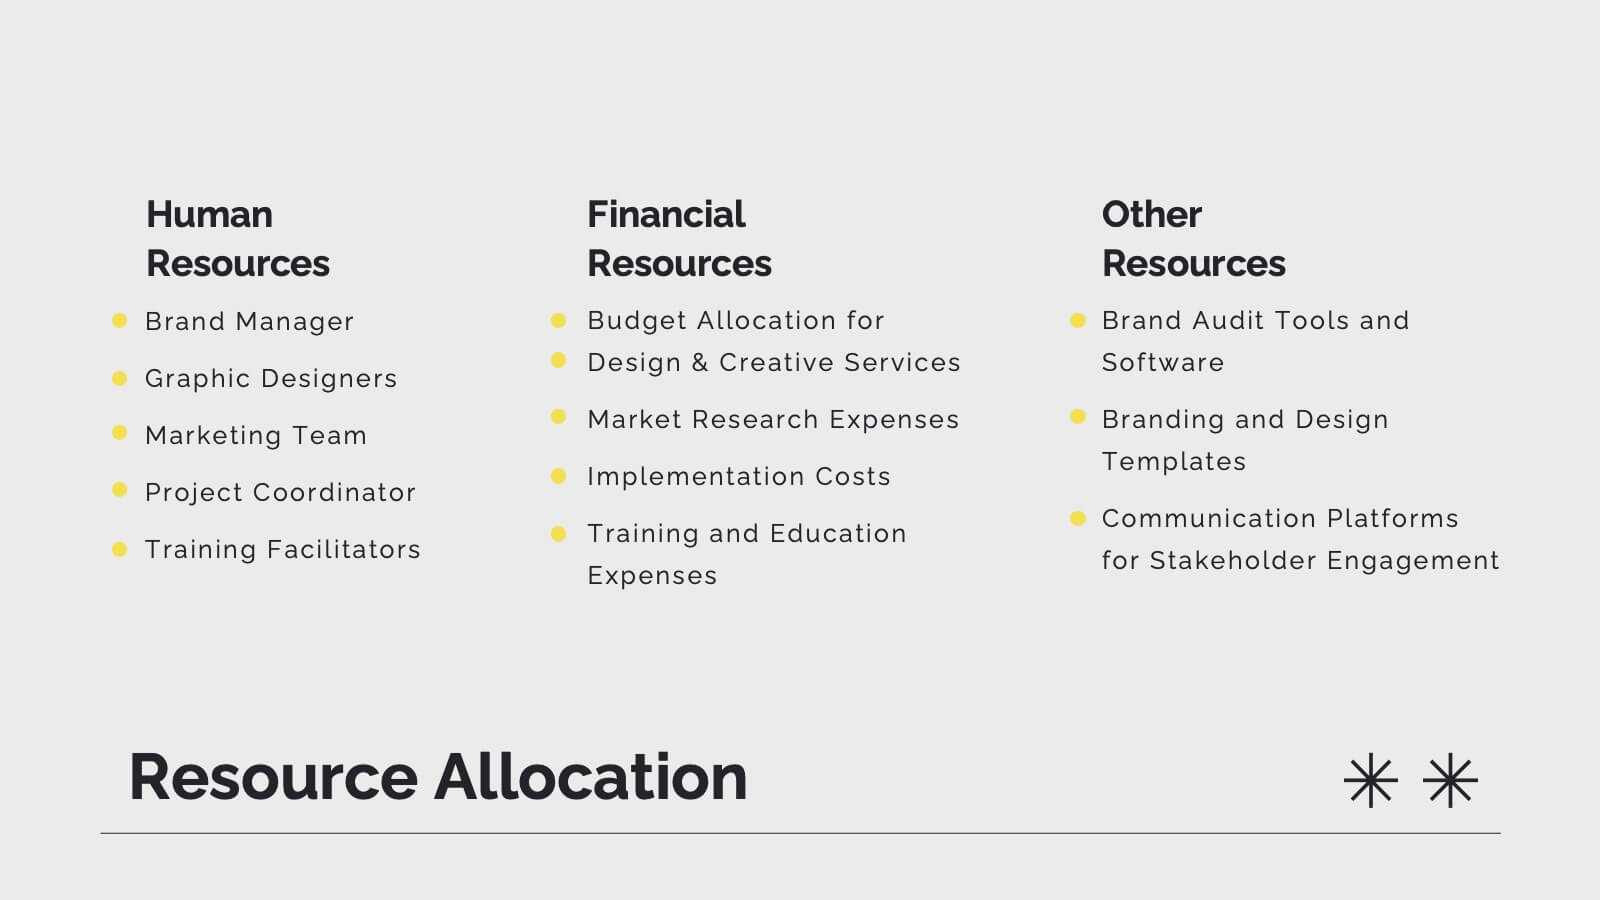
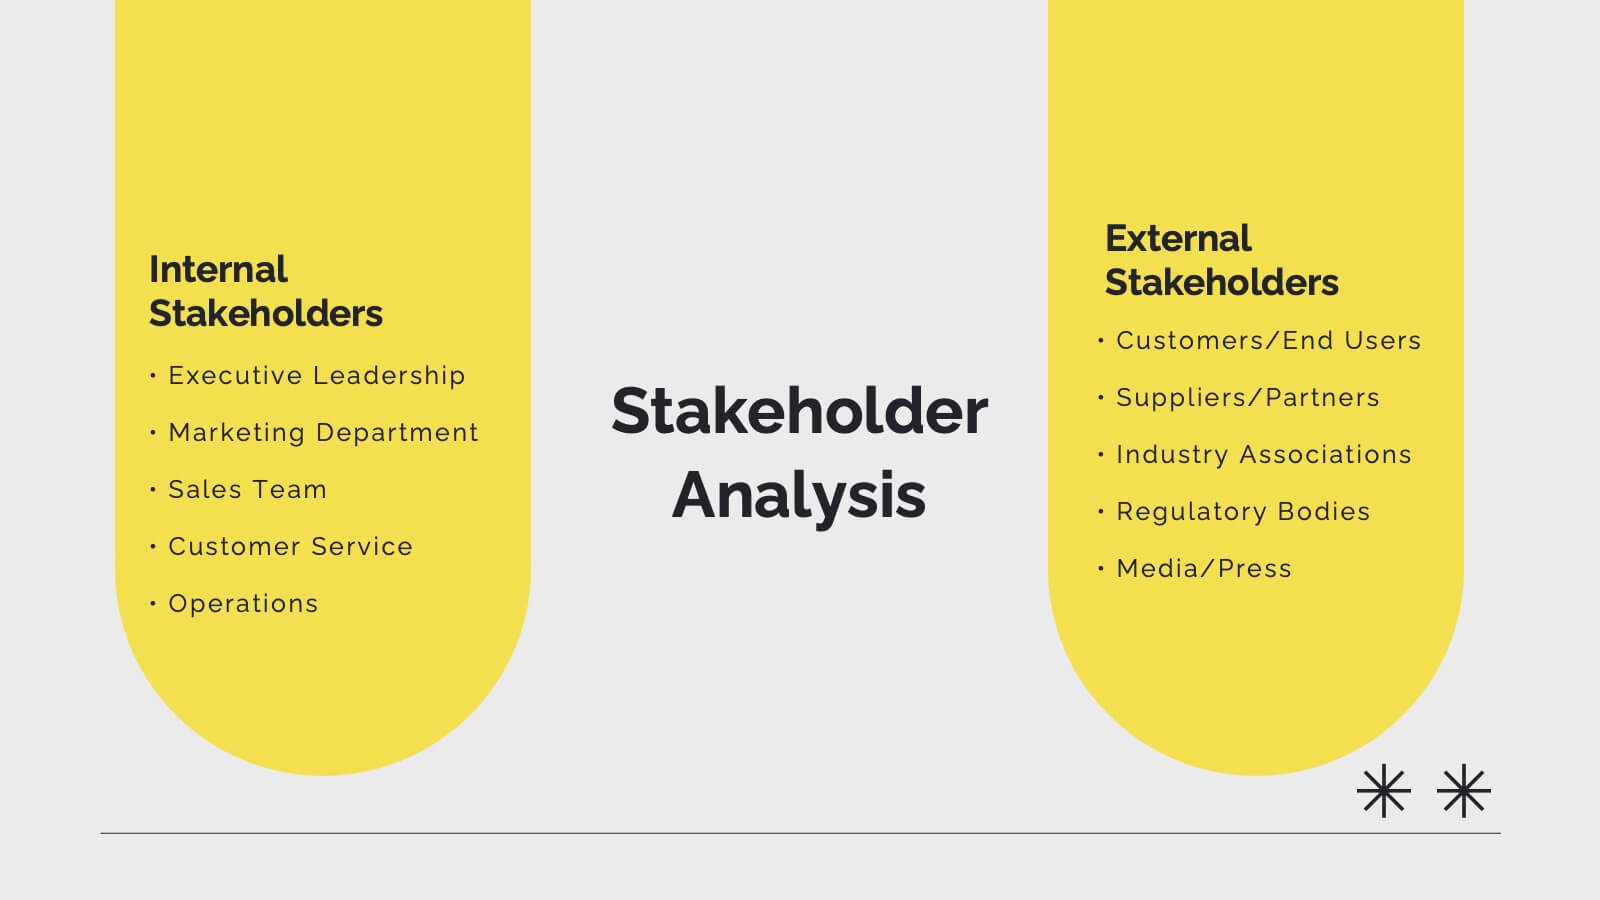
Pulse Project Management Plan Presentation
Streamline your project management with this vibrant template. It covers project overview, objectives, deliverables, methodology, timeline, budget, and risk management. Perfect for clear and engaging presentations. Compatible with PowerPoint, Keynote, and Google Slides for seamless customization.


5 slides
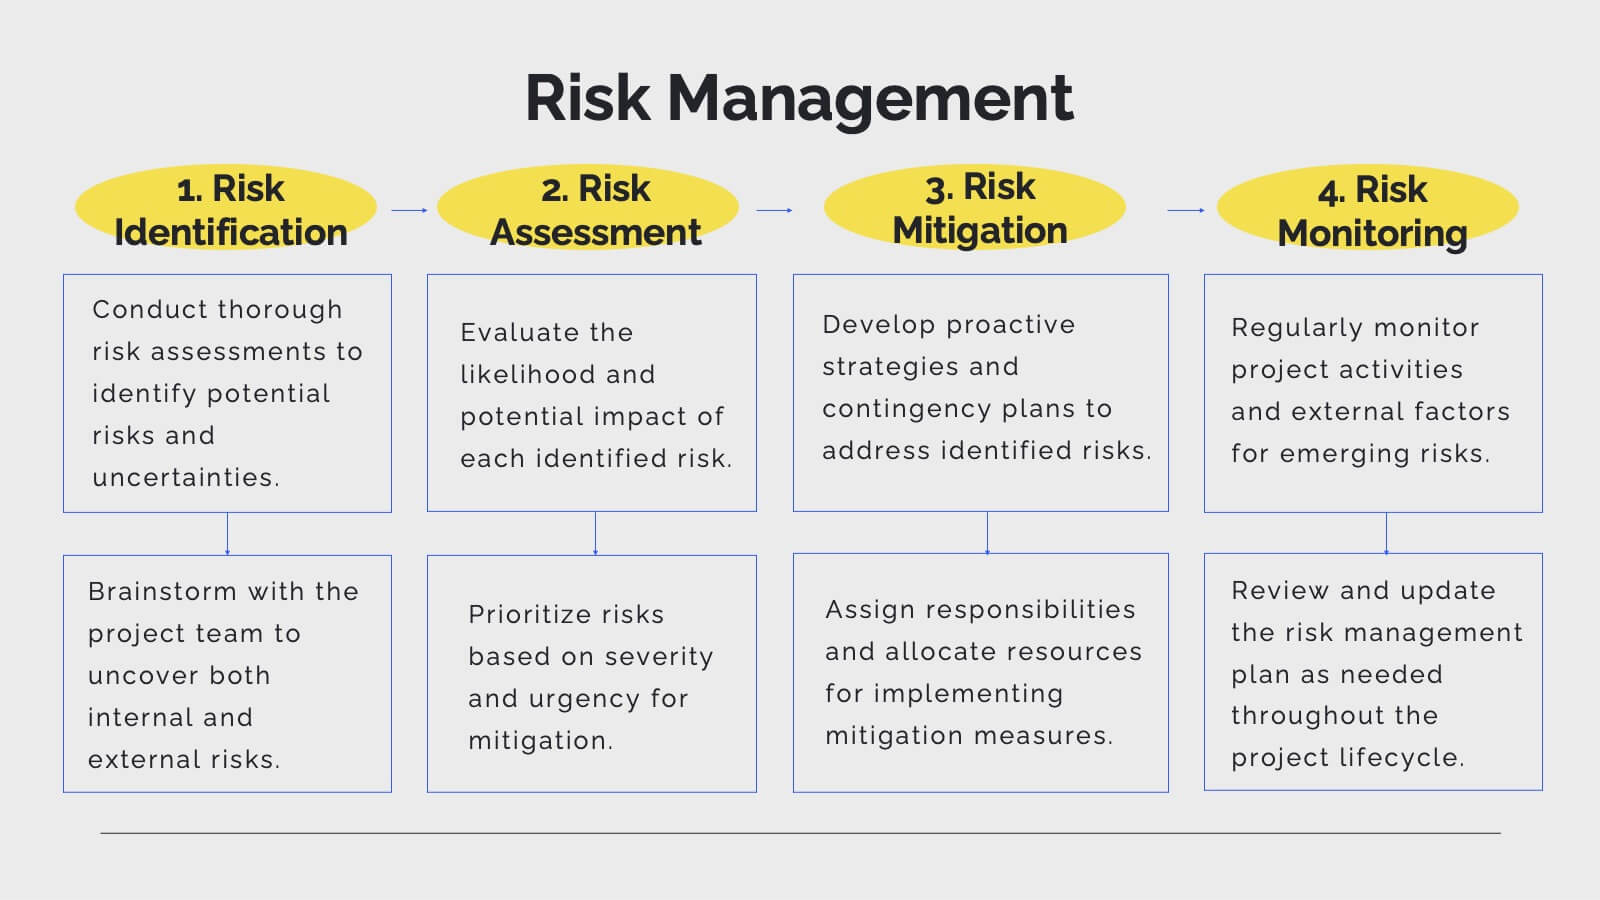
Project Risk Management Framework Presentation
Visualize challenges before they arise with this dynamic framework designed to map, assess, and mitigate project risks efficiently. Its circular layout highlights every critical stage, helping you communicate strategies clearly and professionally. Fully editable and compatible with PowerPoint, Keynote, and Google Slides for effortless customization and presentation flexibility.