


Features
- 6 Unique Slides
- Fully editable and easy to edit in Microsoft Powerpoint, Keynote and Google Slides
- 16:9 widescreen layout
- Clean and professional designs
- Export to JPG, PDF or send by email


Do you have any questions?
Recommend


6 slides
Phased Implementation Timeline Presentation
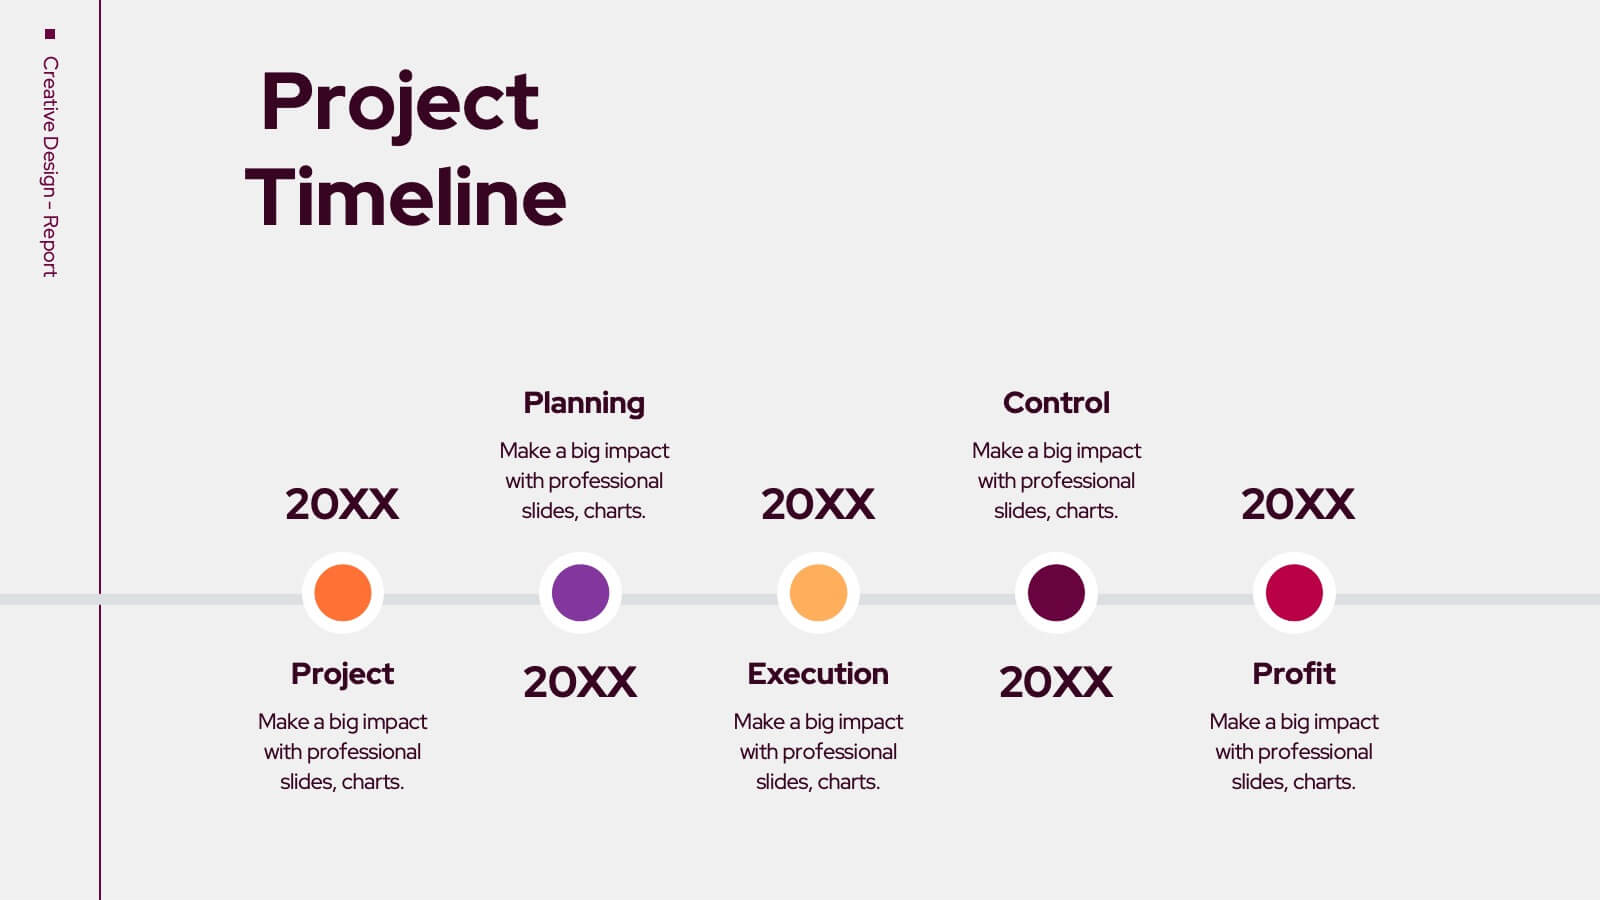
Visualize your project rollout in clear, progressive stages using this curved, multi-phase timeline. Perfect for strategic plans, implementation roadmaps, or development cycles. Includes 6 customizable points with labels, icons, and years. Ideal for business teams and consultants. Fully editable in PowerPoint, Keynote, and Google Slides. Clean, modern, and easy to adapt.


5 slides
Business Statistics Infographic Report Presentation
Present data with clarity using the Business Statistics Infographic Report presentation. This layout combines clean bar graphs, donut charts, and legends to showcase KPIs, progress benchmarks, and segmented insights. Ideal for quarterly reviews, executive updates, or client reporting. Fully editable in PowerPoint, Keynote, or Google Slides.


6 slides
Executive Summary Marketing Infographic
An executive summary is a concise overview of a longer document, report, or proposal, designed to provide readers with a quick understanding of the main points and key takeaways. This infographic template provides a concise and visually appealing overview of a marketing plan, campaign, or strategy. This condenses key information into a format that is easy to understand and presents the most important highlights for decision-makers. This template is a valuable tool to quickly convey the main points and benefits of a document, allowing readers to make informed decisions about whether to delve deeper into the details.


4 slides
Educational Infographic Slide Presentation
Ignite curiosity from the very first slide with a clear, classroom-style visual that makes explanations feel simple and engaging. This presentation helps break down lessons, key concepts, or training points in a way audiences instantly understand. Clean layouts keep the focus on your message. Fully compatible with PowerPoint, Keynote, and Google Slides.


6 slides
Weekly Gantt Planning Slide Presentation
Jump into your week with a layout that makes planning feel effortless and visually clear. This presentation helps teams map tasks across each day, track progress, and organize priorities with a clean, modern weekly timeline. Perfect for project updates and team coordination. Fully compatible with PowerPoint, Keynote, and Google Slides.


5 slides
Climate Change Effects Infographics
Climate Change refers to long-term shifts in weather patterns and average temperatures on Earth. These infographic templates aim to raise awareness about the urgent need for climate action and illustrate the consequences of environmental changes. These can serve as impactful tools for discussing the consequences of climate change. Whether used in educational settings, environmental campaigns, or climate conferences, this template effectively communicates the urgency of the situation and encourages individuals and communities to take action to mitigate the impacts of climate change. Compatible with Powerpoint, Keynote, and Google Slides.


10 slides
Risk Management Plan Presentation
The "Risk Management Plan Presentation" template is designed to outline strategic steps for identifying, assessing, managing, and monitoring business risks. Each segment of the plan is clearly labeled and represented on a segmented wheel, with A identifying risks, B assessing them, C managing responses, and D monitoring and reporting outcomes. The clean and straightforward design ensures key risk management strategies are communicated effectively to stakeholders. This visual tool is perfect for business meetings or training sessions, helping teams understand their roles in mitigating risks and ensuring that the business maintains a proactive approach to challenges.


22 slides
Mistgrove Digital Agency Strategy Plan Presentation
Craft an impactful strategy for your digital agency with this sleek and professional presentation template. Highlight your agency's mission, vision, and services while showcasing success stories through client testimonials and case studies. Dive into essential sections like market analysis, industry trends, and competitive positioning to communicate a forward-thinking strategy effectively. This template includes dedicated slides for creative processes, strategy development, and campaign execution, ensuring you present your approach clearly and confidently. With options for measurement and analytics, future outlooks, and social impact initiatives, it empowers you to convey the value and growth potential of your strategies. Fully compatible with PowerPoint, Google Slides, and Keynote, this template offers seamless customization to align with your agency's unique brand identity and goals.


3 slides
Governance and Compliance Slide Presentation
Bring structure and clarity to complex corporate processes with this modern triangle-based presentation design. Ideal for showcasing governance principles, compliance strategies, and operational standards, it visually balances accountability and efficiency. Fully editable and compatible with PowerPoint, Keynote, and Google Slides for seamless professional customization.


3 slides
Stock Market Performance Overview Presentation
Showcase financial growth like a pro with this clean, data-driven layout designed to visualize performance, market activity, and business progress over time. Ideal for professionals presenting key financial trends, metrics, or strategies. Fully compatible with PowerPoint, Keynote, and Google Slides for easy customization and professional presentation results.


7 slides
Artificial Intelligence Presentation Template
An Artificial Intelligence infographic is a visual representation of information related to AI. This high-definition infographic is completely customizable and will allow you to see advances in AI and other networks. Artificial Intelligence, is evolving rapidly. It's important that we understand what's going on so that we can ensure the future of this technology is beneficial to society. In this informative infographic, you will be able to learn and inform about everything from the difference between artificial intelligence and the differences between expert systems by adding you own data.


5 slides
RAPID Framework for Business Strategy
Clarify decision-making roles with confidence using this vibrant business strategy framework. This template visualizes the RAPID model—Recommend, Agree, Perform, Input, Decide—in a clear flow that simplifies collaboration and speeds up strategy execution. Ideal for leadership teams and cross-functional planning. Works seamlessly in PowerPoint, Keynote, and Google Slides.


8 slides
Biological Structure and Function Presentation
Visualize biological processes with the Biological Structure and Function infographic. Featuring a hexagonal layout, this template allows you to categorize key concepts such as molecular functions, chemical reactions, and biological systems. Fully editable and available for PowerPoint, Keynote, and Google Slides.


8 slides
Environmental and Social Sustainability
Showcase your sustainability efforts with this layered pyramid slide, perfect for visualizing tiered environmental or social responsibility strategies. Ideal for ESG reporting, sustainability workshops, or stakeholder presentations. Fully customizable in PowerPoint, Keynote, and Google Slides to match your brand and message.


4 slides
School Curriculum Overview Presentation
Present your academic plan with this creative curriculum overview layout. Featuring intersecting pencil graphics, it visually organizes four key subjects or areas of focus. Perfect for teachers, school administrators, or education consultants. Fully customizable in PowerPoint, Keynote, and Google Slides to match any educational level or institutional branding.


5 slides
Core to Outer Ring Concentric Planning Presentation
Present your strategy from the inside out with the Core to Outer Ring Concentric Planning Presentation. This layered, radial design guides viewers through a central concept outward into supporting elements—ideal for planning, process modeling, or decision frameworks. Fully customizable in PowerPoint, Keynote, and Google Slides.


21 slides
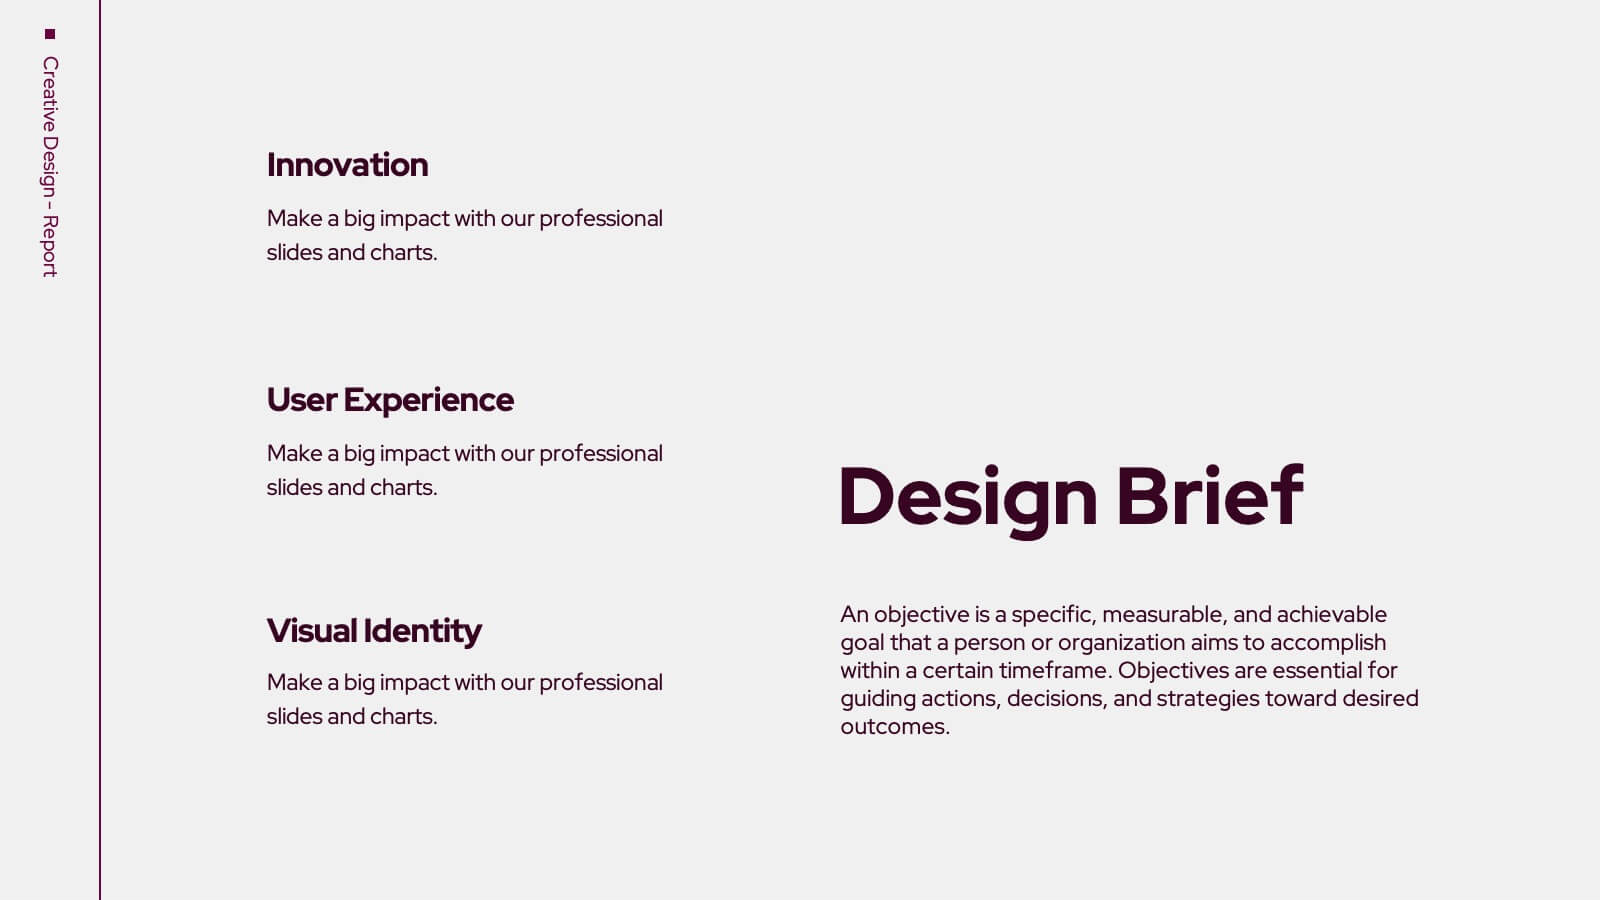
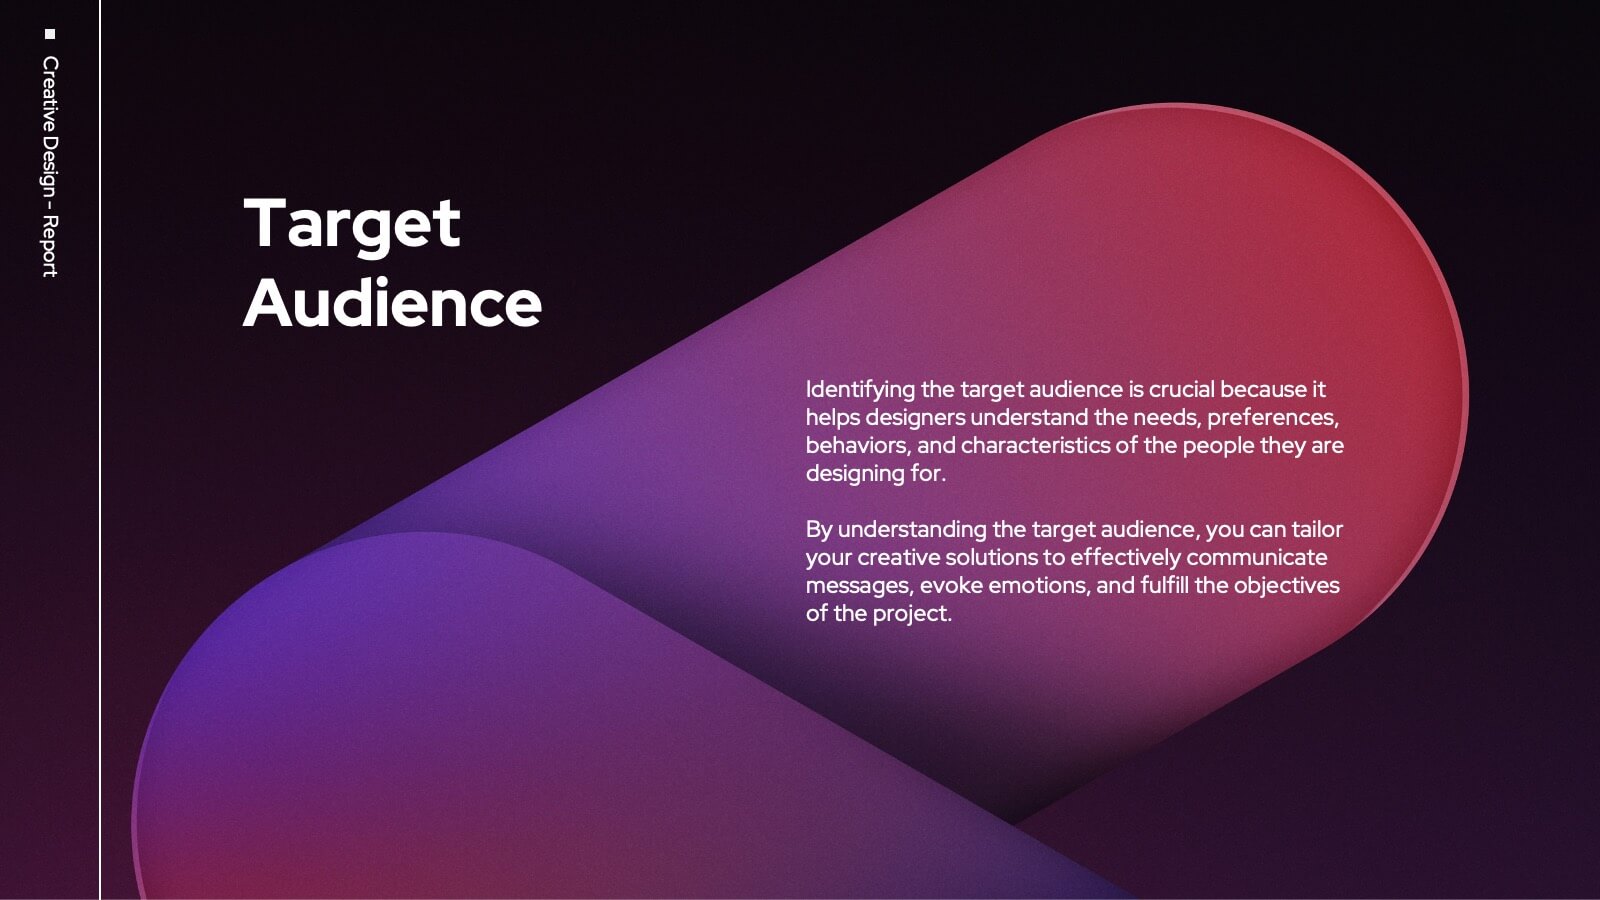
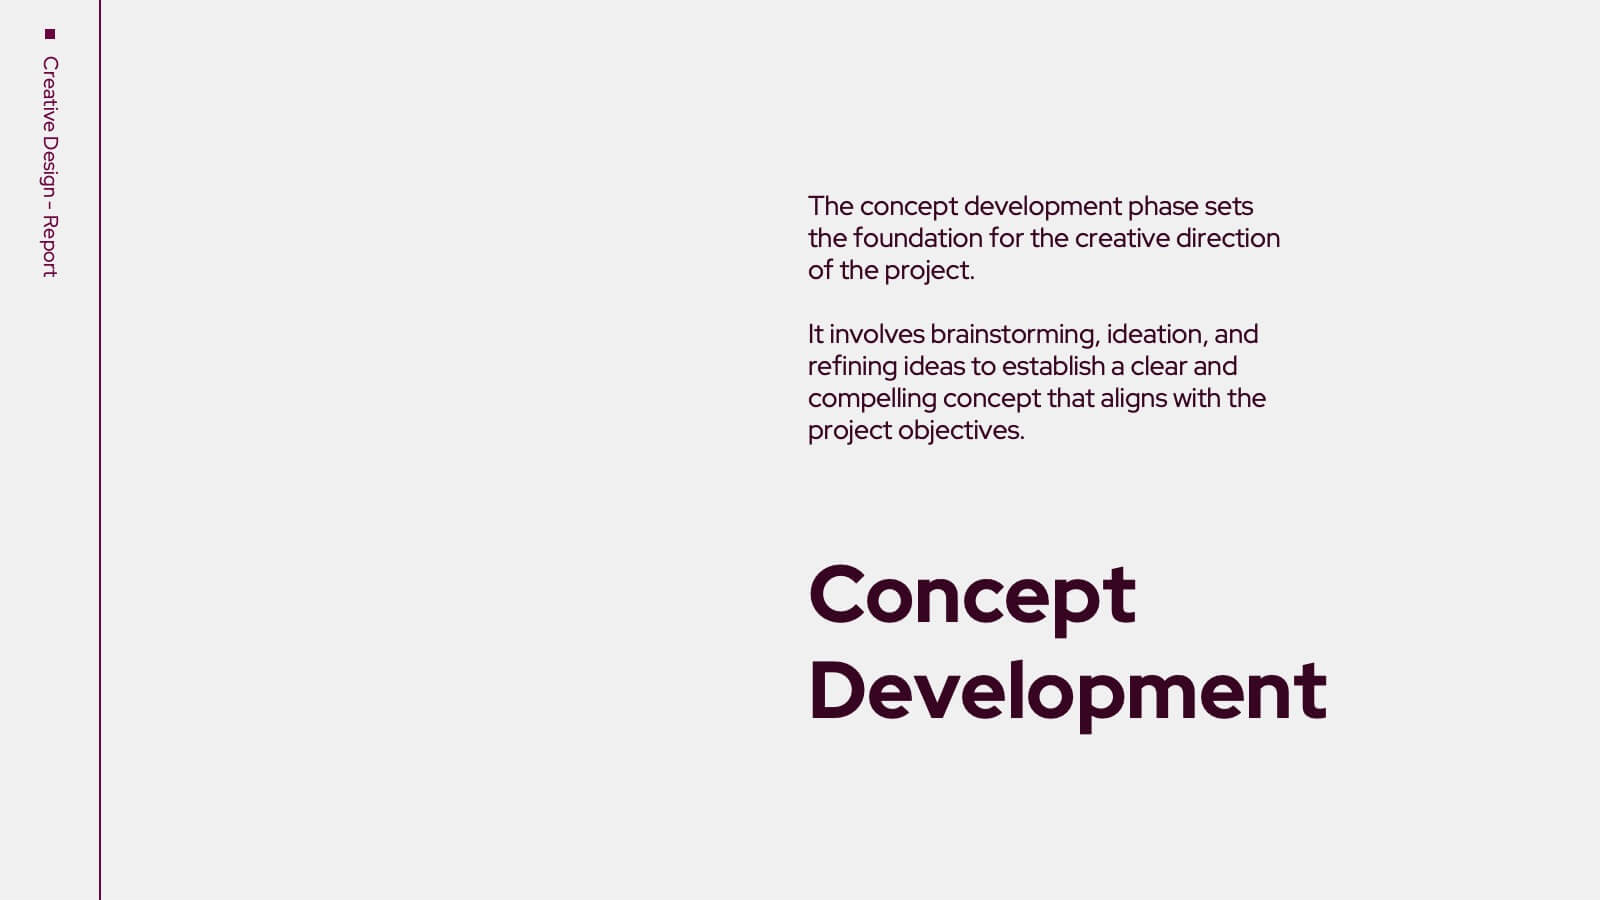
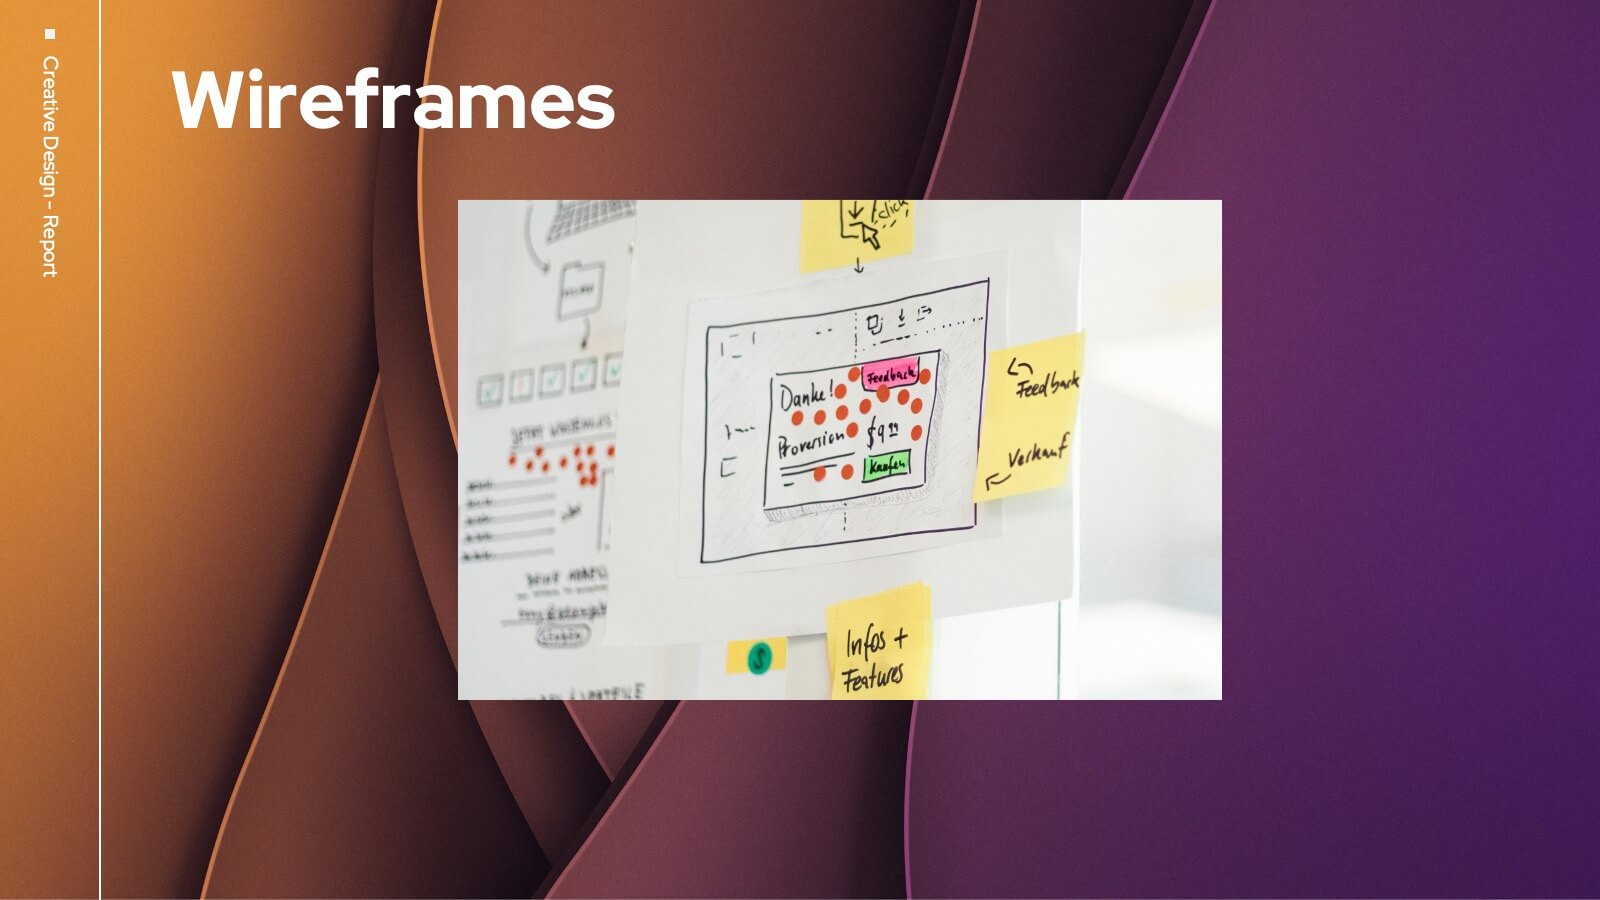
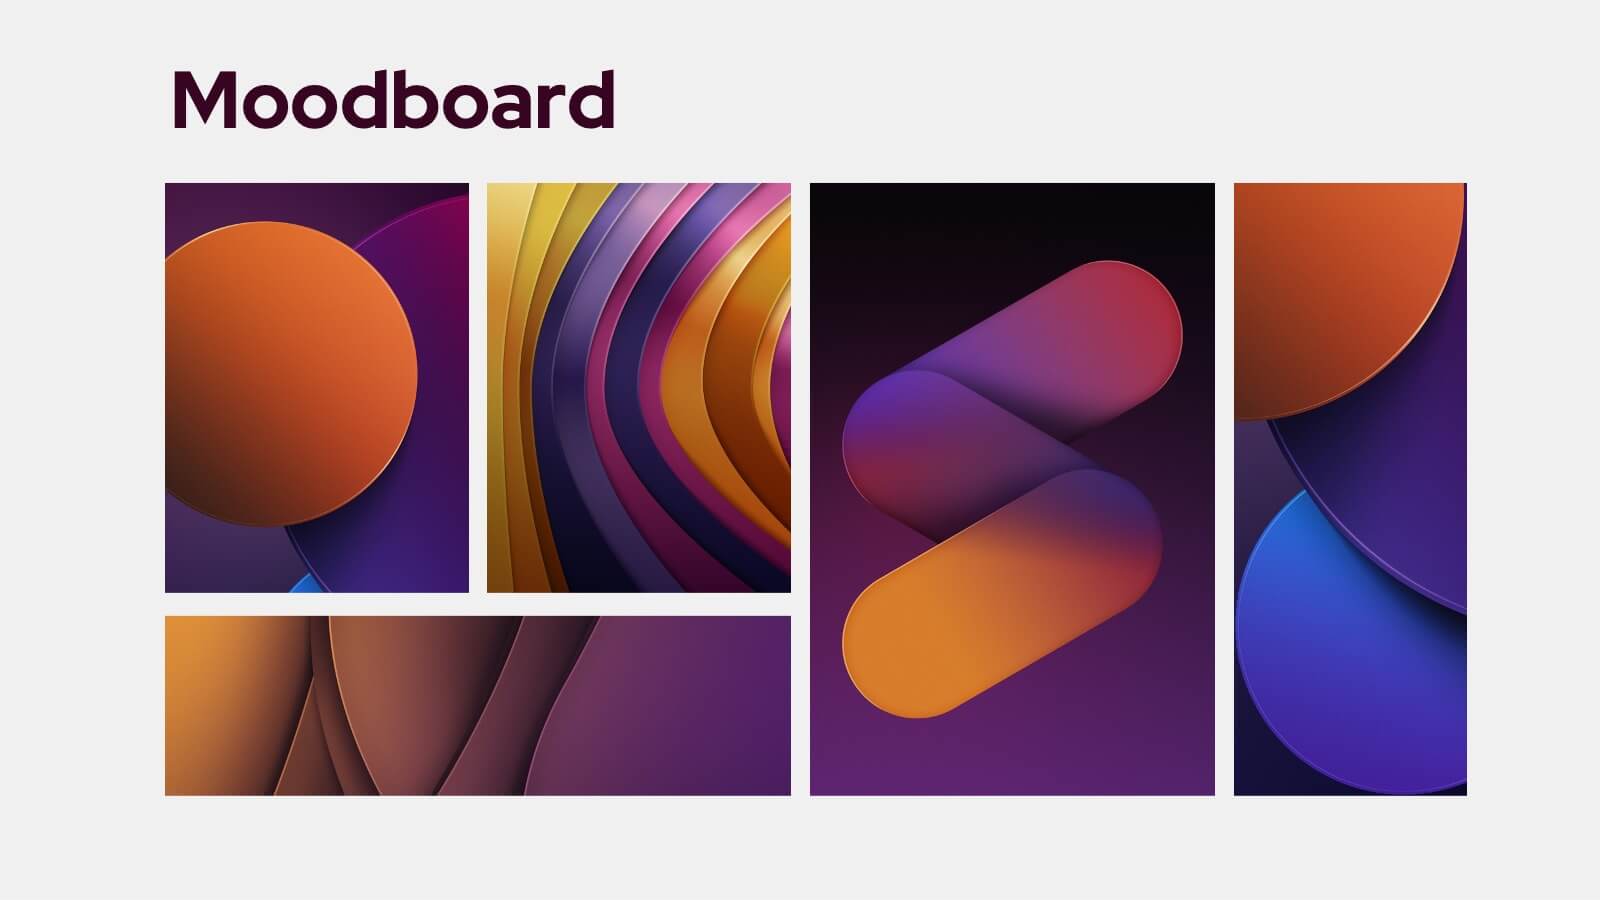
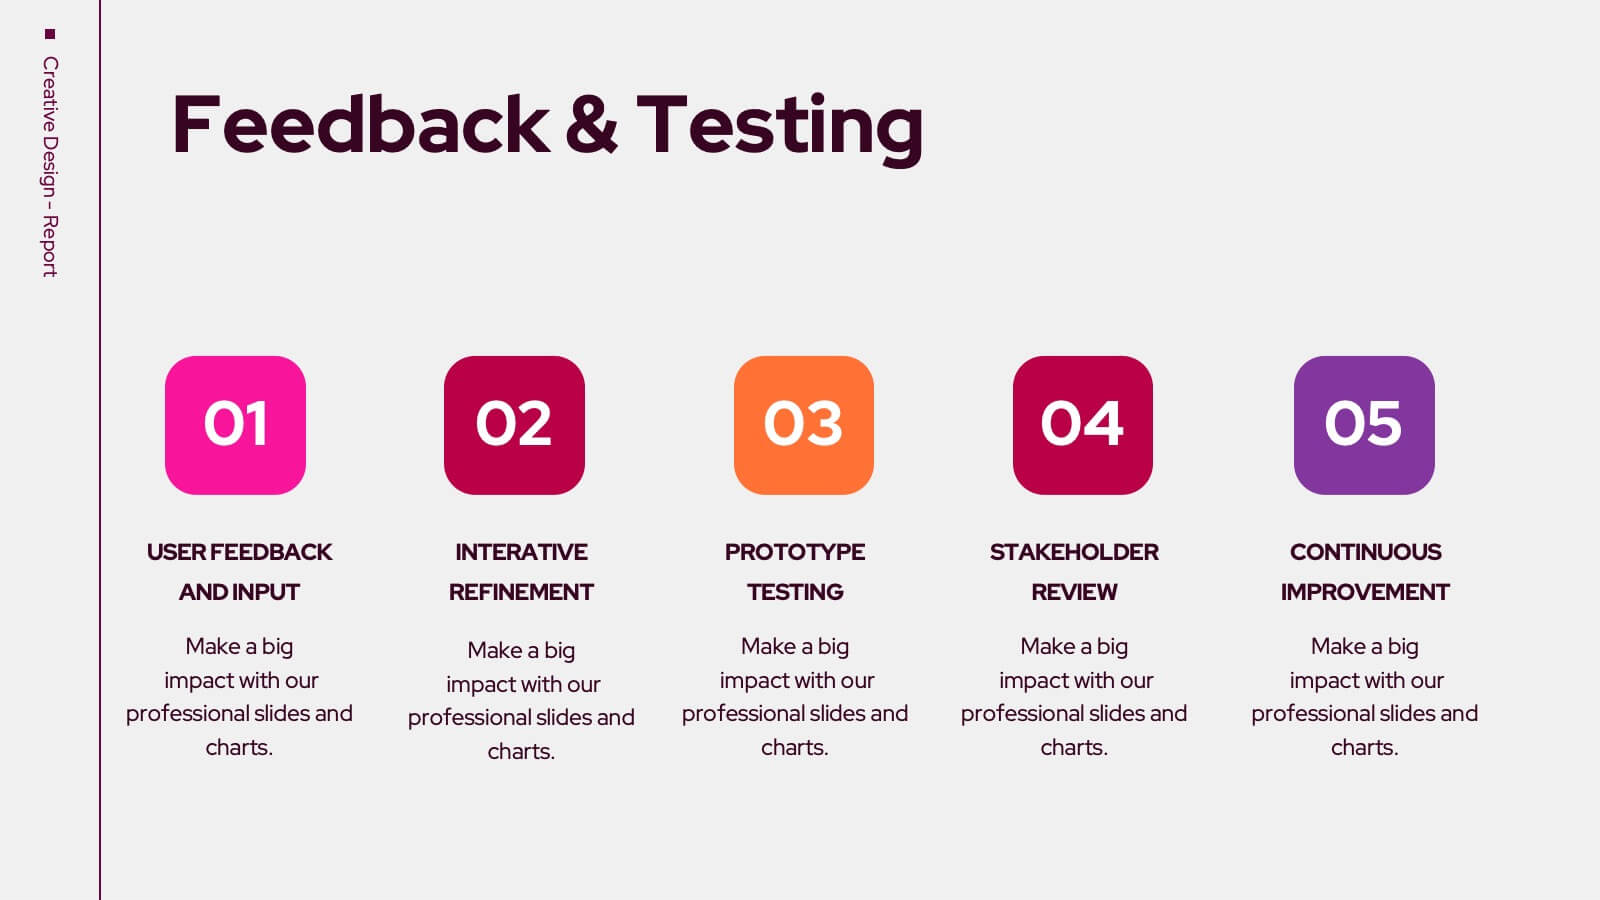
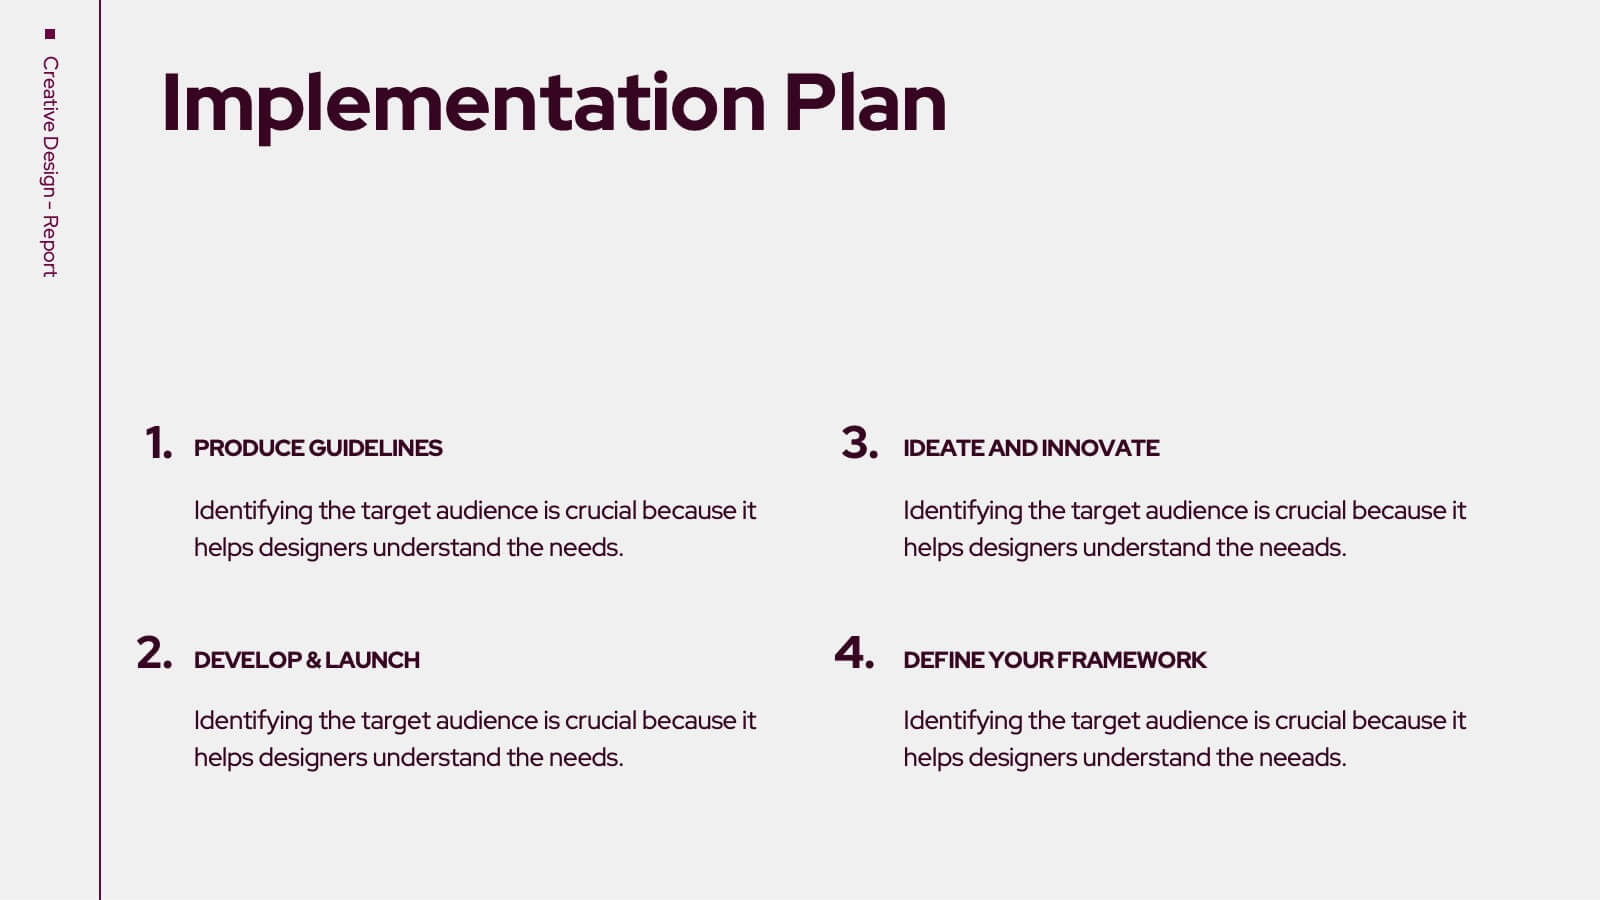
Trojan Creative Design Report Presentation
Unleash your creativity with this striking Trojan-inspired presentation template! Ideal for showcasing your design projects, this presentation enables you to highlight key concepts, inspirations, and visual elements effectively. Its engaging layout ensures your ideas shine through, captivating your audience. Compatible with PowerPoint, Keynote, and Google Slides for seamless presentations.