


Features
- 5 Unique slides
- Fully editable and easy to edit in Microsoft Powerpoint, Keynote and Google Slides
- 16:9 widescreen layout
- Clean and professional designs
- Export to JPG, PDF or send by email


Do you have any questions?
Recommend


4 slides
Agile Workflow Presentation
Bring energy and motion to your process overview with a clean, loop-based flow that makes each stage easy to follow. This presentation is designed to clarify steps, illustrate iterations, and support clear decision-making for any project. Fully customizable and compatible with PowerPoint, Keynote, and Google Slides.


5 slides
Artificial Intelligence Tools Infographics
Artificial Intelligence has advanced rapidly in recent years, leading to the development of various tools and technologies that leverage AI algorithms and techniques. These vertical infographics highlight various tools and technologies used in the field of AI. This template provides an engaging way to showcase different AI tools and their functionalities. This features a sleek and contemporary design that captures attention. The combination of vibrant colors, high-quality icons, and visuals adds a modern touch to the infographics. The template offers multiple slides that provide an overview of AI and its technologies.


5 slides
Business Organizational Structure Presentation
Showcase your Business Organizational Structure with this modern and professional infographic template. Designed to visually represent company hierarchy, this slide enhances clarity in roles, team relationships, and reporting structures. Fully customizable in PowerPoint, Keynote, and Google Slides, making it perfect for corporate strategy presentations, HR reports, and leadership meetings.


26 slides
Building Community Networks Presentation
Strengthen connections and foster collaboration with this engaging presentation on building community networks. Covering key topics like social engagement, resource sharing, grassroots initiatives, and digital networking, this template helps highlight strategies for creating meaningful relationships. Fully customizable and compatible with PowerPoint, Keynote, and Google Slides for a seamless and impactful presentation experience.


26 slides
Salus Rebranding Project Plan Presentation
This rebranding project plan template offers a clear framework for presenting brand identity transformation. Covering brand values, identity components, target audience, positioning, and guidelines, it’s ideal for companies refreshing their brand. Compatible with PowerPoint, Keynote, and Google Slides, it ensures a streamlined, professional presentation of your rebranding strategy.


5 slides
Health and Safety Training Presentation
Ignite your team's commitment to safety with our 'Health and Safety Training' presentation template. Designed to highlight key safety practices and emergency procedures, this tool is essential for effective training sessions. Ideal for any organization, it's compatible with PowerPoint, Keynote, and Google Slides, ensuring wide accessibility.


5 slides
Project Status Update and Timeline Presentation
Keep your team aligned with this clean, easy-to-read status update template. Featuring progress bars, monthly Gantt chart visuals, and icons for each task, it’s perfect for tracking milestones, team updates, and project phases. Fully editable in PowerPoint, Keynote, and Google Slides.


5 slides
Process Improvement Cycle Mapping Presentation
Illustrate continuous growth and optimization with this modern process improvement cycle template. Featuring a dynamic circular flow design, it’s ideal for showcasing iterative strategies, workflow enhancements, or business development stages. Fully editable in Canva, PowerPoint, and Google Slides, it ensures clarity and professionalism in mapping each step toward better performance.


4 slides
EU Business Coverage Map Presentation
Highlight your European business presence with the EU Business Coverage Map Presentation. This slide layout uses pinpoint markers and color-coded regions to showcase operations, regional offices, or market coverage across Europe. Ideal for quarterly reports, sales updates, or investor briefings. Fully editable in PowerPoint, Keynote, Google Slides, and Canva.


23 slides
Rainshadow Digital Strategy Presentation
This Digital Strategy Presentation Template is designed to provide a structured approach to planning and implementing digital initiatives. Covering essential elements such as market trends, competitive analysis, value proposition, and risk management, it offers a professional framework to align goals with actionable steps. Fully customizable and compatible with PowerPoint, Keynote, and Google Slides.


6 slides
Professional Company Portfolio Presentation
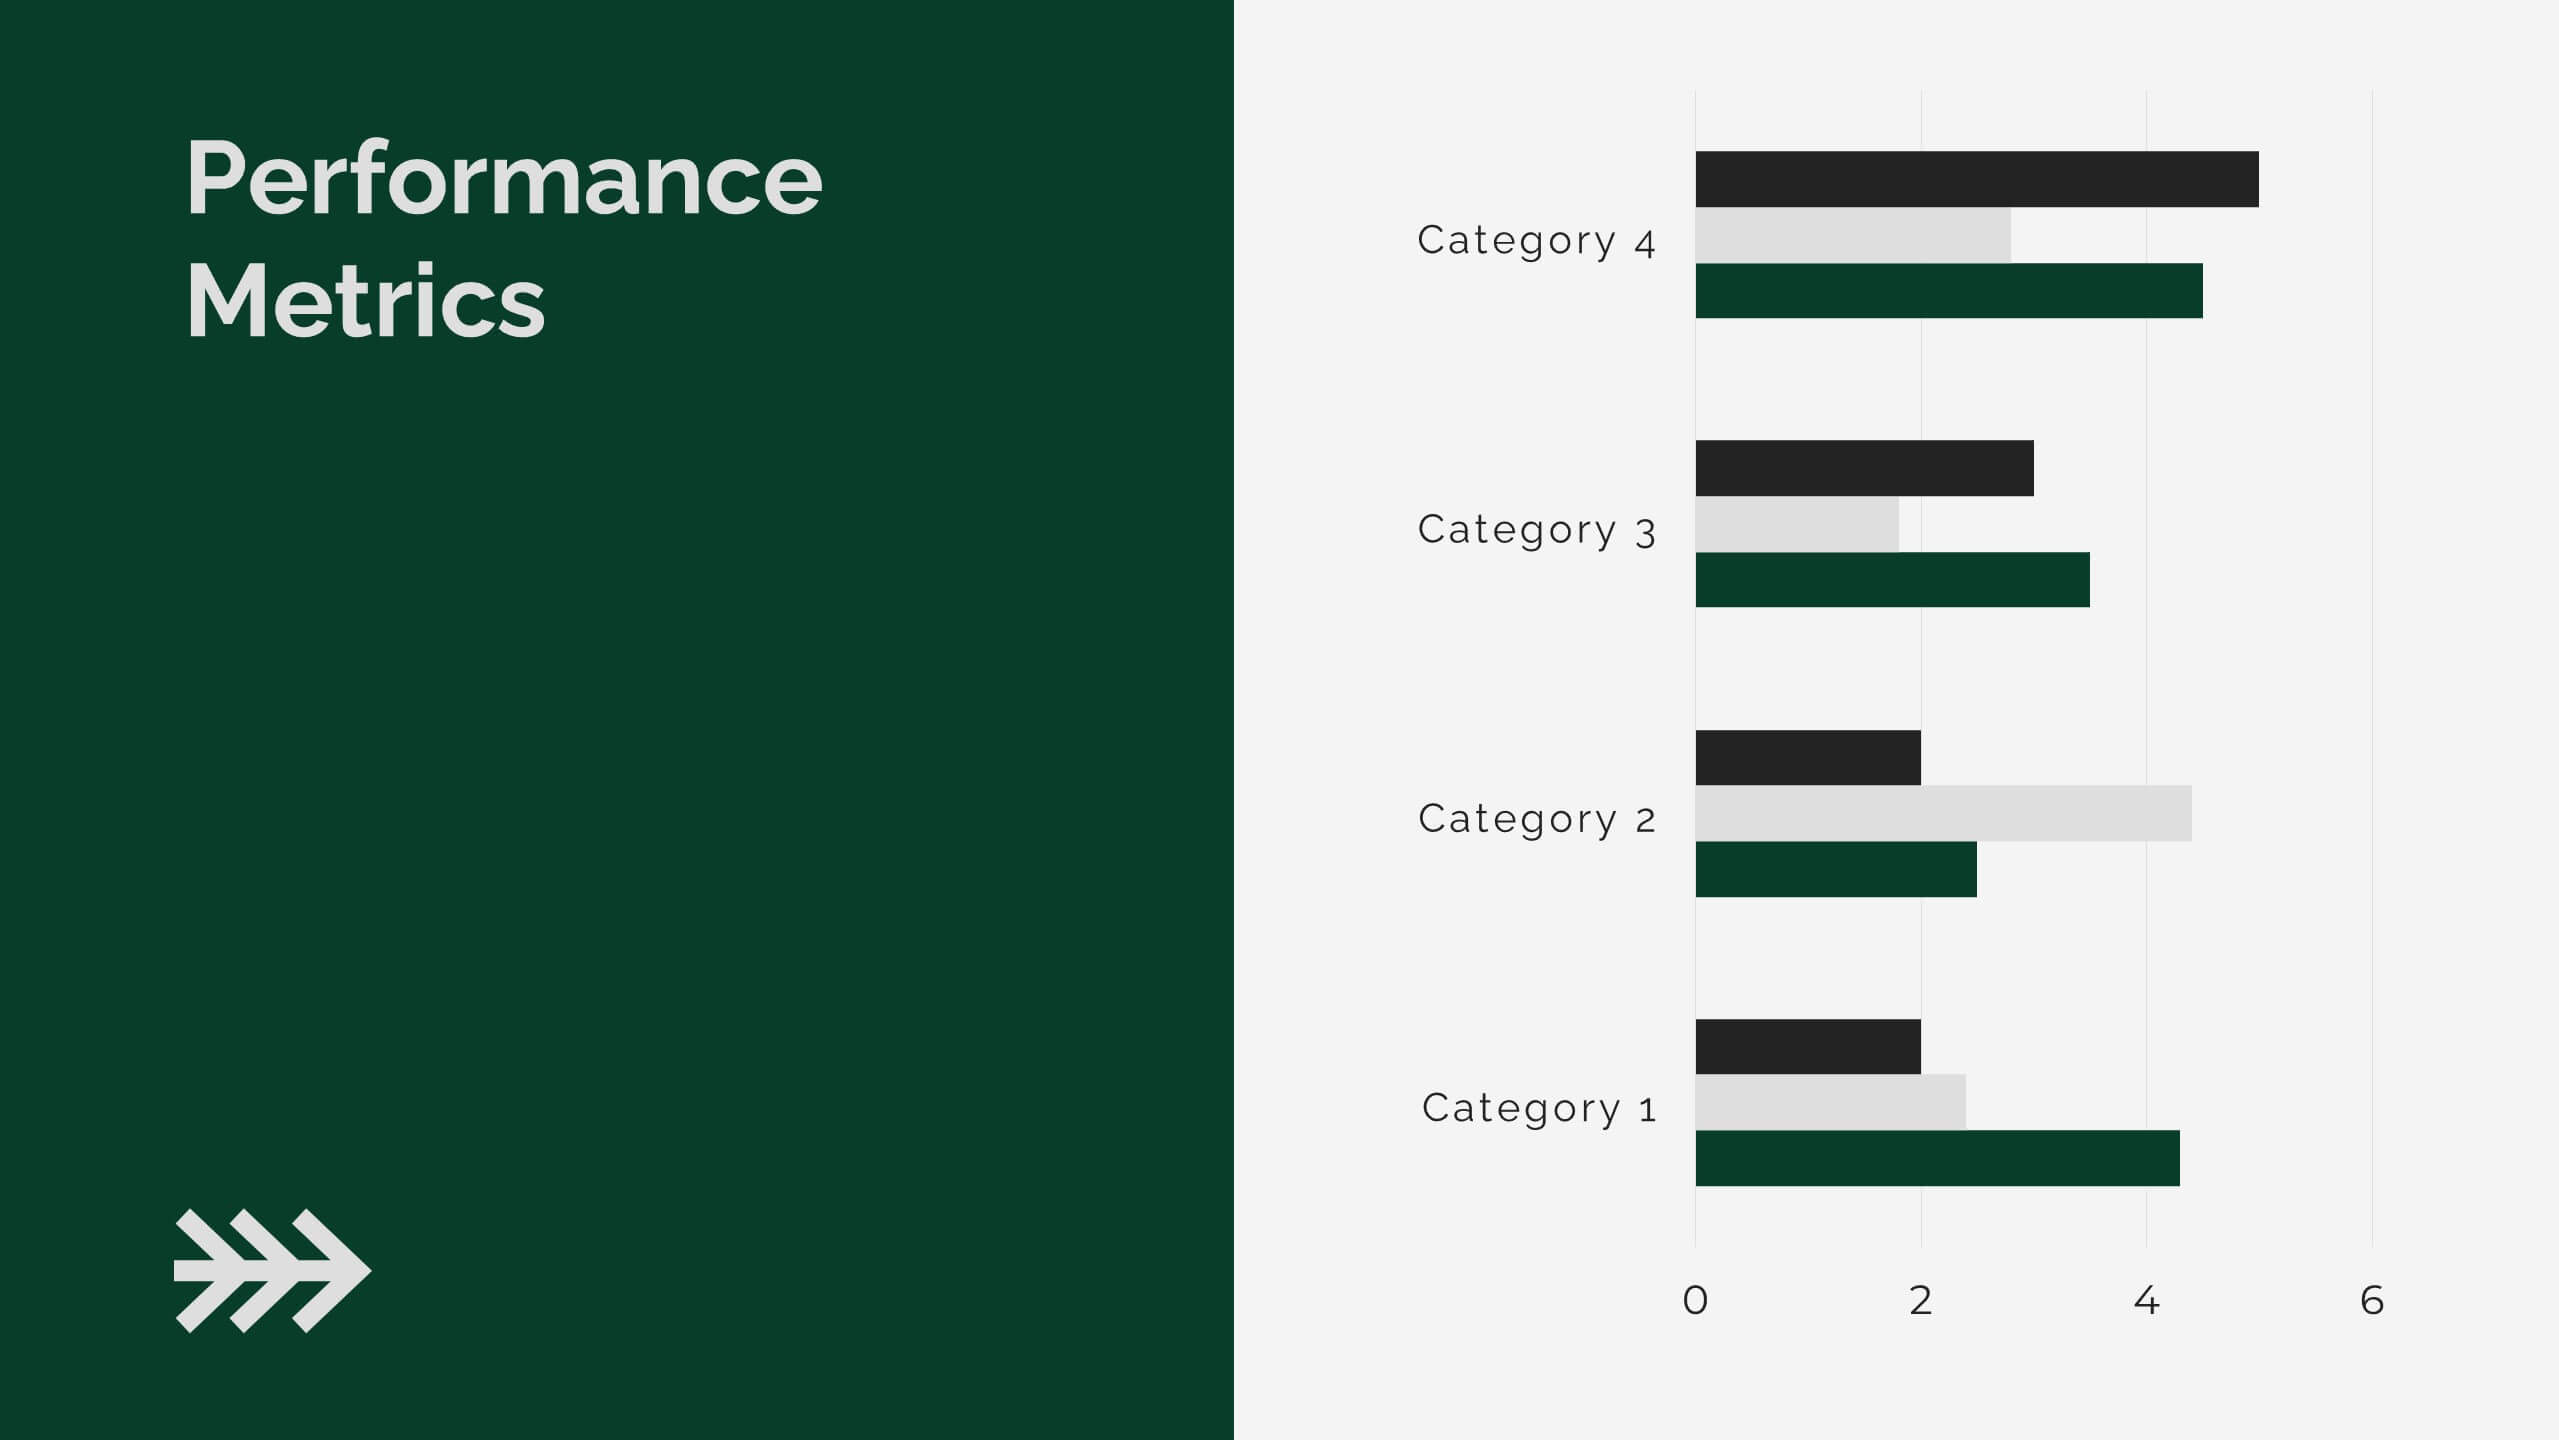
Showcase Your Business Success with a Sleek Portfolio! The Professional Company Portfolio template is designed to highlight key achievements, performance metrics, and strategic insights with a modern, image-driven layout. Featuring three visually appealing sections, this template allows you to present KPIs, revenue growth, and business milestones in a compelling and structured way. Fully customizable in PowerPoint, Keynote, and Google Slides, this portfolio template is perfect for presentations, investor updates, and corporate showcases.


5 slides
Strategic Blue Ocean Shift Presentation
Dive into bold new thinking with a slide that makes strategic transformation feel clear, focused, and actionable. This presentation breaks down key decisions that help teams shift from competitive pressure to value innovation, making complex choices easy to visualize and present. Fully compatible with PowerPoint, Keynote, and Google Slides.


4 slides
Fixed and Variable Cost Balance Presentation
Visualize cost distribution using a balanced scale metaphor. This presentation helps compare fixed and variable costs with editable sections for data input. Ideal for financial planning, budgeting, or cost control analysis. Fully customizable in PowerPoint, Keynote, and Google Slides to match any brand or business presentation style.


7 slides
Progress Report Infographics
In the dynamic landscape of modern businesses, understanding and tracking progress is paramount. The progress report infographic, bathed in hues of blue, orange, and yellow, offers a concise yet comprehensive snapshot of advancements and milestones. Created for managers, team leads, and stakeholders in mind, this tool aids in monitoring, communicating, and celebrating growth. Whether you're analyzing quarter-to-quarter performance or year-end overviews, its versatility ensures coherence and clarity. With seamless integration capabilities for PowerPoint, Keynote, and Google Slides, this infographic is primed to elevate any business presentation.


26 slides
Forge Brand Strategy Report Presentation
The Brand Strategy Presentation Template is a sleek solution for showcasing brand identity. Highlight mission, values, audience personas, and future growth plans across 26 structured slides. Fully customizable for PowerPoint, Keynote, and Google Slides, it’s ideal for presenting brand insights to clients or stakeholders with professionalism and clarity.


19 slides
Dynamo Product Roadmap Presentation
Introduce your product roadmap with this professional template! Showcase customer pain points, demonstrate how your product solves problems, and provide a detailed product overview. Highlight your competitive analysis, marketing and sales strategy, and distribution channels. Perfect for presenting support information and engaging in Q&A sessions. Compatible with PowerPoint, Keynote, and Google Slides for versatile presentations.


5 slides
Creative Bubble Map Infographic Presentation
Bring your ideas to life with dynamic visuals that make connections clear and storytelling effortless. This modern infographic presentation is perfect for showcasing relationships, categories, or data insights in a bold and engaging way. Fully editable and compatible with PowerPoint, Keynote, and Google Slides for seamless customization.