


Features
- 4 Unique slides
- Fully editable and easy to edit in Microsoft Powerpoint, Keynote and Google Slides
- 16:9 widescreen layout
- Clean and professional designs
- Export to JPG, PDF or send by email


Do you have any questions?
Recommend


7 slides
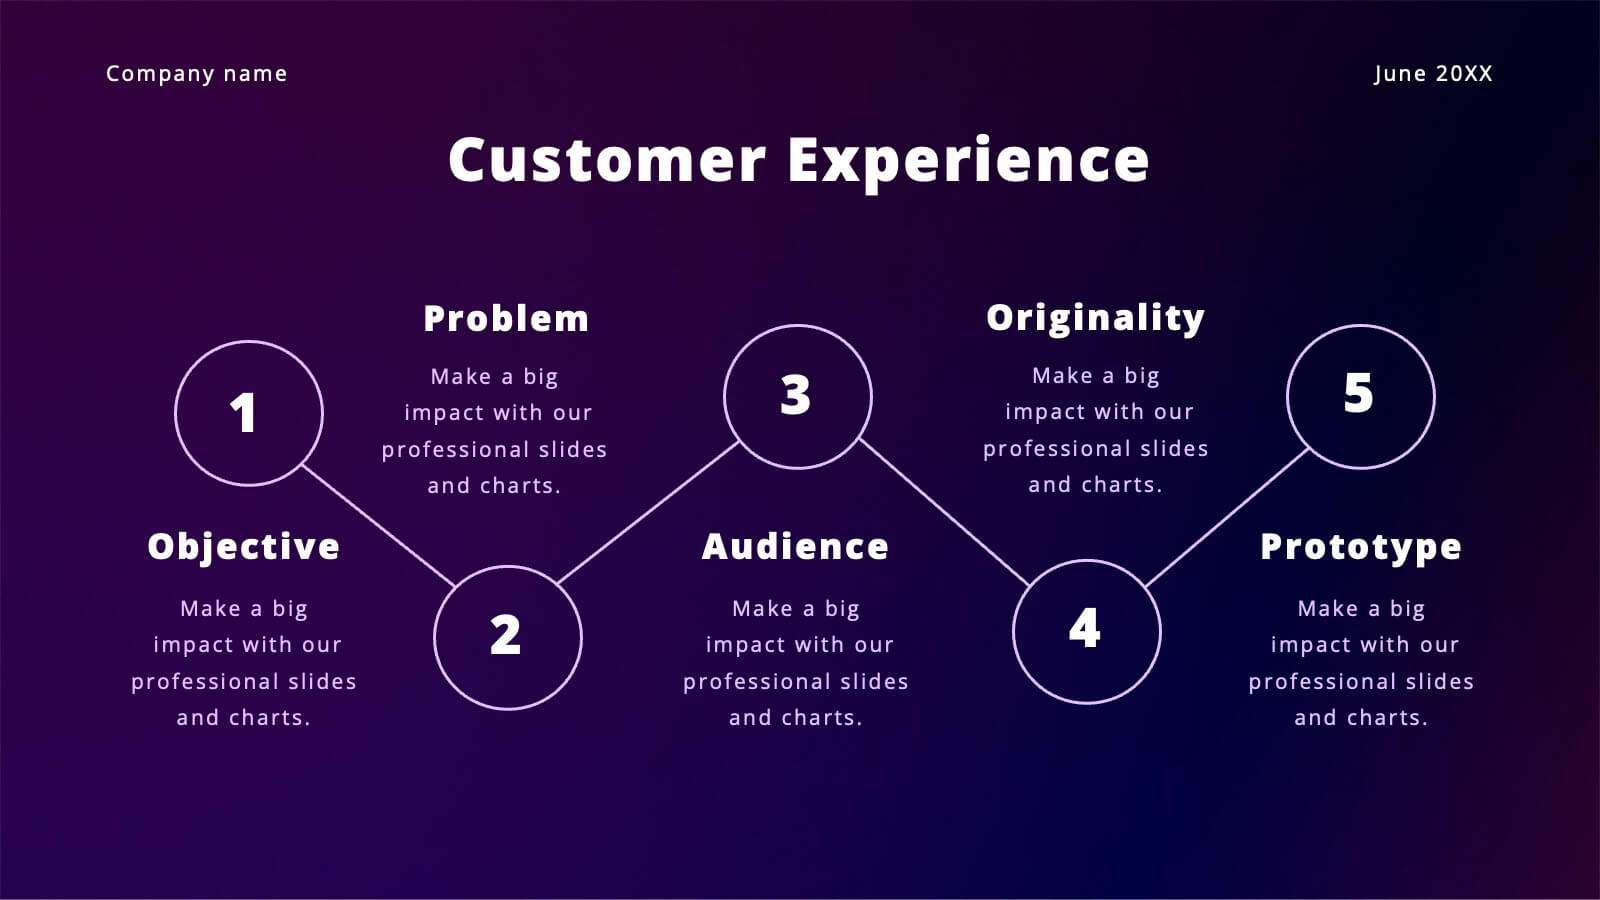
6 Steps Circle Diagram
Streamline complex processes with our "6 Steps Circle Diagram" template. This visually appealing infographic elegantly organizes interconnected stages in a circular layout, ideal for outlining workflows, development cycles, or project phases. Each segment is color-coded and provides ample space for detailed descriptions, enhancing the clarity and effectiveness of presentations. This format allows viewers to easily grasp relationships and dependencies, improving comprehension and retention. Perfect for educators, project managers, and business analysts, this template ensures that all stages are interconnected and clearly communicated. Compatible with PowerPoint, Keynote, and Google Slides, it's a versatile tool for professional and educational environments.


5 slides
Risk Coverage and Claims Process Presentation
Visualize your risk levels and claims procedures with this Risk Coverage and Claims Process slide. The thermometer-style graphic clearly represents stages of coverage or escalation. Ideal for insurance, compliance, or legal teams. Fully editable and compatible with PowerPoint, Keynote, and Google Slides to match your branding and workflow needs.


4 slides
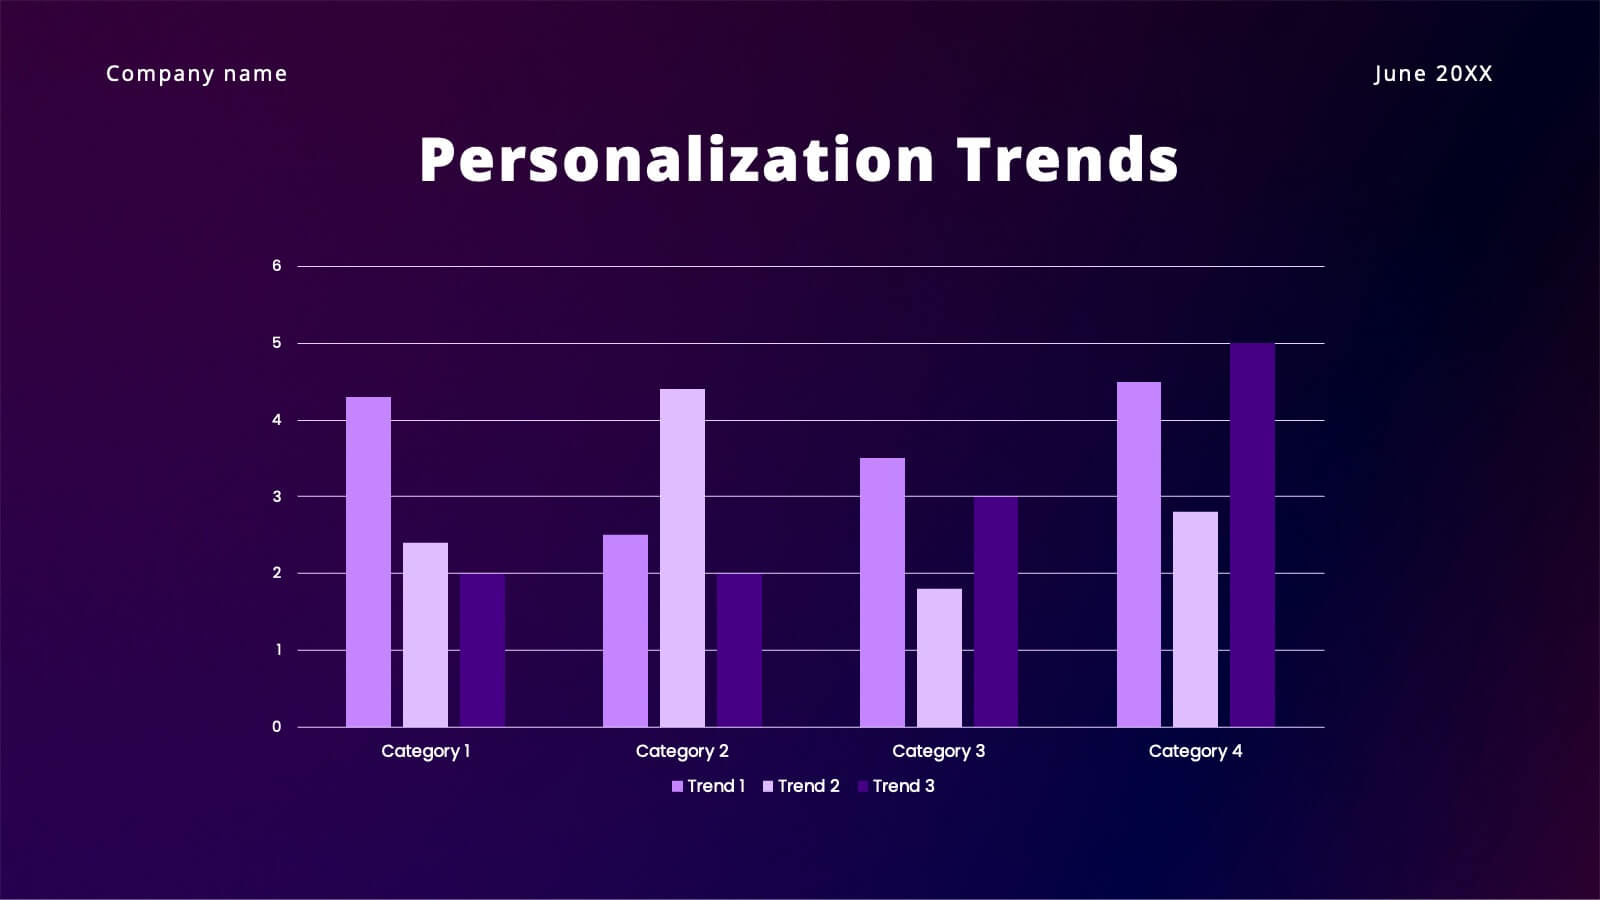
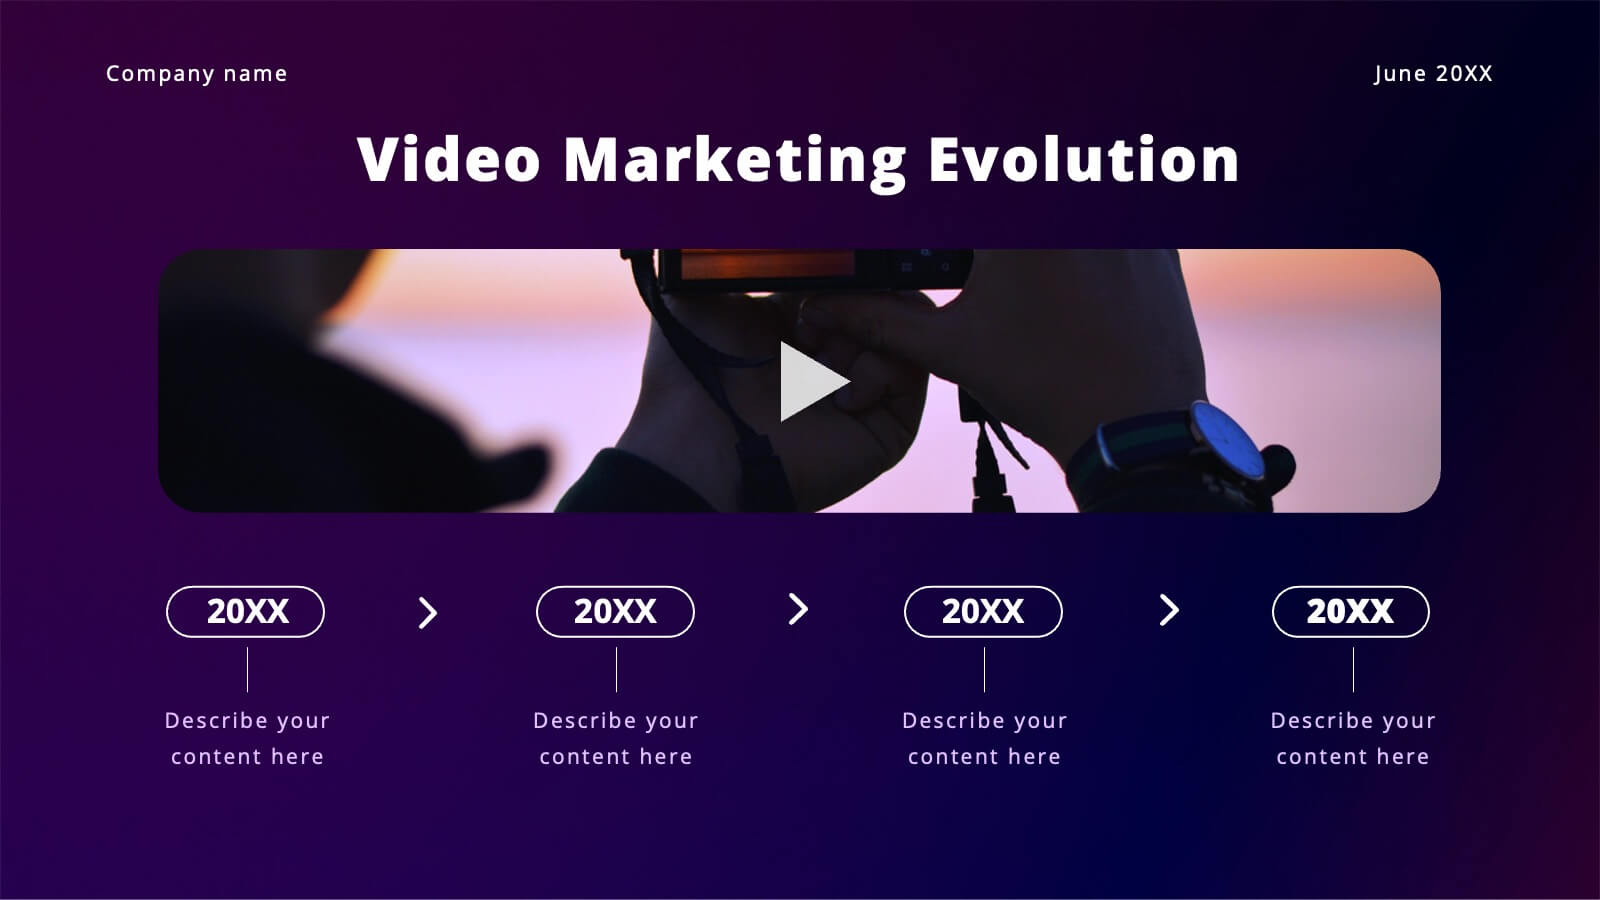
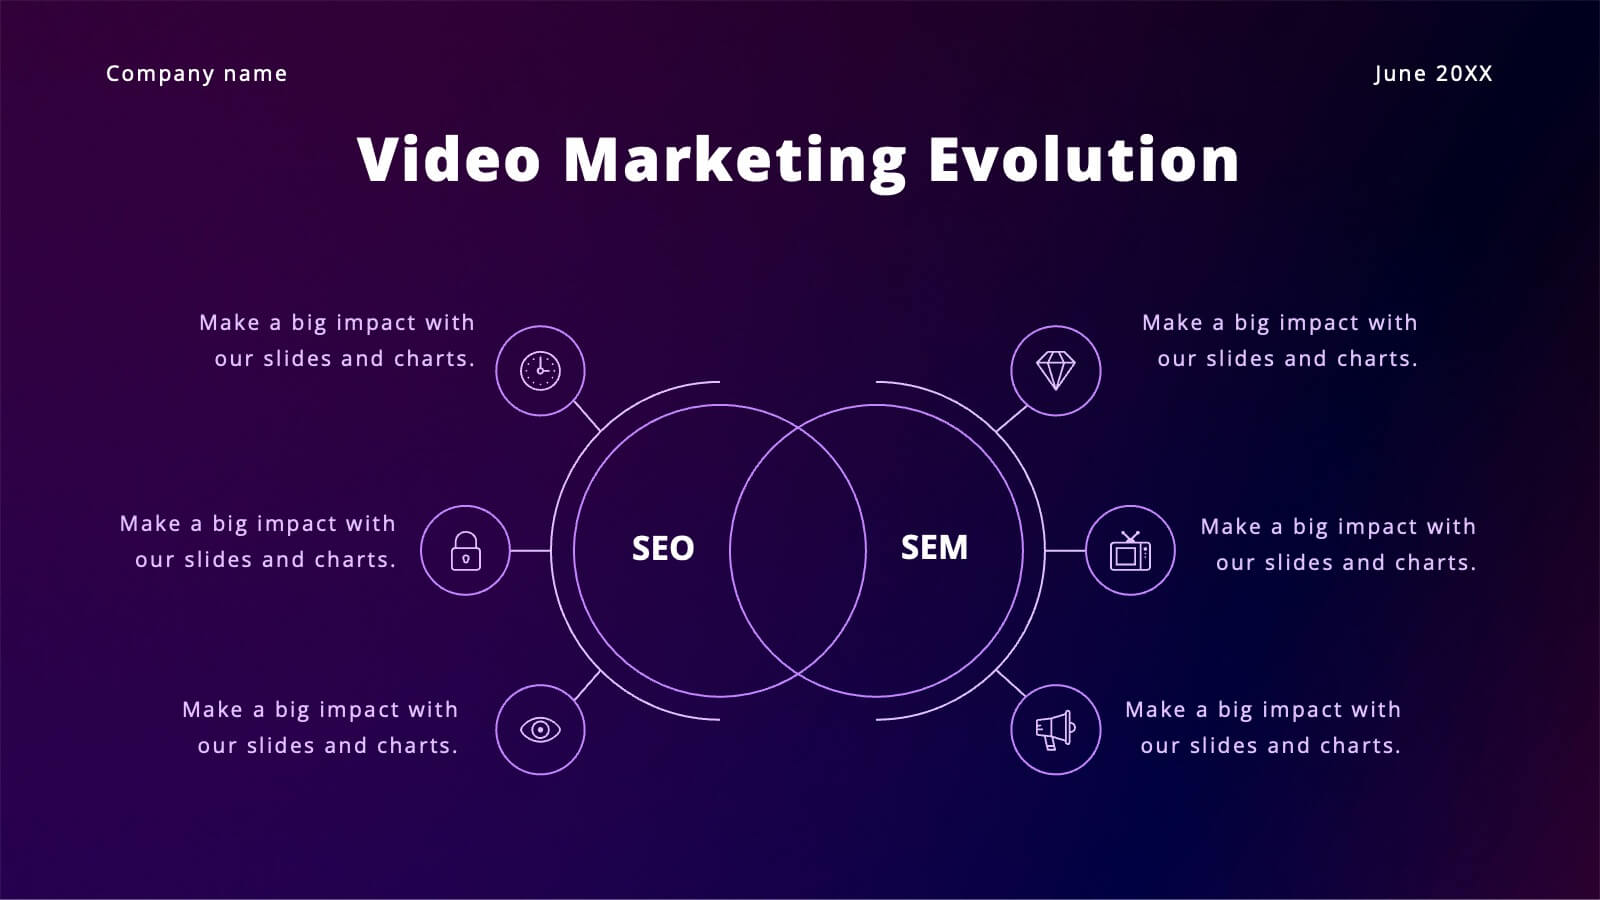
Social Media and Online Marketing Trends
Showcase emerging strategies with this mobile-inspired layout perfect for social media and online marketing updates. The clean design highlights trends like SEO, influencer marketing, and content innovation with clarity. Fully customizable and compatible with PowerPoint, Keynote, and Google Slides.


8 slides
Business Revenue and Profit Analysis Presentation
Analyze and visualize Business Revenue and Profit trends effectively with this modern and data-driven slide template. Featuring a dual-chart layout with reseller performance trends and purchase breakdowns, this slide is ideal for financial reports, sales presentations, and strategic business meetings. Fully customizable, you can edit the text, colors, and data to fit your specific needs. Compatible with PowerPoint, Keynote, and Google Slides for easy editing and seamless integration.


10 slides
Key Information Recap Summary
Conclude your presentation with clarity using this Key Information Recap Summary slide. Featuring a modern key-shaped design with four customizable sections, it’s perfect for summarizing essential insights. Fully compatible with PowerPoint, Keynote, and Google Slides.


2 slides
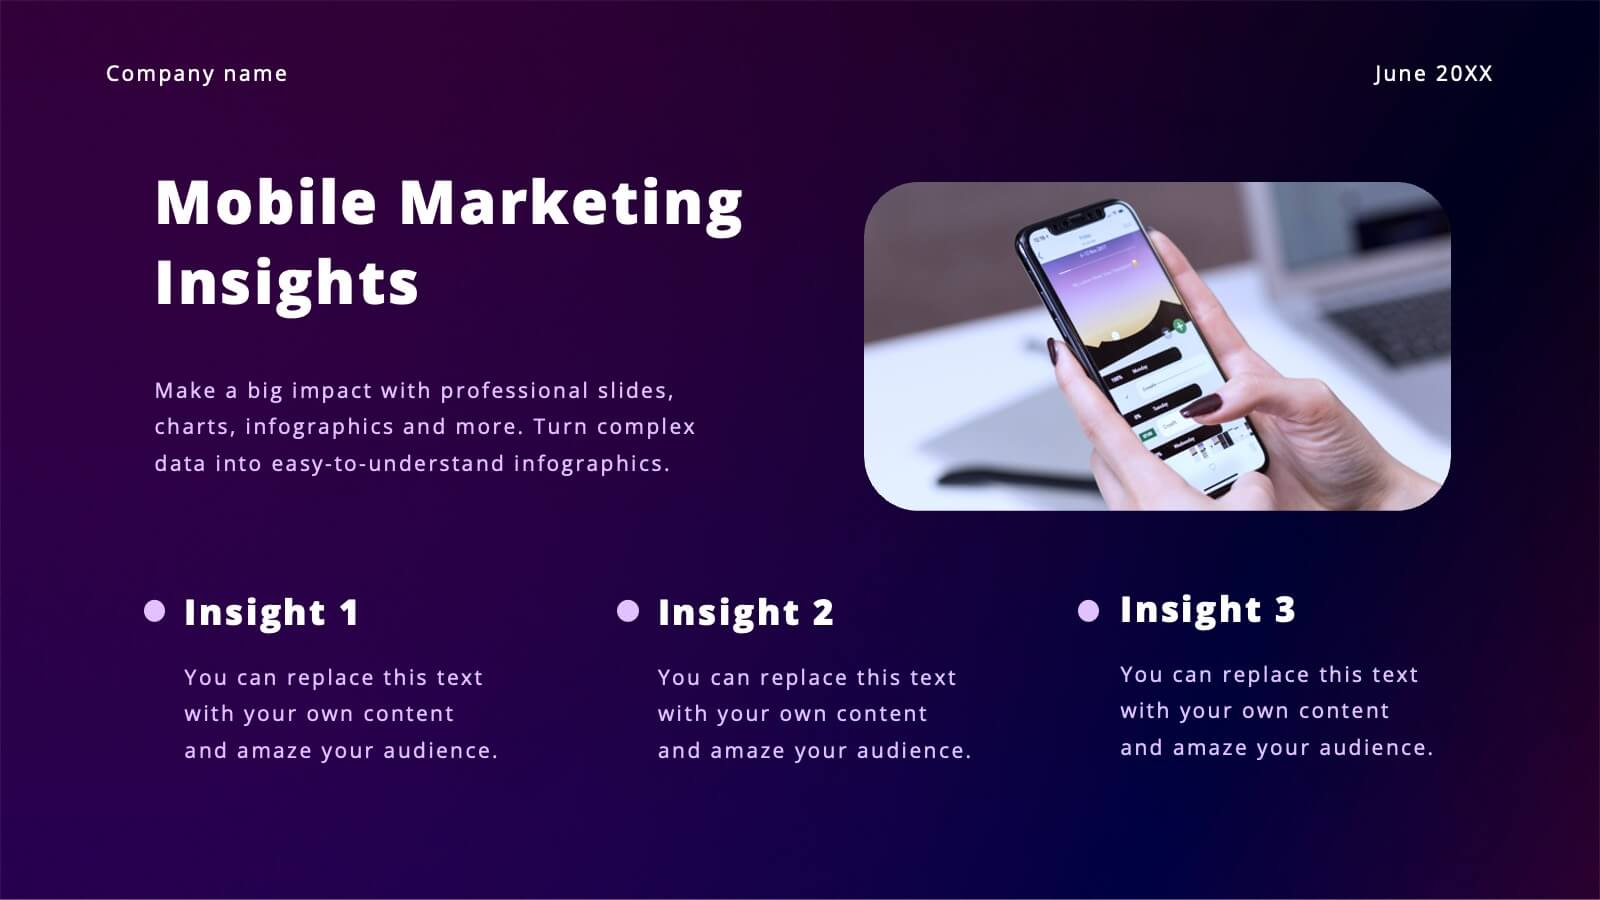
App Interface Device Preview Presentation
Display your mobile app design with this sleek interface preview layout. Centered around a realistic smartphone mockup, this template includes four surrounding sections for text or key features. Ideal for pitch decks or product demos, it's fully editable in PowerPoint, Keynote, or Google Slides to match your brand.


22 slides
Dakota Corporate Strategy Agenda Presentation
Maximize your strategic sessions with this dynamic corporate strategy agenda presentation template. This template is designed to streamline your business discussions, featuring sections for everything from speaker introductions to session overviews and networking breaks. It’s ideal for conferences, workshops, or any corporate gatherings where a clear, structured schedule is essential. Compatible with major platforms like PowerPoint, Google Slides, and Keynote, it ensures you can organize and execute your agenda efficiently, fostering effective communication and collaboration across your team.


26 slides
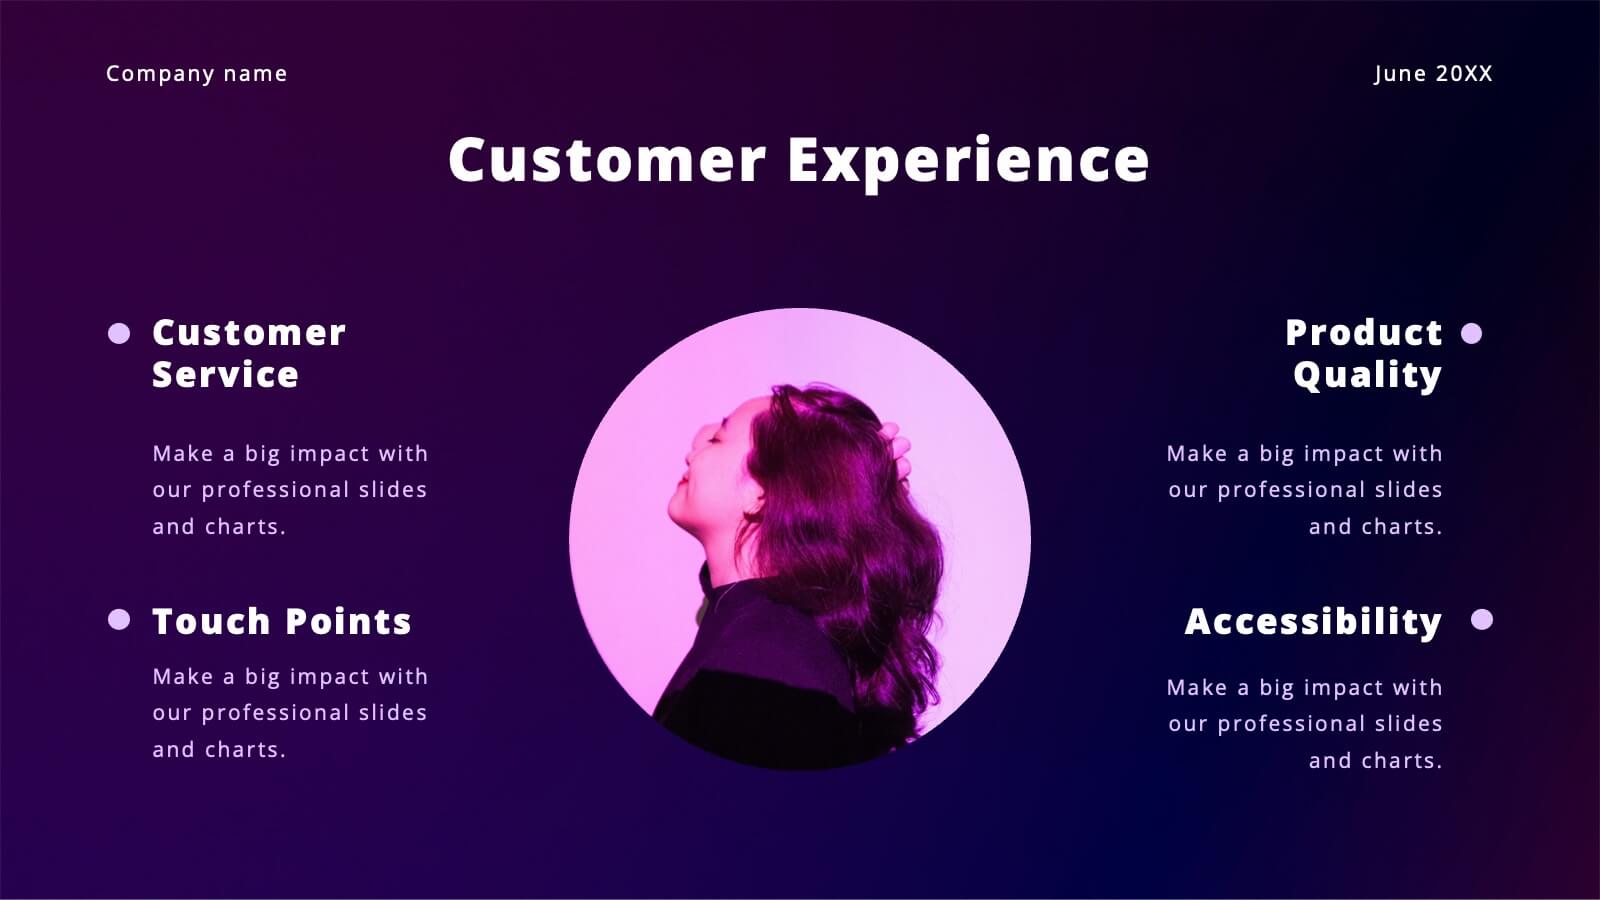
Customer Service Bold Presentation
Step into a world where every interaction is more than a service; it's an experience, artfully portrayed in a dynamic series highlighting the essence of customer relations. This vibrant presentation is a bold statement in customer service excellence, where each slide is a burst of sunshine in hues of optimism, communicating the core principles of attentiveness and care. The visuals are a striking blend of modern design and functional aesthetics, spotlighting the human touch that underlies the digital interactions of today's customer-centric landscapes. From the empathetic smiles of service agents to the infographic elucidation of response strategies, the narrative captures the spirit of connection between brand and consumer. It's a testament to the seamless melding of efficiency and warmth, showcasing the art of turning every customer journey into a tale of satisfaction and loyalty. This is the celebration of customer service—not just as a duty, but as a craft, where every detail contributes to a masterpiece of memorable experiences.


5 slides
Construction Processes Infographics
Dive into the construction industry with this detailed infographic template that provides a comprehensive overview of construction processes, careers, and competitive strategies. Ideal for professionals, educators, and students involved in construction, this resource offers a clear and structured presentation of various aspects of the field. The infographic is divided into sections detailing key areas such as industry sectors, job roles, and strategic approaches for sustainable competitiveness. It highlights important segments like planning, finance, legal aspects, and on-site construction activities, all designed to give a well-rounded view of the construction process. Additionally, it includes data on job growth, employment statistics, and future projections, which are crucial for understanding labor market trends within the construction sector. Vibrant colors and easy-to-understand layouts make this template not only informative but also visually appealing. Whether used in training sessions, academic courses, or professional presentations, this infographic is a valuable tool for conveying the dynamic and multifaceted nature of the construction industry.


8 slides
SWOT-Based Competitive Analysis
Clearly map your organization’s strengths, weaknesses, opportunities, and threats with this dynamic infographic layout. Ideal for strategic planning sessions, this template uses a continuous loop to show interconnection between internal and external factors. Fully editable in PowerPoint, Keynote, and Google Slides.


5 slides
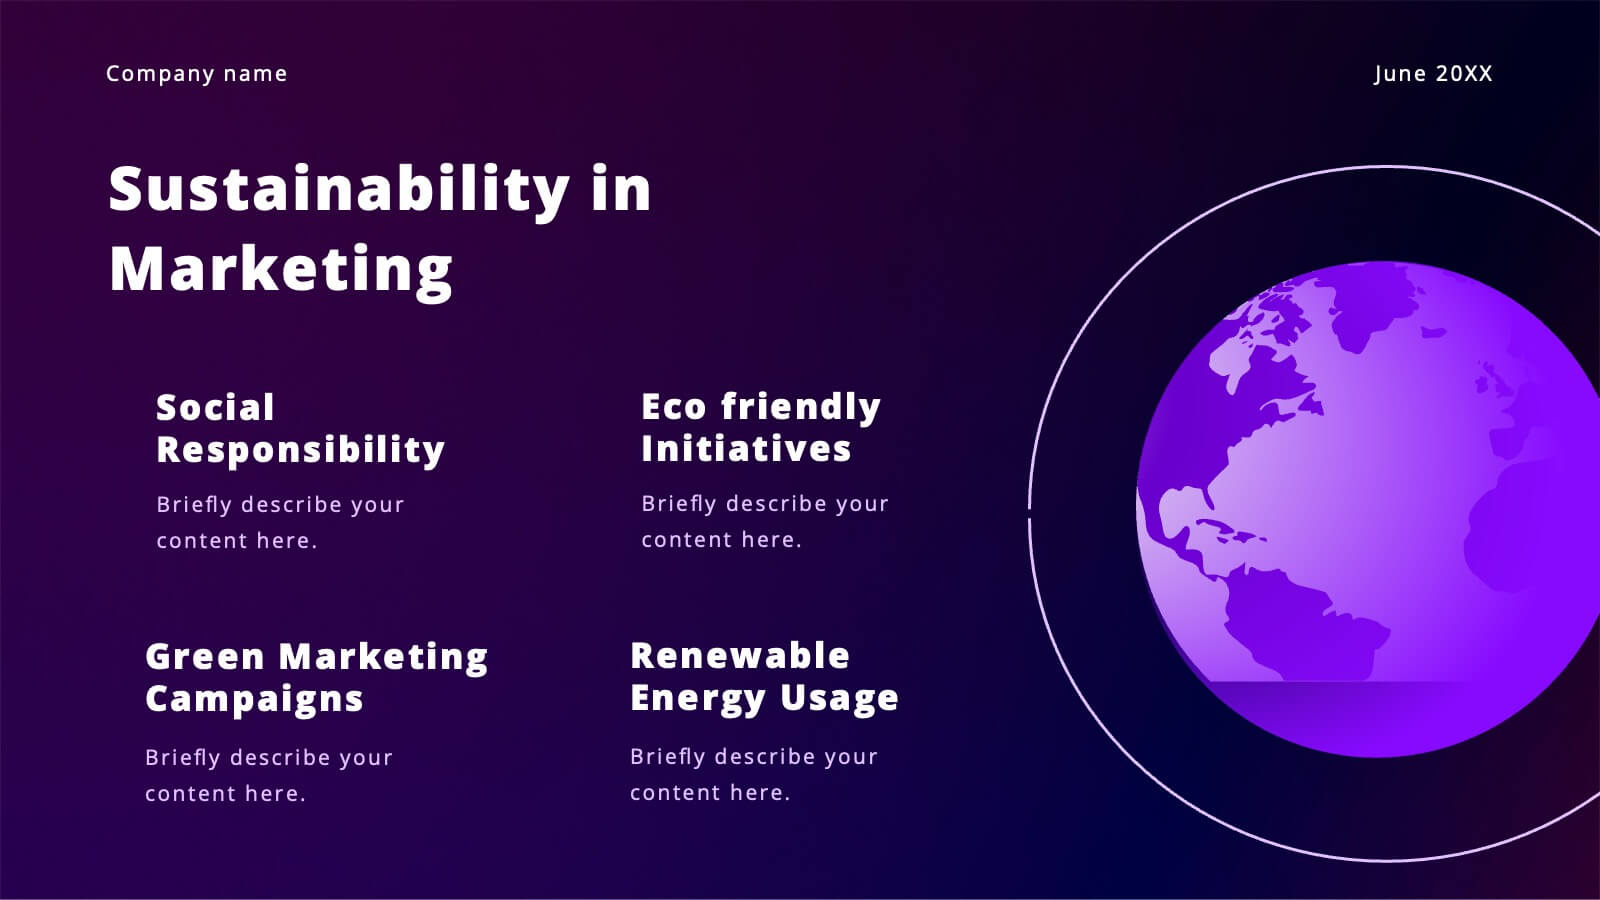
Core to Outer Ring Concentric Planning Presentation
Present your strategy from the inside out with the Core to Outer Ring Concentric Planning Presentation. This layered, radial design guides viewers through a central concept outward into supporting elements—ideal for planning, process modeling, or decision frameworks. Fully customizable in PowerPoint, Keynote, and Google Slides.


6 slides
Project Timeline Calendar Presentation
Kick your planning into high gear with a clean, colorful layout that makes tracking progress feel effortless. This presentation helps you map tasks across the week, visualize timelines, and communicate project schedules with absolute clarity. It’s fully editable and works seamlessly in PowerPoint, Keynote, and Google Slides.


7 slides
Brain Infographic Presentation Template
Brain infographics can be used to communicate your business ideas in a unique way. The images provide a visual explanation of the project breakdown and how every step is important for a successful project execution. This brain infographic template is the perfect visual to show off your critical thinking skills, with a clear focus on planning and execution. Use this infographics template to illustrate the planning of your project, its control and monitoring, as well as its targets and execution. This template is a fun way to shed light on how our brains react to visuals in content.


6 slides
Customer Value Proposition Framework Presentation
Clarify your business offering with the Customer Value Proposition Framework Presentation. This template is designed to help you align your products or services with customer needs through a side-by-side visual of the Value Proposition Canvas. Highlight pain points, customer gains, and how your solution uniquely addresses them. Fully customizable in PowerPoint, Keynote, and Google Slides. Perfect for marketers, product managers, and strategic planning teams.


6 slides
Organizational Change Management Strategy Presentation
Navigate organizational change effectively with this dynamic and structured presentation slide. Featuring a puzzle-piece design, this template visually represents the interconnected steps of change management. Ideal for business leaders, HR professionals, and consultants, it helps illustrate transition processes, strategic adjustments, and team alignment. Fully editable, allowing you to customize text, colors, and layout to fit your business needs. Compatible with PowerPoint, Keynote, and Google Slides for effortless use.

20 slides
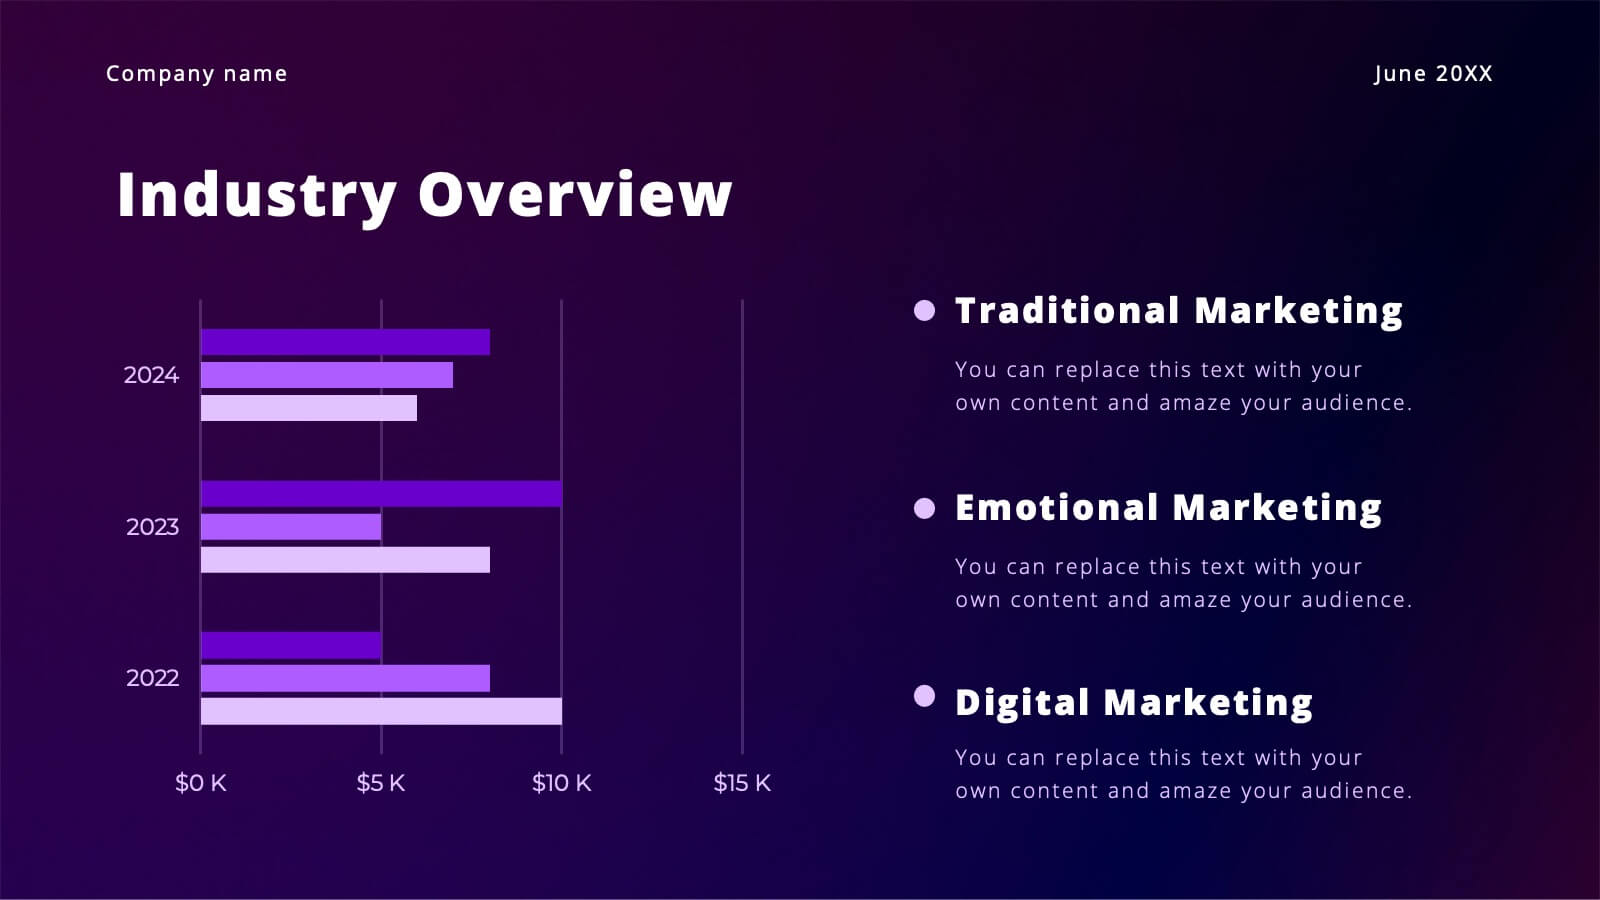
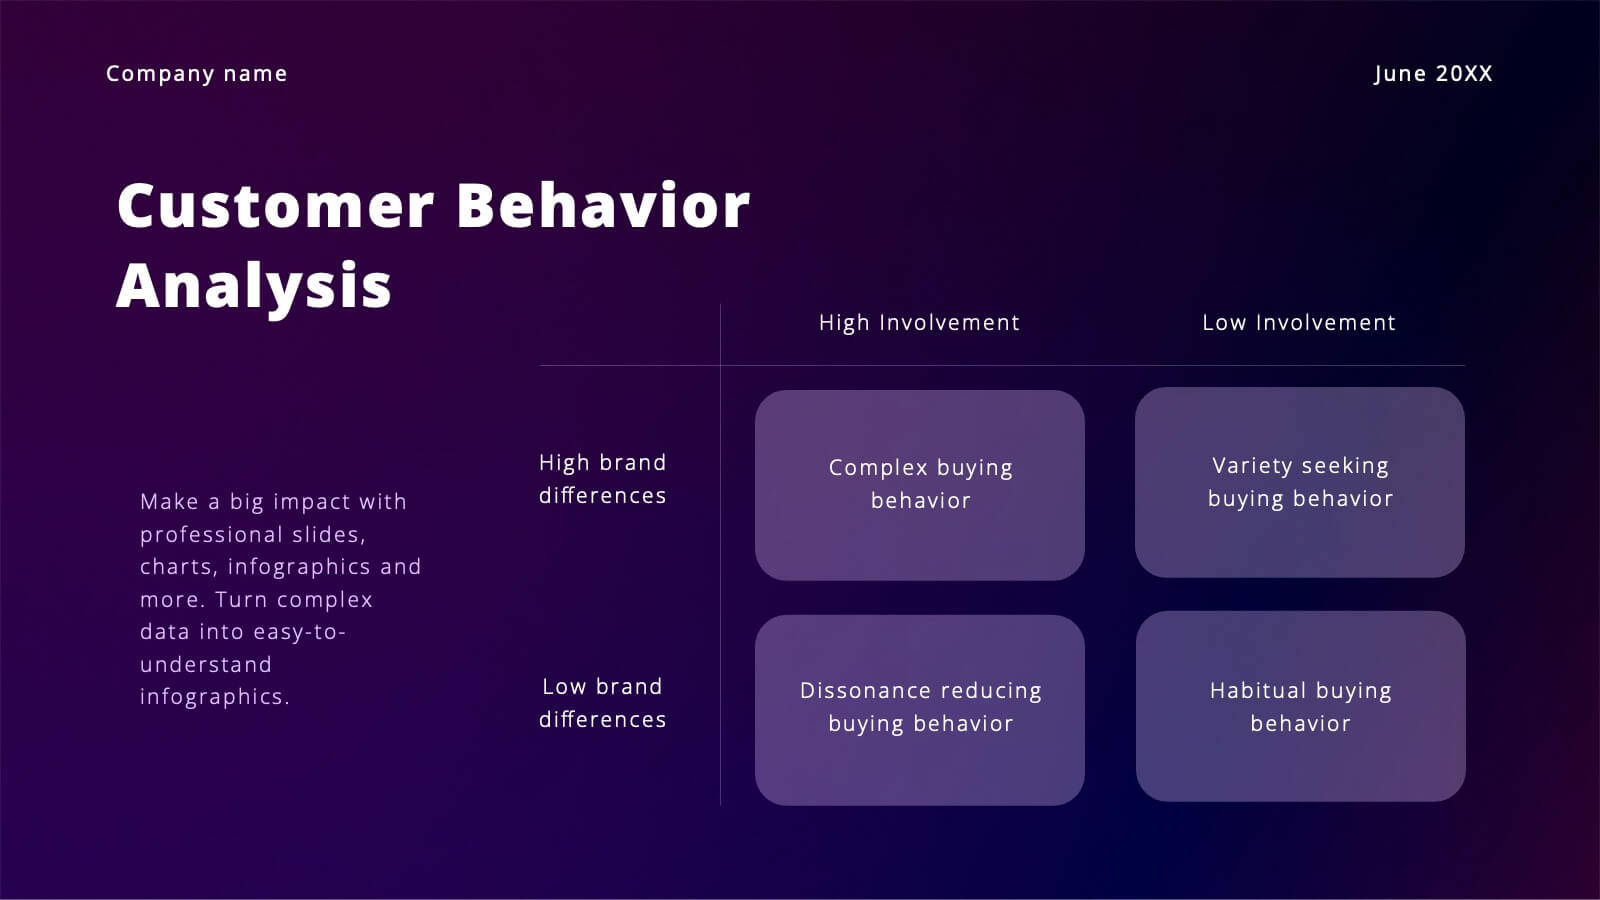
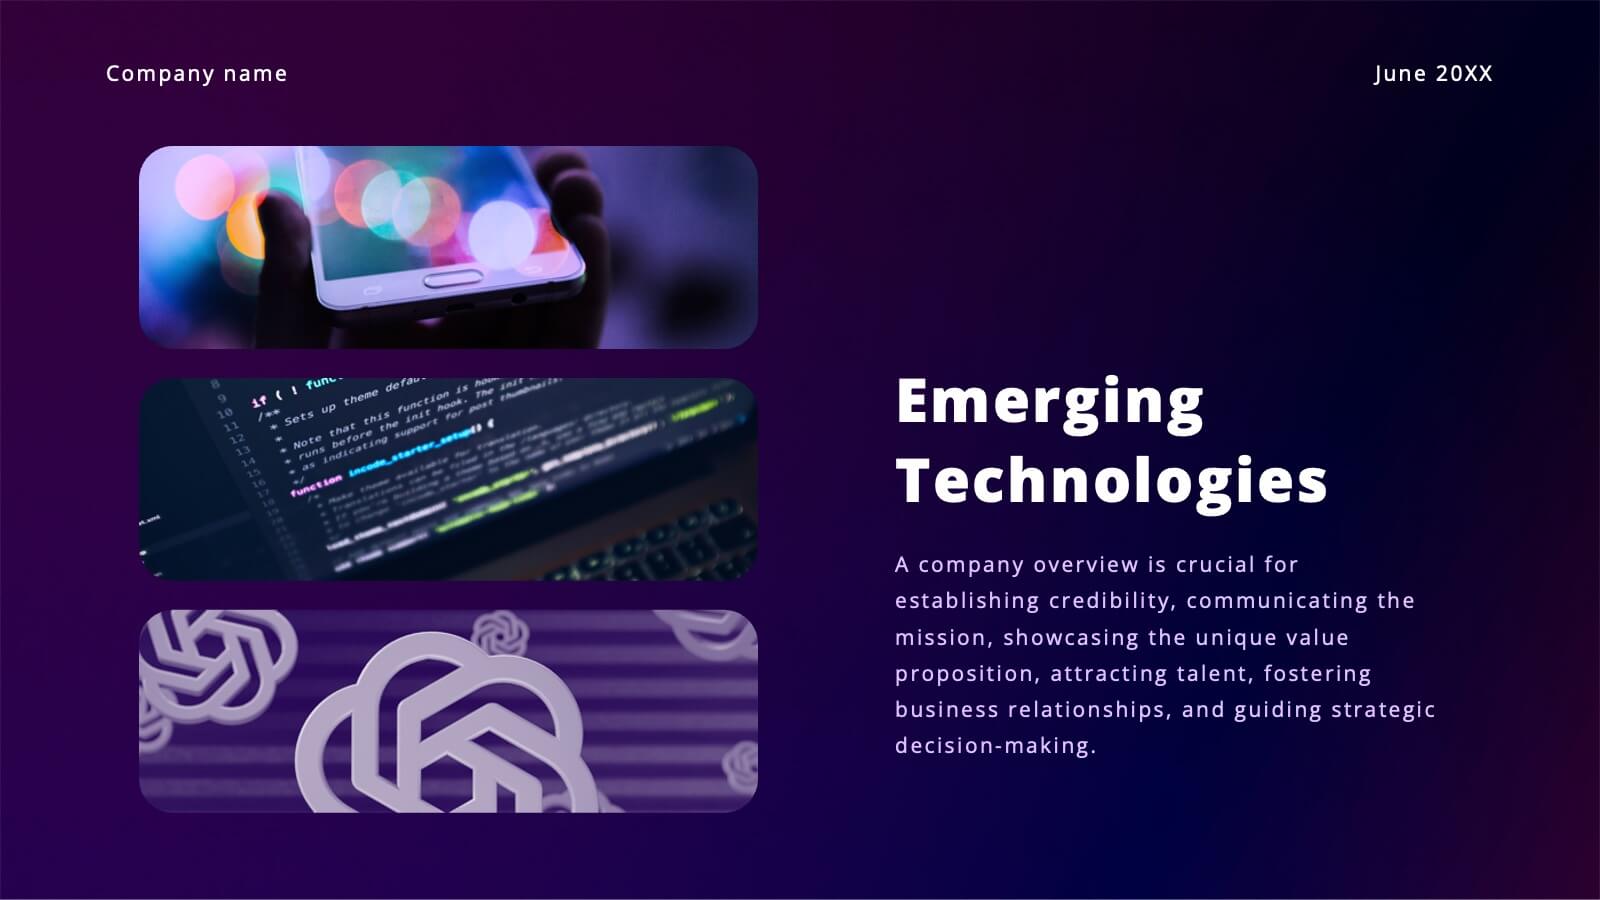
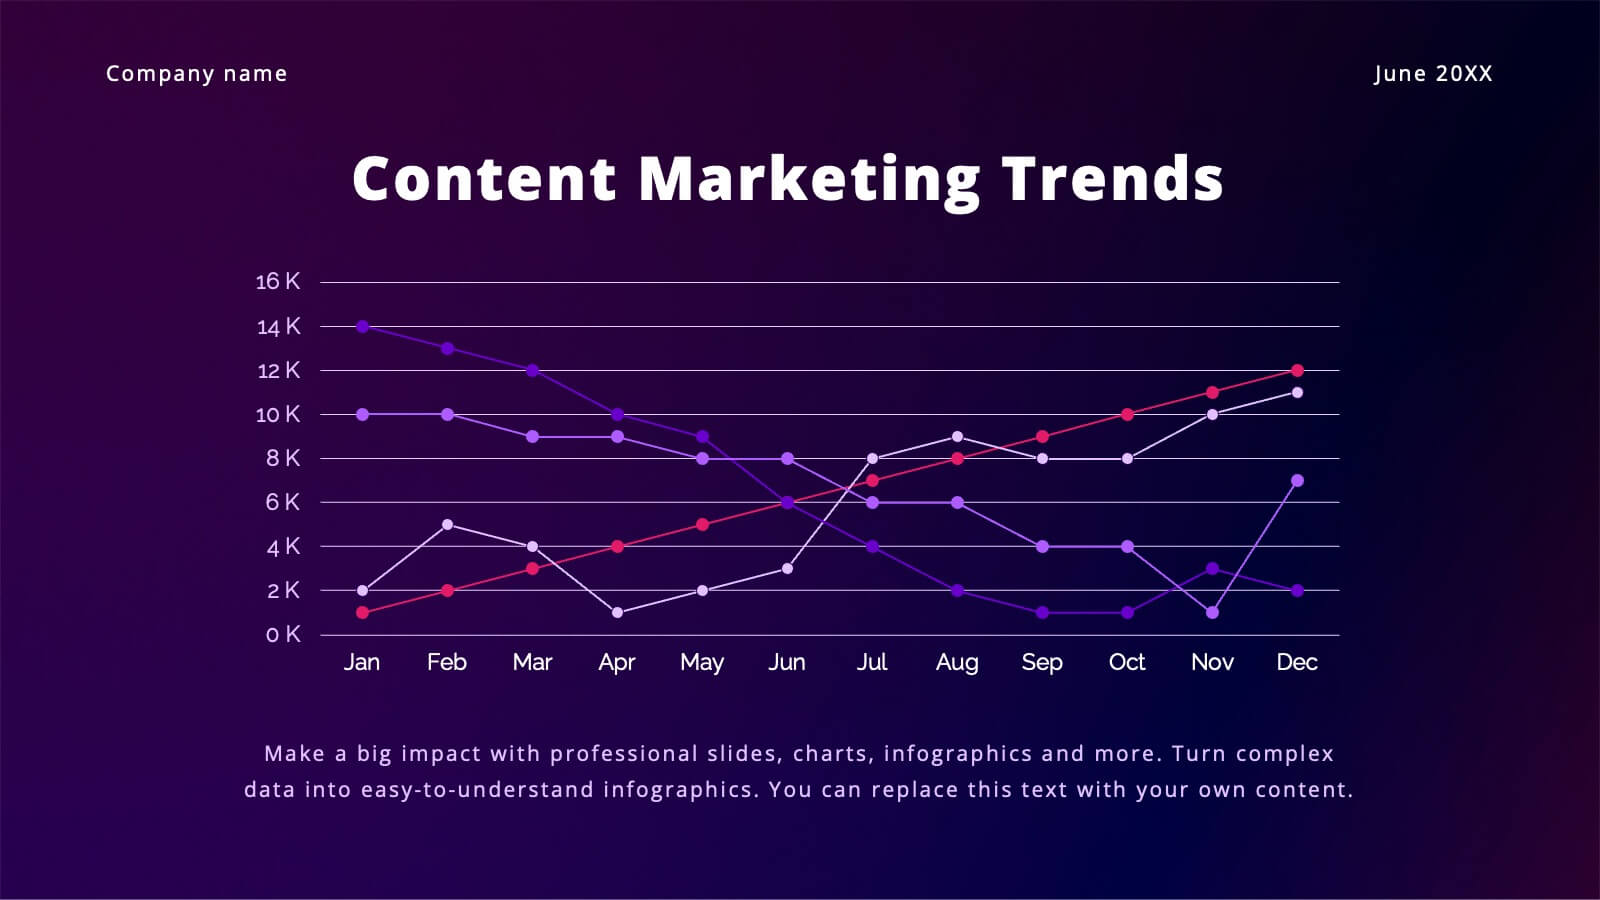
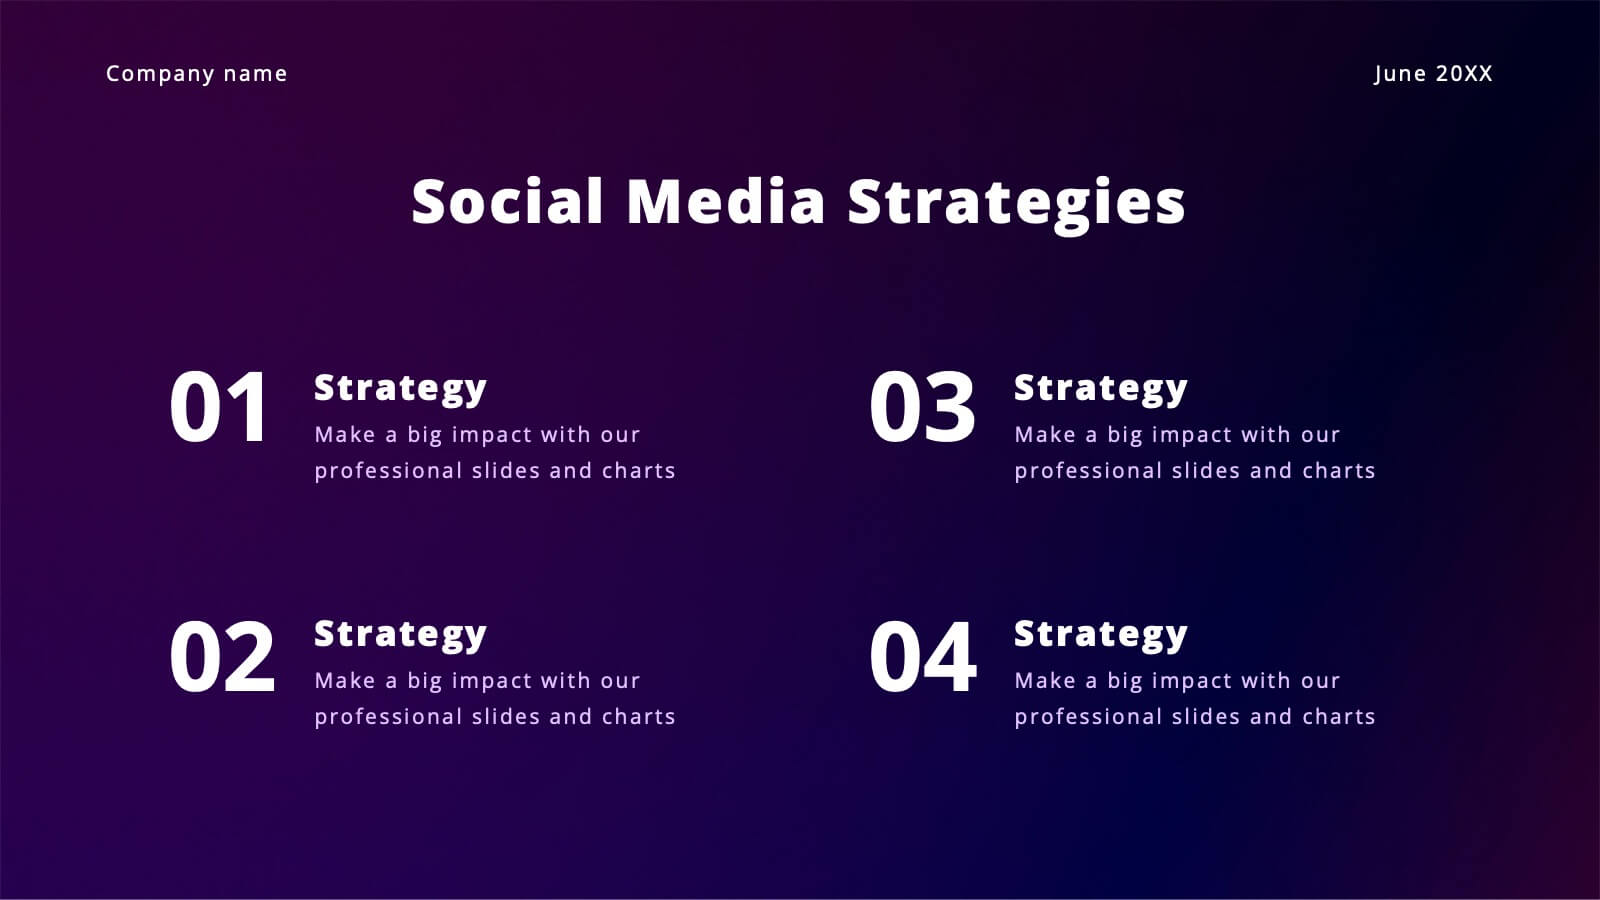
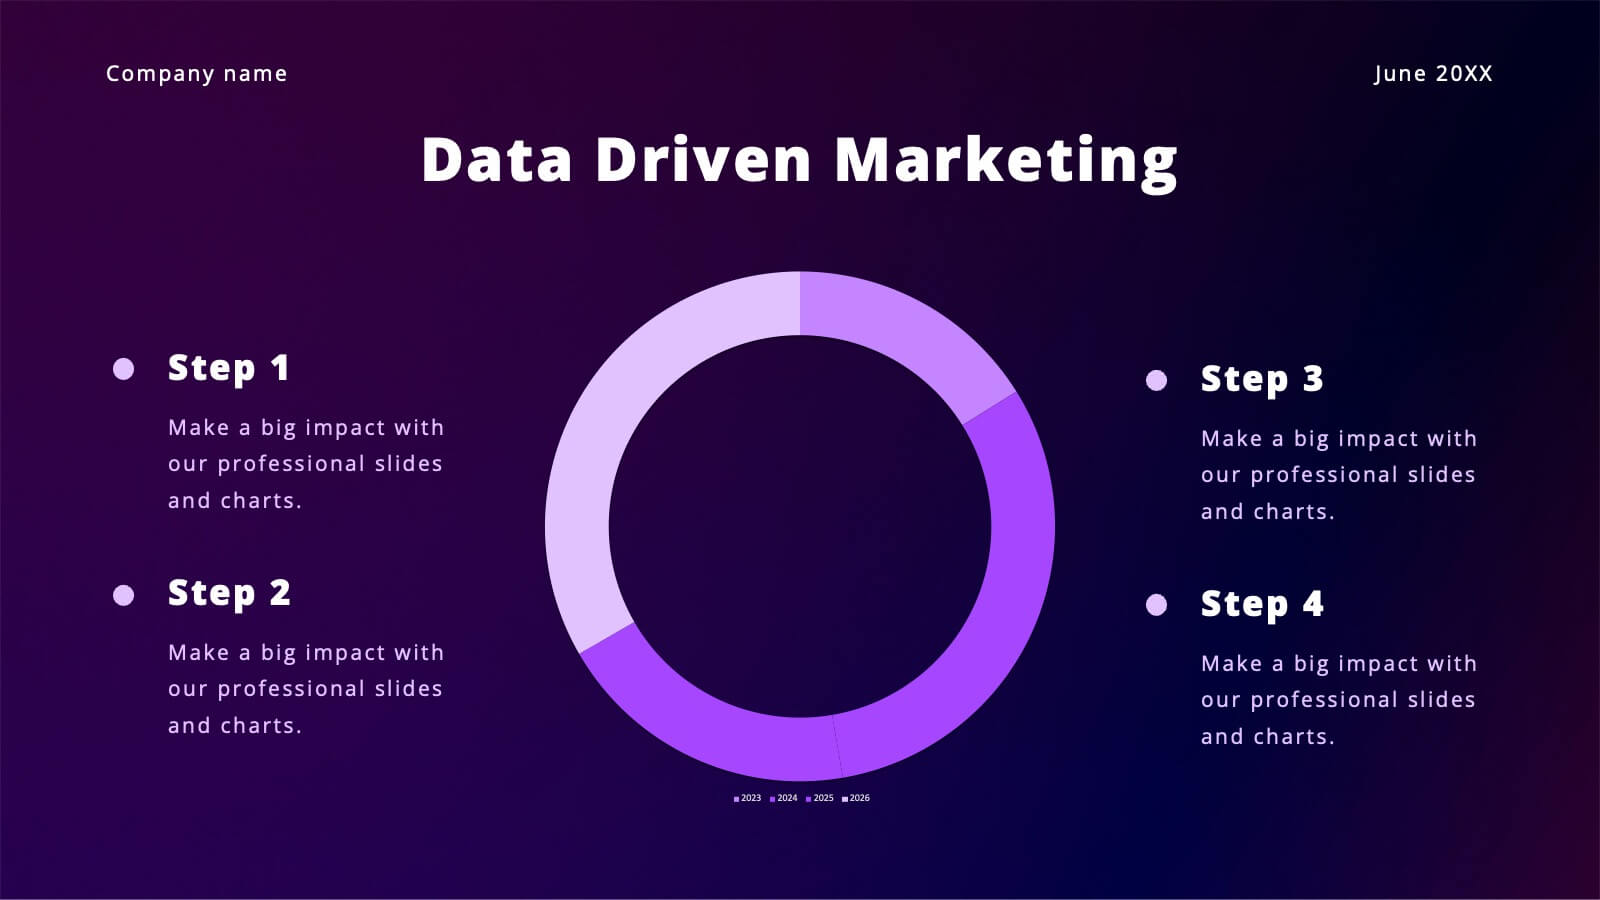
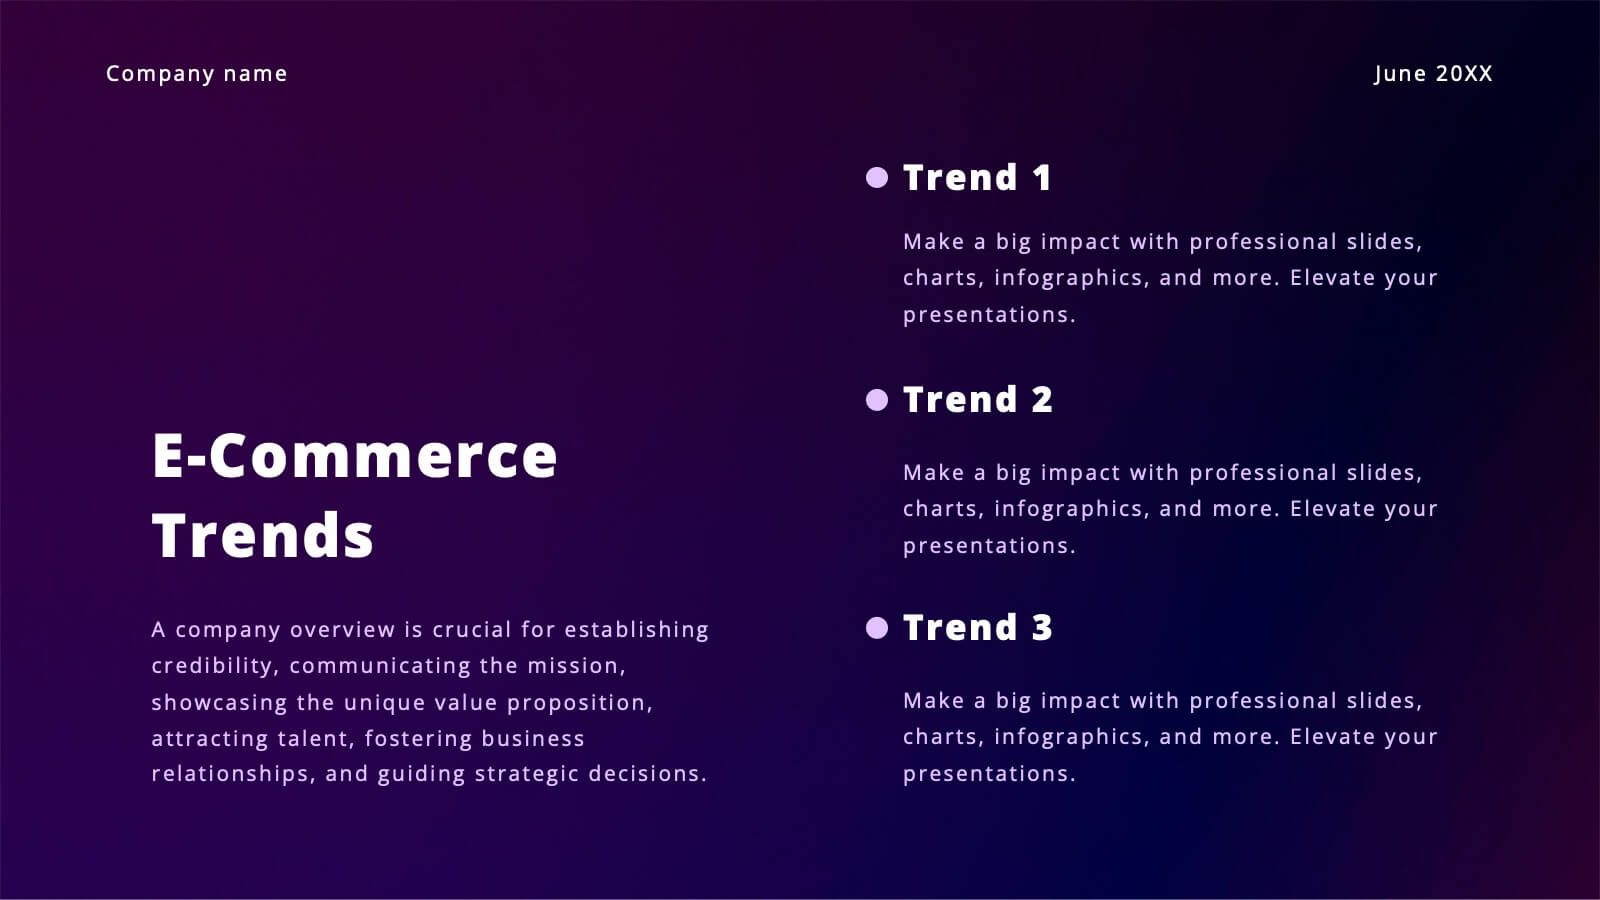
Vibrant Content Marketing Pitch Deck Presentation
Boost your marketing pitch with this vibrant deck! Covering industry overviews, customer behavior analysis, and emerging technologies, it’s designed to captivate your audience. Highlight social media strategies, data-driven marketing, and e-commerce trends effortlessly. Perfect for presenting a comprehensive marketing plan. Compatible with PowerPoint, Keynote, and Google Slides. Make your next pitch stand out!


3 slides
Linear Business Process Flow Presentation
Give your workflow a smooth, streamlined story with a layout that makes every step feel clear and intentional. This presentation outlines processes in a clean, linear format ideal for planning, operations, or strategy mapping. Fully compatible with PowerPoint, Keynote, and Google Slides.