


Features
- 3 Unique slides
- Fully editable and easy to edit in Microsoft Powerpoint, Keynote and Google Slides
- 16:9 widescreen layout
- Clean and professional designs
- Export to JPG, PDF or send by email


Do you have any questions?
Recommend


8 slides
Credit Card Benefits and Features Presentation
The "Credit Card Benefits and Features" presentation template effectively outlines the various advantages and key features of credit cards. This template uses vibrant icons and a clear layout to differentiate each benefit, making it easier for audiences to understand the unique selling points of each card. The color-coded elements guide viewers through essential data points such as cash back, rewards programs, security features, and interest rates, making it ideal for financial seminars, customer education, or internal training. Each section is customizable, allowing for detailed descriptions and the addition of specific benefits tailored to different credit card offers.


7 slides
Strategic Alignment Using McKinsey 7S Presentation
Showcase organizational effectiveness with this Strategic Alignment Using McKinsey 7S Presentation. This diagram template visually maps all seven interconnected elements—Strategy, Structure, Systems, Shared Values, Skills, Style, and Staff—making it easy to communicate business alignment and transformation goals. Perfect for consultants, team leaders, and strategy professionals. Fully customizable in PowerPoint, Keynote, and Google Slides.


5 slides
Regional Overview North America Map Presentation
Bring your data to life with a vibrant visual layout that breaks down key insights across different North American regions. This professional design helps you compare performance, track growth, or present market summaries clearly and effectively. Fully compatible with PowerPoint, Keynote, and Google Slides for easy customization and use.


25 slides
Keystone Market Research Presentation
Present your market research with confidence using this stylish, contemporary template. Perfect for detailing research objectives, data collection, and key findings, it features a sleek design with vibrant colors. Highlight critical aspects like market trends, results interpretation, and recommendations to captivate your audience. Compatible with PowerPoint, Keynote, and Google Slides, it ensures seamless presentations on any platform.


6 slides
Big Data Technology Infographic
Big Data technology refers to the tools, techniques, and frameworks used to capture, store, process, analyze, and visualize large and complex datasets that are beyond the capabilities of traditional data processing systems. This infographic template is perfect for organizations that deal with massive volumes of data from various sources, including social media, sensors, machines, and more. This template enables businesses to gain valuable insights, make informed decisions, and create new opportunities. This infographic can be used for various industries, including e-commerce, healthcare, finance, manufacturing, and more.


26 slides
Kimbr Presentation Template
Kimbr is a modern and simple Powerpoint template that uses bold text in order to immediately catch your audience’s attention and let them focus on your innovative ideas. Combined with the modern and minimalistic style of Kimbr, this presentation packs a punch in the minimalism department: It comes with unique and modern slides perfect for Spa businesses or anyone looking for a clean minimal presentation. In addition, it has Charts, timelines and image placeholders, you'll be sure to find a space for all your information. Don't wait any longer and get started presenting your ideas today.


20 slides
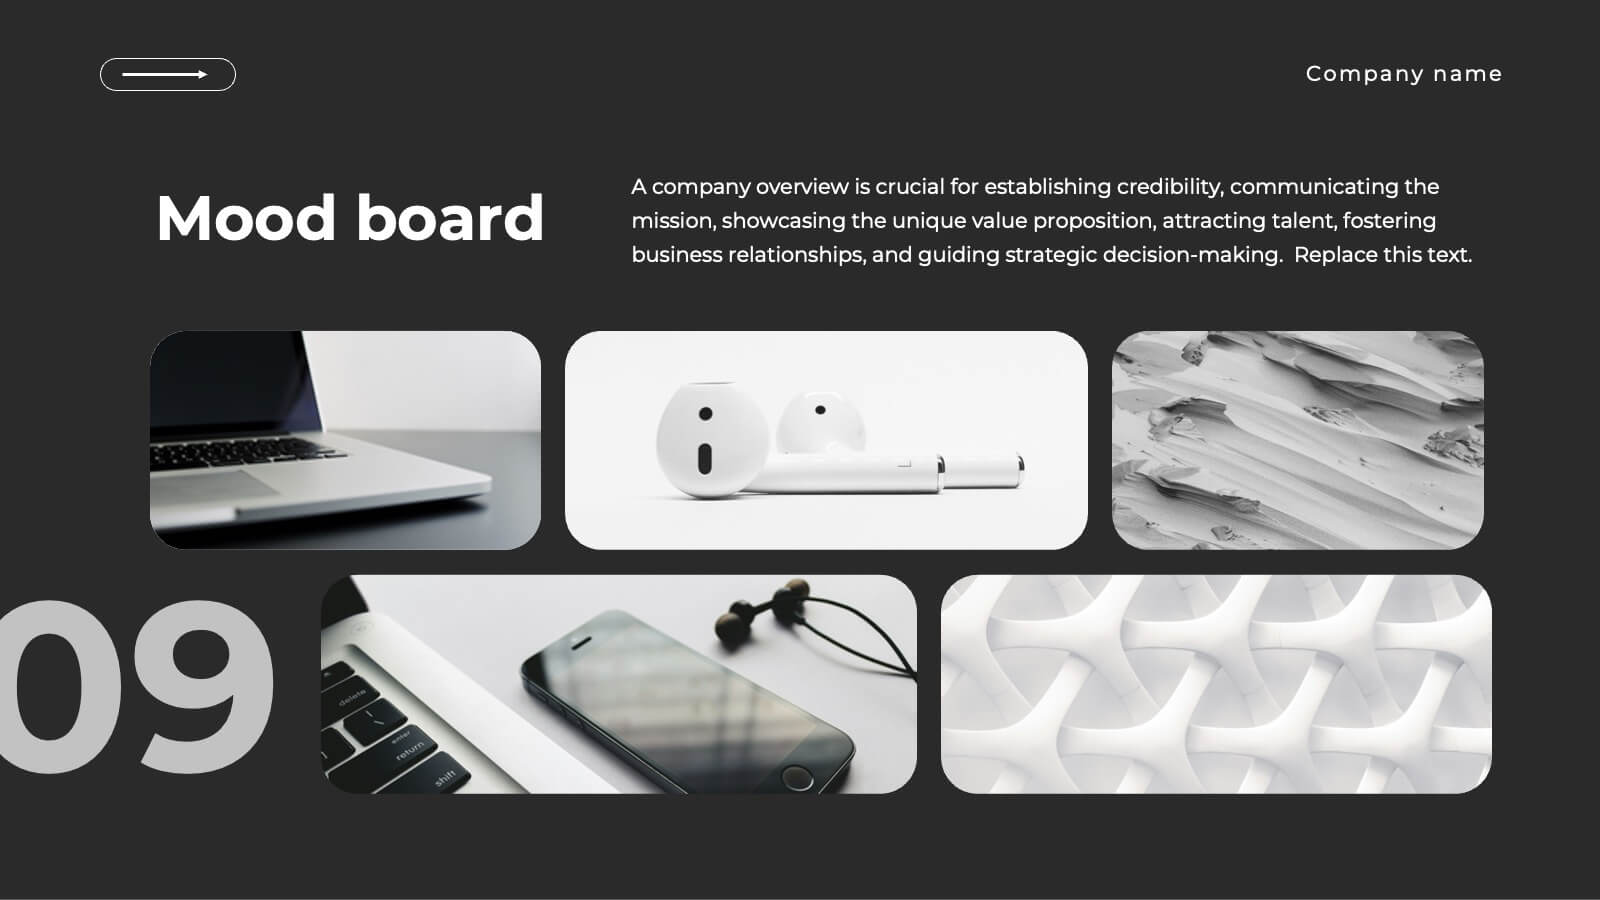
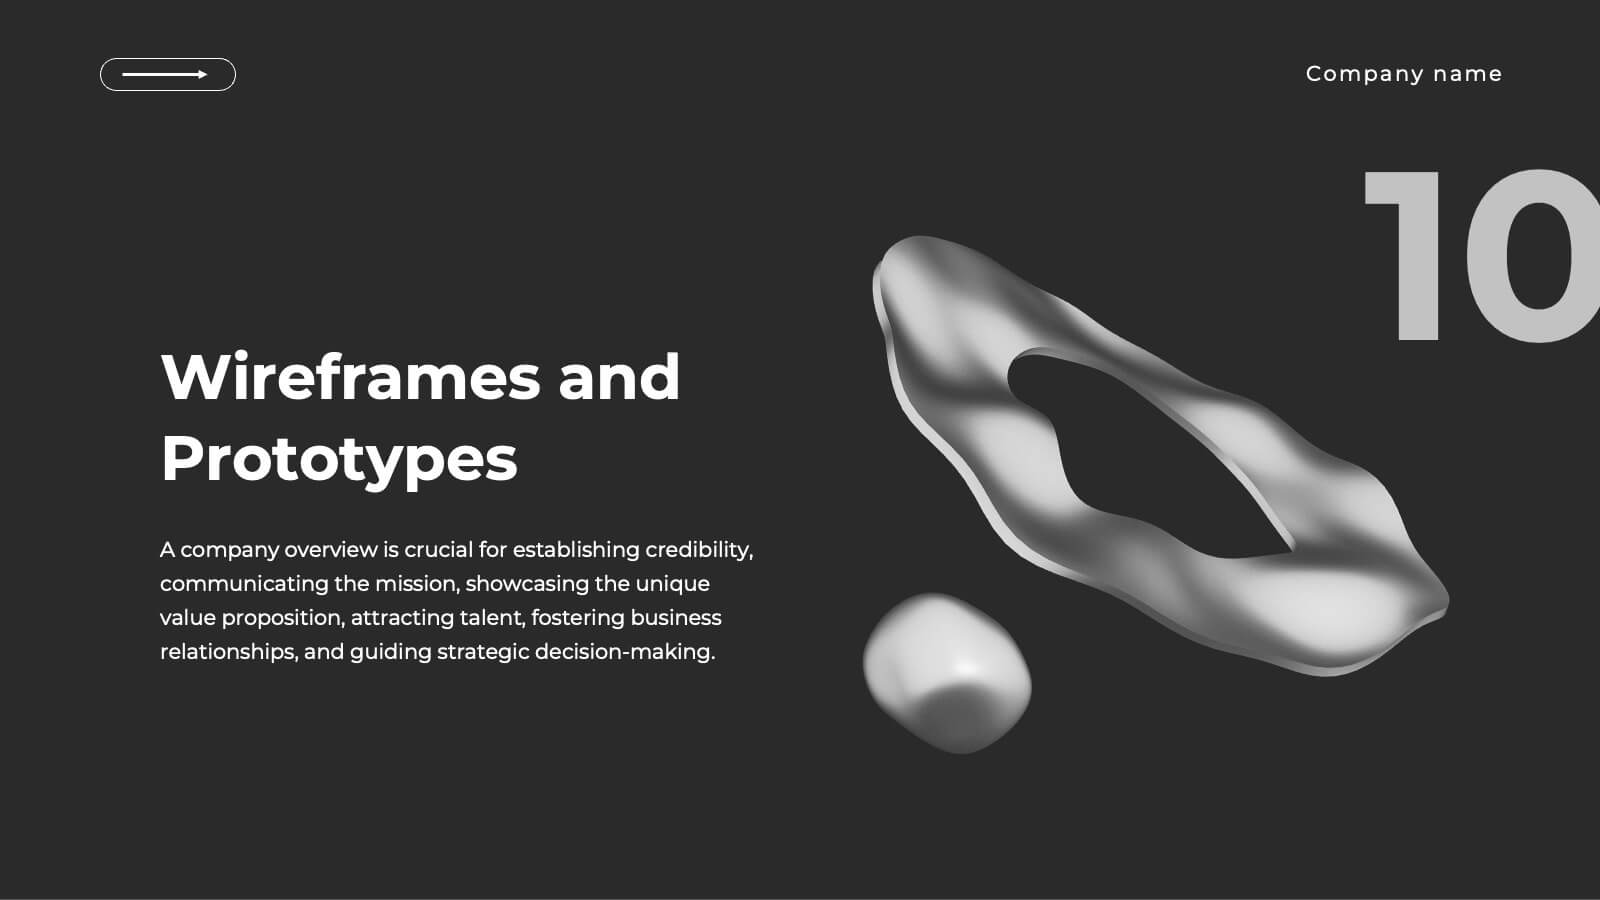
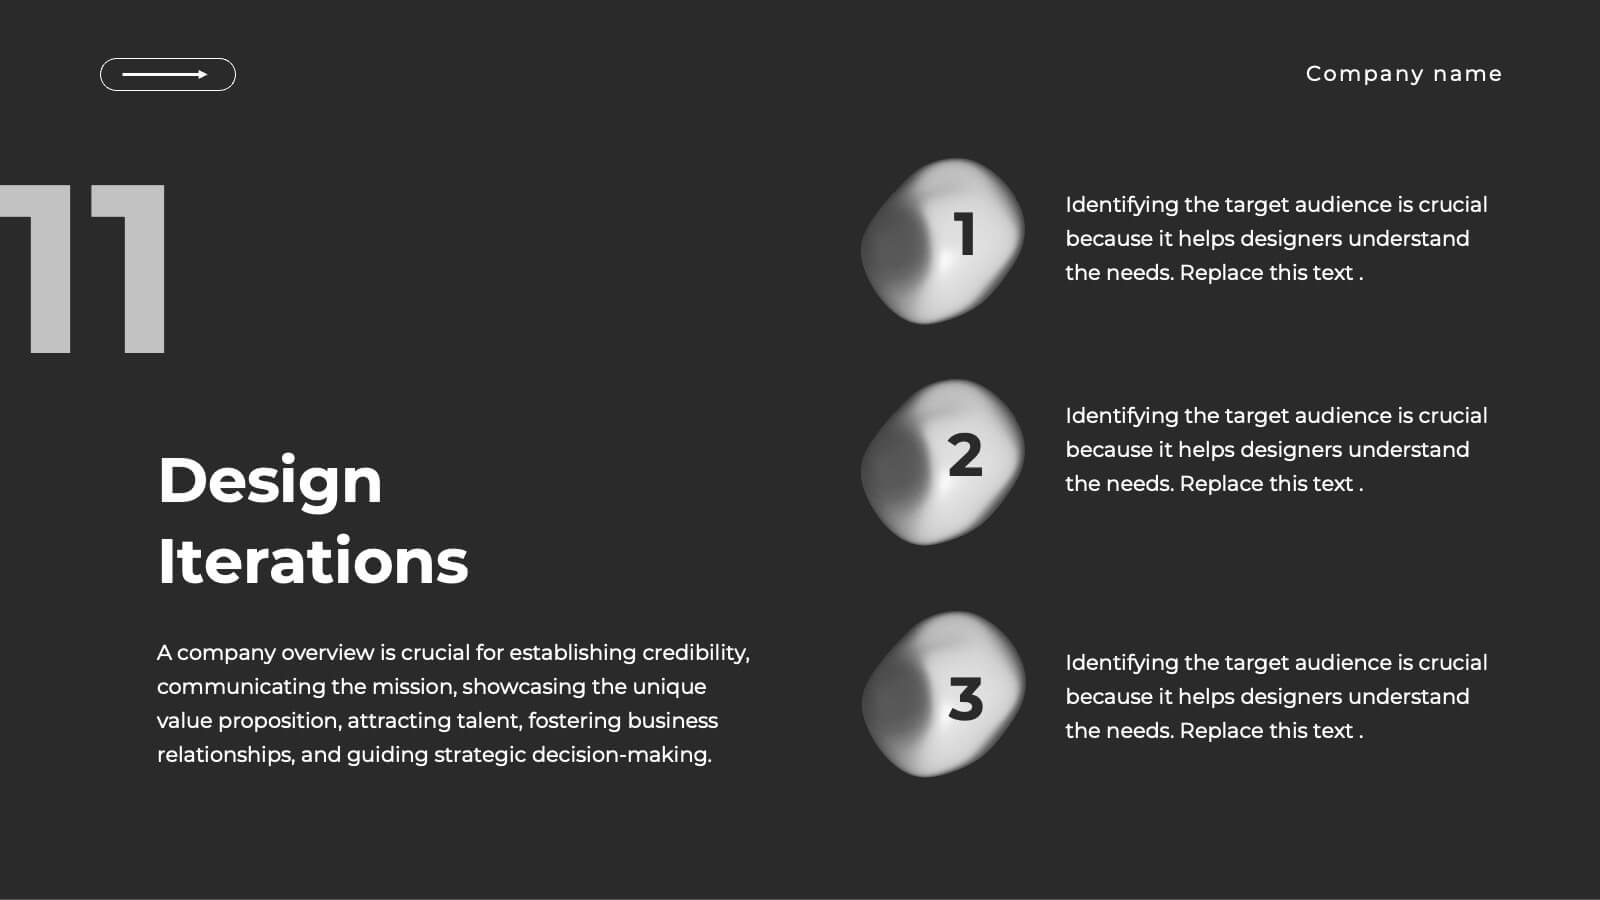
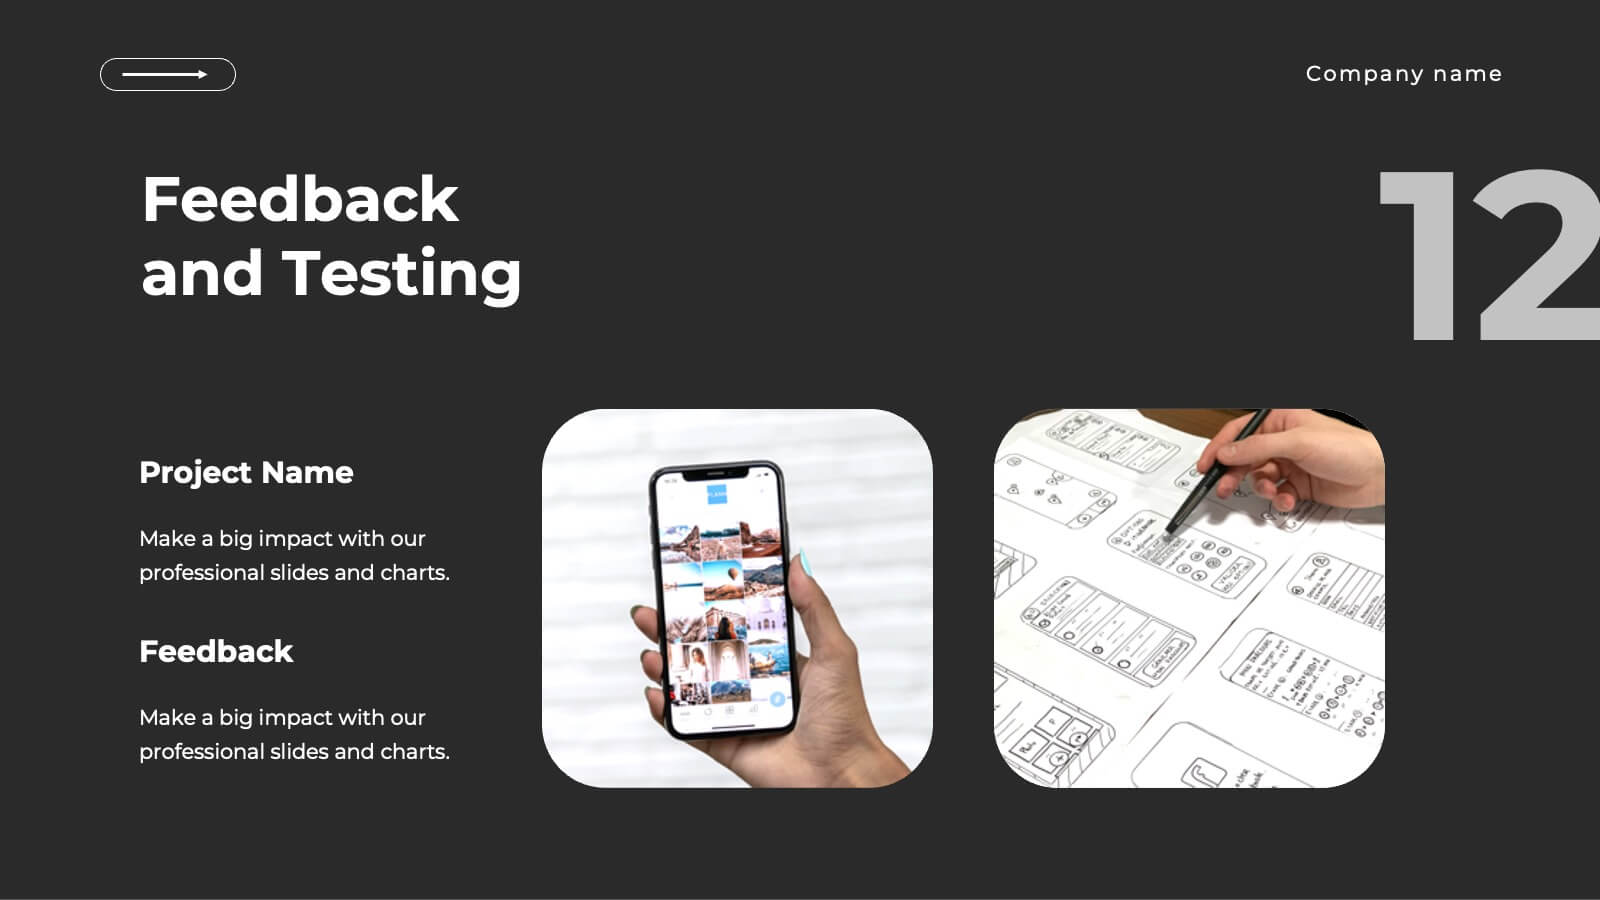
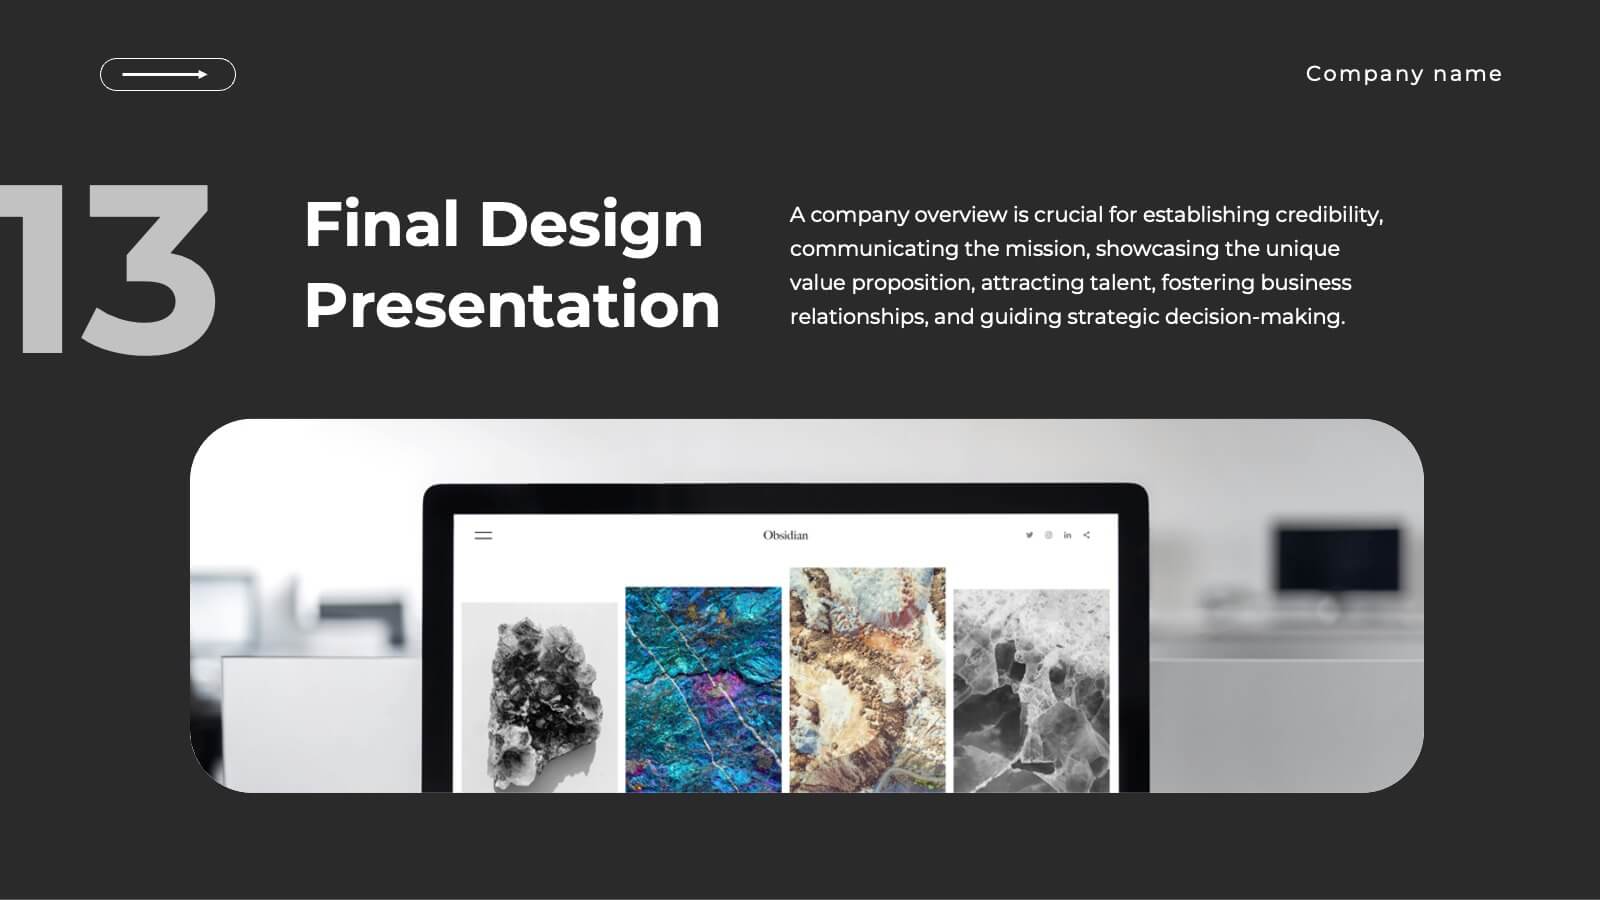
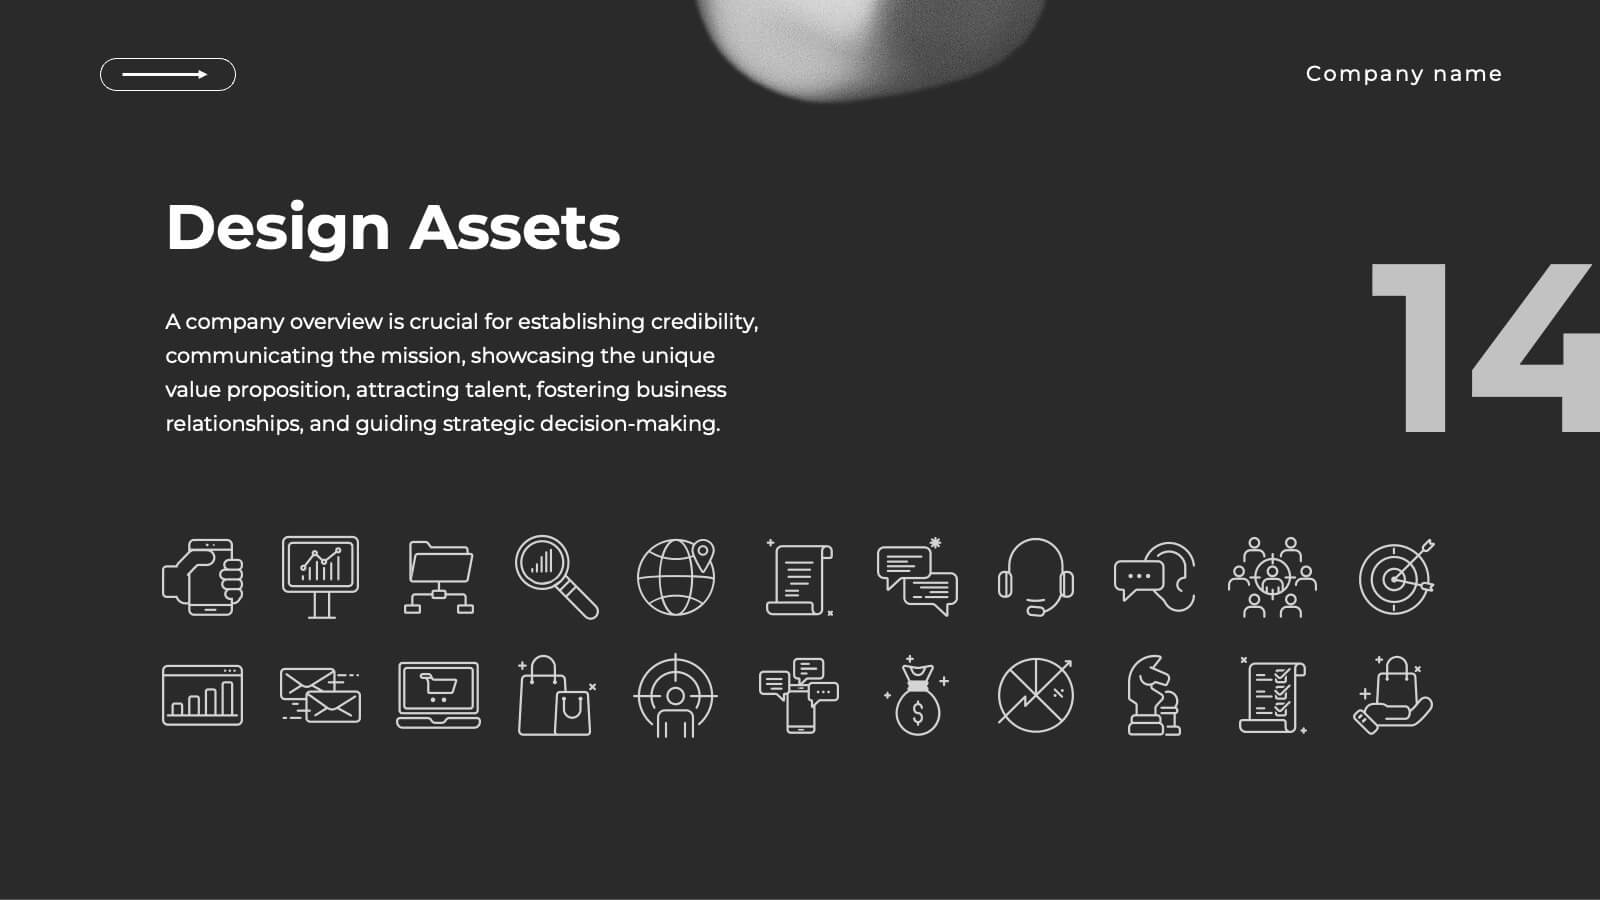
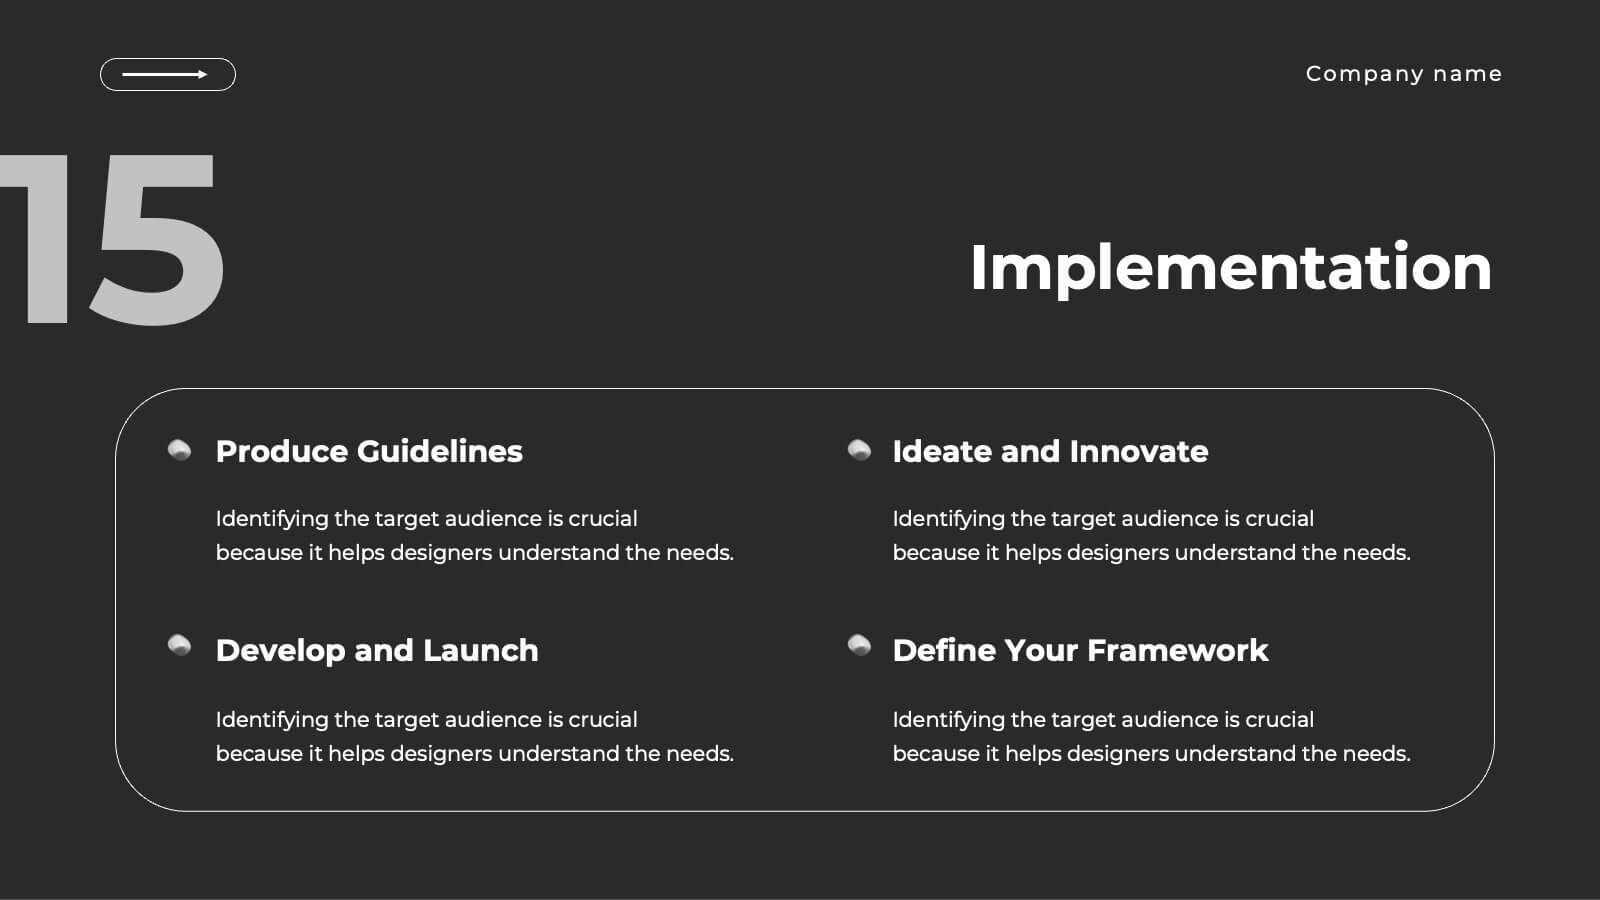
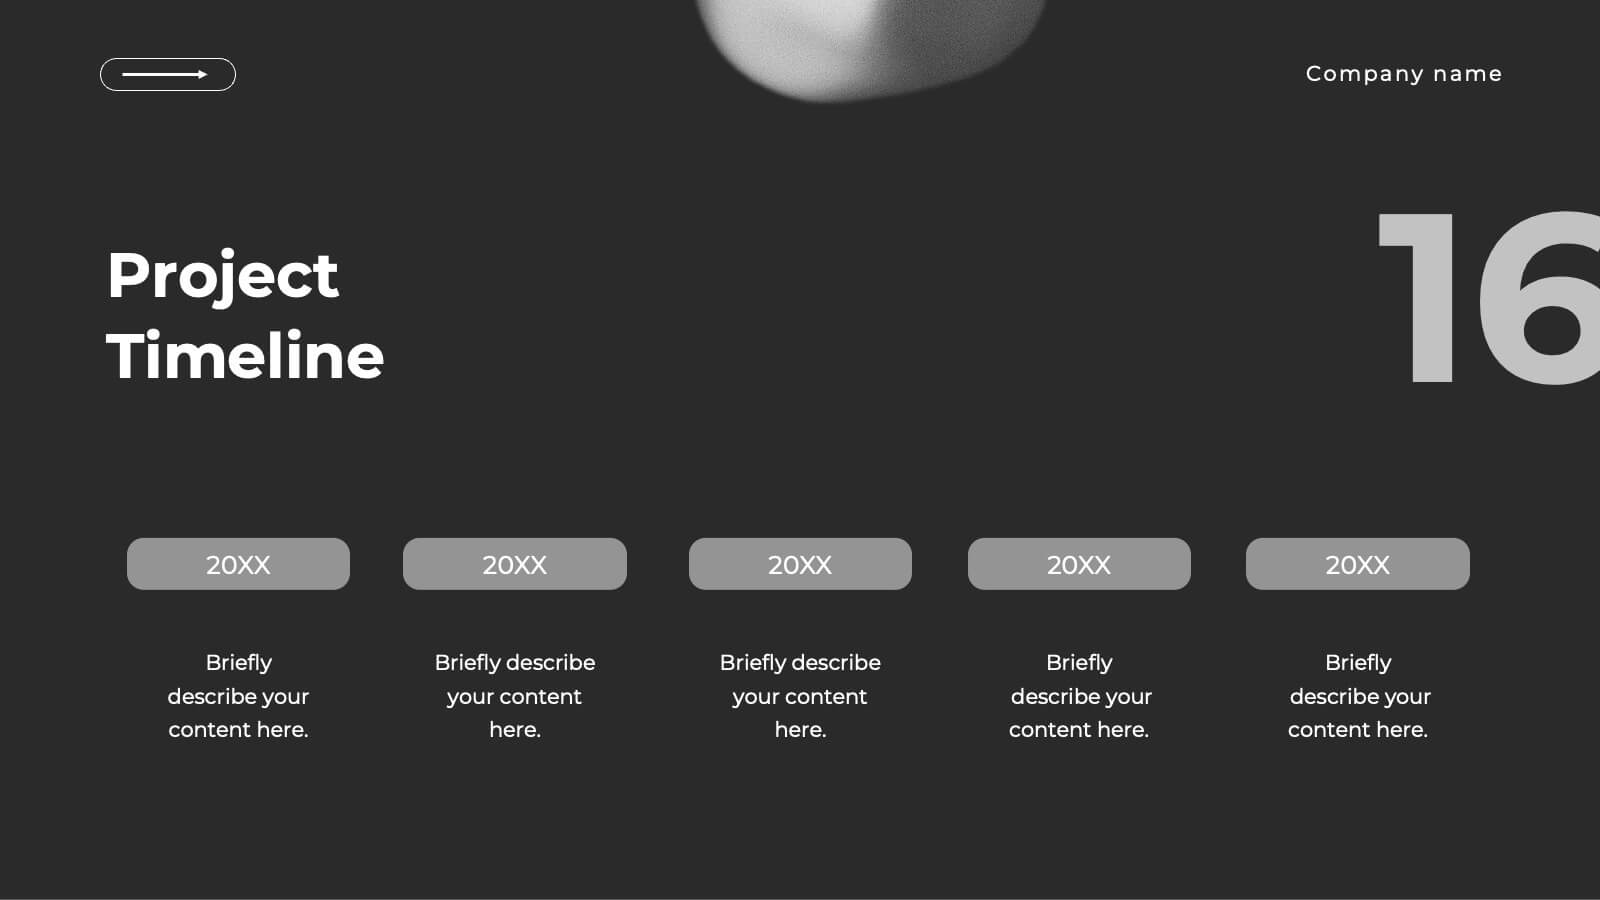
Realm UX UI Design Pitch Deck Presentation
Present your UX/UI design process with this sleek and modern design template! It covers everything from concept development to wireframes, prototypes, design iterations, and final design presentation. Fully customizable and compatible with PowerPoint, Keynote, and Google Slides, it’s perfect for design teams and professionals looking to showcase their creative process effectively.


20 slides
Ashen Sales Proposal Presentation
The Sales Proposal Presentation Template is designed to help you showcase your sales strategy effectively. With 20 fully customizable slides, it covers key areas such as market analysis, sales objectives, pricing strategy, and future opportunities. Ideal for professionals, it’s compatible with PowerPoint, Keynote, and Google Slides.


7 slides
Time Management Strategies Infographic Presentation
Time management is the process of planning, organizing, and allocating time effectively to achieve specific goals and objectives. This simple and professional template shows you the basics of time management. It uses a combination of bullet points, tables and illustrations to give you the information you need in a practical form. Use this presentation as a step-by-step guide on how you can become more efficient at managing daily business tasks. This infographic template is designed to help you manage your time and prioritize your actions by highlighting the different aspects of a task.


21 slides
Auster Financial Report Presentation
Present financial insights with clarity using this comprehensive report template. Highlight key metrics, performance, project progress, competitor analysis, and strategic initiatives. Includes sections for team productivity, market trends, goals, and recommendations. Perfect for business reviews and updates. Fully customizable for PowerPoint, Keynote, and Google Slides.


5 slides
Supply Chain Process Infographics
Unravel the complexities of logistics with supply chain process infographics. This vibrant template, splashed with energetic shades of orange, purple, and green, is designed to streamline the convolutions of supply chain management into an easily digestible format. Ideal for business analysts and logistics professionals, these vertical infographics offer a visually engaging narrative. The template features innovative graphics, intuitive icons, and versatile image placeholders, meticulously crafted to aid in visualizing the intricate processes within supply chain dynamics. These infographics are the tool you need to bring clarity to your audience.


4 slides
Business Gap Analysis Framework
Visually bridge the gap between current and desired performance with this impactful Business Gap Analysis slide. Featuring a creative cliff and bridge design with editable text sections, it's ideal for strategic planning, performance improvement, and operational reviews. Fully compatible with PowerPoint, Keynote, and Google Slides.


21 slides
Oslo Design Strategy Proposal Presentation
This design strategy proposal template is tailored to present your creative process with bold colors and clean layouts. It includes sections like overview, design brief, concept development, design process, mood board, and project timeline, giving you a comprehensive structure for showcasing your approach. Compatible with PowerPoint, Keynote, and Google Slides, it ensures seamless presentations.


5 slides
Space Environment Infographics
The Space Environment refers to the physical conditions and characteristics that exist beyond Earth's atmosphere. These infographic templates serve as a perfect educational and awe-inspiring tool, inviting the audience to embark on a journey through the wonders of outer space. Whether used in educational settings, science museums, or space-themed events, this template effectively conveys the vastness and beauty of the space environment and instills a sense of wonder and curiosity about the mysteries that lie beyond our planet. Compatible with Powerpoint, Keynote, and Google Slides, these are completely customizable.


26 slides
Linear Technology Presentation
Cyberspace is the realm of digital information that can be accessed, shared, and stored using electronic devices. Focus on the future of technology with this template! This presentation's linear design will put your ideas front-and-center. This design is high-tech the theme colors and icons are sure to make an inspiring first impression on your audience. This can be used for business presentations, academic projects and conferences. This template consists of 26 slides that will bring your ideas to the next level by putting emphasis on key points and keeping your ideas concise and organized.


4 slides
Vision Statement Slide Presentation
Spark inspiration from the very first slide with a clean, modern layout designed to express future goals with clarity and confidence. This presentation helps teams communicate direction, long-term aspirations, and strategic focus in a simple, structured format. Fully compatible with PowerPoint, Keynote, and Google Slides.


6 slides
Strategic Business Objective Mapping Presentation
Clearly define your strategic focus with this Strategic Business Objective Mapping slide. Designed to display six core objectives around a central theme, it’s ideal for visualizing business goals, departmental priorities, or key initiatives. Fully customizable in PowerPoint, Canva, and Google Slides for seamless team collaboration.