


Features
- 5 Unique slides
- Fully editable and easy to edit in Microsoft Powerpoint, Keynote and Google Slides
- 16:9 widescreen layout
- Clean and professional designs
- Export to JPG, PDF or send by email


Do you have any questions?
Recommend
21 slides
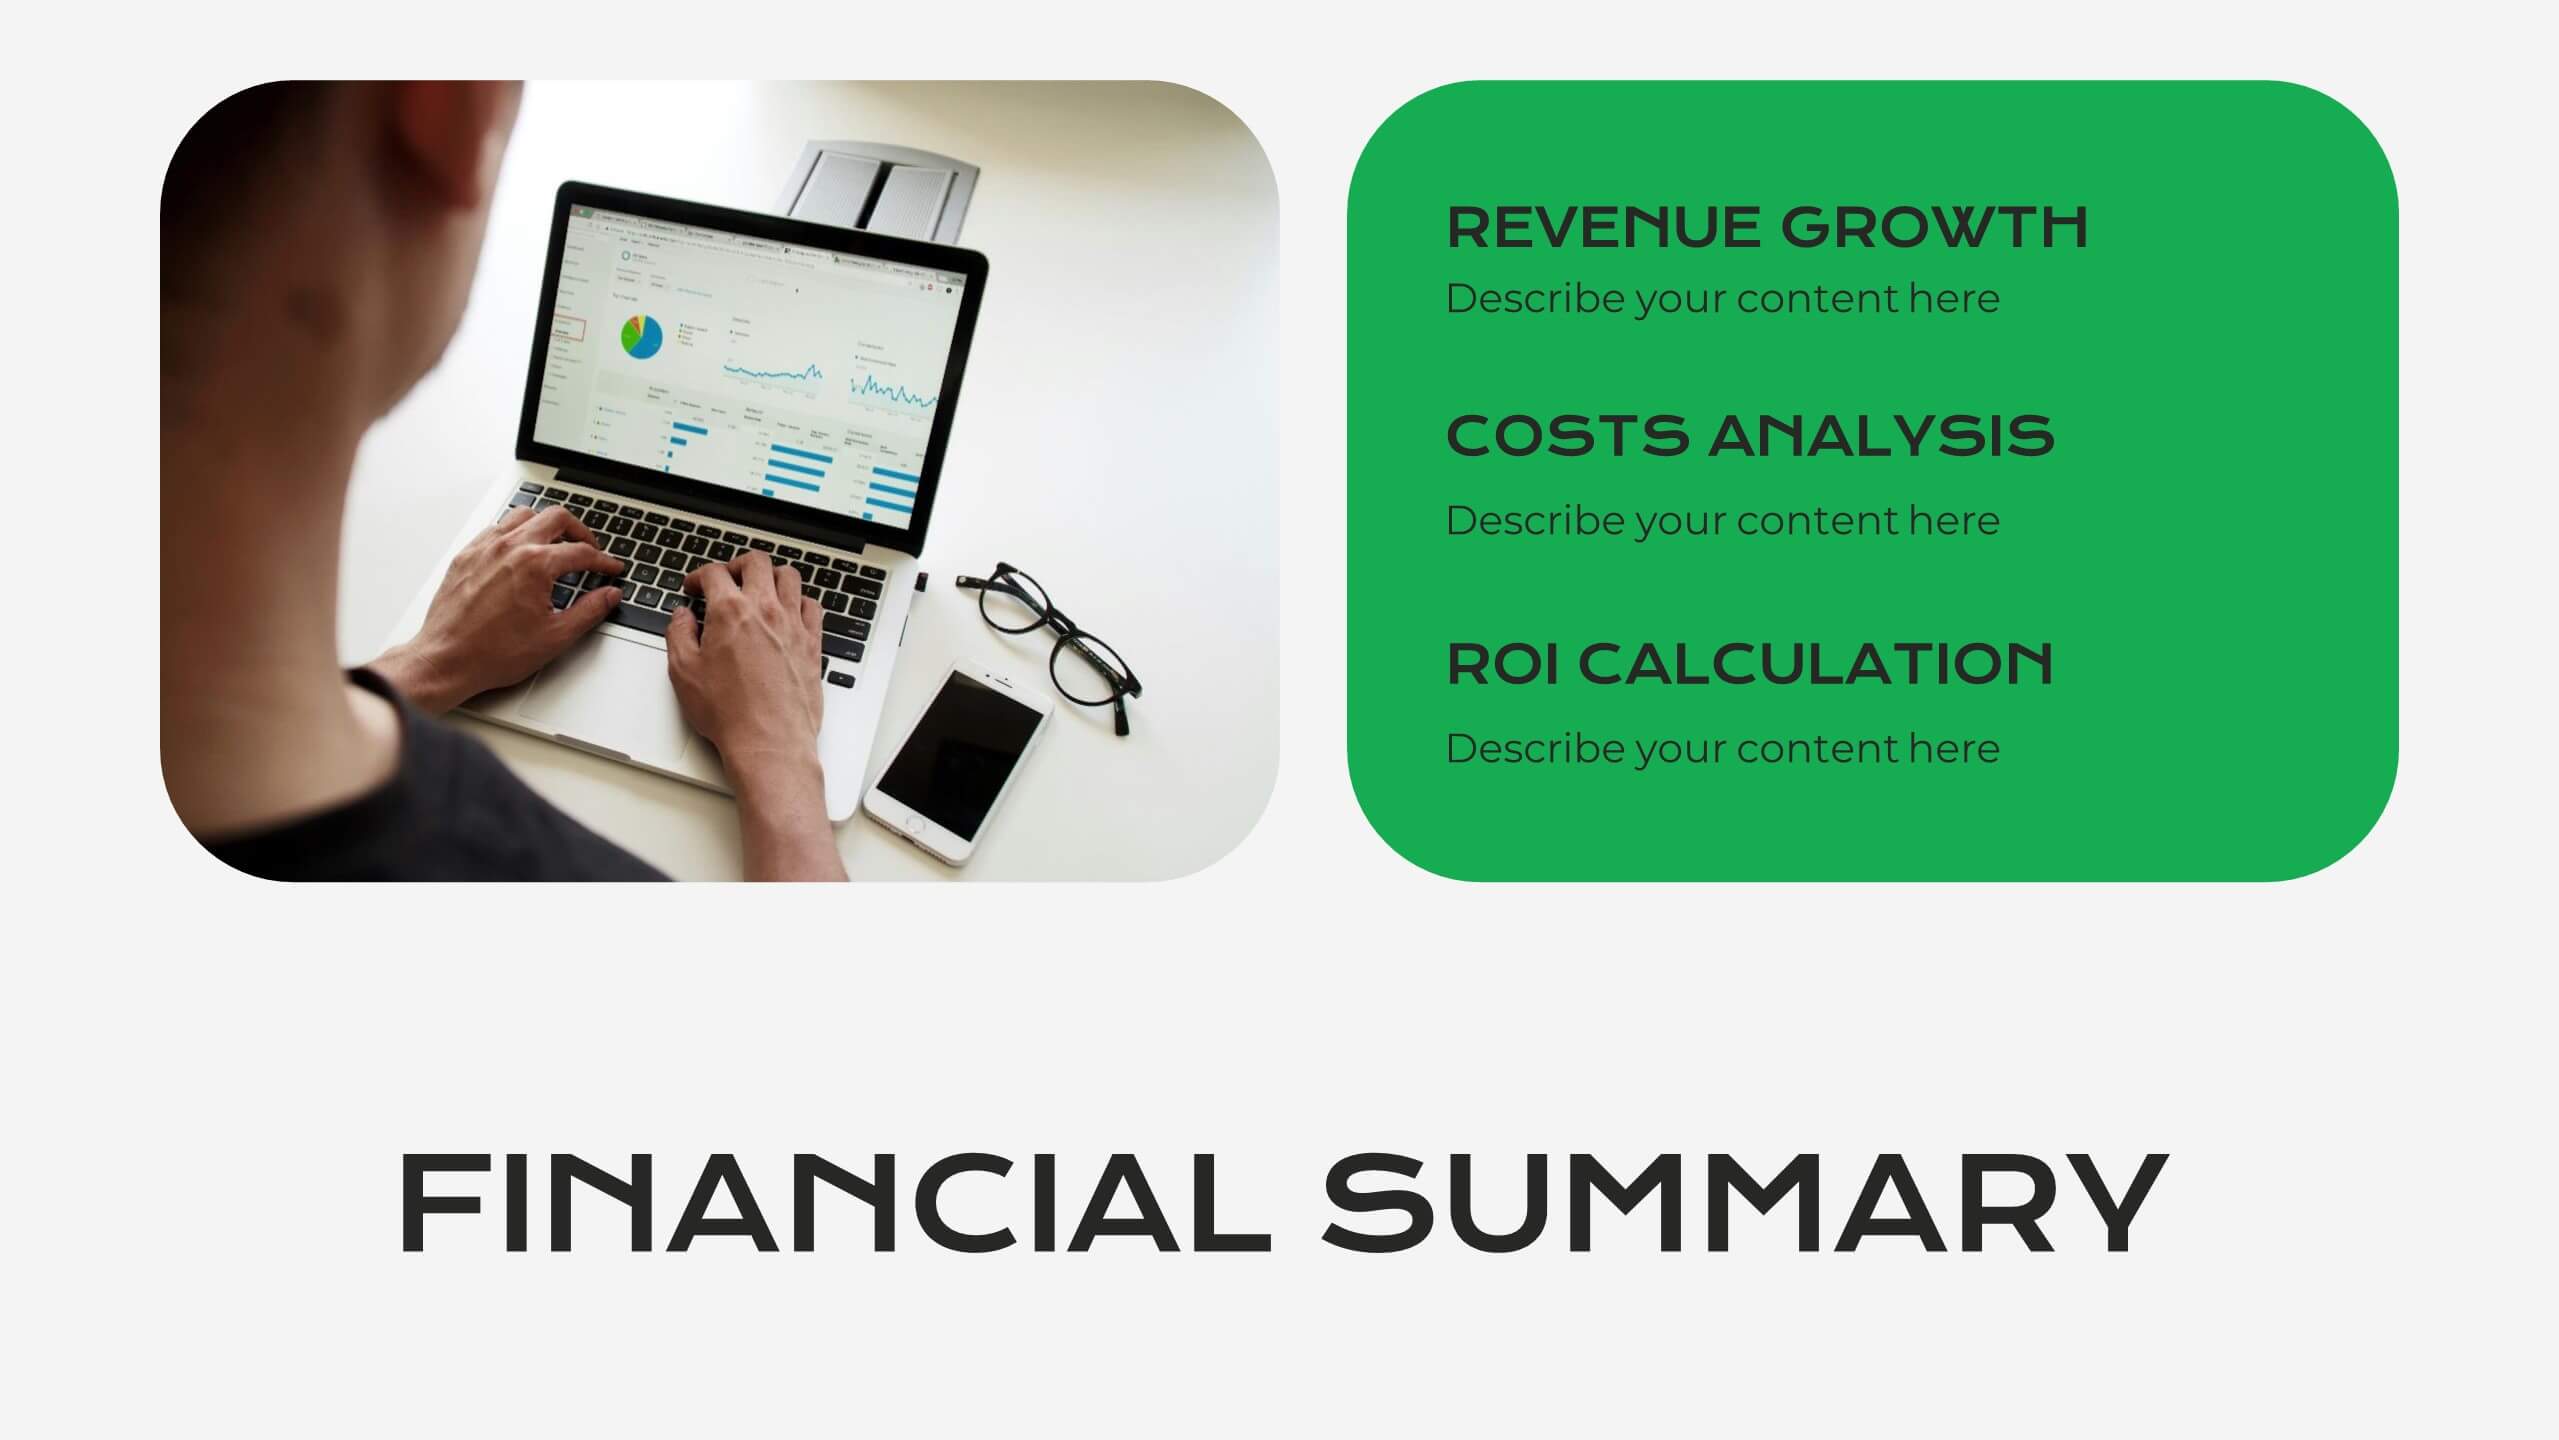
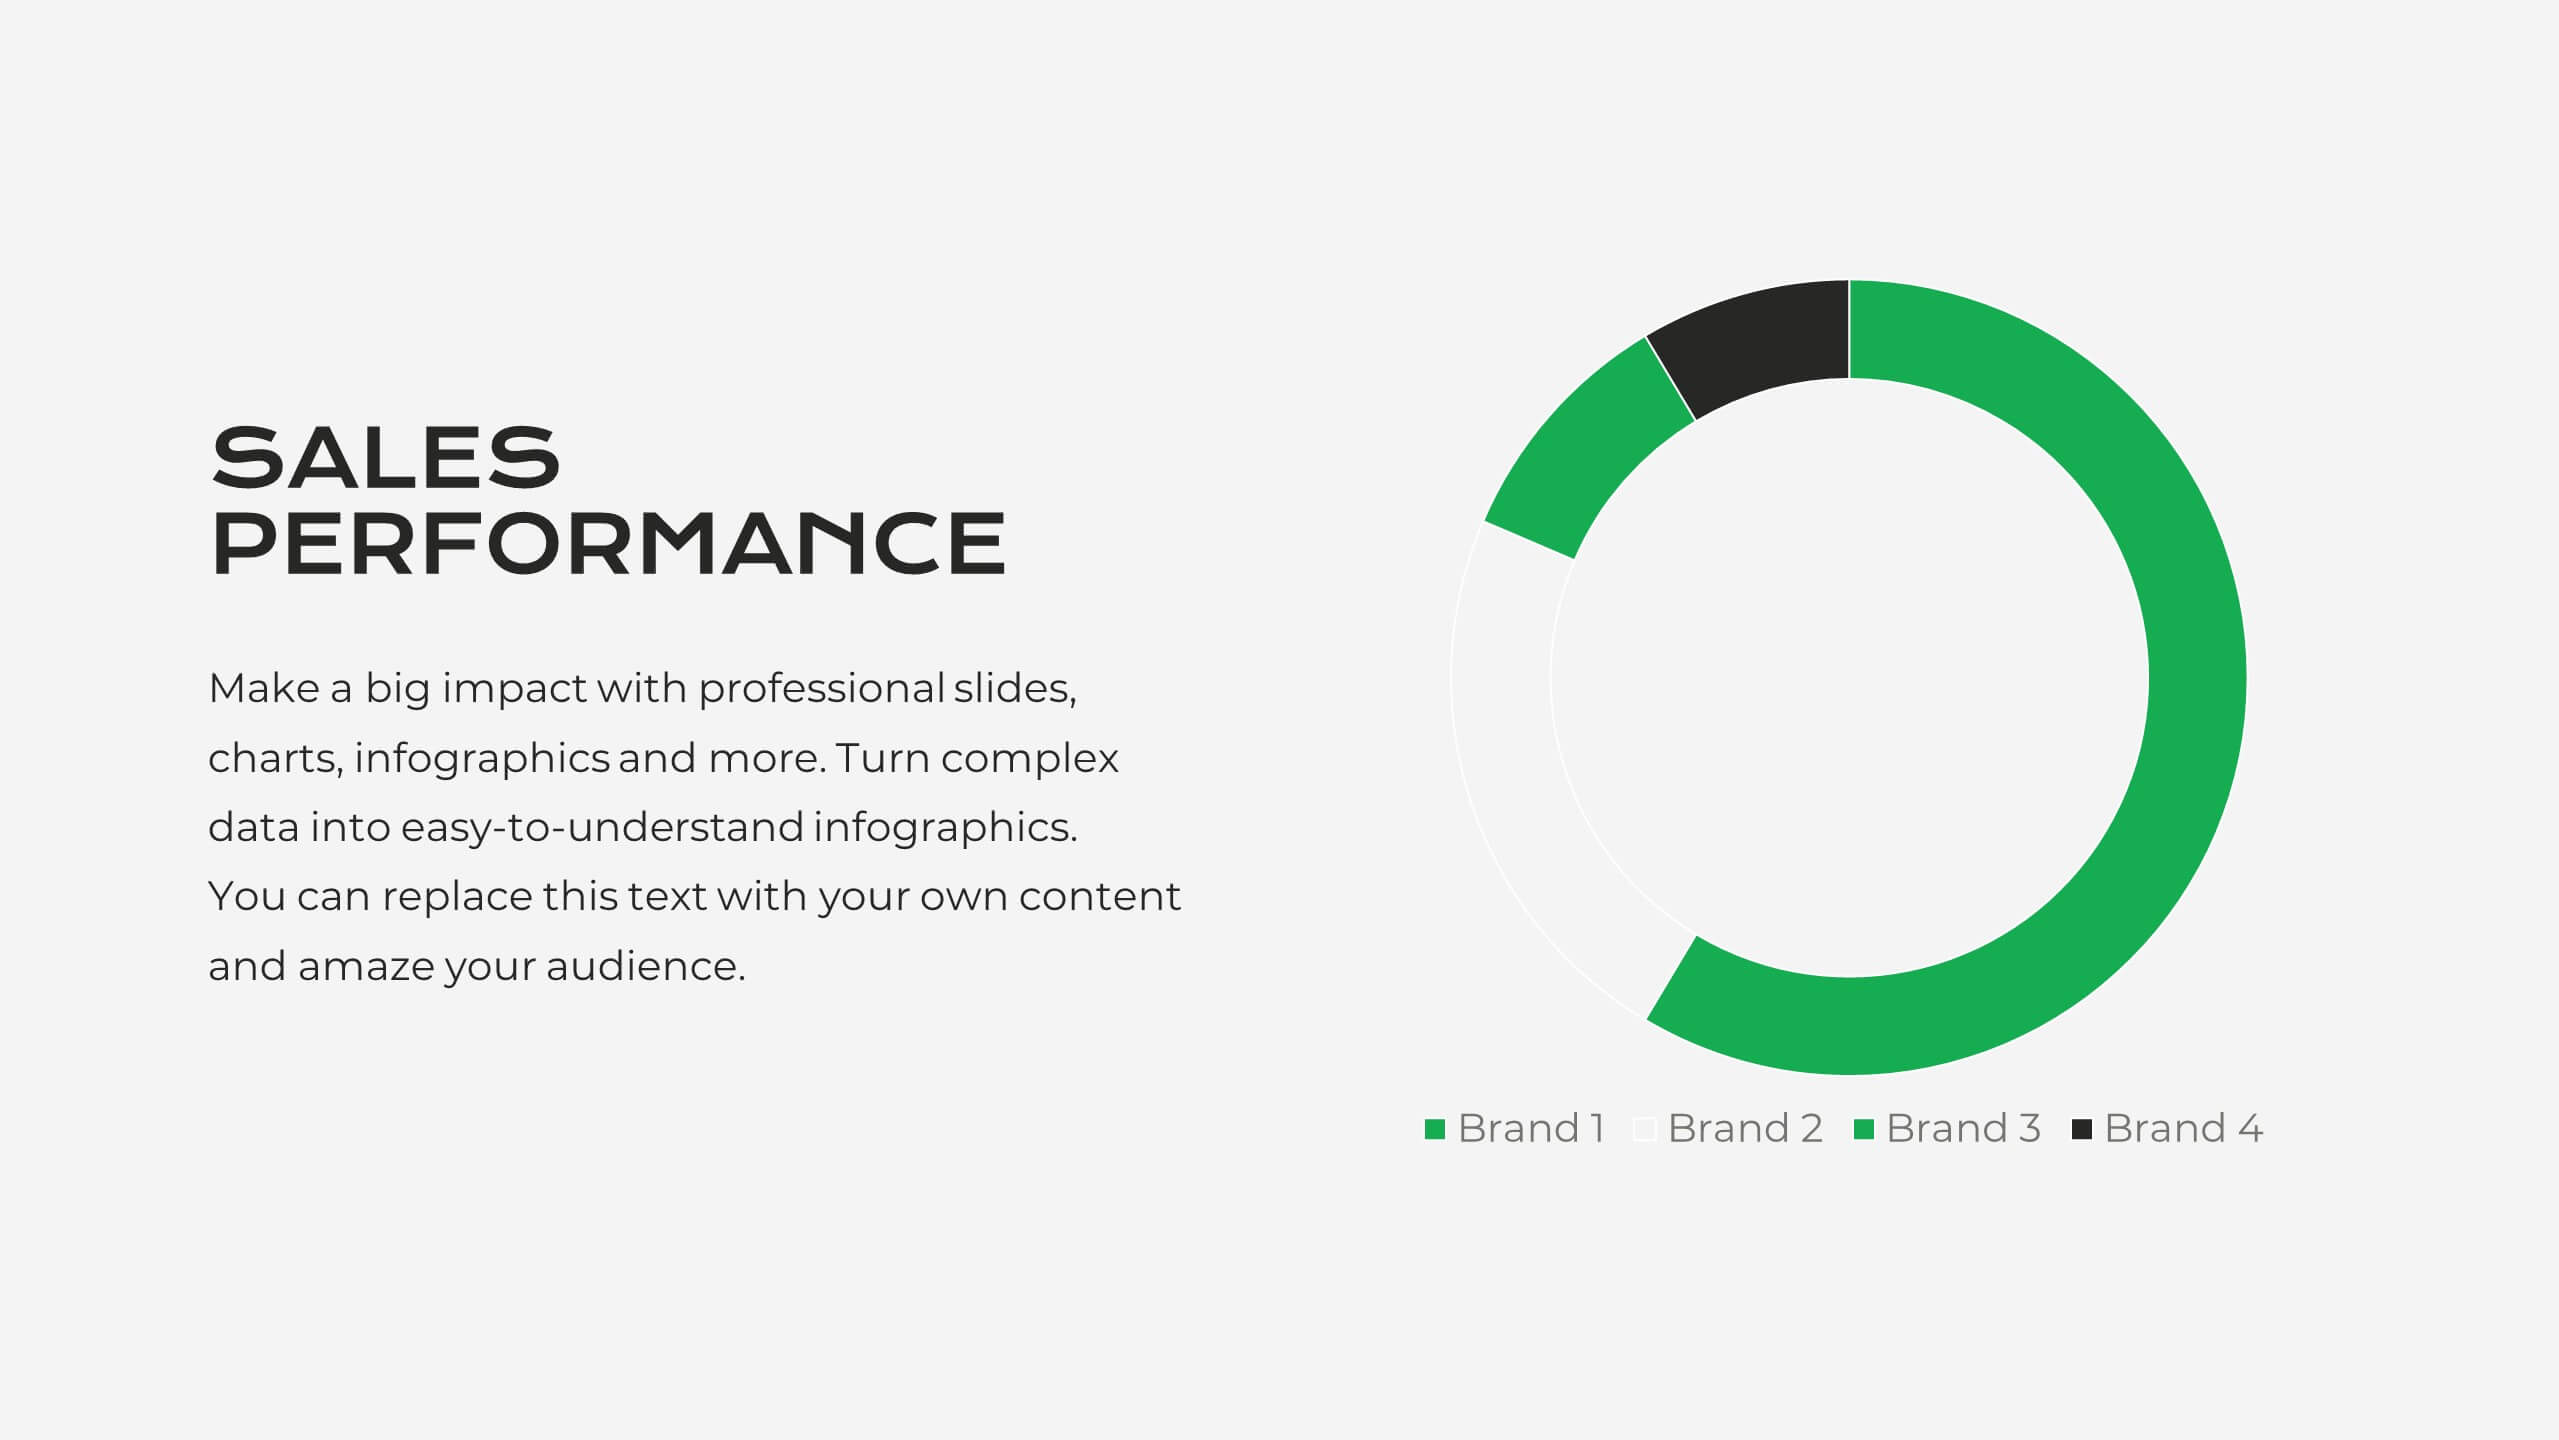
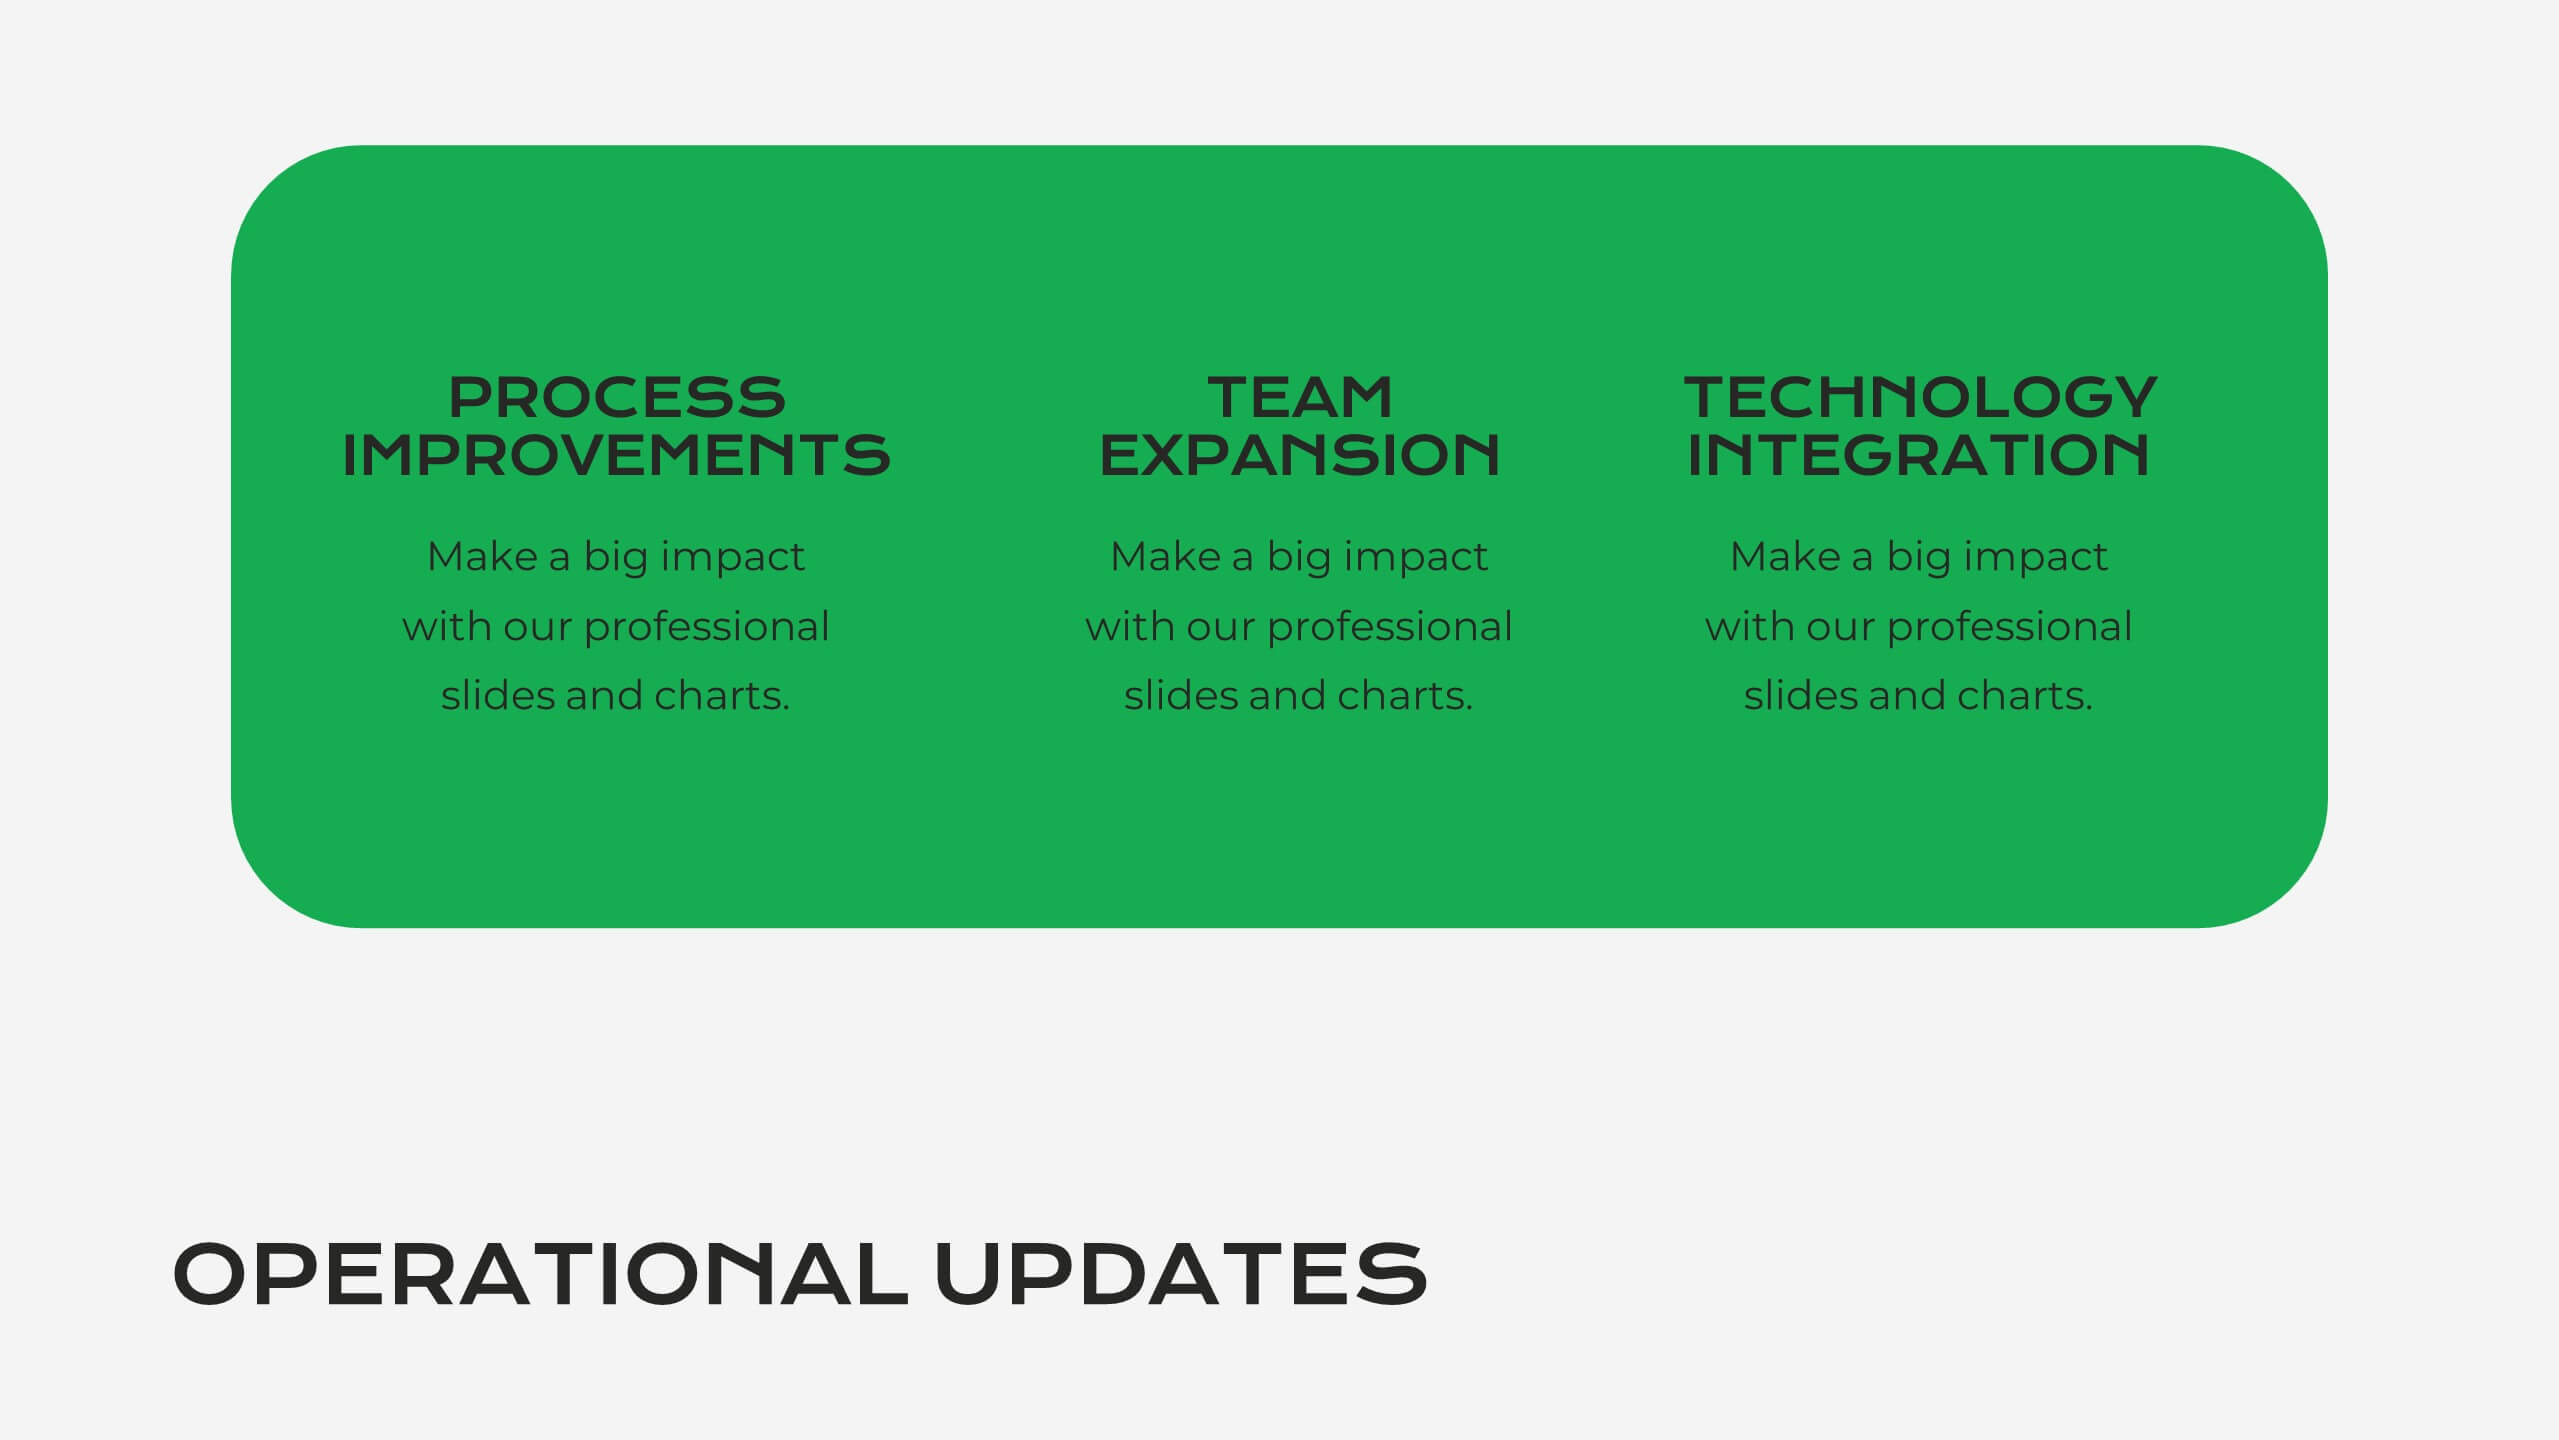
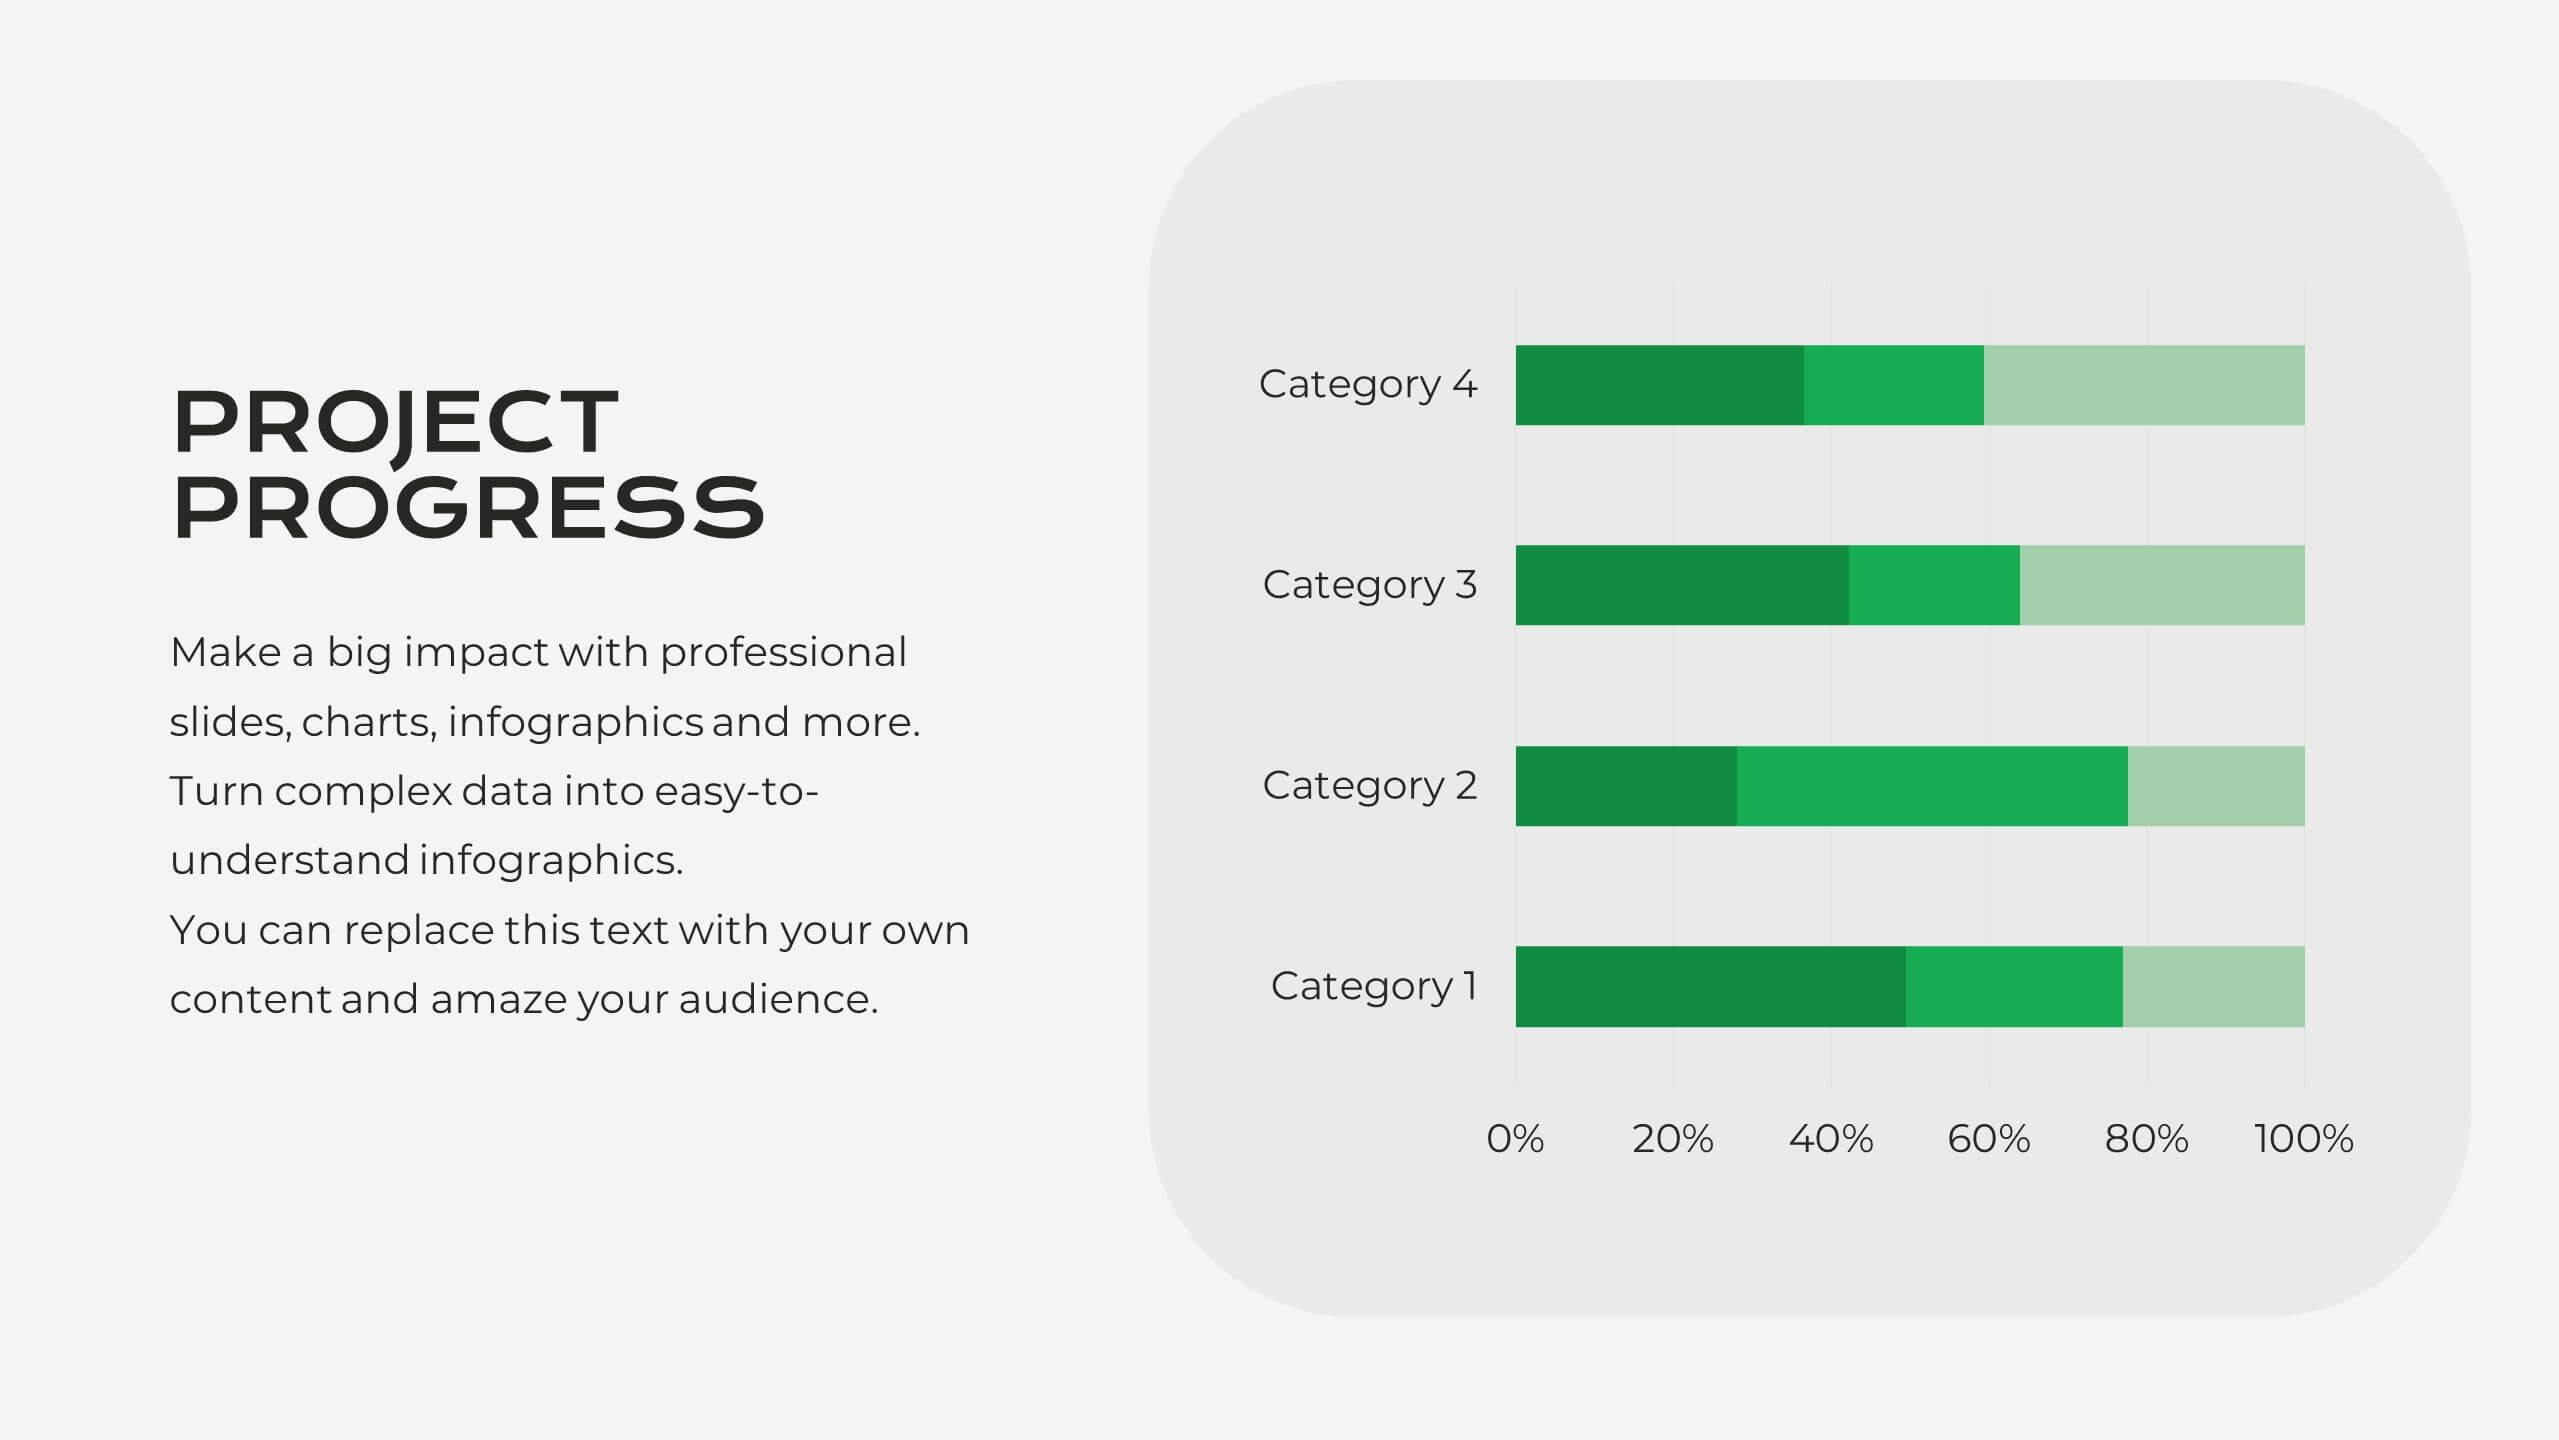
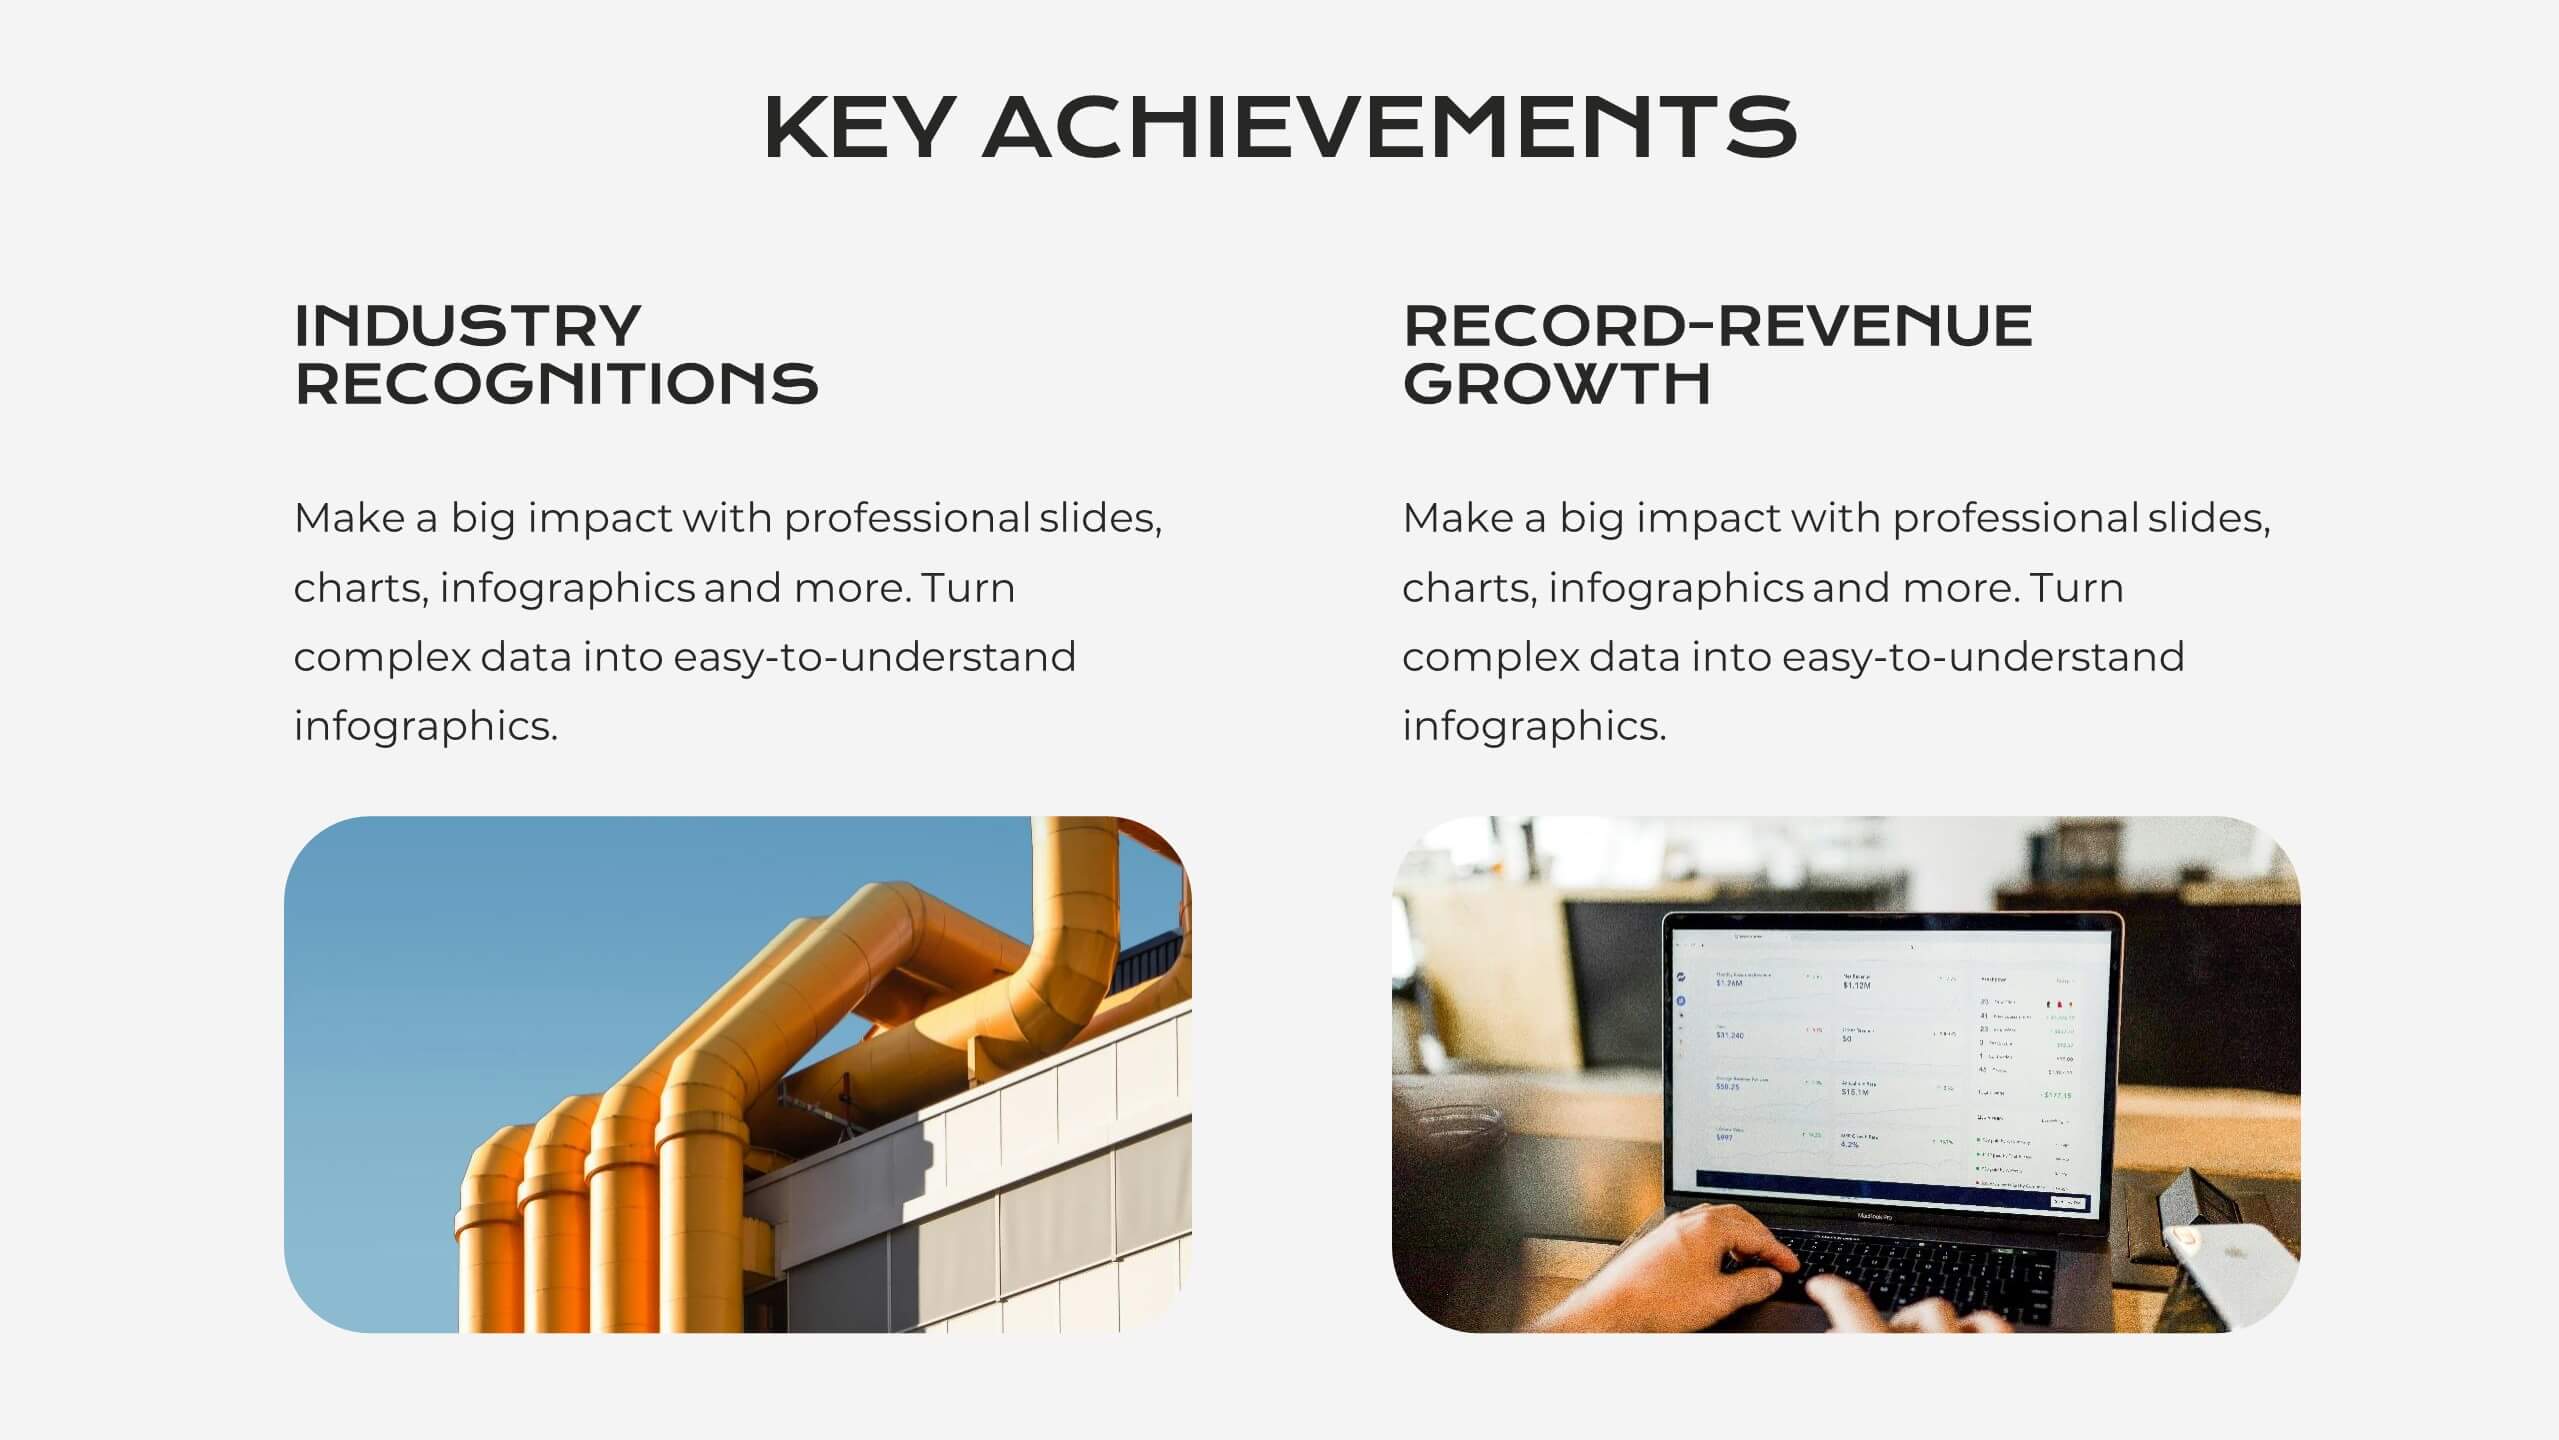
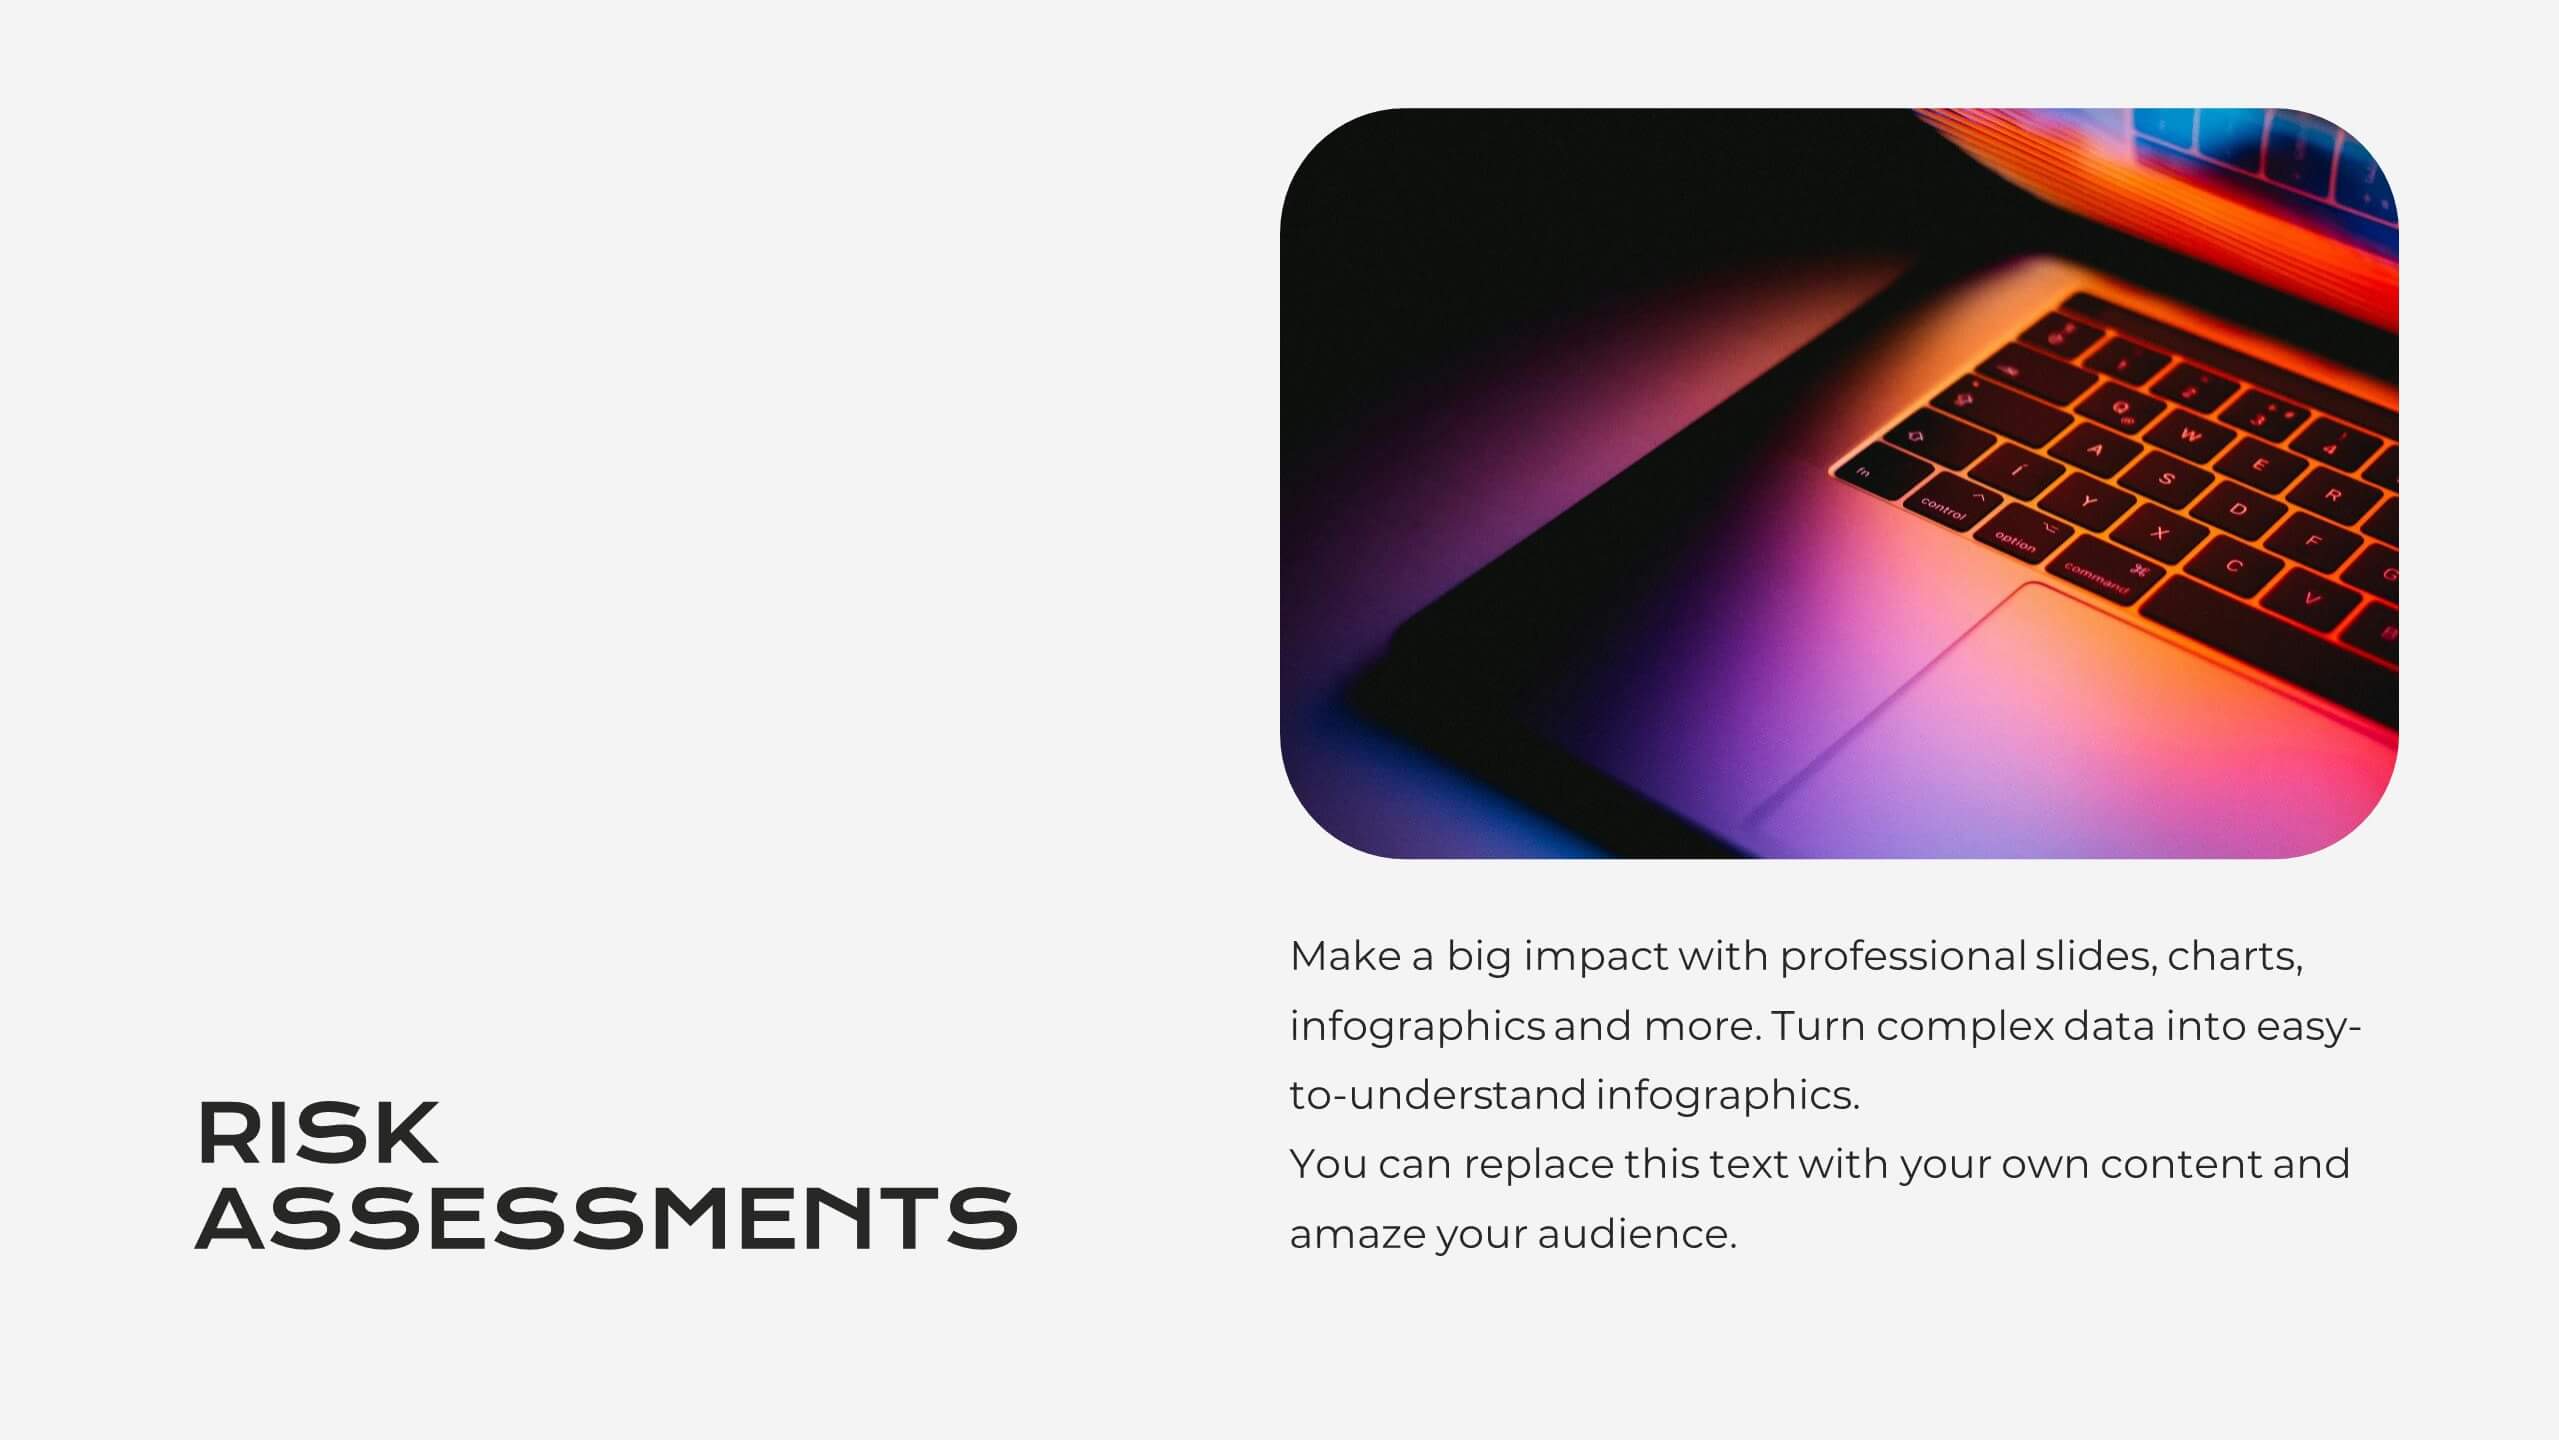
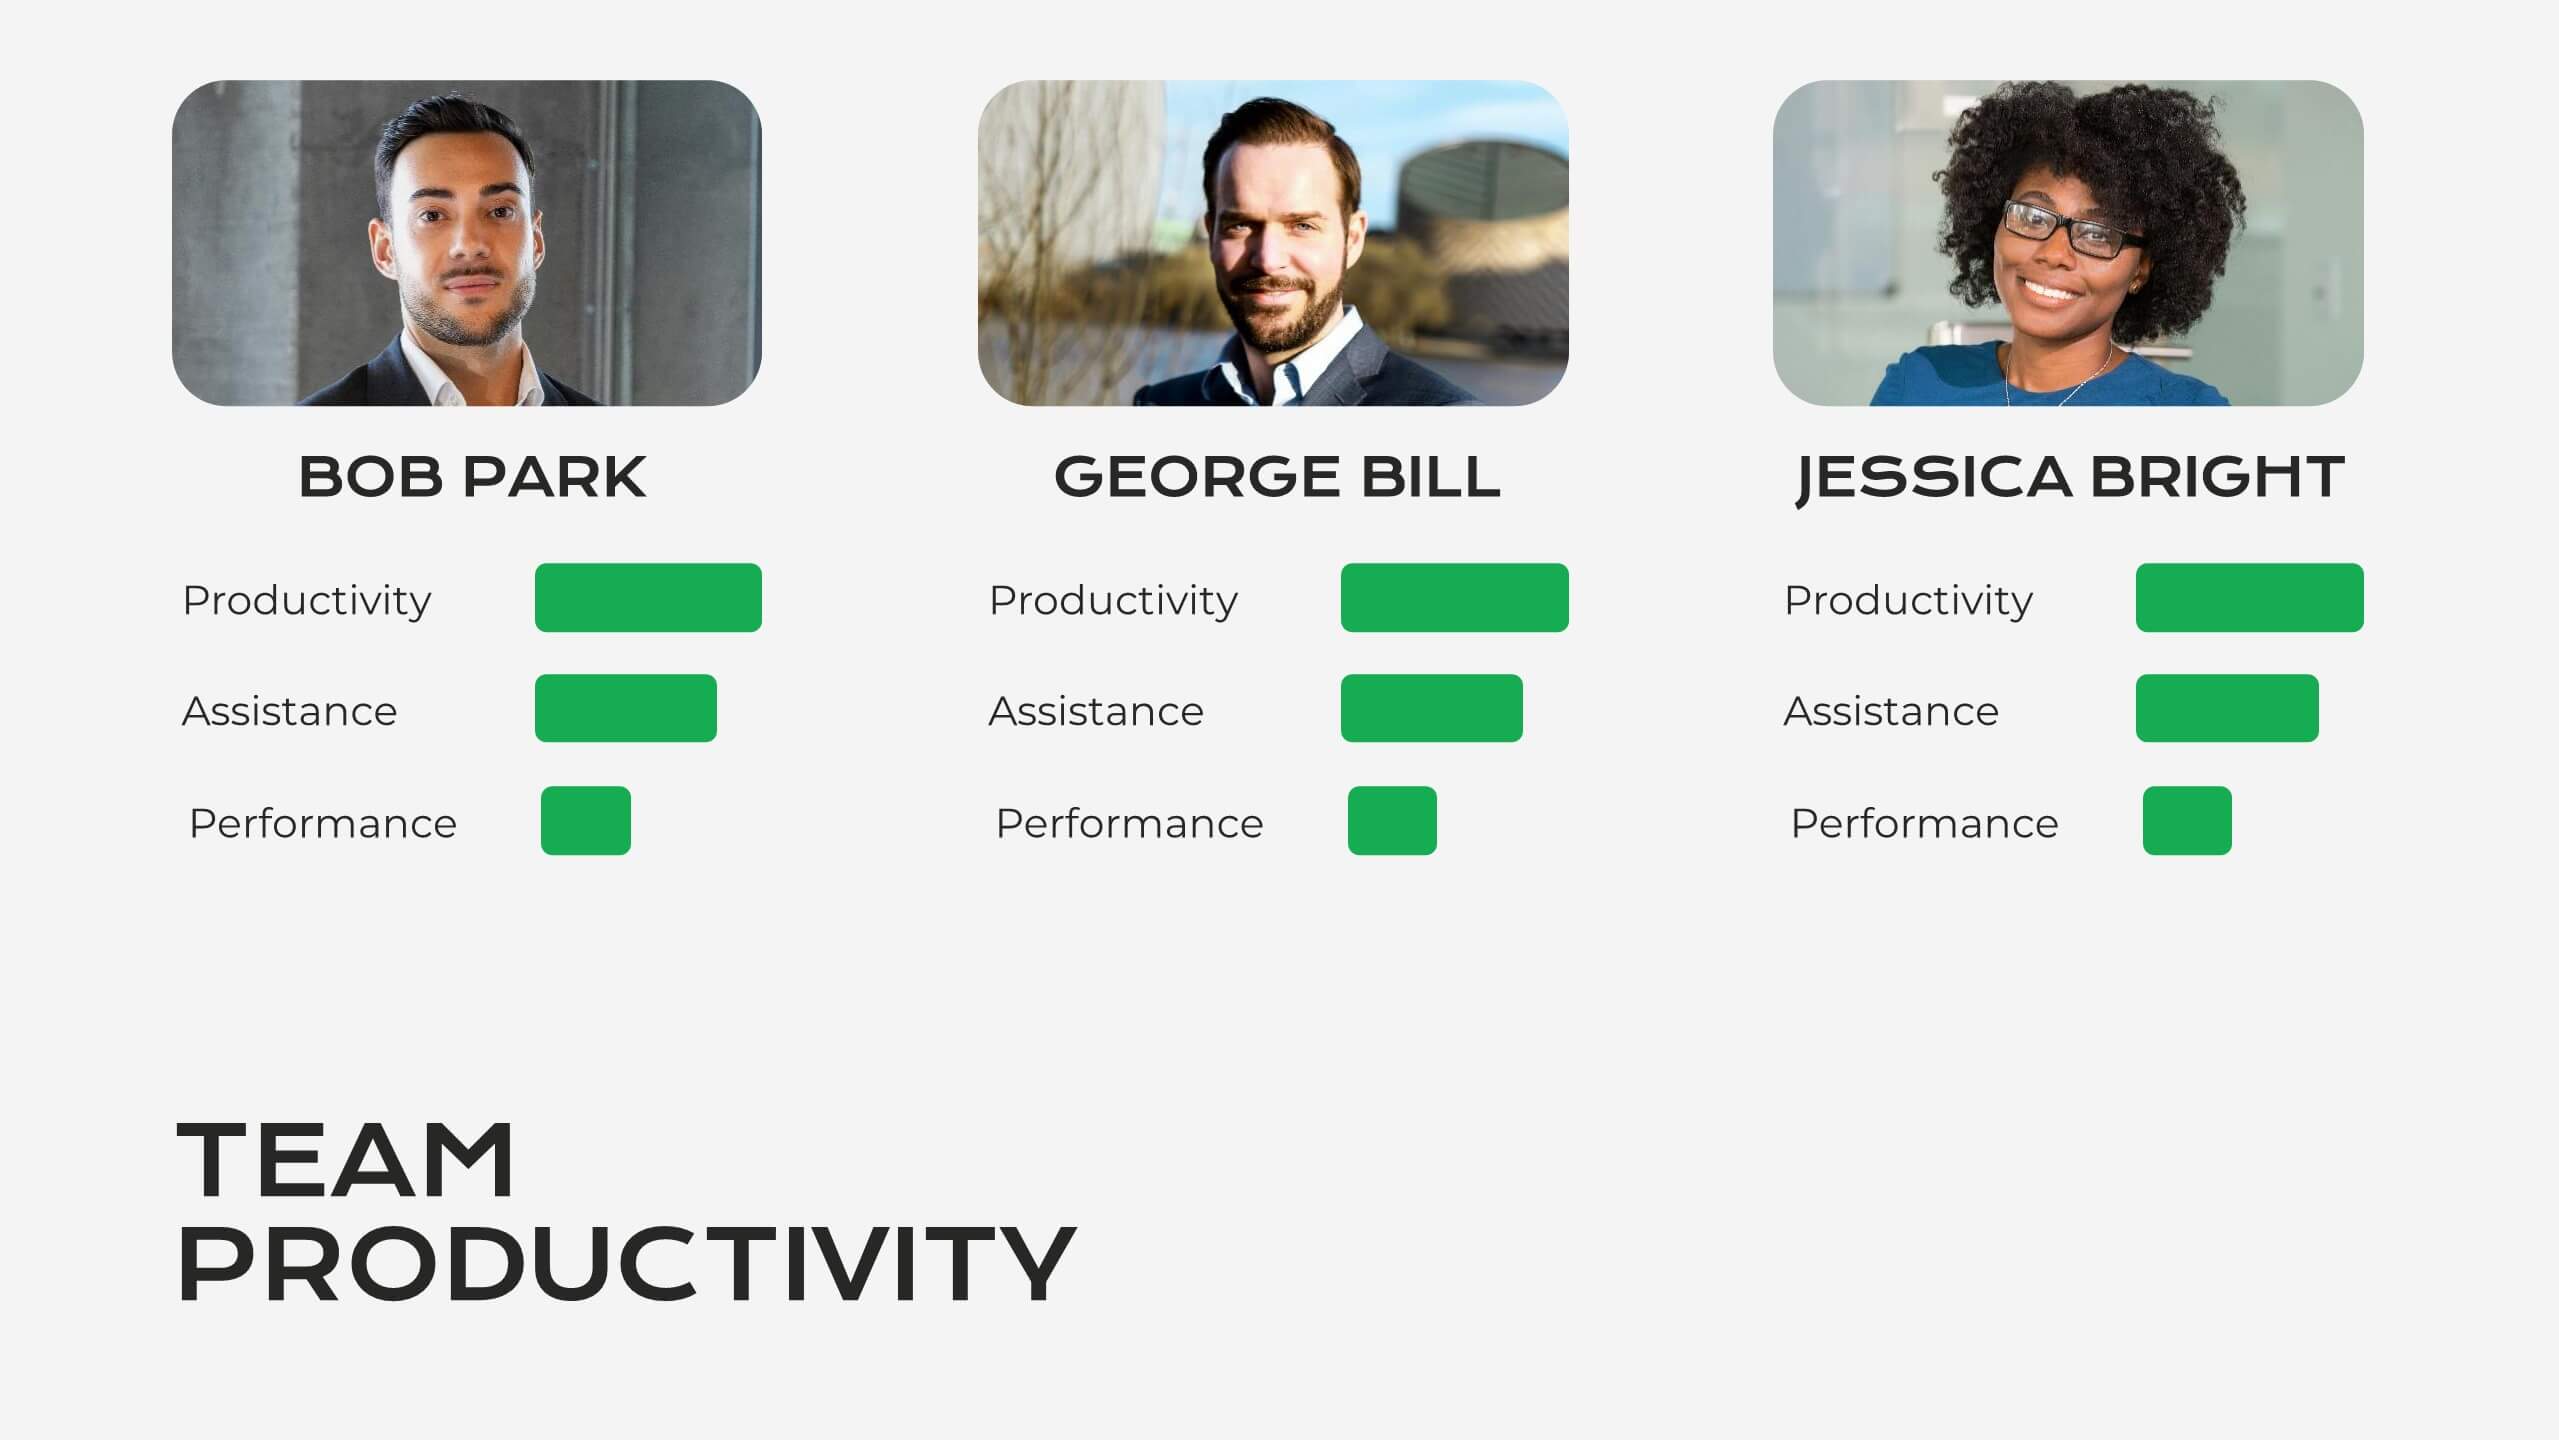
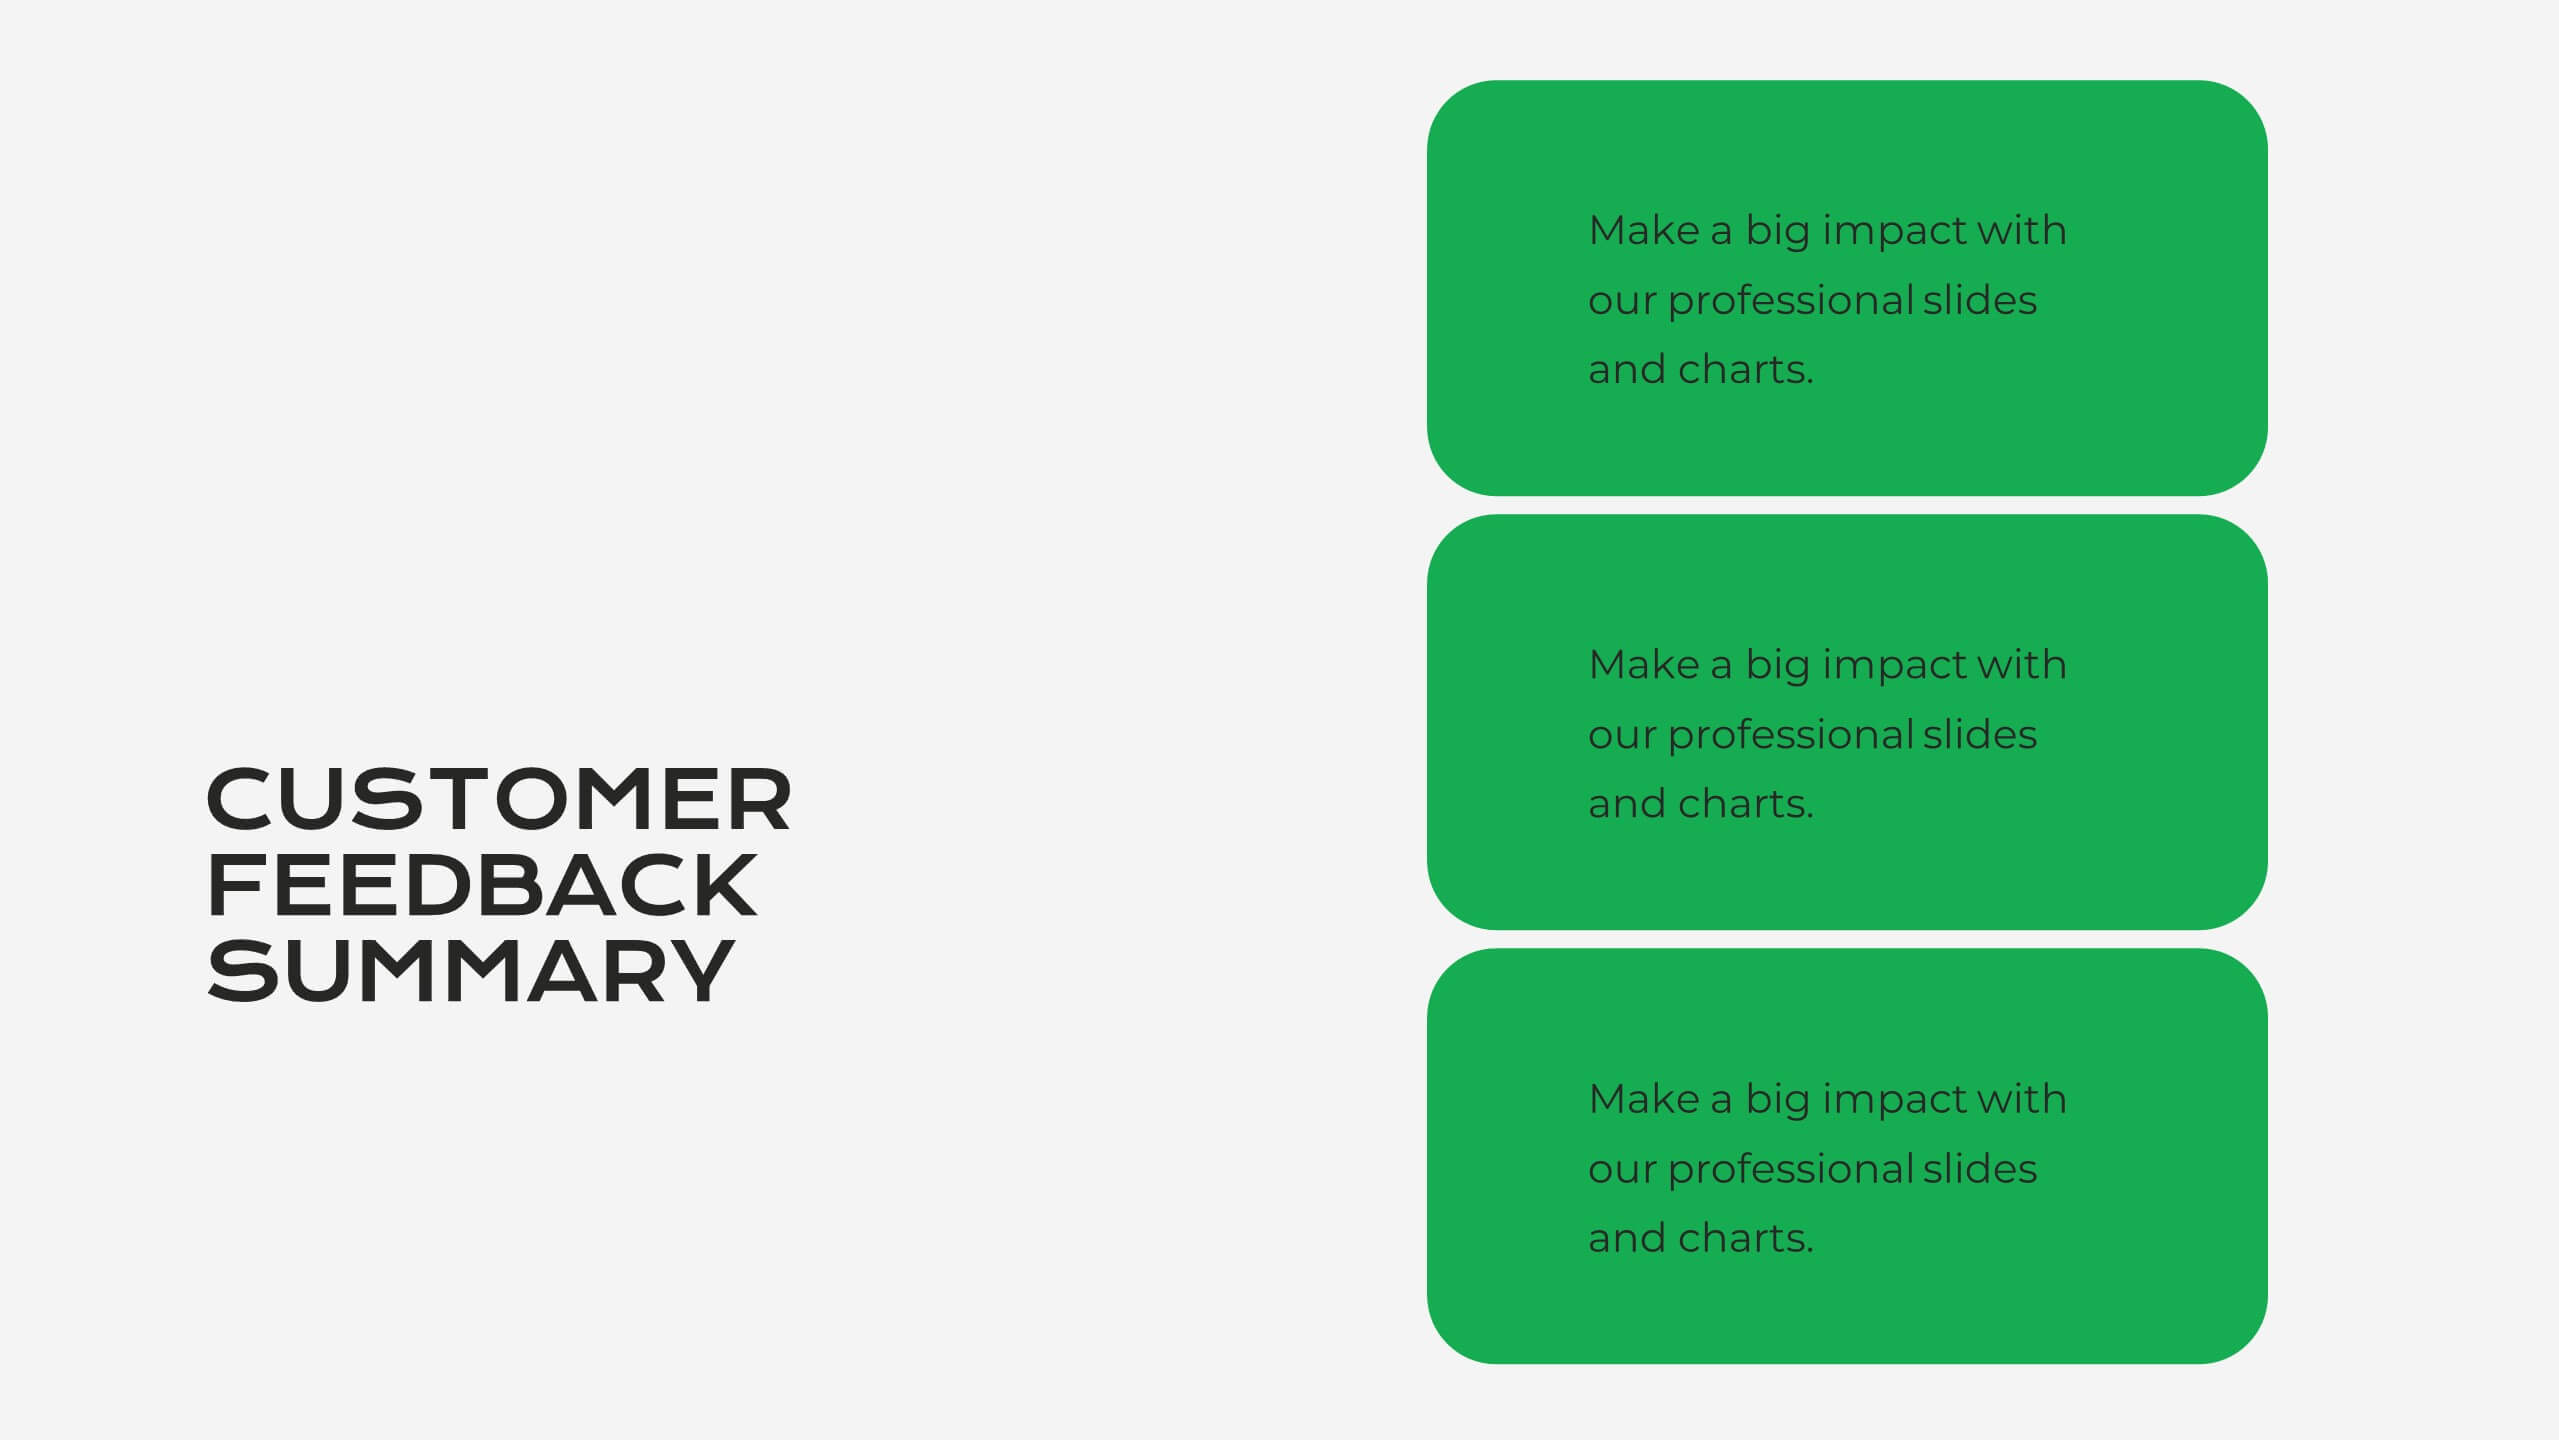
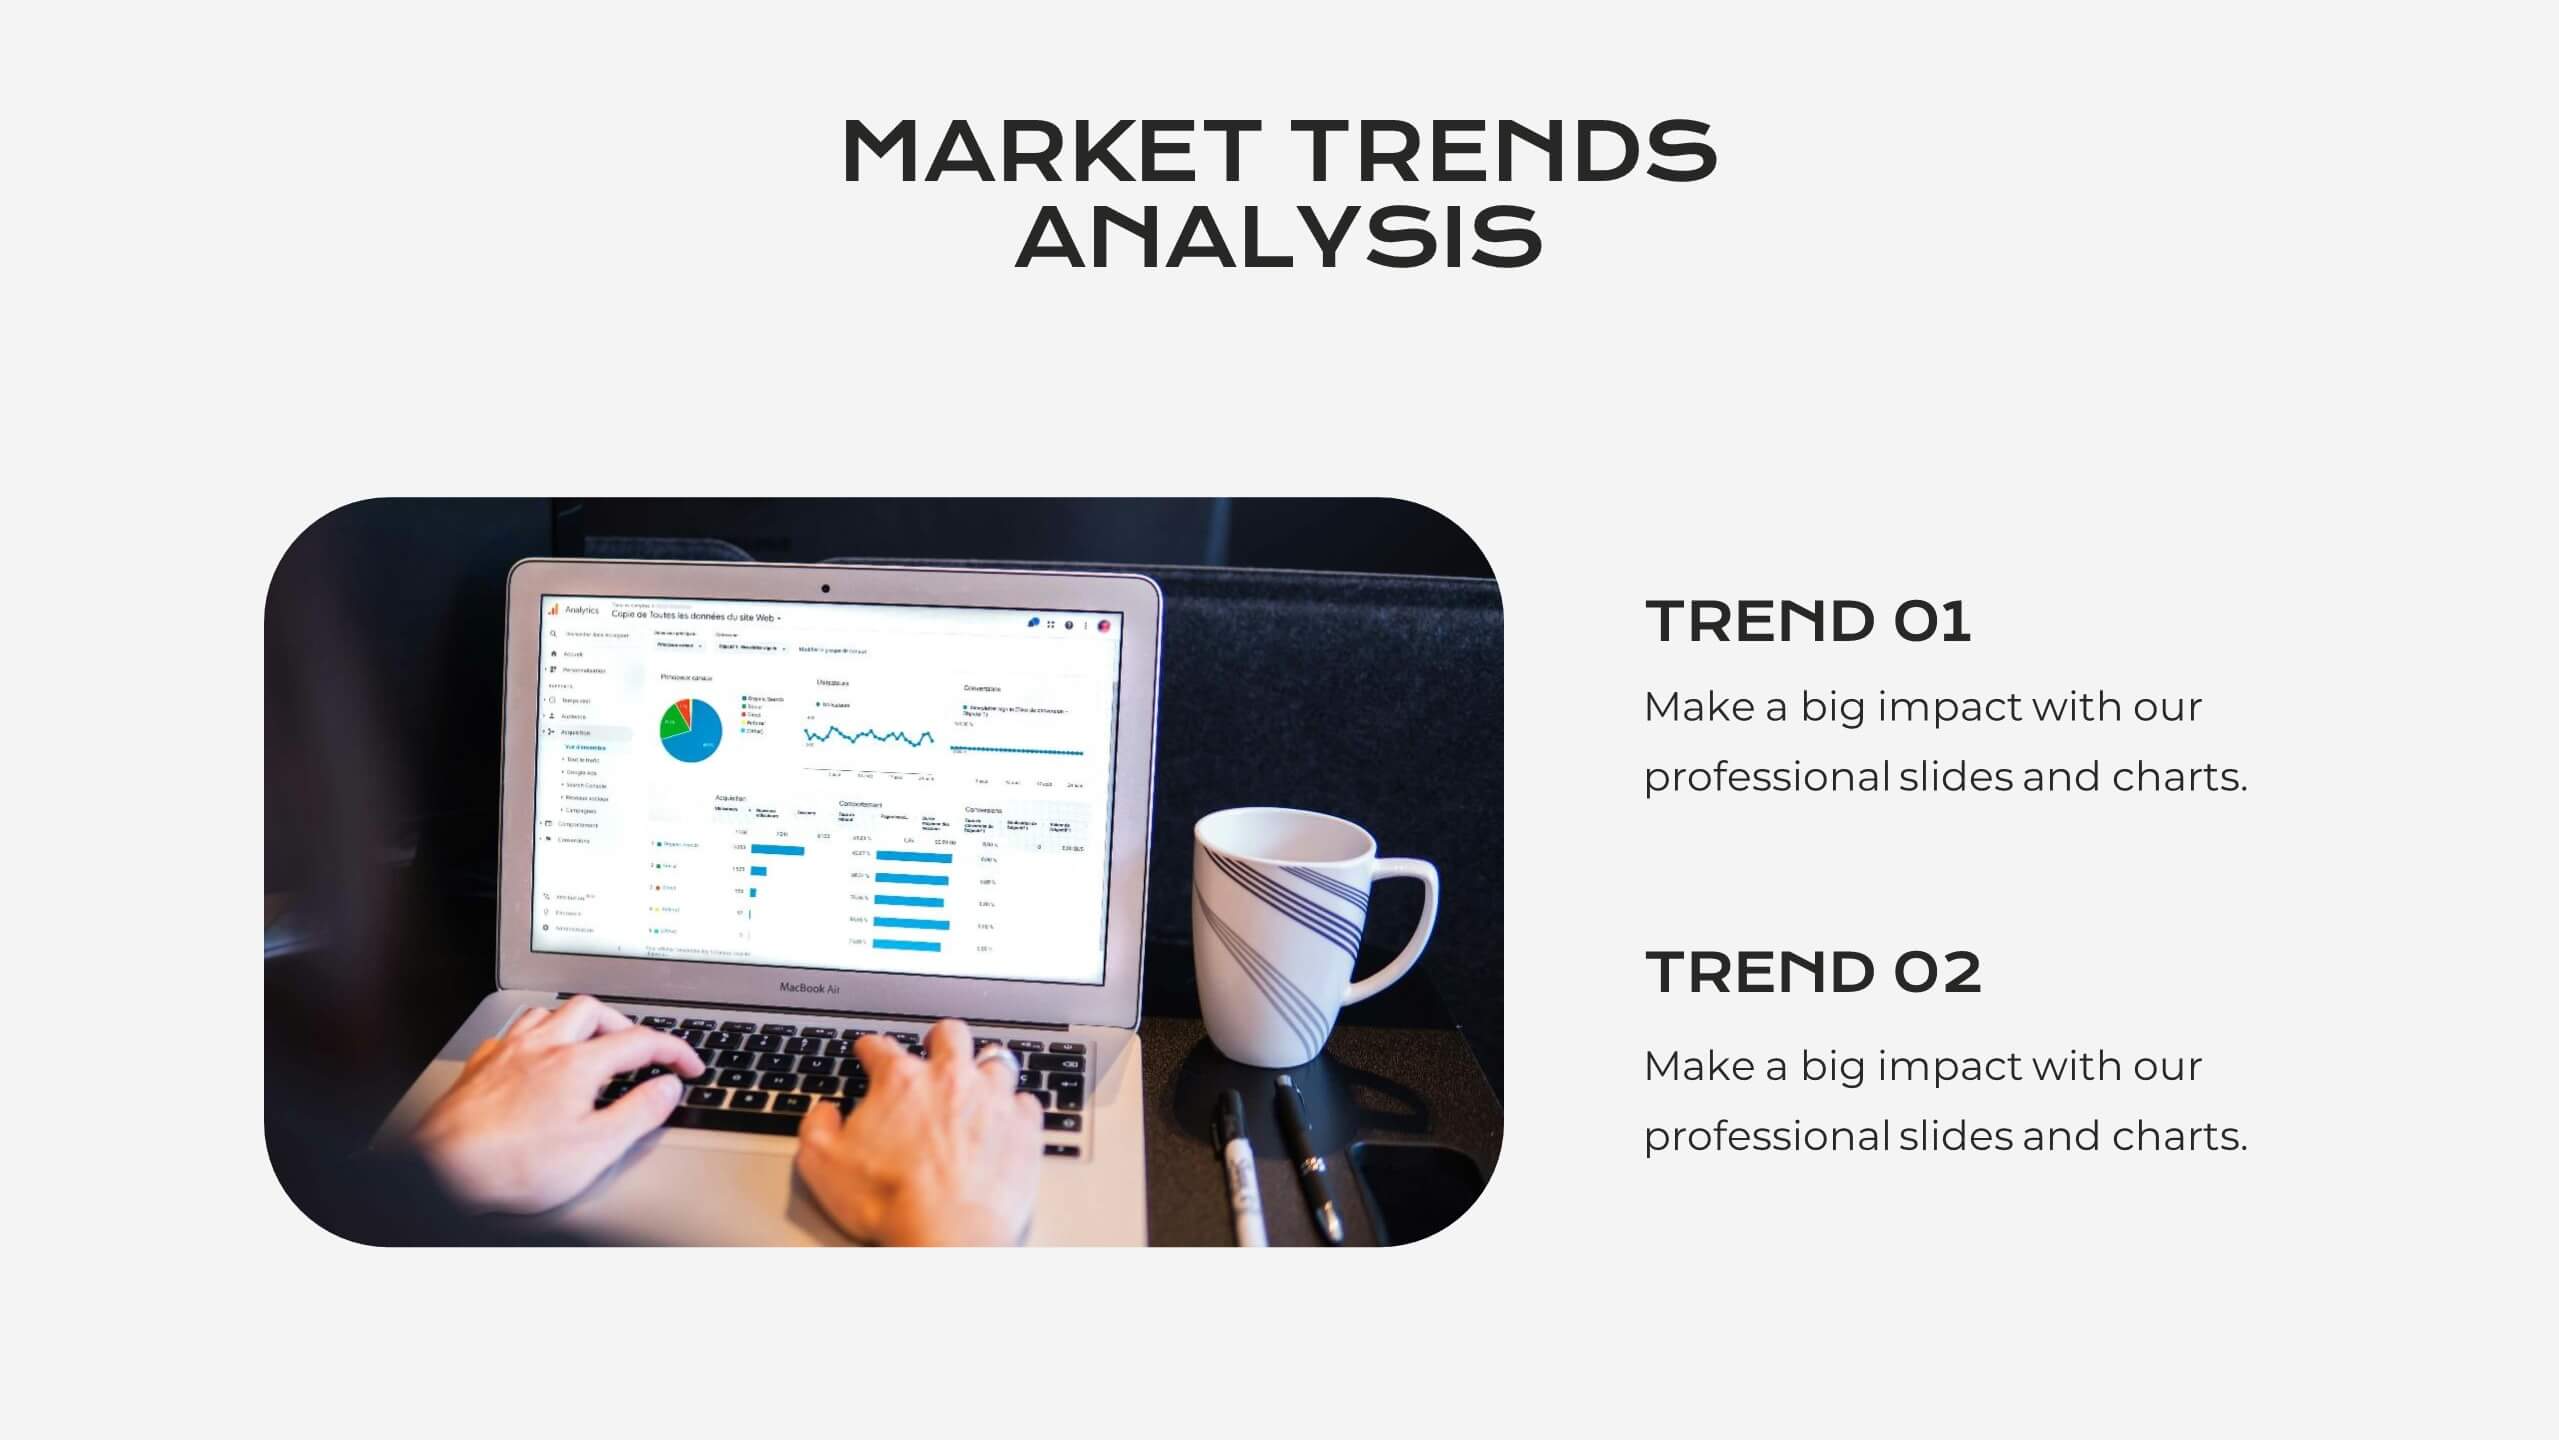
Serene Market Analysis Report Presentation
This modern and clean Market Analysis Report template is designed to help you present key data and insights with clarity and impact. Ideal for business professionals and analysts, it includes slides for key highlights, performance metrics, financial summaries, competitor insights, and strategic initiatives. The template's sleek layout ensures that your data is easy to understand and visually appealing, making it perfect for internal reports or client presentations. Customize it effortlessly in PowerPoint, Keynote, or Google Slides, and impress your audience with a polished and professional report.


6 slides
Risk Assessment Spider Chart Presentation
Clearly visualize risk exposure across multiple criteria with the Risk Assessment Spider Chart Presentation. This template is perfect for comparing key risk factors in a visual, easy-to-understand format. Ideal for project managers, risk analysts, and consultants. Fully customizable and works seamlessly with PowerPoint, Keynote, and Google Slides.


7 slides
International Finance Infographic
International finance is a branch of economics and financial studies that deals with monetary interactions that occur between two or more countries. Dive into the intricate world of finance with our visually captivating international finance infographic. This template is your passport to understanding the complexities and opportunities in the global financial landscape. With this template you will be able to analyze the dynamics of exchange rates, foreign investment, and how these factors influence global economics. This infographic is crafted to provide a holistic view of the world of finance.


5 slides
Fashion Design Infographics
Fashion Design is the art of creating clothing and accessories, incorporating elements of style, aesthetics, and functionality. These infographic templates offer a visually captivating and informative way to present key concepts, trends, and insights in the world of fashion design. This template is ideal for fashion designers, students, industry professionals, or anyone interested in sharing knowledge about fashion design principles, fashion history, or emerging trends. Featuring a stylish design that reflects the creative and dynamic nature of the fashion industry. This allows for easy customization and seamless integration of your fashion-related content.


5 slides
Clean Water Access and Sustainability Goals Presentation
Visually track progress with the Clean Water Access and Sustainability Goals Presentation. This intuitive slide design uses water-filled glasses to represent four stages of development, making it perfect for sustainability metrics, public health initiatives, or project benchmarks. Fully customizable and compatible with PowerPoint, Keynote, Google Slides, and Canva.


5 slides
Employee Training Needs Skills Gap Presentation
Optimize Workforce Training with a Skills Gap Analysis! The Employee Training Needs Skills Gap template helps HR teams, trainers, and managers visualize skill gaps, assess employee competencies, and align training programs with business goals. Featuring an interactive dot matrix layout, this template enables clear comparisons across skill areas, ensuring targeted and efficient upskilling strategies. Fully customizable in PowerPoint, Keynote, and Google Slides, it streamlines workforce development planning for maximum impact and growth.


6 slides
Employee Survey Results Infographic
"Survey results" typically refer to the collected data and findings from a survey conducted to gather information from a specific group of people, often for the purpose of research or decision-making. This infographic template is a visual representation of the data collected from an employee survey. It presents key findings, insights, and trends in a visually engaging format. This allows you to summarize the importance of employee feedback, and the positive impact of improvement efforts. This survey results infographic can be shared within the organization to communicate the survey outcomes to employees, managers, and leadership.


5 slides
Professional Company Overview Slide Presentation
Showcase your business story with confidence using this sleek and structured layout designed for clarity and professionalism. Ideal for introducing teams, services, and company milestones, it helps you communicate key insights effectively. Fully customizable and compatible with PowerPoint, Keynote, and Google Slides for effortless presentation creation and editing.


6 slides
Bubble Mapping Strategy Presentation
Turn your ideas into a clear visual roadmap that captures every connection and concept in one glance. This professional presentation helps organize strategies, goals, and processes through an easy-to-follow bubble map layout. Fully customizable and compatible with PowerPoint, Keynote, and Google Slides for seamless editing and presentation.


10 slides
Workplace Health and Safety Guidelines Presentation
Present your safety protocols with clarity and impact using this circular infographic layout. Ideal for showcasing four key safety principles, this slide design features a central helmet icon surrounded by safety icons, each paired with editable text boxes. Perfect for onboarding, training sessions, or compliance updates. Fully customizable and compatible with PowerPoint, Keynote, and Google Slides.


5 slides
Diversity in Movies Infographics
Diversity In Movies can have a positive impact on society by promoting acceptance of different cultures, and by promoting messages of equality and social justice. This is a visually stunning vertical infographic template that will help you illustrate and communicate important information about diversity in movies. This template includes various design elements such as icons, illustrations, and graphs, all of which can be easily customized to fit your specific needs. With its bold colors and eye-catching design, this template is sure to capture the attention of your audience and make your message stand out.


7 slides
Social Media Management Infographic Presentation
Social media is an important part of any business, which is why you need the right tools to stay organized, save time, and boost your productivity. With the template you can design a fun infographic for your presentations, blog posts and social media posts. This is a great way to present Social Media Management topics including: marketing strategy, content creation, engagement, and growth. This template is compatible with Keynote, PowerPoint and Google Slides, so you can customize it in seconds. Download this template, and show your audience how social media can help their business grow!


5 slides
Business Influence Stakeholder Analysis
Highlight influence and interest with this layered stakeholder analysis pyramid. Designed for strategic presentations, this layout categorizes engagement levels—Pull Communications, Push Communications, Consultant, Participation, and Partnership—across a 3D stacked model. Ideal for stakeholder mapping, influence management, and communication strategy planning. Fully editable in PowerPoint, Keynote, and Google Slides.


6 slides
Social Relationship Infographics
Revitalize your presentations on social dynamics with our Social Relationship infographic, seamlessly compatible with Powerpoint, Keynote, and Google Slides. This infographic is a perfect addition for sociologists, relationship coaches, and educators who aim to discuss the complexities and interconnectedness of social relationships. The infographic offers a visual breakdown of different social relationship types, the dynamics within those relationships, and the factors influencing social interactions. It's designed to help audiences understand the different layers and nuances that make up social connections, whether in personal networks, communities, or professional environments. Incorporating this infographic into your presentations will assist in illustrating how relationships are formed, maintained, and evolved. It serves as an educational tool that can lead to deeper discussions about social bonds, communication patterns, and relationship management. Utilize this infographic to provide a clear and impactful visual representation of the fundamental concepts in social relationship studies.


8 slides
Employee Training and Development Presentation
Optimize your team's growth with the 'Employee Training and Development' presentation template. This layout strategically organizes training modules, showcasing clear pathways for skills enhancement and career progression. Compatible with PowerPoint, Keynote, and Google Slides, it's ideal for delivering engaging and instructional corporate training sessions.


6 slides
Agriculture Jobs Infographic
Agriculture jobs encompass a wide range of career opportunities that involve the cultivation, production, processing, and distribution of crops, livestock, and other agricultural products. This infographic template showcases the diversity of jobs within the agriculture industry, highlighting the roles, required skills, and potential career growth. This infographic can be organized into different categories of agriculture jobs, such as Farming and Crop Production, Livestock Management, Agricultural Engineering, and Agricultural Research. This template is compatible with Powerpoint, Keynote, and Google Slides.


3 slides
Financial Market Performance Overview Presentation
Analyze trends with clarity using the Financial Market Performance Overview presentation template. This layout features a storefront-style visual paired with pie charts and a trend graph, ideal for displaying key financial metrics, market breakdowns, or investment summaries. Perfect for analysts, economists, and finance teams aiming to convey insights with simplicity and style. Fully editable and compatible with PowerPoint, Keynote, and Google Slides.