


Features
- 5 Unique slides
- Fully editable and easy to edit in Microsoft Powerpoint, Keynote and Google Slides
- 16:9 widescreen layout
- Clean and professional designs
- Export to JPG, PDF or send by email


Do you have any questions?
Recommend


7 slides
Business Plan Strategy Infographic
A business plan is a written document that outlines a company's goals and the strategy it will use to achieve those goals. This infographic template is a comprehensive roadmap for how a business intends to operate, grow, and succeed in its market. Compatible with Powerpoint, Keynote, and Google Slides. This template is meticulously designed to help you craft a well-structured business plan, empowering entrepreneurs and professionals to navigate their journey to success. Let this be your compass as you navigate the complexities of entrepreneurship and strive for business excellence!


6 slides
Strategy to Overcome Challenges Presentation
Get ready to chart a winning path with this dynamic visual roadmap! These slides help simplify complex strategies into clear steps to tackle business challenges head-on. Perfect for team alignment, leadership planning, and problem-solving workflows. Fully compatible with PowerPoint, Keynote, and Google Slides for flexible, professional presentations.


7 slides
Agenda and Sections TOC Presentation
Bring your audience in with a dynamic, story-driven overview that makes each section feel intentional and easy to follow. This presentation highlights key agenda points in a clean, structured layout, helping you introduce topics with clarity and flow. Fully compatible with PowerPoint, Keynote, and Google Slides.


5 slides
Cyber Security Risk Management Presentation
Effectively visualize your digital defense strategy with this cyber security-themed presentation layout. Featuring a sleek laptop illustration and circular infographic design, this template helps you outline five critical areas of risk management with matching icons and editable text sections. Ideal for IT teams, consultants, or training sessions. Fully customizable and compatible with PowerPoint, Keynote, and Google Slides.


7 slides
Technology Development Infographic Presentation
Technology has become an integral part of modern society and plays a crucial role in almost every aspect of our lives. This is a high quality, easily editable and fully layered infographic template. It includes many useful elements to add your data such as icons, charts, text boxes, bullet points, and a map to grab your audience’s attention. Showcase how technology has been developed over the years and how it is developing today. You can use this template for your class or for professional presentations. This is a multipurpose template, compatible with PowerPoint, Keynote and Google Slides.


5 slides
Business Project Status Review Presentation
Present your team's progress with clarity using this hexagon-icon based project review layout. Designed for status updates, this slide includes four visually distinct sections with toggle-style indicators for highlighting progress, milestones, or tasks. Ideal for project managers, corporate teams, or consultants. Fully editable in PowerPoint, Keynote, and Google Slides.


6 slides
Money Conversion Infographics
Convert currencies effectively with our Money Conversion infographic template. This template is fully compatible with popular presentation software like PowerPoint, Keynote, and Google Slides, allowing you to easily customize it to illustrate and communicate currency conversion rates and methods. The Money Conversion infographic template offers a visually engaging platform to explain the process of converting one currency to another, including exchange rates, conversion tools, and tips for international travelers or businesses. Whether you're a traveler, finance professional, or anyone dealing with currency exchange, this template provides a user-friendly canvas to create informative presentations and educational materials. Optimize your currency conversion knowledge with this SEO-optimized Money Conversion infographic template, thoughtfully designed for clarity and ease of use. Customize it to showcase currency conversion tools, real-time exchange rate sources, and practical examples, ensuring that your audience gains valuable insights into this important aspect of finance. Start crafting your personalized infographic today to become more proficient in money conversion.


6 slides
Cloud Engineering Infographics
Discover the world of Cloud Engineering with our customizable infographic template. This template is fully compatible with popular presentation software like PowerPoint, Keynote, and Google Slides, allowing you to easily customize it to illustrate and communicate various aspects of cloud engineering. The Cloud Engineering infographic template offers a visually engaging platform to explore and explain the principles, practices, and technologies related to cloud computing and engineering. Whether you're a cloud engineer, IT professional, business leader, or simply interested in cloud technology, this template provides a user-friendly canvas to create informative presentations and educational materials. Deepen your understanding of Cloud Engineering with this SEO-optimized infographic template, thoughtfully designed for clarity and ease of use. Customize it to highlight key concepts, cloud service models, deployment strategies, and the benefits of cloud engineering, ensuring that your audience gains valuable insights into this rapidly evolving field. Start crafting your personalized infographic today to delve into the world of Cloud Engineering.
20 slides
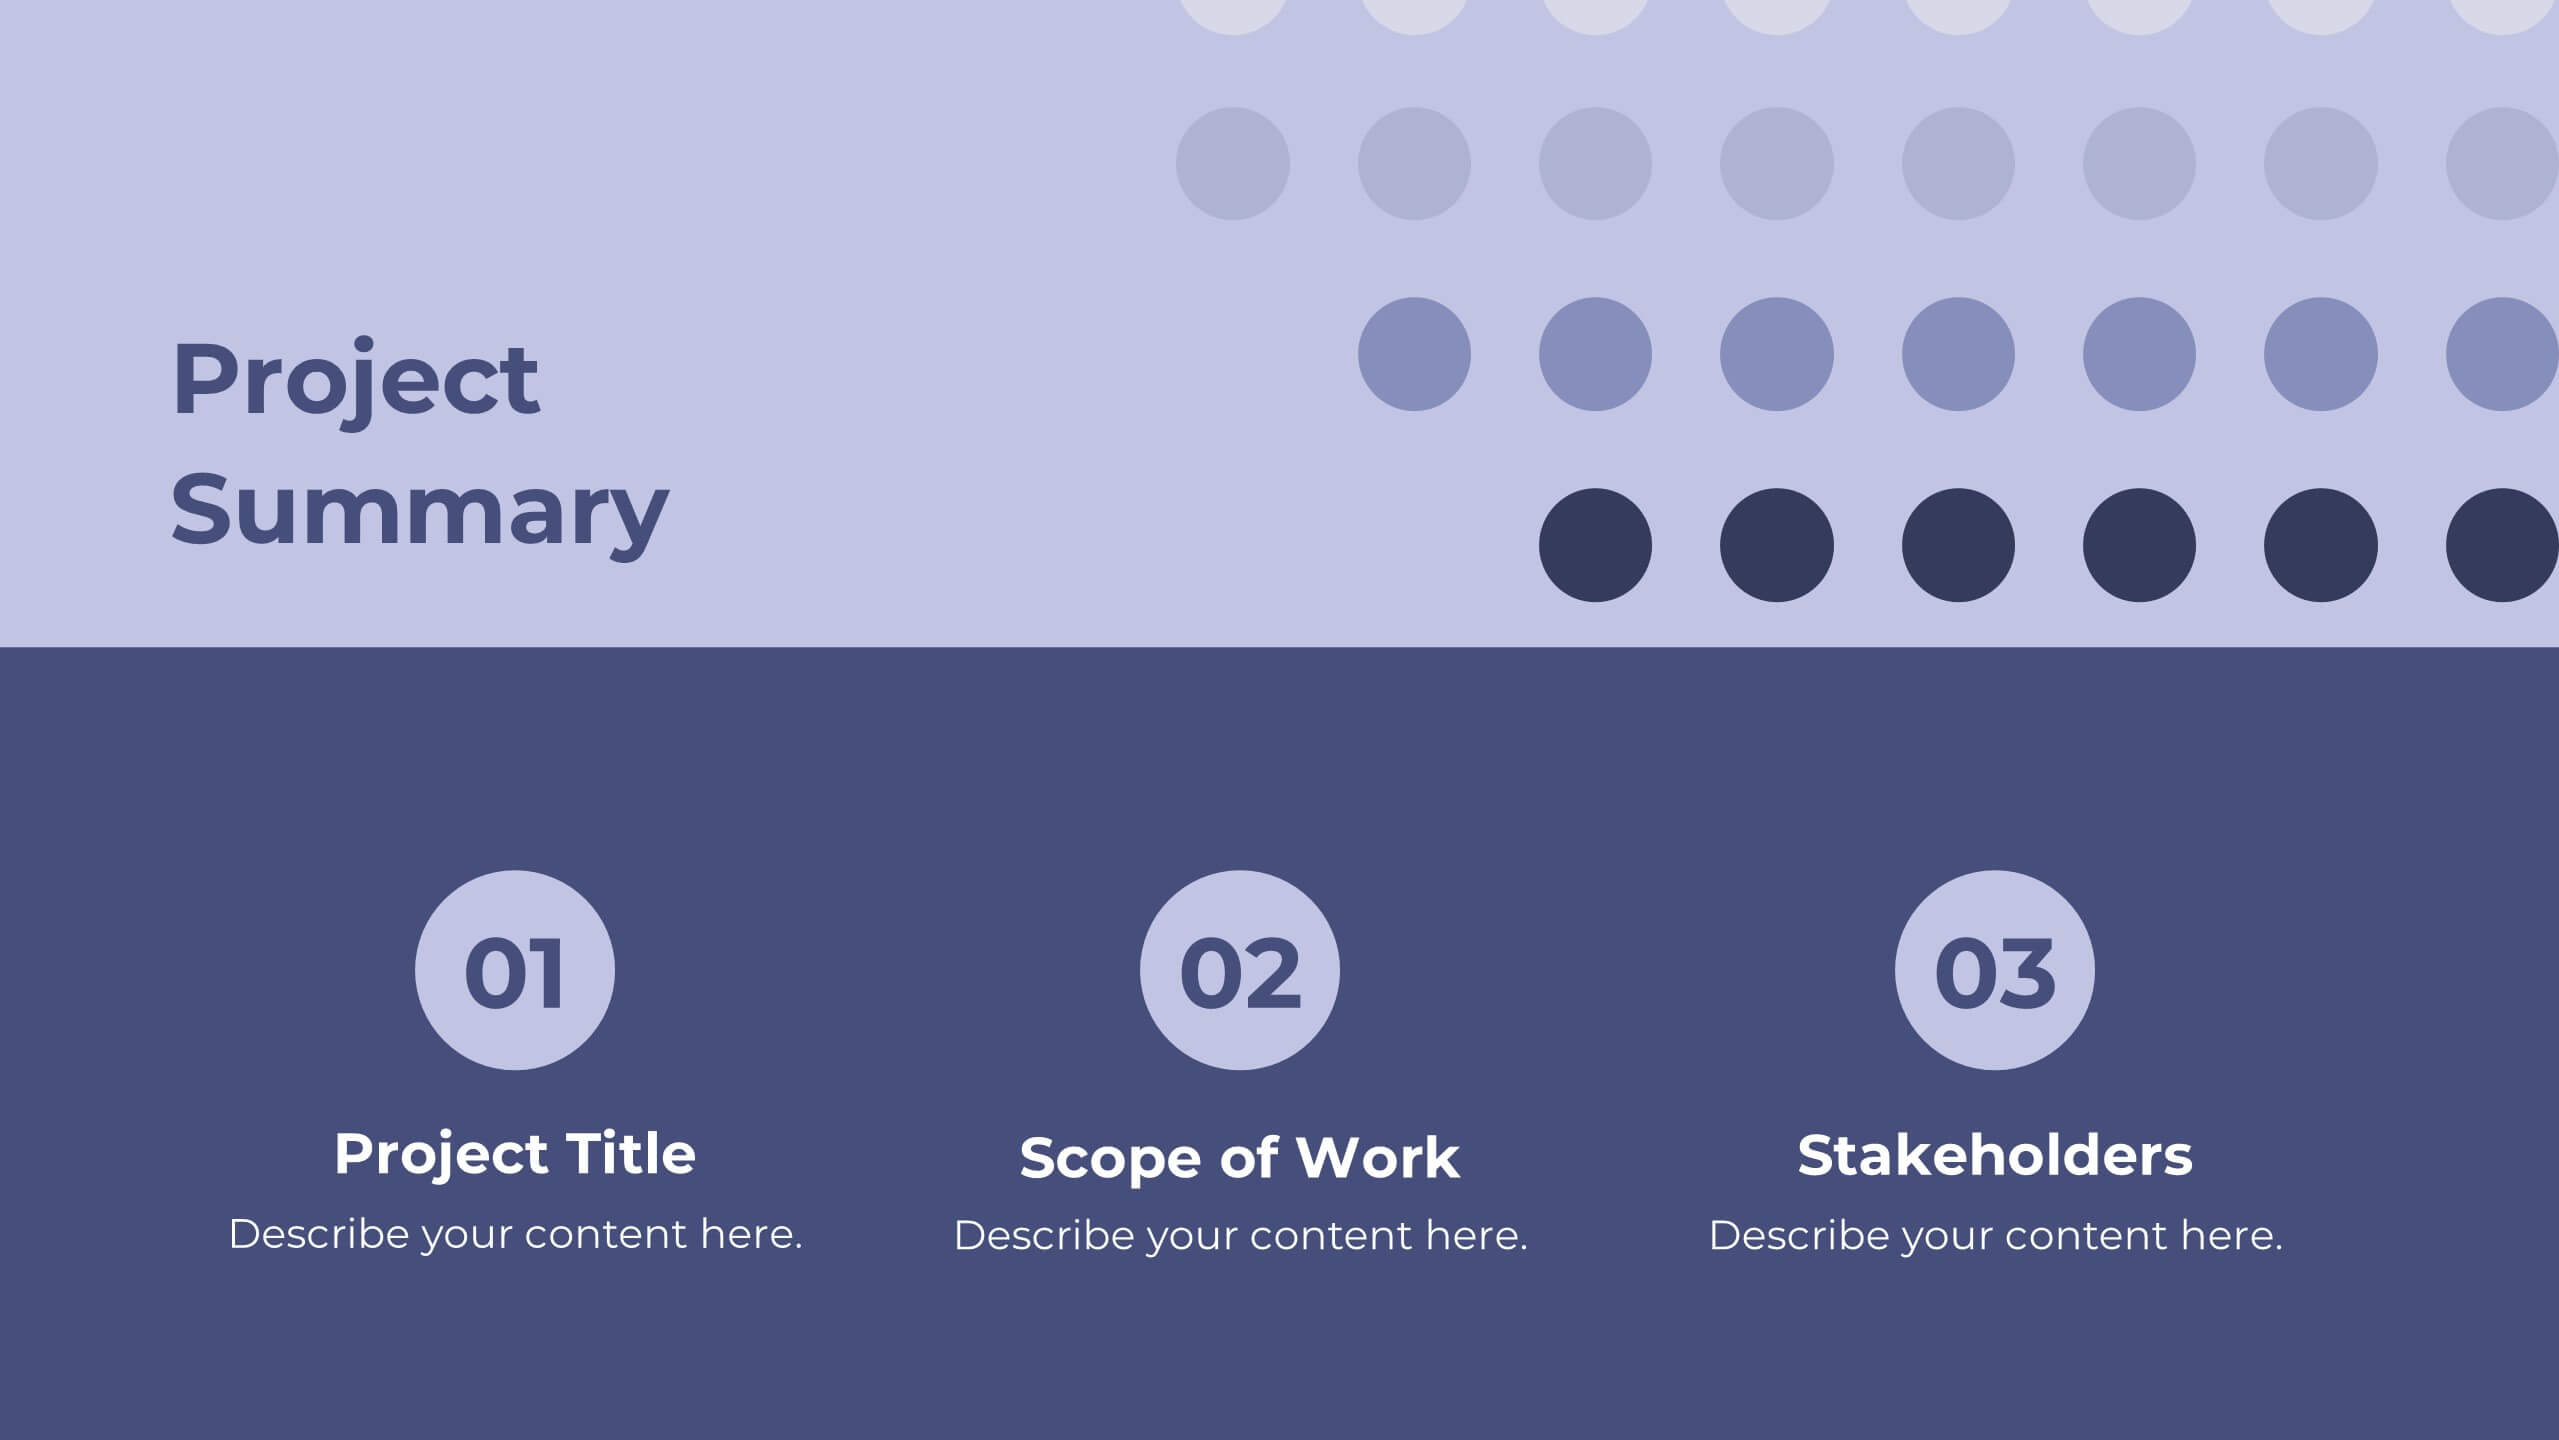
Labyrinth Project Proposal Presentation
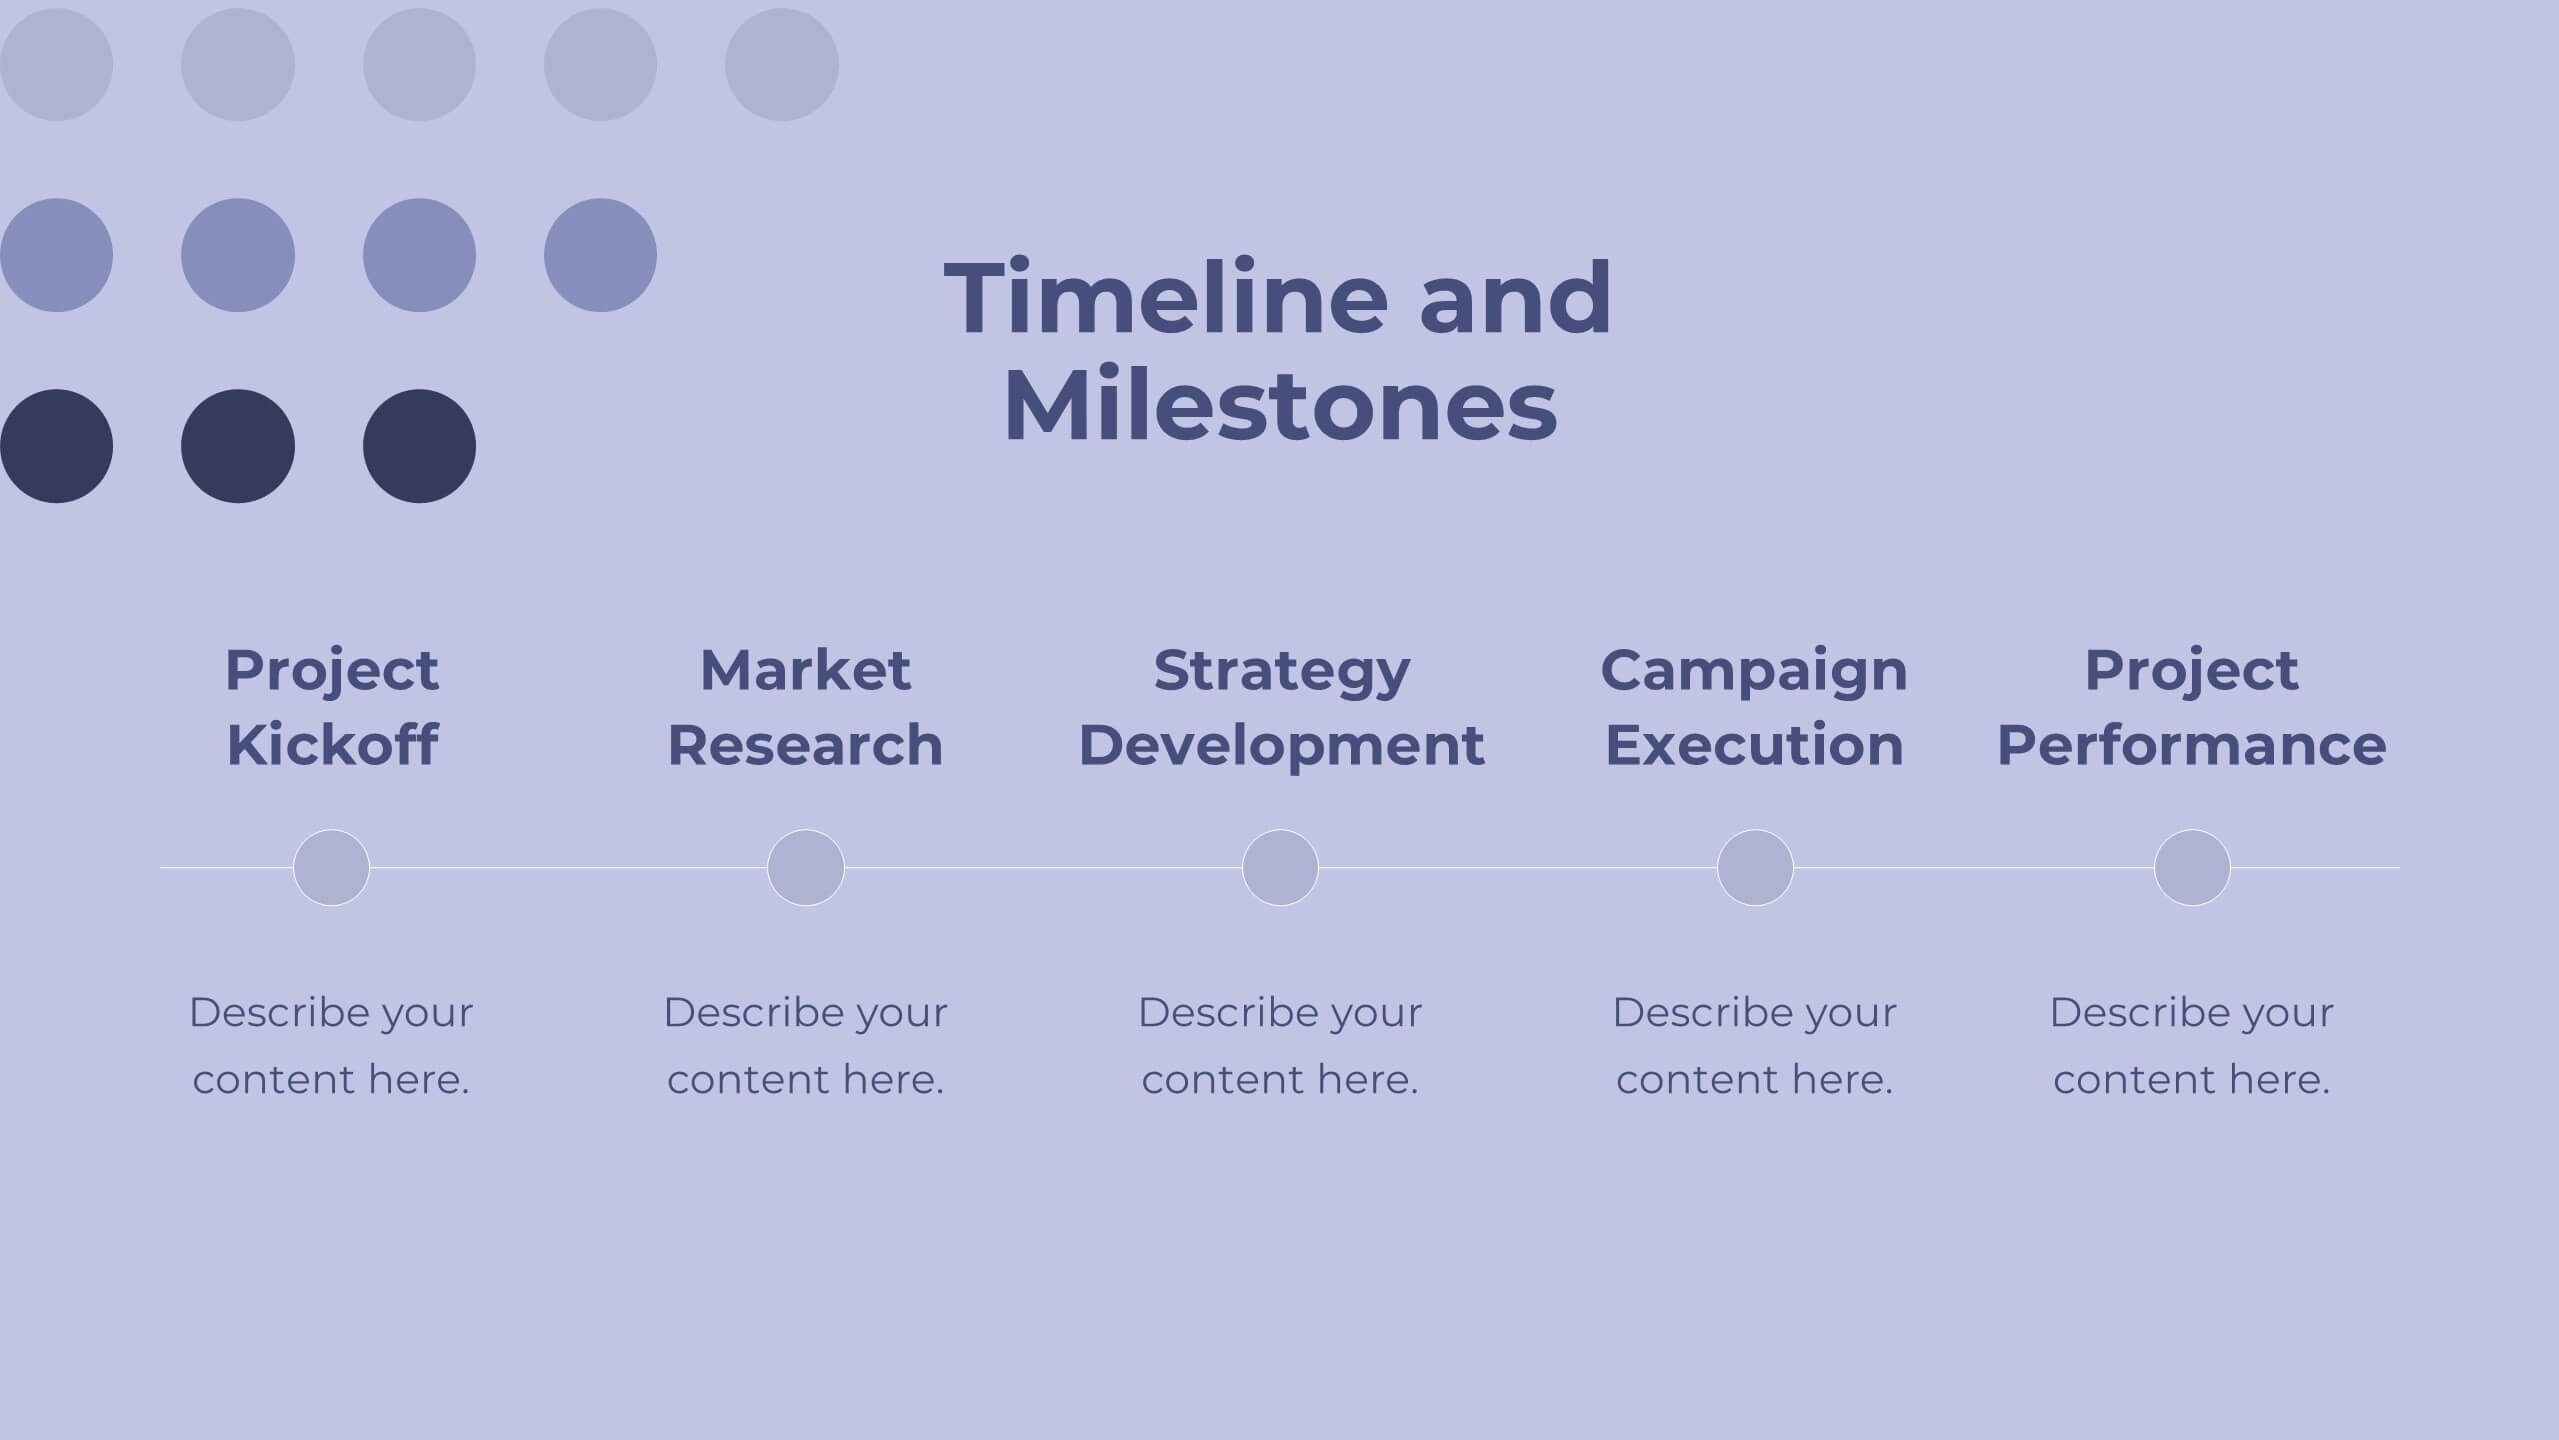
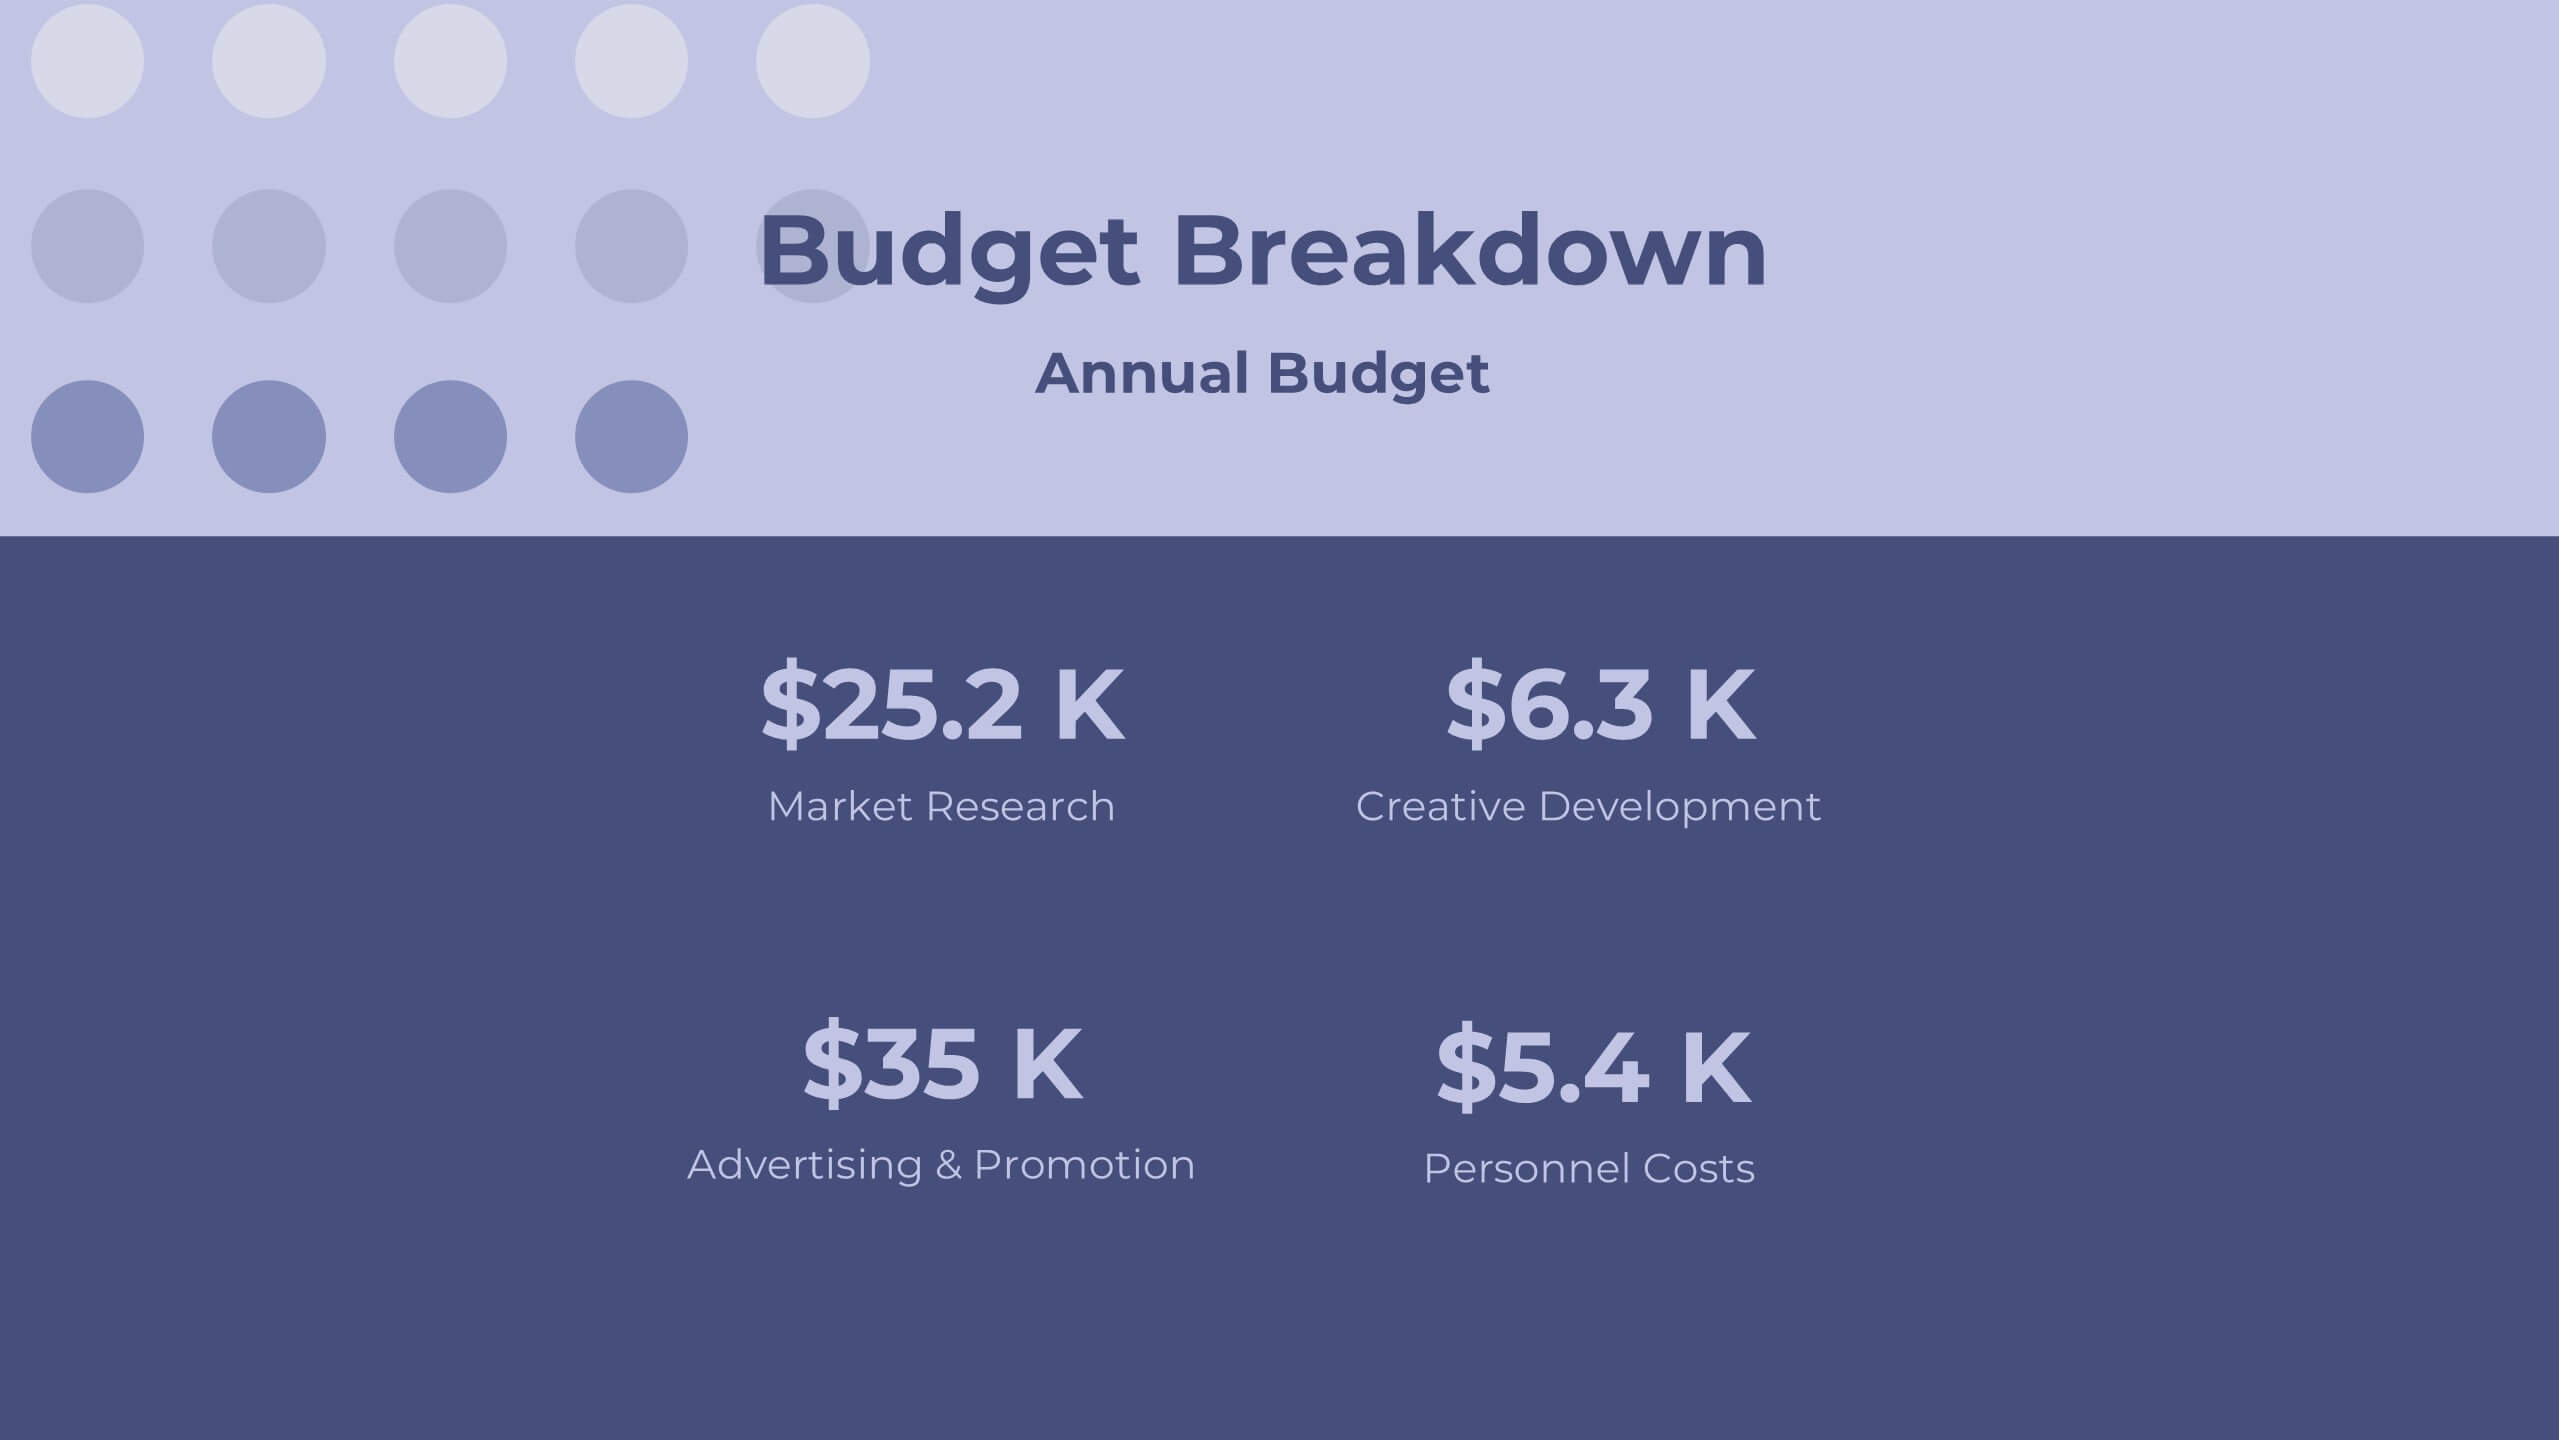
Present your project proposal with this clean and professional template! Covering sections such as objectives, scope of work, timeline, and budget breakdown, it helps you convey your plan clearly and effectively. Fully customizable and compatible with PowerPoint, Keynote, and Google Slides, it’s perfect for delivering impactful proposals to clients.


5 slides
Annual Achievements and Highlights Presentation
Celebrate your progress with the Annual Achievements and Highlights Presentation. This timeline-style layout guides viewers along a visual path of milestones year by year. Each pin represents a key accomplishment, backed by icons and editable text for context. Perfect for end-of-year reviews or company retrospectives. Compatible with PowerPoint, Google Slides, and Canva.


5 slides
Long-Term Strategy Slide Presentation
Ignite big ideas with a bold, forward-moving layout that makes long-range goals feel inspiring and achievable. This presentation helps you outline future plans, key milestones, and strategic priorities with clarity and visual impact. Easy to edit and fully compatible with PowerPoint, Keynote, and Google Slides.


10 slides
Corporate Framework and Structure Presentation
Clearly define your corporate framework and structure with this professional infographic template. Ideal for executives, team leaders, and project managers, this slide visually organizes organizational hierarchy, roles, and key responsibilities in a clean and structured layout. Fully editable in PowerPoint, Keynote, and Google Slides, allowing seamless customization for your company's needs.


6 slides
Numbered Steps Diagram Presentation
Watch your workflow come to life as each step rises in a clean, structured path that makes progress easy to follow. This presentation guides audiences through sequential actions with clarity, helping simplify processes, plans, or instructions. Perfect for business, training, or project teams. Fully compatible with PowerPoint, Keynote, and Google Slides.
8 slides
Directional Arrow Timeline Flow
Highlight key milestones or project phases with this smooth, flowing arrow timeline layout. Designed for project managers, team leads, and strategists to showcase sequential steps, launch plans, or performance stages. Fully customizable in PowerPoint, Keynote, and Google Slides—change icons, colors, and text to match your brand style.


6 slides
Five Key Pillars of Organizational Strength Presentation
Highlight the foundational strengths of your business with the Five Key Pillars of Organizational Strength presentation. This visual framework uses classical column structures to represent five core principles, ideal for showcasing leadership values, corporate strategy, operational focus, or departmental roles. Each pillar is clearly labeled and customizable, making it easy to align with your organization’s unique message. Fully editable in PowerPoint, Keynote, and Google Slides, this template is perfect for board meetings, company culture decks, or executive planning sessions.


7 slides
Circle Planning Infographic
Embark on holistic planning with our circle planning infographic. Encased within a pure white canvas and punctuated with harmonious green, insightful purple, and strategic blue, our template encapsulates the cyclical nature of meticulous planning. Endowed with concise infographics, indicative icons, and adaptable image placeholders, it elucidates the continuity and stages of planning processes. Flawlessly designed for Powerpoint, Keynote, or Google Slides. An irreplaceable tool for project managers, business strategists, educators, or any professional aiming for a rounded approach to planning.


7 slides
Office Scenes Infographic Presentation Template
An Office Scene Infographic is a visualization of the most common types of office spaces, along with their pros and cons. This infographic template is great for a school presentation, office projects, employee onboarding programs, or planning a workplace makeover. Within this infographic, you will be able to display absolutely everything that needs to be shown within a corporate setting. This office scene template is a fully layered and customizable infographic that allows you to create your own design. Use it as an infographic, as a presentation, or even a website/app background.